![Buskers Festival Wien Konzept Programm 2016 2018 · 2019-08-20 · Das Buskers Festival Busker = [‚bʌskǝ] engl. StraßenmusikantIn Beim Buskers Festival verwandeln über 100 Künstlerinnen](https://static.fdocuments.net/doc/165x107/5e88bb390a073754fc3afaf7/buskers-festival-wien-konzept-programm-2016-2018-2019-08-20-das-buskers-festival.jpg)
UK REGIONAL CITIES -...
21
RESEARCH UK REGIONAL CITIES OFFICE MARKET REVIEW 2018
Transcript of UK REGIONAL CITIES -...

RESEARCH
UK REGIONAL CITIESOFFICE MARKET REVIEW 2018
2 3
UK REGIONAL CITIES REVIEW 2018
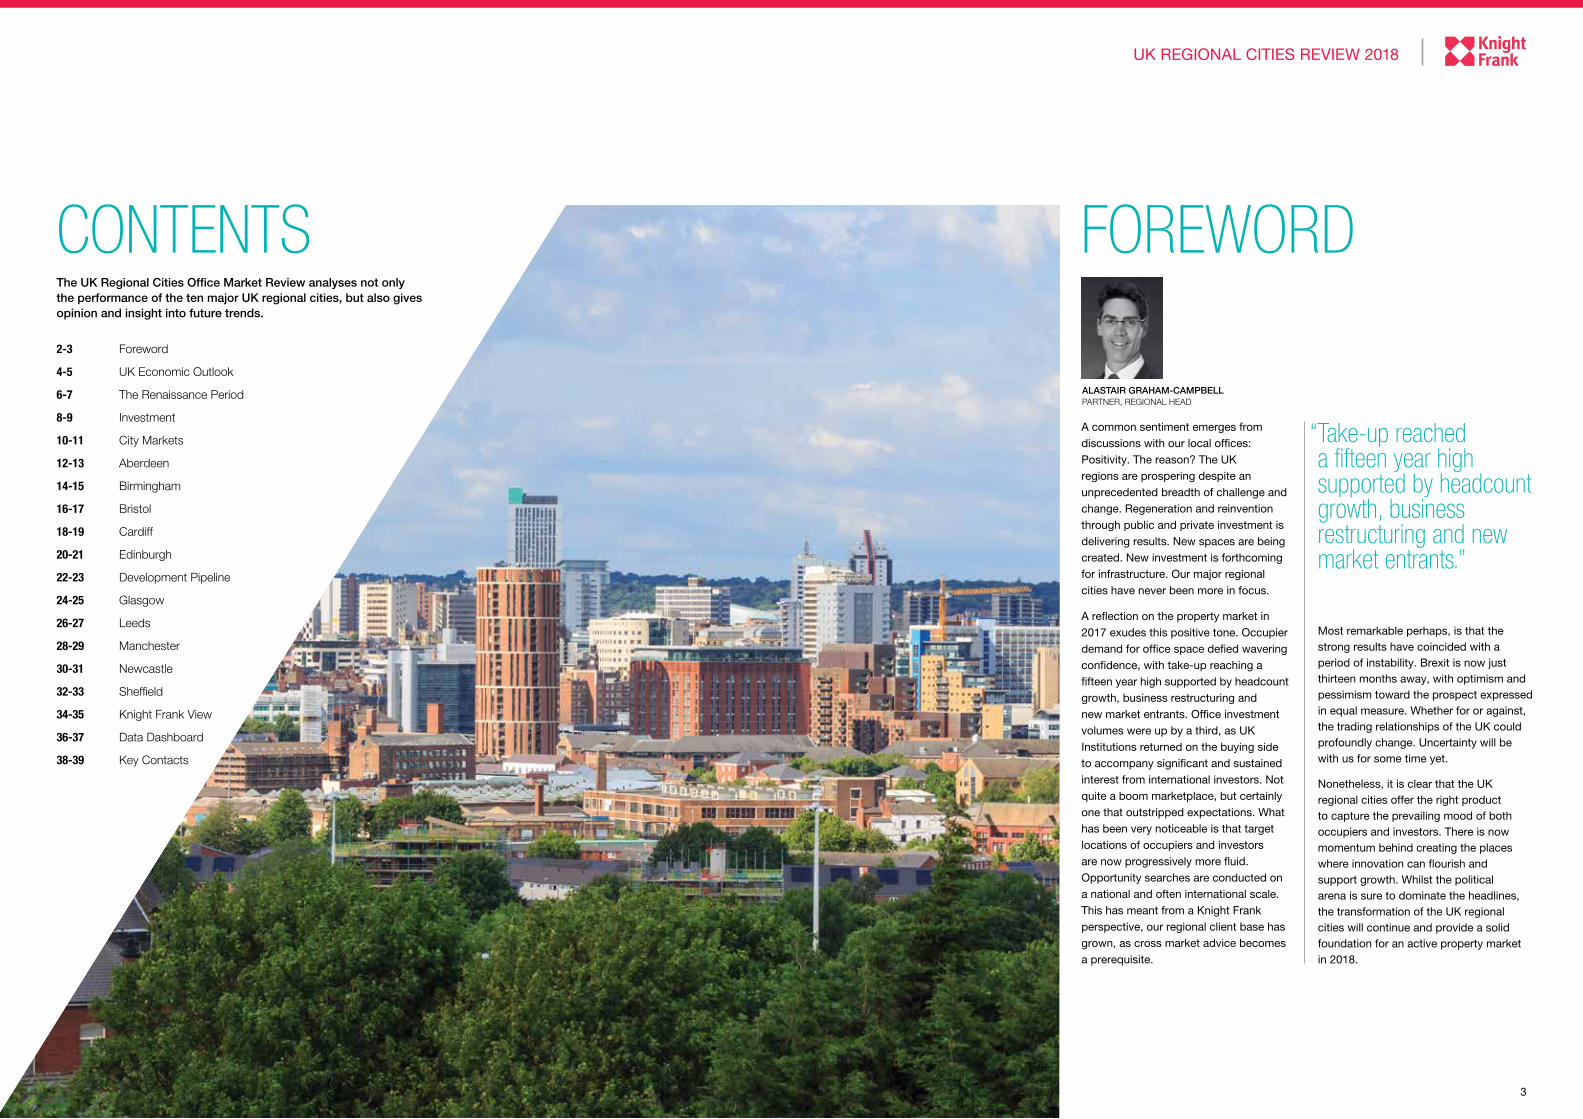
FOREWORD
A common sentiment emerges from discussions with our local offices: Positivity. The reason? The UK regions are prospering despite an unprecedented breadth of challenge and change. Regeneration and reinvention through public and private investment is delivering results. New spaces are being created. New investment is forthcoming for infrastructure. Our major regional cities have never been more in focus.
A reflection on the property market in 2017 exudes this positive tone. Occupier demand for office space defied wavering confidence, with take-up reaching a fifteen year high supported by headcount growth, business restructuring and new market entrants. Office investment volumes were up by a third, as UK Institutions returned on the buying side to accompany significant and sustained interest from international investors. Not quite a boom marketplace, but certainly one that outstripped expectations. What has been very noticeable is that target locations of occupiers and investors are now progressively more fluid. Opportunity searches are conducted on a national and often international scale. This has meant from a Knight Frank perspective, our regional client base has grown, as cross market advice becomes a prerequisite.
Most remarkable perhaps, is that the strong results have coincided with a period of instability. Brexit is now just thirteen months away, with optimism and pessimism toward the prospect expressed in equal measure. Whether for or against, the trading relationships of the UK could profoundly change. Uncertainty will be with us for some time yet.
Nonetheless, it is clear that the UK regional cities offer the right product to capture the prevailing mood of both occupiers and investors. There is now momentum behind creating the places where innovation can flourish and support growth. Whilst the political arena is sure to dominate the headlines, the transformation of the UK regional cities will continue and provide a solid foundation for an active property market in 2018.
“ Take-up reached a fifteen year high supported by headcount growth, business restructuring and new market entrants.”
ALASTAIR GRAHAM-CAMPBELL PARTNER, REGIONAL HEAD
CONTENTSThe UK Regional Cities Office Market Review analyses not only the performance of the ten major UK regional cities, but also gives opinion and insight into future trends.
2-3 Foreword
4-5 UK Economic Outlook
6-7 The Renaissance Period
8-9 Investment
10-11 City Markets
12-13 Aberdeen
14-15 Birmingham
16-17 Bristol
18-19 Cardiff
20-21 Edinburgh
22-23 Development Pipeline
24-25 Glasgow
26-27 Leeds
28-29 Manchester
30-31 Newcastle
32-33 Sheffield
34-35 Knight Frank View
36-37 Data Dashboard
38-39 Key Contacts

4 5
UK REGIONAL CITIES REVIEW 2018
UK ECONOMIC OUTLOOK
The UK economy faces a year of challenges and opportunities in 2018, and while mindful of the former, we should not overlook the latter.
How one views the year ahead comes down to whether you are a ‘glass half full’ or a ‘glass half empty’ person. After all, there is plenty of evidence to support either view. Those who take the half empty view can draw justification from the uncertainty surrounding Brexit, sluggish GDP growth, and the squeeze on consumer incomes. For those who favour half full, there is the robust labour market, the rapid growth of new technology firms, and rising export demand for manufacturers, to provide evidence to support their view.
So who will be proved right: the optimist or the pessimist? We believe that the uncertainty surrounding the economy makes a general rising tide for UK PLC unlikely. Our forecast for 2018 GDP growth is 1.5%, which is less than the 20-year annual average of 2.0%. However, we expect to see pockets of outperformance that property investors can target to achieve better returns. Here are the four sectors of the economy that may deliver strong growth in 2018.
01 ROBOTICS AND ARTIFICIAL INTELLIGENCE (AI) This part of the digital revolution has been a rising tide for some time, but it is about to accelerate in the UK in particular as the result of the move towards Brexit. Firms will no longer be able to rely on labour from the EU, but the tap is being switched off at a time when unemployment is at its lowest level in 42 years. As a result, firms will invest more in automation and AI to fill the gap, creating demand for office space from the technology firms. We see activity weighted towards cities with universities that have strong IT departments.
02 NEW WAVE FINANCE In China, some cities are rapidly turning cashless, as more people pay for goods with their mobile phones. Even the buskers accept electronic payments now. A combination of ubiquitous smart phones, and pressure on regulators to open up the market, means banking in the UK is set for huge disruption. We believe the new wave of fin-tech firms, lacking the historic ties to London, will be more open-minded on where they locate. This could open up a new source of office demand for the regional cities.
03 SHRINKING SUPPLY CHAINSEven prior to the vote for Brexit, there had been a movement towards shorter supply chains, reflecting more customisation in manufacturing and a desire to speed goods to market. With the UK leaving the EU, more firms are looking to buy supplies locally, which could result in new manufacturing firms being established. These will need office space for their HQ and design functions. Also, we see the move towards customisation creating demand for city centre design offices, as manufacturing firms employ more creative workers.
“ We believe that the uncertainty surrounding the economy
makes a general rising tide for UK PLC unlikely.”
04 GREEN INDUSTRIES In 2017, the UK had its first ever day operating the electricity network without coal, drew 52% of its power from low carbon sources during the summer months, and broke records for wind power production, according to National Grid. A recent report from the International Renewable Energy Agency suggested green energy could be cheaper than fossil fuels by 2020. We see green energy firms becoming more important in the economy and office market going forwards.
JAMES ROBERTSChief Economist
WRITTEN BY
04
01 02
03
6 7
UK REGIONAL CITIES REVIEW 2018
THE RENAISSANCE PERIOD
commitment to Birmingham, while cost and efficiency drivers influenced a rethinking of the Government’s estate and with it emerged sizeable deals in a number of regional markets.
The perfect storm was realised through two significant supply side drivers. First, the emergence of a strong pipeline of high quality, amenity rich product located within city centres. There was a clear step change in the physical product found in regional cities. Second, the vibrancy, cohesion and relative affordability of the regional cities increasingly appeals to young professionals. Different lifestyle choices are creating a deepening supply of regional talent that occupiers recognise and buy-into.
So, as we enter into 2018, a key question must be, can the regional renaissance be sustained?
Business confidence, investment and hiring intentions are all positive, relative to their position a year ago, although the twists and turns of Brexit may well bring volatility to these indicators. The potential brake on momentum is actually on the supply side in select cities.
We do not envisage aggregate leasing volumes extending beyond the levels reached in 2017. However, the structural drivers underpinning occupier demand remain firmly in place. The outcome will therefore be strong enquiry and requirement levels, intense competition amongst occupiers to secure preferred options and pent-up demand from those unable or unwilling to compete.
In our view, there will be four key characteristics of occupier demand in the regional markets during 2018:
Occupier activity returned to the UK regions in a major way during 2017, but can the momentum be maintained? Against a backdrop of persistent geo-political uncertainty and slow economic growth rates, occupier activity in the regional markets surprised on the upside. More than 7 million sq ft of office space was let across the ten core markets reviewed in this report. On this basis, the markets were not simply resilient – the aggregate volume was, after all, some 1.3 million sq ft above the ten-year average. Instead, 2017 represented a clear renaissance for occupational markets in the regions.
They were beneficiaries of a perfect storm. Businesses, under huge pressure from digital disruption, brought change to business models which fuelled market demand. Furthermore, the economic backdrop forced many to actively consider and commit to locations that presented a property and operational cost advantage or a cost profile more appropriate to the type of business function being fulfilled. Finally, regulatory and political pressures fuelled significant regional requirements. The ring-fencing of UK retail banking operations has supported increased financial services activity, most notably HSBC’s
01 INCREASED OCCUPIER MOBILITY As supply tightens in some markets, but the need for cost effective business transformation intensifies, we anticipate a broadening of search areas and a growing level of competition between regional centres for this mobile demand. Occupiers will undertake extensive research in relation to market dynamics and options, but also critically in respect of workforce availability and / or the impact of any relocation on core staff.
02 COST SENSITIVITY BUT NOT AT THE EXPENSE OF WORKPLACE QUALITY OR EXPERIENCE Given prevailing economic conditions cost sensitivity will be high, but occupiers increasingly accept that low cost, low quality real estate options are actually a false economy as they create expensive staff churn. It is on average ten times more expensive to replace a staff member in the regions than it is to accommodate them. Real estate costs will be scrutinised but not at the expense of creating a workplace that supports staff recruitment, retention and their workplace experience.
03 FURTHER DISRUPTION FUELLING DEMAND A new wave of technology – automation, AI, and robotics, will create opportunities to enhance business efficiency and productivity.Back and middle office functions will be reshaped and talent requirements will shift away from clerical and processing skills and towards technical and creative skills. As businesses make plans for this next cycle of disruption, new demand will be generated.
04 INCREASED DEMAND FOR SERVICE 2018 will be the year in which the co-working revolution hits the UK regions. There will be a multiplication of co-working providers ranging from new challengers, established operations and also traditional supply side players responding to the challenge with their own offer. There will also be greater demand from corporates seeking larger scale solutions. The key point, however, is that co-working brings a new approach to customer service within the industry. Highly serviced, scalable environments that give the occupier a turn-key solution with no hidden costs will be in great demand.
“ Business confidence, investment and hiring intentions are all positive, relative to their position a year ago, although the twists and turns of Brexit may well bring volatility to these indicators.”
55 COLMORE ROW
DR. LEE ELLIOTTPartner, Head of Commercial Research
WRITTEN BY
8 9
UK REGIONAL CITIES REVIEW 2018
4%
others 13%
15%
27%
41%
ISource of capital (£ millions)
Destination of capital
SOUTHERNAND EASTERN
NORTHERN AND SCOTLAND
MIDLAND AND WALES
OCCUPIERS £0.7BN
OTHERS £0.6BN
PRIVATE INVESTORS £0.3BN
UK INSTITUTIONS £1.7BN
OVERSEAS INVESTORS £3.1BN
PRIVATE PROPERTY CO £1.1BN
QUOTED PROPERTY CO £0.2BN
MARKET OVERVIEWOffice investment outside of London reached £7.7bn in 2017, 30% more than in 2016, in a clear sign that the slowdown in office investment beyond the M25 has begun to reverse. Indeed, the pace of activity is increasing. After a relatively slow start, investment in the second half of the year was over twice as high as in the first, and the sense of momentum was heightened as a number of
strong competition from investors, but this in turn will begin to erode the differential.
Ultimately, cautious optimism on occupation markets, combined with robust investor demand is supporting return expectations. Performance data from IPD shows that while capital growth in regional markets typically lagged the London market in 2017, values have been steadily improving. This, combined with a stronger income return than for London offices, has meant that total returns in regional office markets have in many cases been higher than for London.
OUTLOOKThe latest IPF consensus report shows the range of forecasts for UK office returns in 2018 is wider than for any of the other major property sectors, highlighting the degree of uncertainty about the outlook. However, recognising that 2018 is likely to see performance moderate across all sectors, we nevertheless see plenty of reasons to expect a buoyant regional office market in 2018, not least due to the variety of capital sources active in the UK.
Having initially been less active buyers post-referendum, institutional funds
INVE
STM
ENT
significant transactions were announced (but not completed) in the final months of the year.
Overseas investors accounted for around 40% of purchases during 2017, with domestic institutions making up a further 22% – shares that on the face of it have changed little in previous years. Yet the most recent quarterly statistics show a clear rise in the share of both of these two purchaser types, to the extent that they jointly accounted for well over 60% of purchases by volume in the last two quarters of 2017. Meanwhile, private investors eased back.
So what has been driving the interest in regional markets? On the occupier demand side, there is no doubt that the fundamentals have been improving across a number of fronts. 2017 saw jobs growth across most of the UK’s regions, boosted by high-profile private and
have been increasing their share of
regional offices purchases, and are under
significant pressure to deploy further
capital. London and parts of the south
east markets remain too competitive
and/or expensive for some such funds,
meaning prime offices in regional
locations will be an attractive alternative –
as long as the stock can be found. As the
UK faces a period of moderating growth
and uncertain politics, prime assets with
attractive income profiles could prove
scarce, due to the difficulty that owners
will face in recycling capital effectively.
Some will calculate that only premium
pricing will compensate for the challenge
of reinvesting, and absent this, will prefer
to hold. As a result, demand for good
quality secondary assets may pick up.
Overseas investment rose up in the last
quarter of 2017 and we expect further
interest in 2018. One reason is that the
weight of capital targeting prime offices
in European cities has driven yields to
unprecedented lows, and has left many
UK office markets looking comparatively
better value. We expect this will cause
some European investors to reappraise
the UK, adding to the overseas demand
already active in regional UK cities.
Figure 1 Office investment transactions by sizeband
Source: Knight Frank/Property Data
Source: Knight Frank/Property Data Note: Totals reflect office investment outside of Greater London in 2017
Figure 2 UK regional investment by capital source
Under£10m£1.1bn(278deals)
£10m-£25m£1.3bn(81 deals)
£25m-£50m£1.5bn(43 deals)
£50m-£75m£0.9bn(15 deals)
£75m-£100m£0.4bn(4 deals)
£100m+
£2.5bn(13 deals)
public sector relocations of office staff to regional cities. Meanwhile, on the supply side, the delivery of new office space has remained relatively subdued, exacerbating the shortages of modern office stock in many of the largest cities, and leading to stronger prospects for rental growth.
The ever-present hunt for yield has clearly also been supportive of investor interest. Making the inevitable comparison to London pricing, both overseas and domestic investors alike have benefited from higher yields when purchasing offices in the UK’s regional cities, even when the assets and covenants have been of similar quality. But while prime office yields in London remained unchanged throughout 2017, recently announced deals suggest that for regional cities, yields are still under downward pressure for the best stock. The regional cities’ yield advantage over London remains sufficient to generate
122 WATERLOO STREET
WILLIAM MATTHEWSPartner, Capital Markets Research
WRITTEN BY

10 11
UK REGIONAL CITIES REVIEW 2018UK REGIONAL CITIES REVIEW 2018
CITYM
ARKE
TS
12 13
UK REGIONAL CITIES REVIEW 2018
ABERDEEN
UK REGIONAL CITIES REVIEW 2018
OCCUPIER MARKETWith the worst of the oil & gas downturn now past and most rationalisation programs seemingly complete, occupier activity showed steady improvement in 2017. Office take-up reached 468,250 sq ft by year end, a total that, although 18% below the 10-year annual average, reflects a 68% increase when compared to 2016.
Supporting the rise was 138,500 sq ft lease taken by Total E&P UK at West Campus, Westhill. Although agreement was reached in March 2017, the energy firm moved into the property in Q4 2017 following refurbishment of the building. With a long term tenant secured, landlord M&G have since sold the freehold on the campus to Gulf Islamic Investments.
The Total UK deal was one of three transactions to complete over 30,000 sq ft in 2017.
The second largest letting saw Somebody Cares extend their presence in Aberdeen. The charity agreed terms on a new 51,150 sq ft lease at John Wood House. This follows a 36,200 sq ft letting at Trafalgar House in 2016, which was the largest single transaction of that year.
INVESTMENT MARKETFollowing a subdued market in 2016, the impasse between buyer and seller expectations finally began to soften in 2017. Office investment volumes for the year fell just short of the £100m mark at £98.8m, this being the highest total achieved since 2014. The offer of favourable pricing when compared to regional competitors in addition to signs of an improving occupier market, is beginning to fuel renewed interest.
The sale of a 102,000 sq ft, newly completed office at Prime Four Business Park to LCN Partners was the largest of five transactions to complete during the year. The asset sold for £41.3m, a price which reflected a net initial yield of 6.8%. Lloyds Register have a 15 year lease on the building.
In December, Gulf Islamic Investments purchased the freehold interest of West Campus, Westhill Business Park from M&G Real Estate Ltd for £39.4m. The campus comprises of three properties, with Total E&P UK the major tenant. The purchase price reflected a net initial yield of 7.87%.
In May, Chrysaor Holdings Limited (Chrysaor), took 47,700 sq ft at The Capitol on Union Street to establish a North Sea Operations HQ. Since opening in 2016, the £30m redevelopment of a former cinema has now leased 85% of available space. Other tenants in the building include Price Waterhouse Coopers (PWC) and Dentons UKMEA LLP.
A combination of development completions and ‘grey space’ coming back to market meant a further rise in vacancy was recorded in 2017. Grade A availability increased to 753,800 sq ft during the year, a total twice that of the long-term average. This is the highest level on record for the city. This total however, should represent the peak in vacancy. The development pipeline consists of proposed schemes only, none of which are likely to begin works unless a pre-let is secured or a sustained market recovery is recognised.
In 2017, prime headline rents held firm at £32.00 per sq ft, albeit occupier incentives remain particularly attractive. Rental values are expected to come under pressure in 2018 driven by a continued market imbalance.
FCFM Group Ltd (FCFM) acquired two
properties in Aberdeen during the year.
The first was Quattro House, bought for
£7.7m. The property is let to Petrofac
Facilities Management until 2024.
Following this, FCFM acquired Trafalgar
House for £4m. The other deal to
complete was the acquisition of Ensco
House by a private investor for £6.5m
reflecting a yield of 7.34%.
Similar to 2016, domestic money
accounted for the highest percentage
of investment turnover, 54%. Given the
low number of transactions however,
the skew toward UK investors isn’t
truly reflective of the market, with
international buyer activity increasing.
Prime office yields remained at 6.50% in
2017, meaning prime assets in Aberdeen
still offer a considerable discount when
compared to other regional centres.
Notably, at this level, yields are 100
basis points above the market peak of
5.50% recorded in 2007. Despite some
improvement to sentiment, pricing is
expected to remain stable in the coming
12 months.
£99m / +419%
54%
6.50%
6.50%
% OF DOMESTIC INVESTORS
PRIME YIELD 2017
££32.00 per sq ft
(2016-2017) 0%
£30.00 per sq ft(2017-2018) -6%
PRIME RENT 2017
468,250 sq ftY-on-Y change +68%
753,800 sq ftY-on-Y change +18%
TAKE-UP 2017
GRADE A SUPPLY
PRIME RENT 2018 (FORECAST)
PRIME YIELD 2018 (FORECAST)
INVESTMENT VOLUMES 2017
14 15
UK REGIONAL CITIES REVIEW 2018
BIRMINGHAM
UK REGIONAL CITIES REVIEW 2018
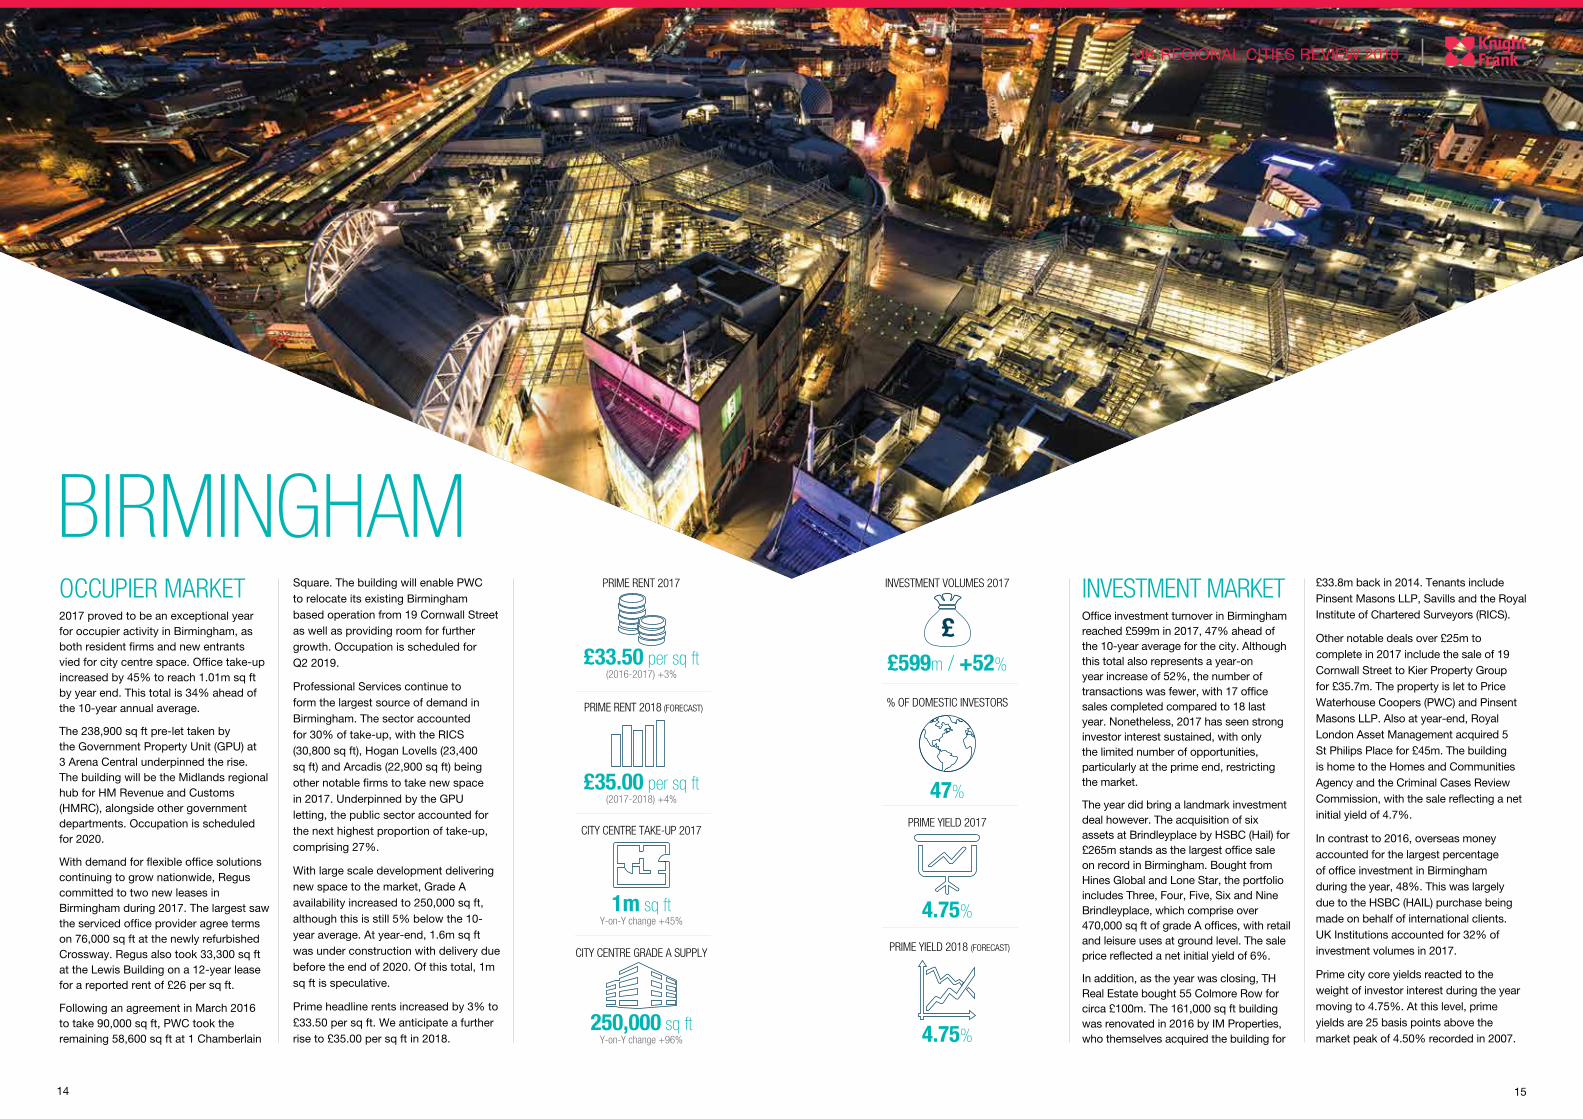
OCCUPIER MARKET2017 proved to be an exceptional year for occupier activity in Birmingham, as both resident firms and new entrants vied for city centre space. Office take-up increased by 45% to reach 1.01m sq ft by year end. This total is 34% ahead of the 10-year annual average.
The 238,900 sq ft pre-let taken by the Government Property Unit (GPU) at 3 Arena Central underpinned the rise. The building will be the Midlands regional hub for HM Revenue and Customs (HMRC), alongside other government departments. Occupation is scheduled for 2020.
With demand for flexible office solutions continuing to grow nationwide, Regus committed to two new leases in Birmingham during 2017. The largest saw the serviced office provider agree terms on 76,000 sq ft at the newly refurbished Crossway. Regus also took 33,300 sq ft at the Lewis Building on a 12-year lease for a reported rent of £26 per sq ft.
Following an agreement in March 2016 to take 90,000 sq ft, PWC took the remaining 58,600 sq ft at 1 Chamberlain
INVESTMENT MARKETOffice investment turnover in Birmingham reached £599m in 2017, 47% ahead of the 10-year average for the city. Although this total also represents a year-on year increase of 52%, the number of transactions was fewer, with 17 office sales completed compared to 18 last year. Nonetheless, 2017 has seen strong investor interest sustained, with only the limited number of opportunities, particularly at the prime end, restricting the market.
The year did bring a landmark investment deal however. The acquisition of six assets at Brindleyplace by HSBC (Hail) for £265m stands as the largest office sale on record in Birmingham. Bought from Hines Global and Lone Star, the portfolio includes Three, Four, Five, Six and Nine Brindleyplace, which comprise over 470,000 sq ft of grade A offices, with retail and leisure uses at ground level. The sale price reflected a net initial yield of 6%.
In addition, as the year was closing, TH Real Estate bought 55 Colmore Row for circa £100m. The 161,000 sq ft building was renovated in 2016 by IM Properties, who themselves acquired the building for
Square. The building will enable PWC to relocate its existing Birmingham based operation from 19 Cornwall Street as well as providing room for further growth. Occupation is scheduled for Q2 2019.
Professional Services continue to form the largest source of demand in Birmingham. The sector accounted for 30% of take-up, with the RICS (30,800 sq ft), Hogan Lovells (23,400 sq ft) and Arcadis (22,900 sq ft) being other notable firms to take new space in 2017. Underpinned by the GPU letting, the public sector accounted for the next highest proportion of take-up, comprising 27%.
With large scale development delivering new space to the market, Grade A availability increased to 250,000 sq ft, although this is still 5% below the 10-year average. At year-end, 1.6m sq ft was under construction with delivery due before the end of 2020. Of this total, 1m sq ft is speculative.
Prime headline rents increased by 3% to £33.50 per sq ft. We anticipate a further rise to £35.00 per sq ft in 2018.
£33.8m back in 2014. Tenants include Pinsent Masons LLP, Savills and the Royal Institute of Chartered Surveyors (RICS).
Other notable deals over £25m to complete in 2017 include the sale of 19 Cornwall Street to Kier Property Group for £35.7m. The property is let to Price Waterhouse Coopers (PWC) and Pinsent Masons LLP. Also at year-end, Royal London Asset Management acquired 5 St Philips Place for £45m. The building is home to the Homes and Communities Agency and the Criminal Cases Review Commission, with the sale reflecting a net initial yield of 4.7%.
In contrast to 2016, overseas money accounted for the largest percentage of office investment in Birmingham during the year, 48%. This was largely due to the HSBC (HAIL) purchase being made on behalf of international clients. UK Institutions accounted for 32% of investment volumes in 2017.
Prime city core yields reacted to the weight of investor interest during the year moving to 4.75%. At this level, prime yields are 25 basis points above the market peak of 4.50% recorded in 2007.
£599m / +52%
47%
4.75%
4.75%
% OF DOMESTIC INVESTORS
PRIME YIELD 2017
££33.50 per sq ft
(2016-2017) +3%
£35.00 per sq ft(2017-2018) +4%
1m sq ftY-on-Y change +45%
250,000 sq ftY-on-Y change +96%
CITY CENTRE TAKE-UP 2017
CITY CENTRE GRADE A SUPPLY
PRIME RENT 2018 (FORECAST)
PRIME RENT 2017
PRIME YIELD 2018 (FORECAST)
INVESTMENT VOLUMES 2017

16 17
UK REGIONAL CITIES REVIEW 2018
BRISTOL
UK REGIONAL CITIES REVIEW 2018
£396m / +13%
59%
5.00%
4.85%
% OF DOMESTIC INVESTORS
PRIME YIELD 2017
PRIME YIELD 2018 (FORECAST)
INVESTMENT VOLUMES 2017
£
OCCUPIER MARKETThe ongoing supply shortage in Bristol served as a restraining factor for leasing activity in 2017. Nevertheless, overall take-up reached 614,000 sq ft, 12% above the 10-year average for the city and the third highest annual total of the past decade.
The growth of Bristol’s profile as a UK technology hub was a significant feature of the market in 2017. Dyson Technology Ltd’s leasing of 28,700 sq ft at Cathedral Square was most notable, with a record rent of £32.50 per sq ft agreed. The building had been the subject of a £7 million refurbishment in 2017. This deal was one of 38 transactions to TMT occupiers during the year, including local firm AMI agreeing terms on 12,000 sq ft at One Brunswick Square and Xmos taking 7,200 sq ft in Queens Quay. Overall the Technology Media and Telecoms sector accounted for a third of take-up.
Following the 107,000 sq ft lease to HMRC in 2016, the public sector remained a strong source of demand. The University of Bristol was responsible for three new transactions, acquiring the freehold of
INVESTMENT MARKETOffice investment volumes in Bristol reached the highest level since 2006, with £396m of assets sold during the year. This total reflects a 13% increase when compared to 2016 and is 77% above the 10-year annual average. Interestingly, the rate of sales increased sharply following the UK General Election in June, with 75% of transactions completing in the second half of the year.
Supporting the increase in activity was the sale of 10 Canons Way to a South Korean investor advised by Knight Frank Investment Management (KFIM). The sale price was £95.5m which reflected a net initial yield of 5%. The 177,000 sq ft property is entirely let to Scottish Widows Limited until November 2032.
The £33.5m sale of a long lease interest at One Cathedral Square to F&C Commercial Property Trust was one of four other transactions to complete above £25m. Notably, the 2017 total of five is the highest number of sales above this threshold since 2011. One Cathedral Square is fully let to the University of
Augustine’s Courtyard (31,800 sq ft) in Q1, leasing 10,000 sq ft at 1-5 Whiteladies Road in Q2 and taking a 27,300 sq ft lease in 1 Cathedral Square in Q4. Not for profit organisation Eduserv also acquired the 16,000 sq ft Gyldan House, a purchase that will enable an operational move from Bath.
Professional Services however, continue to be the mainstay of activity in Bristol. The pre-lettings of 13,000 sq ft to intellectual property specialists, Mewburn Ellis, and of 27,000 sq ft to law firm, Simmons and Simmons, within Aurora at Finzels Reach proved to be the flagship deals of the year. In all, the sector accounted for 24% of take-up.
At year end, just 3,272 sq ft of new Grade A space was available for lease. Good quality secondhand space has also been in decline, with just 122,053 sq ft available at year end. In the next 12 months, the development pipeline is scheduled to deliver just 55,000 sq ft of new space together with 109,000 sq ft of comprehensively refurbished space. It is widely anticipated that these totals will reduce before practical completion.
Bristol and Dyson Technology Ltd, with
Dyson Technology Ltd having agreed a
record rent of £32.50 per sq ft.
In July, M&G Real Estate acquired
the 62,000 sq ft, 66 Queen Square for
£30.5m. The property is let to KPMG
and Handelsbanken. M&G Real Estate
also acquired 1 Georges Square in July
for £26m. The property is let to Clarke
Willmott with 5.75 years unexpired. The
other deal to complete above £25m was
the acquisition of 100 Bristol Business
Park by Lime Property Fund (Aviva) for
£30.06m reflecting a yield of 5.25%.
Similar to 2016, domestic investors
accounted for 59% of investment in
2017, albeit overseas money would
have contributed to funding in some
deals. Direct international investment
increased, with overseas buyers
accounting for 29% of volumes in 2017
up from 17% last year.
The sale of several prime assets has
evidenced a shift in yields in 2017.
Prime office yields have moved in by
25bps in 2017, finishing the year in the
region of 5.00%.
£32.50 per sq ft(2016-2017) +14%
£35.00 per sq ft(2017-2018) +8%
PRIME RENT 2017
PRIME RENT 2018 (FORECAST)
614,000 sq ftY-on-Y change -22%
3,272 sq ftY-on-Y change -94%
CITY CENTRE TAKE-UP 2017
NEW GRADE A SUPPLY

18 19
UK REGIONAL CITIES REVIEW 2018
CARDIFF
UK REGIONAL CITIES REVIEW 2018
£25.00 per sq ft
£25.00 per sq ft
703,900 sq ftY-on-Y change +3%
114,200 sq ftY-on-Y change -38%
TAKE-UP 2017
GRADE A SUPPLY
OCCUPIER MARKETIn a year punctuated by major political events, occupier demand for office space in Cardiff proved encouragingly resilient. Take-up reached 703,900 sq ft by year end, this total being 38% above the 10-year average and the highest total on record.
The 269,200 sq ft pre-let of 6 Central Square to the Government Property Unit (GPU) was the largest transaction of 2017 and the largest on record for Wales. The GPU took a 20-year lease at the Rightacres and Legal & General scheme which will, once completed, be a new headquarters for HMRC. Occupation is expected in 2020.
Unsurprisingly, the public sector accounted for 56% of total space leased. Aside from the GPU pre-let, Cardiff University also took space at the Central Square regeneration scheme. The University took a 44,500 sq ft, 20-year lease to accommodate plans to move the School for Journalism, Media and Cultural Studies to 2 Central Square in September 2018. In addition, Cardiff and Vale College leased 54,000 sq ft at One
INVESTMENT MARKET2017 proved to be the strongest year on record in terms of investment activity in Cardiff, with investment volumes reaching £289m by year end. This total not only reflects close to a threefold increase when compared to 2016, but is also 160% ahead of the 10-year average for the city. A total of 12 deals were completed during the year, with significantly, three exceeding £50m.
The largest investment transaction followed the announcement that the UK Government had agreed a pre-let at 6 Central Square. Legal & General is forward funding the development with the purchase price of £117.2m representing the largest single asset investment deal in Wales on record. Rightacres Property in partnership with L&G and Cardiff Council are developing the site, with completion scheduled for late 2019.
The 12 acre mixed use Central Square development was also the subject of the two other £50m plus transactions. In Q3, Aerium Finance Ltd acquired One Central Square for £51m reflecting a yield
Canal Parade, meaning the Public Sector accounted for the three largest deals of 2017 in Cardiff.
In terms of deal numbers however, Technology, Media and Telecoms occupiers continue to grow a presence in Cardiff. The sector represents 18% of the total deal count in 2017, albeit the average lease taken by this type of occupier was less than 3,000 sq ft.
Grade A availability was 114,200 sq ft at the close of 2017, reflecting a 38% reduction since the turn of the year. Looking ahead, the development pipeline remains strong with 733,200 sq ft recorded as under construction at year-end. The majority of this new space has already been leased however, with only 168,200 sq ft still available split across JR Smarts Number 3 & 4 Capital Quarter. Practical completion at Number 3 is expected by Q2 2018 with Number 4 due to complete in Q4 2018. Further ahead, JR Smarts, John Street development at Callaghan Square has been submitted for planning approval. The scheme includes two buildings that will provide a combined total of 300,000 sq ft.
of 5.5%. The 134,950 sq ft asset is let to six tenants, including Blake Morgan LLP, Julian Hodge Bank and MotoNovo Finance. Following this, Credit Suisse bought Two Central Square for £56.5m reflecting an initial yield of 6.25%. Due to complete in Q3 2018, the 148,000 sq ft building is already fully let to Hugh James Solicitors and Cardiff University.
Supported by the L&G deal, UK investors accounted for 62% of turnover during the year up from 21% in 2016. Other domestic deals include the acquisition of No.2 Capital Quarter by Tesco Pension Fund for £23.2m and the sale of 1 Fusion Point to Fidelity UK for £8.9m. Overseas money represented 37% of investment volumes.
Prime office yields hardened by 25bps in 2017, finishing the year in the region of 5.50%. The spread between prime and good secondary has also continued to close as interest toward asset management opportunities has been sustained. Yields on good secondary stock were between 8% and 9% at the end of 2017.
£289m / +170%
62%
5.50%
5.50%
% OF DOMESTIC INVESTORS
PRIME YIELD 2017
£
PRIME RENT 2018 (FORECAST)
PRIME RENT 2017
PRIME YIELD 2018 (FORECAST)
INVESTMENT VOLUMES 2017
20 21
UK REGIONAL CITIES REVIEW 2018
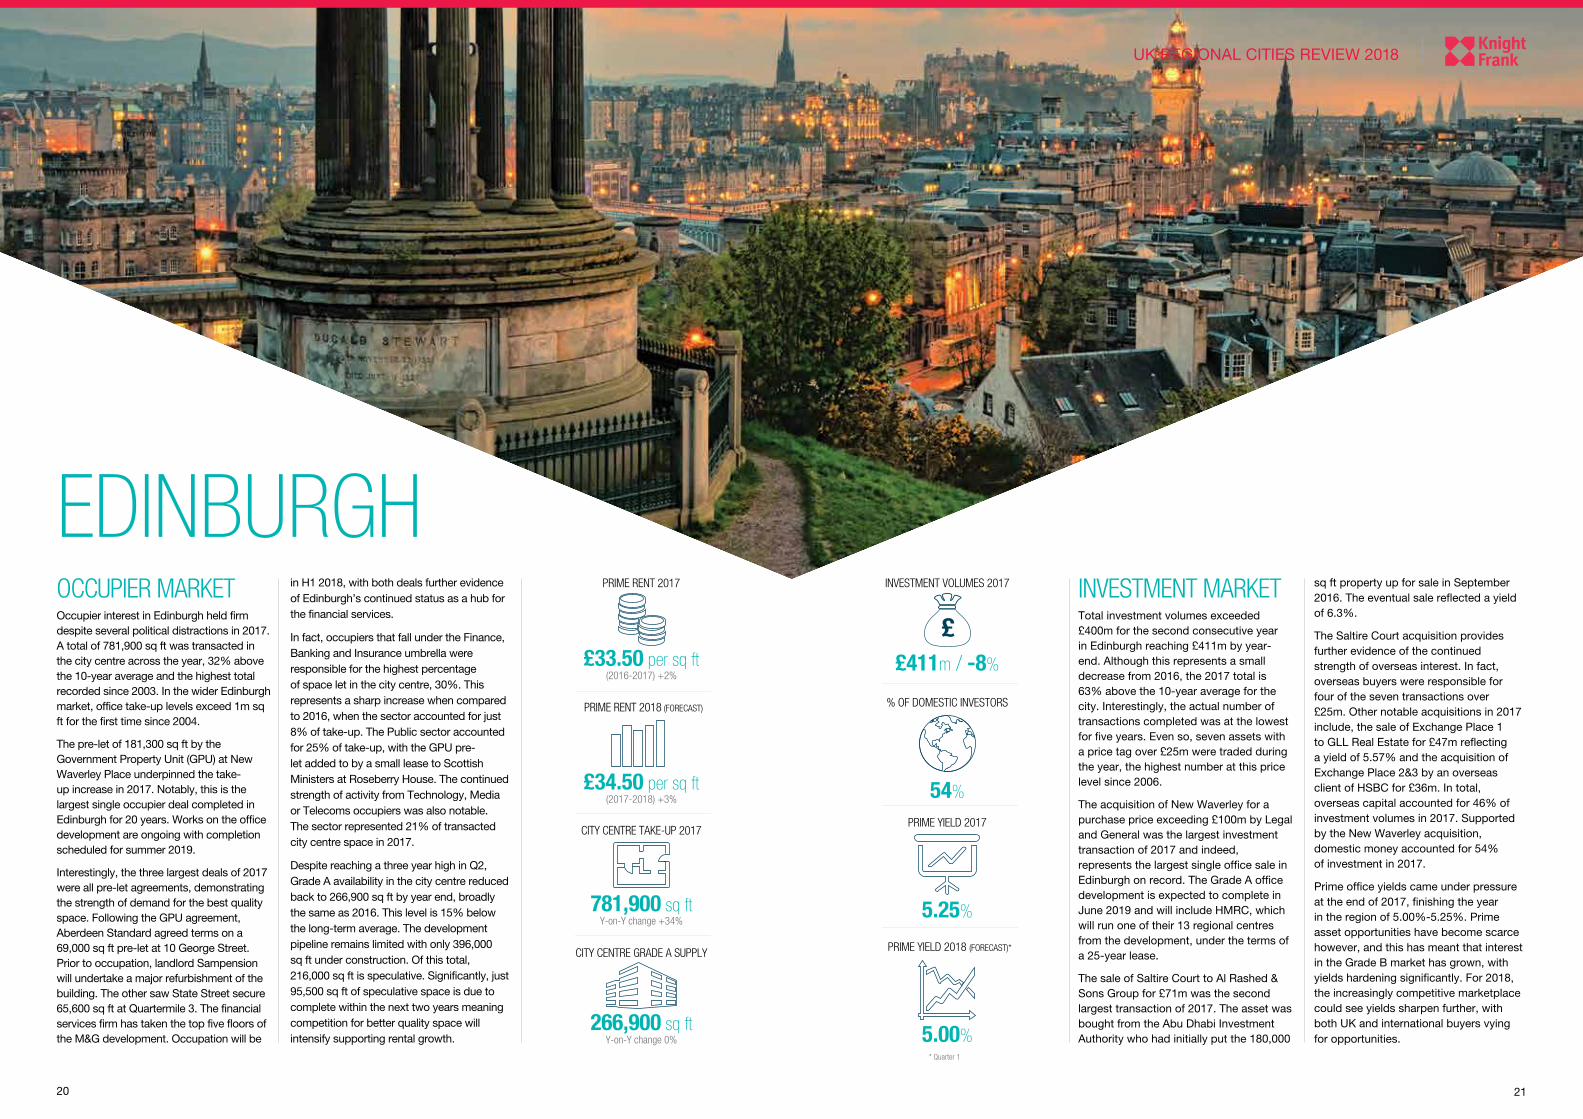
OCCUPIER MARKETOccupier interest in Edinburgh held firm despite several political distractions in 2017. A total of 781,900 sq ft was transacted in the city centre across the year, 32% above the 10-year average and the highest total recorded since 2003. In the wider Edinburgh market, office take-up levels exceed 1m sq ft for the first time since 2004.
The pre-let of 181,300 sq ft by the Government Property Unit (GPU) at New Waverley Place underpinned the take-up increase in 2017. Notably, this is the largest single occupier deal completed in Edinburgh for 20 years. Works on the office development are ongoing with completion scheduled for summer 2019.
Interestingly, the three largest deals of 2017 were all pre-let agreements, demonstrating the strength of demand for the best quality space. Following the GPU agreement, Aberdeen Standard agreed terms on a 69,000 sq ft pre-let at 10 George Street. Prior to occupation, landlord Sampension will undertake a major refurbishment of the building. The other saw State Street secure 65,600 sq ft at Quartermile 3. The financial services firm has taken the top five floors of the M&G development. Occupation will be
EDINBURGHin H1 2018, with both deals further evidence of Edinburgh’s continued status as a hub for the financial services.
In fact, occupiers that fall under the Finance, Banking and Insurance umbrella were responsible for the highest percentage of space let in the city centre, 30%. This represents a sharp increase when compared to 2016, when the sector accounted for just 8% of take-up. The Public sector accounted for 25% of take-up, with the GPU pre-let added to by a small lease to Scottish Ministers at Roseberry House. The continued strength of activity from Technology, Media or Telecoms occupiers was also notable. The sector represented 21% of transacted city centre space in 2017.
Despite reaching a three year high in Q2, Grade A availability in the city centre reduced back to 266,900 sq ft by year end, broadly the same as 2016. This level is 15% below the long-term average. The development pipeline remains limited with only 396,000 sq ft under construction. Of this total, 216,000 sq ft is speculative. Significantly, just 95,500 sq ft of speculative space is due to complete within the next two years meaning competition for better quality space will intensify supporting rental growth.
UK REGIONAL CITIES REVIEW 2018
£33.50 per sq ft(2016-2017) +2%
£34.50 per sq ft(2017-2018) +3%
781,900 sq ftY-on-Y change +34%
266,900 sq ftY-on-Y change 0%
CITY CENTRE TAKE-UP 2017
CITY CENTRE GRADE A SUPPLY
INVESTMENT MARKETTotal investment volumes exceeded £400m for the second consecutive year in Edinburgh reaching £411m by year-end. Although this represents a small decrease from 2016, the 2017 total is 63% above the 10-year average for the city. Interestingly, the actual number of transactions completed was at the lowest for five years. Even so, seven assets with a price tag over £25m were traded during the year, the highest number at this price level since 2006.
The acquisition of New Waverley for a purchase price exceeding £100m by Legal and General was the largest investment transaction of 2017 and indeed, represents the largest single office sale in Edinburgh on record. The Grade A office development is expected to complete in June 2019 and will include HMRC, which will run one of their 13 regional centres from the development, under the terms of a 25-year lease.
The sale of Saltire Court to Al Rashed & Sons Group for £71m was the second largest transaction of 2017. The asset was bought from the Abu Dhabi Investment Authority who had initially put the 180,000
sq ft property up for sale in September 2016. The eventual sale reflected a yield of 6.3%.
The Saltire Court acquisition provides further evidence of the continued strength of overseas interest. In fact, overseas buyers were responsible for four of the seven transactions over £25m. Other notable acquisitions in 2017 include, the sale of Exchange Place 1 to GLL Real Estate for £47m reflecting a yield of 5.57% and the acquisition of Exchange Place 2&3 by an overseas client of HSBC for £36m. In total, overseas capital accounted for 46% of investment volumes in 2017. Supported by the New Waverley acquisition, domestic money accounted for 54% of investment in 2017.
Prime office yields came under pressure at the end of 2017, finishing the year in the region of 5.00%-5.25%. Prime asset opportunities have become scarce however, and this has meant that interest in the Grade B market has grown, with yields hardening significantly. For 2018, the increasingly competitive marketplace could see yields sharpen further, with both UK and international buyers vying for opportunities.
£411m / -8%
54%
5.25%
5.00%
% OF DOMESTIC INVESTORS
PRIME YIELD 2017
* Quarter 1
£
PRIME RENT 2018 (FORECAST)
PRIME RENT 2017
PRIME YIELD 2018 (FORECAST)*
INVESTMENT VOLUMES 2017

22 23
UK REGIONAL CITIES REVIEW 2018
0SQ FT
ABERDEEN
916kSQ FT
LEEDS
733kSQ FT
CARDIFF
190kSQ FT
BRISTOL
1.63mSQ FT
BIRMINGHAM
619kSQ FT
MANCHESTER
396kSQ FT
EDINBURGH257k
SQ FT
GLASGOW
221kSQ FT
SHEFFIELD
107kSQ FT
NEWCASTLE
DEVELOPMENT PIPELINE 2018-2020
5.0msq ft
2018
Combinedregional total
(2018-2020)
2.7msq ft
2019
1.4msq ft
2020
0.9msq ftThe statistics on this page represent office space known to be under construction with a delivery date before year-end 2020.
Both new and comprehensive refurbishment schemes are included in the development pipeline.
UK REGIONAL CITIES REVIEW 2018
KEY
SPECULATIVE
TOTAL SPACE
LET
22 23

24 25
UK REGIONAL CITIES REVIEW 2018
GLASGOW
UK REGIONAL CITIES REVIEW 2018
OCCUPIER MARKETWith letting activity picking up in the second half of the year, city centre take-up reached 633,700 sq ft. Although this total represents a marginal decrease from 2016, the 2017 total is 19% above the 10-year average, a statistic that demonstrates the continued strength of occupier demand.
Public Sector occupiers proved a significant source of demand in 2017 accounting for 31% of space transacted, up from 8% in 2016. The biggest deal of the year saw Moorfield Group and Resonance Capital secure the Department of Work and Pensions (DWP) as a long term tenant at 1 Atlantic Quay. The government department agreed terms for a 15-year lease on 84,500 sq ft. In addition, the Scottish Courts & Tribunals service agreed to take a 25-year lease on 80,000 sq ft at 3 Atlantic Quay. Occupation is expected in late 2018 following the completion of refurbishment works. Interestingly, Legal & General have since acquired the building (No3) for £50m.
Glasgow’s traditional demand base however, the Financial Services, remained
INVESTMENT MARKETThe sustained strength of the occupational market, combined with favourable pricing and the weakening prospect of an imminent second Scottish independence vote served to fuel investment appetite in Glasgow in 2017. Investment volumes registered a four-fold increase when compared to 2016 to reach £453m by year end. This total is 117% ahead of the 10-year average for the city and represents the highest level of investment since 2006.
The second half of 2017 in particular registered a sharp increase in activity, with 82% of investment committed during the final six months of the year. Significantly, during this period, six transactions with a price tag above £25m were completed.
The acquisition of St Vincent Plaza by US firm Starwood Capital for £73m was the largest office transaction in 2017. The sale of the 172,300 sq ft property completed following Zurich Insurance agreeing terms on a 17,250 sq ft 10-year lease commencing Q2 2018. Other tenants include KPMG, Whyte
an active market participant. The sector accounted for 18% of take-up in 2017, a percentage consistent with the long-term average. The 40,850 sq ft lease agreed by the Student Loans Company at the Europa Building was the largest transaction to complete. Other notable deals included, JP Morgan taking a total of 29,000 sq ft across two deals at 141 Bothwell Street and Zurich Insurance leasing 17,250 sq ft at St Vincent Plaza.
New Grade A availability fell to 61,000 sq ft by the close of 2017, 78% below the 5-year average for the city. The development pipeline remains limited, with only 257,000 sq ft of speculative space under construction at year end. Significantly, this comprises entirely of comprehensive refurbishment schemes. This means that, given average build times, Glasgow will not see any new space until 2020 at the earliest.
Prime rents remained at £29.50 per sq ft in Glasgow, unchanged for two years. Given the low supply environment, 2018 is likely to be characterised by greater competition for the better quality space. As such, rents are expected to breach the £30 mark within the next 12 months.
and Mackay, Scottish Ministers, Mott Macdonald and Wood Group.
The £65.5m purchase of HFD Groups 122 Waterloo Street by Knight Frank IM on behalf of a Korean consortium was the second largest deal of the year. Upon its completion in 2018, the building will be the new headquarters of Morgan Stanley. The deal reflects an initial yield of 5.6%. Other notable deals to complete include the purchase of the mixed use, 48 St Vincent St by PonteGadea for £48.5m and Wirefox Investments buying both 60 York Street for £43.5m and City Park for £41m.
Similar to 2016, overseas money accounted for the largest percentage of office investment in Glasgow during 2017, 47%. In fact international buyers were responsible for the three largest deals of the year. It was the return of UK buyers however, that supported the sharp increase in investor activity. UK buyers completed 13 of 23 deals, up from just two in 2016. Domestic money accounted for 43% of investment volumes in 2017.
Despite the increase in activity, prime yields remained at 5.50% in 2017, although exceptional prime buildings would be expected to trade below this level.
£453m / +313%
43%
5.50%
5.25%
% OF DOMESTIC INVESTORS
PRIME YIELD 2017
££29.50 per sq ft
(2016-2017) 0%
£31.00 per sq ft(2017-2018) +5%
633,700 sq ftY-on-Y change -8%
61,026 sq ftY-on-Y change -51%
CITY CENTRE TAKE-UP 2017
NEW CITY CENTRE GRADE A SUPPLY
PRIME RENT 2018 (FORECAST)
PRIME RENT 2017
PRIME YIELD 2018 (FORECAST)
INVESTMENT VOLUMES 2017
26 27
UK REGIONAL CITIES REVIEW 2018
LEEDS
UK REGIONAL CITIES REVIEW 2018
OCCUPIER MARKETFor the first time on record, office take-up in Leeds passed the 1m sq ft mark in 2017. This total is more than double the amount registered in 2016 and is 88% ahead of the 10-year annual average for the city.
Leeds was another of the major regional cities to accommodate a major requirement from the Government Property Unit (GPU). In September, the GPU on behalf of HMRC and the Cabinet Office agreed terms for a 25-year lease on 378,000 sq ft at 7-8 Wellington Place. This is the biggest ever commercial property letting in Leeds. NHS Digital will also relocate to the new office, with occupation scheduled for 2020.
Whilst the GPU letting has attracted the majority of market attention, occupier activity was strong across all sectors. Significantly, three deals above 40,000 sq ft were completed during the year, a feature of the market that was absent from 2016.
In a deal that will enable a move from Albion Place, Leeds Building Society took control of the 80,600 sq ft
INVESTMENT MARKETA lack of available stock at the upper end of the market rather than low investor appetite served to limit investment volumes in 2017. Although overall deal number was up when compared to 2016, an example of an office sale above £25m was absent from the year. This meant that investment volumes reached only £127m, 25% below the 10-year average for the city.
The acquisition of 9 Bond Court by a confidential purchaser for £24.5m was the largest office sale in 2017. Bought from Legal and General, the 66,000 sq ft building is multi let with Redmayne & Bentley LLP, Knight Frank and Stewarts Law, the principal tenants.
In March, JPMorgan Chase acquired the freehold interest of Toronto Square from M&G Real Estate Ltd for £22.2m. Tenants of the 88,000 sq ft property include CBRE Ltd, Capsticks Solicitors LLP and Towry Services Ltd.
Other notable deals to complete in 2017 include the sale of five buildings at Capitol Park to Squarestone Growth for £18.2m. The properties were bought
Sovereign House as the year was finishing. The building is the former home of Addleshaw Goddard who moved to Bruntwood’s 3 Sovereign Square in one of the largest deals in the city in 2016.
Earlier in the year, Burberry took 46,000 sq ft at 6 Queen Street on a 10-year lease. The deal was of major significance to the Leeds market with £30 per sq ft being agreed. Prime rents in the city have now shifted upward on the back of this transaction.
Underpinned by the GPU, the public sector accounted for the highest percentage of take-up in 2017, 39%. Occupiers from a Technology, Media or Telecoms (TMT) background continue to have a significant influence on market activity. The TMT sector accounted for 16% of take-up during the year, with new deals to Sky (25,700 sq ft) and Tech Hub (19,600 sq ft) the largest to complete.
Prime headline rents increased by 9% during 2017 to £30.00 per sq ft. This movement re-establishes the gap between good quality secondary and prime space, with rents on good quality secondary space having increased to £26 per sq ft in 2017.
from Sterling Capitol, with the sale price reflecting net initial yield of 8.9%. In July, Schroders UK Real Estate Fund, through Regional Office Unit Trust bought the freehold of 1 East Parade and 8 St Pauls Street for £12.7m reflecting a net initial yield of 6.75%.
In contrast to the previous year, domestic money accounted for the majority of investment in 2017, 47%. Nonetheless, international interest remain strong, with overseas buyers accounting for 40% of investment volumes.
Prime city core yields remained unchanged at 5.25% in 2017. At this level, prime yields are 50 basis points above the market peak of 4.75% recorded in 2007. Given the strong interest and limited availability of prime opportunities however, should the best buildings come to market, a sharper yield would be expected. For secondary assets, refurbishment opportunities remained highly sought in order to re-institutionalise assets and thus make a profit. Yields for good quality, well located secondary stock ranged between 6.50% and 7.50% at year end.
£127m / -27%
47%
5.25%
5.00%
% OF DOMESTIC INVESTORS
PRIME YIELD 2017
££30.00 per sq ft
(2016-2017) +9%
£30.00 per sq ft(2017-2018) 0%
1m sq ftY-on-Y change +133%
324,000 sq ftY-on-Y change -27%
CITY CENTRE TAKE-UP 2017
CITY CENTRE GRADE A SUPPLY
PRIME RENT 2018 (FORECAST)
PRIME RENT 2017
PRIME YIELD 2018 (FORECAST)
INVESTMENT VOLUMES 2017
Permission for the use of this image has been approved by Atkins
28 29
UK REGIONAL CITIES REVIEW 2018
MANCHESTER
UK REGIONAL CITIES REVIEW 2018
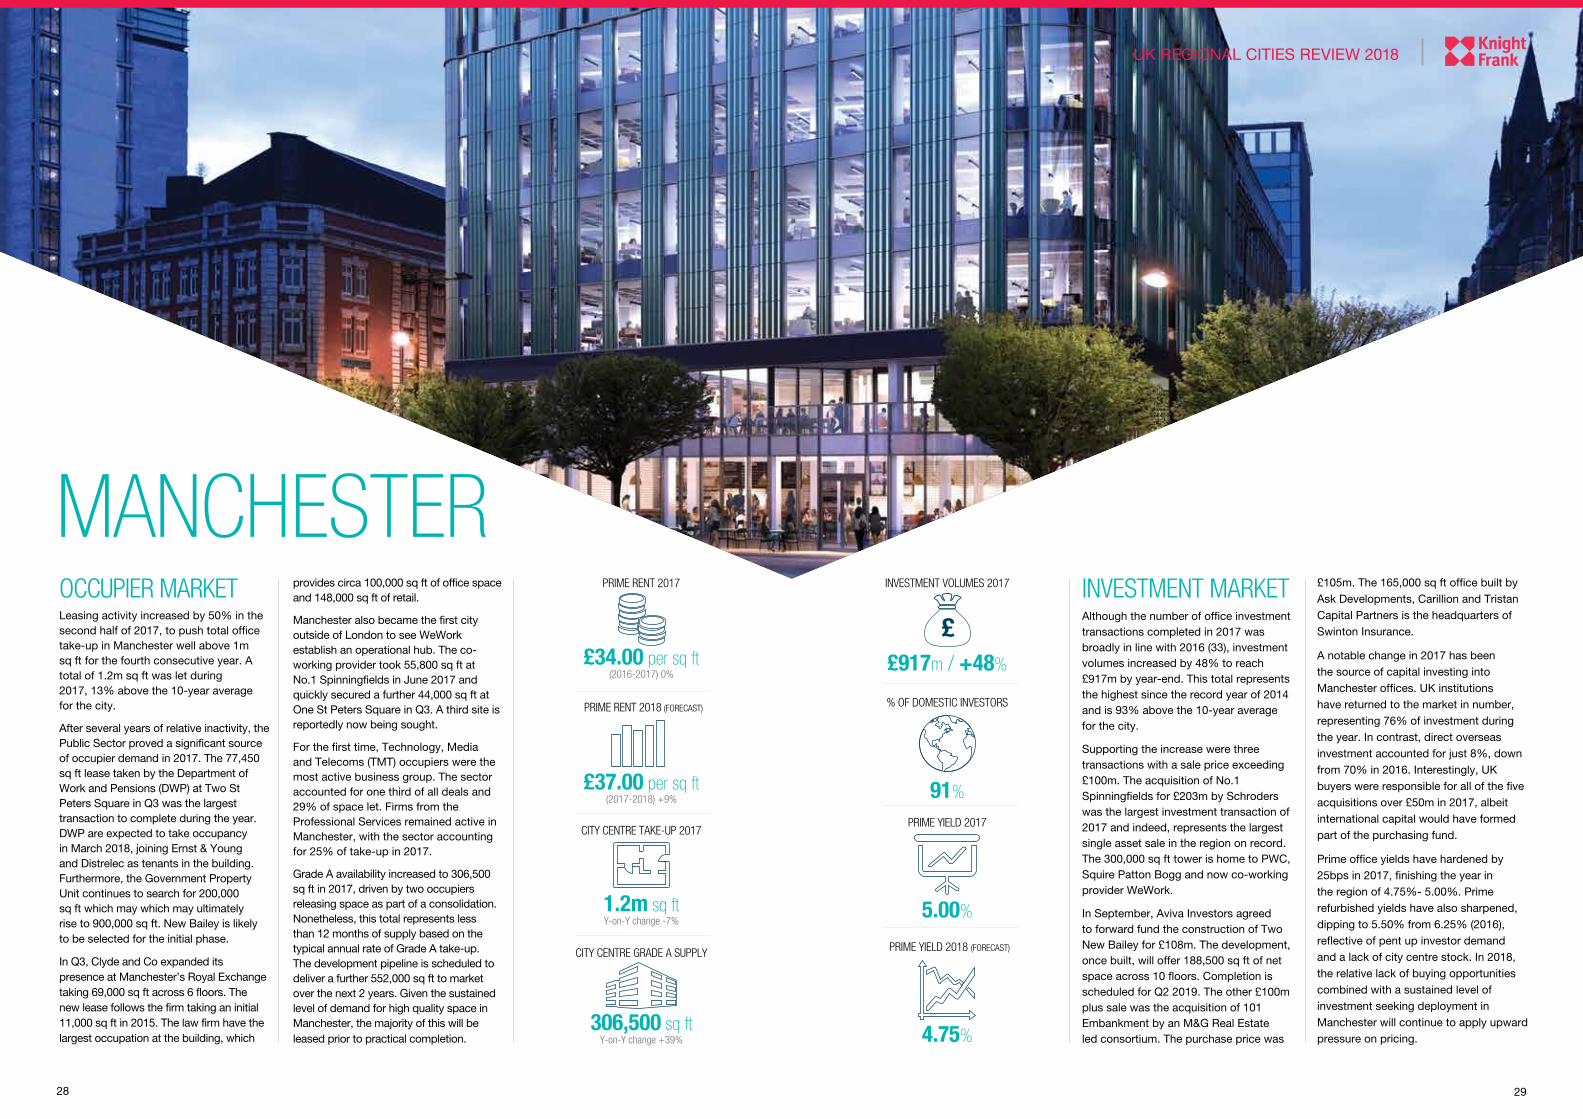
OCCUPIER MARKETLeasing activity increased by 50% in the second half of 2017, to push total office take-up in Manchester well above 1m sq ft for the fourth consecutive year. A total of 1.2m sq ft was let during 2017, 13% above the 10-year average for the city.
After several years of relative inactivity, the Public Sector proved a significant source of occupier demand in 2017. The 77,450 sq ft lease taken by the Department of Work and Pensions (DWP) at Two St Peters Square in Q3 was the largest transaction to complete during the year. DWP are expected to take occupancy in March 2018, joining Ernst & Young and Distrelec as tenants in the building. Furthermore, the Government Property Unit continues to search for 200,000 sq ft which may which may ultimately rise to 900,000 sq ft. New Bailey is likely to be selected for the initial phase.
In Q3, Clyde and Co expanded its presence at Manchester’s Royal Exchange taking 69,000 sq ft across 6 floors. The new lease follows the firm taking an initial 11,000 sq ft in 2015. The law firm have the largest occupation at the building, which
INVESTMENT MARKETAlthough the number of office investment transactions completed in 2017 was broadly in line with 2016 (33), investment volumes increased by 48% to reach £917m by year-end. This total represents the highest since the record year of 2014 and is 93% above the 10-year average for the city.
Supporting the increase were three transactions with a sale price exceeding £100m. The acquisition of No.1 Spinningfields for £203m by Schroders was the largest investment transaction of 2017 and indeed, represents the largest single asset sale in the region on record. The 300,000 sq ft tower is home to PWC, Squire Patton Bogg and now co-working provider WeWork.
In September, Aviva Investors agreed to forward fund the construction of Two New Bailey for £108m. The development, once built, will offer 188,500 sq ft of net space across 10 floors. Completion is scheduled for Q2 2019. The other £100m plus sale was the acquisition of 101 Embankment by an M&G Real Estate led consortium. The purchase price was
provides circa 100,000 sq ft of office space and 148,000 sq ft of retail.
Manchester also became the first city outside of London to see WeWork establish an operational hub. The co-working provider took 55,800 sq ft at No.1 Spinningfields in June 2017 and quickly secured a further 44,000 sq ft at One St Peters Square in Q3. A third site is reportedly now being sought.
For the first time, Technology, Media and Telecoms (TMT) occupiers were the most active business group. The sector accounted for one third of all deals and 29% of space let. Firms from the Professional Services remained active in Manchester, with the sector accounting for 25% of take-up in 2017.
Grade A availability increased to 306,500 sq ft in 2017, driven by two occupiers releasing space as part of a consolidation. Nonetheless, this total represents less than 12 months of supply based on the typical annual rate of Grade A take-up. The development pipeline is scheduled to deliver a further 552,000 sq ft to market over the next 2 years. Given the sustained level of demand for high quality space in Manchester, the majority of this will be leased prior to practical completion.
£105m. The 165,000 sq ft office built by Ask Developments, Carillion and Tristan Capital Partners is the headquarters of Swinton Insurance.
A notable change in 2017 has been the source of capital investing into Manchester offices. UK institutions have returned to the market in number, representing 76% of investment during the year. In contrast, direct overseas investment accounted for just 8%, down from 70% in 2016. Interestingly, UK buyers were responsible for all of the five acquisitions over £50m in 2017, albeit international capital would have formed part of the purchasing fund.
Prime office yields have hardened by 25bps in 2017, finishing the year in the region of 4.75%- 5.00%. Prime refurbished yields have also sharpened, dipping to 5.50% from 6.25% (2016), reflective of pent up investor demand and a lack of city centre stock. In 2018, the relative lack of buying opportunities combined with a sustained level of investment seeking deployment in Manchester will continue to apply upward pressure on pricing.
£917m / +48%
91%
5.00%
4.75%
% OF DOMESTIC INVESTORS
PRIME YIELD 2017
££34.00 per sq ft
(2016-2017) 0%
£37.00 per sq ft(2017-2018) +9%
1.2m sq ftY-on-Y change -7%
306,500 sq ftY-on-Y change +39%
CITY CENTRE TAKE-UP 2017
CITY CENTRE GRADE A SUPPLY
PRIME RENT 2018 (FORECAST)
PRIME RENT 2017
PRIME YIELD 2018 (FORECAST)
INVESTMENT VOLUMES 2017
30 31
UK REGIONAL CITIES REVIEW 2018
NEWCASTLE
UK REGIONAL CITIES REVIEW 2018
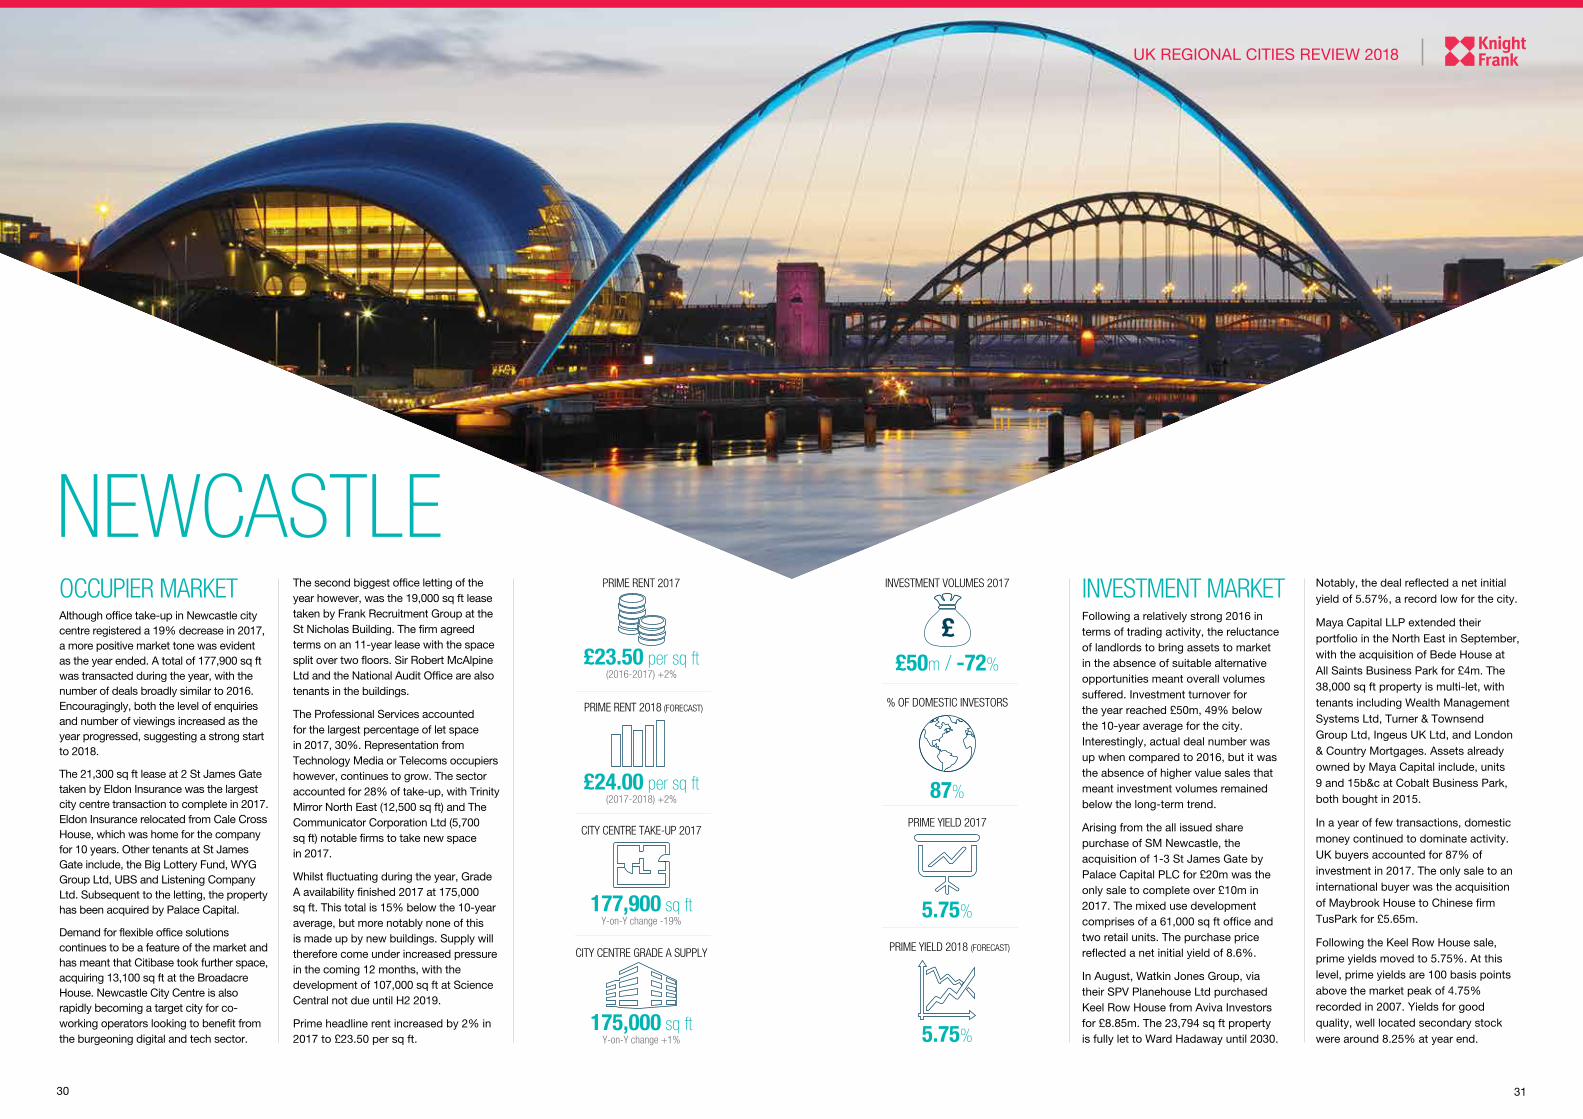
OCCUPIER MARKETAlthough office take-up in Newcastle city centre registered a 19% decrease in 2017, a more positive market tone was evident as the year ended. A total of 177,900 sq ft was transacted during the year, with the number of deals broadly similar to 2016. Encouragingly, both the level of enquiries and number of viewings increased as the year progressed, suggesting a strong start to 2018.
The 21,300 sq ft lease at 2 St James Gate taken by Eldon Insurance was the largest city centre transaction to complete in 2017. Eldon Insurance relocated from Cale Cross House, which was home for the company for 10 years. Other tenants at St James Gate include, the Big Lottery Fund, WYG Group Ltd, UBS and Listening Company Ltd. Subsequent to the letting, the property has been acquired by Palace Capital.
Demand for flexible office solutions continues to be a feature of the market and has meant that Citibase took further space, acquiring 13,100 sq ft at the Broadacre House. Newcastle City Centre is also rapidly becoming a target city for co-working operators looking to benefit from the burgeoning digital and tech sector.
INVESTMENT MARKETFollowing a relatively strong 2016 in terms of trading activity, the reluctance of landlords to bring assets to market in the absence of suitable alternative opportunities meant overall volumes suffered. Investment turnover for the year reached £50m, 49% below the 10-year average for the city. Interestingly, actual deal number was up when compared to 2016, but it was the absence of higher value sales that meant investment volumes remained below the long-term trend.
Arising from the all issued share purchase of SM Newcastle, the acquisition of 1-3 St James Gate by Palace Capital PLC for £20m was the only sale to complete over £10m in 2017. The mixed use development comprises of a 61,000 sq ft office and two retail units. The purchase price reflected a net initial yield of 8.6%.
In August, Watkin Jones Group, via their SPV Planehouse Ltd purchased Keel Row House from Aviva Investors for £8.85m. The 23,794 sq ft property is fully let to Ward Hadaway until 2030.
The second biggest office letting of the year however, was the 19,000 sq ft lease taken by Frank Recruitment Group at the St Nicholas Building. The firm agreed terms on an 11-year lease with the space split over two floors. Sir Robert McAlpine Ltd and the National Audit Office are also tenants in the buildings.
The Professional Services accounted for the largest percentage of let space in 2017, 30%. Representation from Technology Media or Telecoms occupiers however, continues to grow. The sector accounted for 28% of take-up, with Trinity Mirror North East (12,500 sq ft) and The Communicator Corporation Ltd (5,700 sq ft) notable firms to take new space in 2017.
Whilst fluctuating during the year, Grade A availability finished 2017 at 175,000 sq ft. This total is 15% below the 10-year average, but more notably none of this is made up by new buildings. Supply will therefore come under increased pressure in the coming 12 months, with the development of 107,000 sq ft at Science Central not due until H2 2019.
Prime headline rent increased by 2% in 2017 to £23.50 per sq ft.
Notably, the deal reflected a net initial yield of 5.57%, a record low for the city.
Maya Capital LLP extended their portfolio in the North East in September, with the acquisition of Bede House at All Saints Business Park for £4m. The 38,000 sq ft property is multi-let, with tenants including Wealth Management Systems Ltd, Turner & Townsend Group Ltd, Ingeus UK Ltd, and London & Country Mortgages. Assets already owned by Maya Capital include, units 9 and 15b&c at Cobalt Business Park, both bought in 2015.
In a year of few transactions, domestic money continued to dominate activity. UK buyers accounted for 87% of investment in 2017. The only sale to an international buyer was the acquisition of Maybrook House to Chinese firm TusPark for £5.65m.
Following the Keel Row House sale, prime yields moved to 5.75%. At this level, prime yields are 100 basis points above the market peak of 4.75% recorded in 2007. Yields for good quality, well located secondary stock were around 8.25% at year end.
£50m / -72%
87%
5.75%
5.75%
% OF DOMESTIC INVESTORS
PRIME YIELD 2017
££23.50 per sq ft
(2016-2017) +2%
£24.00 per sq ft(2017-2018) +2%
177,900 sq ftY-on-Y change -19%
175,000 sq ftY-on-Y change +1%
CITY CENTRE TAKE-UP 2017
CITY CENTRE GRADE A SUPPLY
PRIME RENT 2018 (FORECAST)
PRIME RENT 2017
PRIME YIELD 2018 (FORECAST)
INVESTMENT VOLUMES 2017
32 33
UK REGIONAL CITIES REVIEW 2018
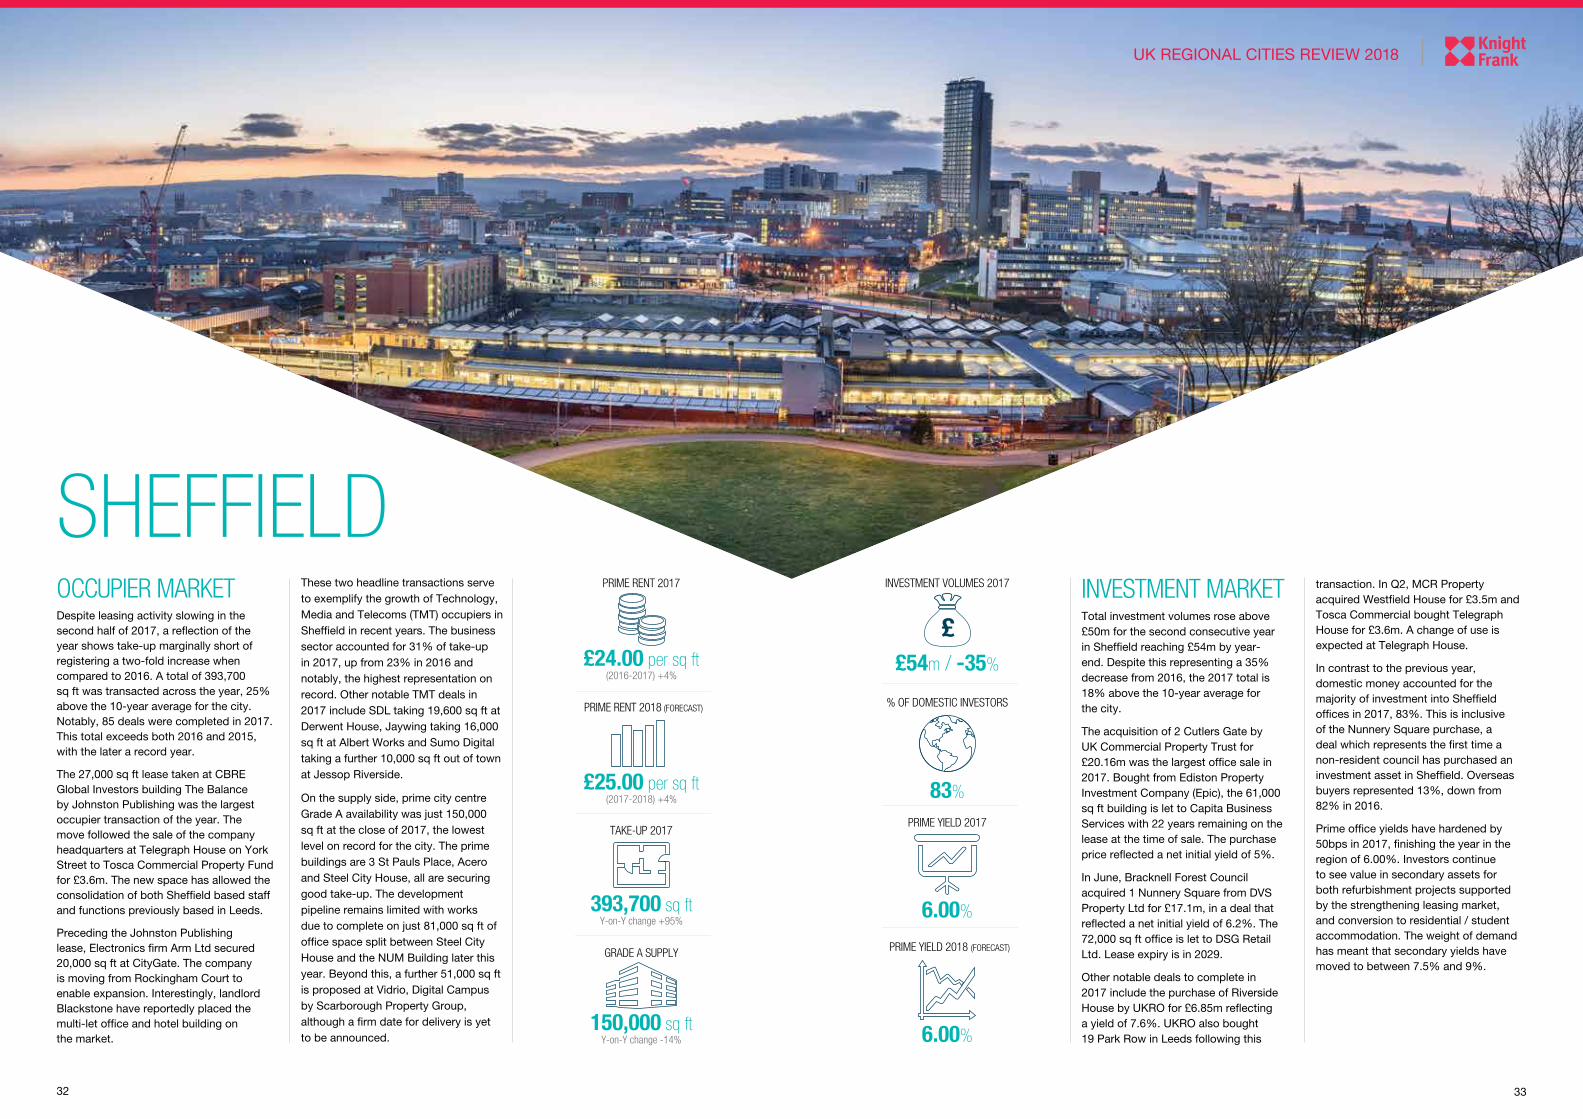
INVESTMENT MARKETTotal investment volumes rose above £50m for the second consecutive year in Sheffield reaching £54m by year-end. Despite this representing a 35% decrease from 2016, the 2017 total is 18% above the 10-year average for the city.
The acquisition of 2 Cutlers Gate by UK Commercial Property Trust for £20.16m was the largest office sale in 2017. Bought from Ediston Property Investment Company (Epic), the 61,000 sq ft building is let to Capita Business Services with 22 years remaining on the lease at the time of sale. The purchase price reflected a net initial yield of 5%.
In June, Bracknell Forest Council acquired 1 Nunnery Square from DVS Property Ltd for £17.1m, in a deal that reflected a net initial yield of 6.2%. The 72,000 sq ft office is let to DSG Retail Ltd. Lease expiry is in 2029.
Other notable deals to complete in 2017 include the purchase of Riverside House by UKRO for £6.85m reflecting a yield of 7.6%. UKRO also bought 19 Park Row in Leeds following this
transaction. In Q2, MCR Property acquired Westfield House for £3.5m and Tosca Commercial bought Telegraph House for £3.6m. A change of use is expected at Telegraph House.
In contrast to the previous year, domestic money accounted for the majority of investment into Sheffield offices in 2017, 83%. This is inclusive of the Nunnery Square purchase, a deal which represents the first time a non-resident council has purchased an investment asset in Sheffield. Overseas buyers represented 13%, down from 82% in 2016.
Prime office yields have hardened by 50bps in 2017, finishing the year in the region of 6.00%. Investors continue to see value in secondary assets for both refurbishment projects supported by the strengthening leasing market, and conversion to residential / student accommodation. The weight of demand has meant that secondary yields have moved to between 7.5% and 9%.
UK REGIONAL CITIES REVIEW 2018
OCCUPIER MARKETDespite leasing activity slowing in the second half of 2017, a reflection of the year shows take-up marginally short of registering a two-fold increase when compared to 2016. A total of 393,700 sq ft was transacted across the year, 25% above the 10-year average for the city. Notably, 85 deals were completed in 2017. This total exceeds both 2016 and 2015, with the later a record year.
The 27,000 sq ft lease taken at CBRE Global Investors building The Balance by Johnston Publishing was the largest occupier transaction of the year. The move followed the sale of the company headquarters at Telegraph House on York Street to Tosca Commercial Property Fund for £3.6m. The new space has allowed the consolidation of both Sheffield based staff and functions previously based in Leeds.
Preceding the Johnston Publishing lease, Electronics firm Arm Ltd secured 20,000 sq ft at CityGate. The company is moving from Rockingham Court to enable expansion. Interestingly, landlord Blackstone have reportedly placed the multi-let office and hotel building on the market.
SHEFFIELDThese two headline transactions serve to exemplify the growth of Technology, Media and Telecoms (TMT) occupiers in Sheffield in recent years. The business sector accounted for 31% of take-up in 2017, up from 23% in 2016 and notably, the highest representation on record. Other notable TMT deals in 2017 include SDL taking 19,600 sq ft at Derwent House, Jaywing taking 16,000 sq ft at Albert Works and Sumo Digital taking a further 10,000 sq ft out of town at Jessop Riverside.
On the supply side, prime city centre Grade A availability was just 150,000 sq ft at the close of 2017, the lowest level on record for the city. The prime buildings are 3 St Pauls Place, Acero and Steel City House, all are securing good take-up. The development pipeline remains limited with works due to complete on just 81,000 sq ft of office space split between Steel City House and the NUM Building later this year. Beyond this, a further 51,000 sq ft is proposed at Vidrio, Digital Campus by Scarborough Property Group, although a firm date for delivery is yet to be announced.
£24.00 per sq ft(2016-2017) +4%
£25.00 per sq ft(2017-2018) +4%
393,700 sq ftY-on-Y change +95%
150,000 sq ftY-on-Y change -14%
TAKE-UP 2017
GRADE A SUPPLY
£54m / -35%
83%
6.00%
6.00%
% OF DOMESTIC INVESTORS
PRIME YIELD 2017
£
PRIME RENT 2018 (FORECAST)
PRIME RENT 2017
PRIME YIELD 2018 (FORECAST)
INVESTMENT VOLUMES 2017

34
KNIGHT FRANK VIEW
“
“
MATT PHILLIPS, CARDIFFCardiff city centre continues to build upon the success of office led mixed use schemes such as Central Square and Capital Quarter. These speculative developments have helped Cardiff see occupier and investor transactions reach a record level in 2017, while also setting new prime yields for the subsequent sales. Importantly, the delivery of high quality stock is attracting new occupiers to Cardiff, especially into the city centre, where connectivity and amenity is plentiful. We begin 2018 therefore, with optimism of continued growth. The Cardiff story is a strong one, with an increasing profile, successful new development and a growing pool of end investors. One challenge moving forward will be to ensure that the public transport improvements are delivered. Advancement in this area would further the appeal of the city to new businesses.
““
DAVID PORTER, MANCHESTERManchester’s dominance across the regional market is set to continue throughout 2018. The shortage of Grade A office supply and robust levels of demand, especially from the Tech Sector, will see prime office rents increasing beyond £36 per sq ft, underlining the city’s rental growth. We expect that pre-lets will dominant the market this year with occupiers fearing of missing out on the best space. In turn, investors will continue to compete for city centre assets as they align themselves with occupiers who are choosing Manchester as a key destination to locate and grow. We expect prime yields to sharpen to 4.75% and secondary yields to dip to just 5.50%, reflective of pent up investor demand from both traditional UK institutions and overseas capital.
“
“
PETER BOWDEN, NEWCASTLEOccupational demand steadily increased towards the end of 2017, which bodes well for the prospect of rental growth and balances against increasingly low investment yields. In particular, the technology industry grows in presence and we anticipate that this sector will become even more important to the Newcastle office market in 2018. The challenge to growth however, will be the availability of ‘Tech firm friendly’ space. For capital markets, the outlook is also cautiously optimistic. We expect prime yields to contract, as the weight of money chasing prime stock increases.
“
“
ERIC SHEARER, ABERDEEN2017 saw a 68% increase in take-up from the previous year following a steady rise in the oil price, which is one of the main drivers for the Aberdeen market (mid $60’s per barrel at year-end). Early indications for 2018 are encouraging, with many occupiers seeing the current unbalance of supply over demand being a great “buying” opportunity. This trend will develop further in the coming year, with occupiers increasingly attracted to a move to new space in the city centre.
“
“
ASHLEY HUDSON, BIRMINGHAMAs the Birmingham market moves in to 2018, the overwhelming feeling is of cautious optimism. 2017 was characterised by large occupiers moving to the city and ‘big ticket’ investment transactions. The ongoing investment, whether into infrastructure or amenity, is paying dividends. Birmingham has never been more firmly in focus. We therefore have no reason to believe that the positivity around Birmingham will change in 2018. We forecast prime rents to grow towards £35 per sq ft and prime yields to sharpen to 4.75% NIY.
“
“
STEVE OADES, BRISTOL2018 will be a significant year for Bristol in terms of infrastructure, with the new Metrobus beginning operation and the location of Bristol’s Arena will be announced. For businesses, Bristol remains attractive both in terms of amenity, cost and proximity to London however, with a lack of speculative development, supply of office space is limited. Occupiers are needing to move quickly to secure the best space, rents are continuing to rise and we expect to hit £35.00 by the end of 2018. Yields will be maintained at 5.00% and may sharpen to 4.85% for best in class buildings. Good news for investors looking to get into Bristol, but even better news for those who are here already.
“
“
JOHN RAE, GLASGOWThe Glasgow office market has enjoyed a buoyant 12 months. High profile occupiers continue to commit to the city, with Morgan Stanley taking occupation of 122 Waterloo Street and the Government Property Unit agreeing a pre-let at Atlantic Square. Along with numerous other high profile occupational deals, Glasgow now has an acute shortage of Grade A office space, meaning heightened competition among prospecting occupiers and upward pressure on rents. This occupational success has led to some significant investment transactions, with capital flowing into the city from the Far East, the US and also the traditional UK institutions. Investment volumes in 2017 were the highest for a decade, testament to Glasgow’s ongoing appeal on the global stage.
“
“
PETER WHITELEY, SHEFFIELDIn 2017, Sheffield saw a return to form following depressed leasing market in 2016, where uncertainty relating to Brexit weighed heavily on occupier confidence. As we move into 2018, there are a number of significant enquiries progressing, which should complete in the first quarter. A shortage of Prime Grade A space is on the horizon in 2018, with both Acero at Sheffield Digital Campus and 3 St Pauls Place securing strong occupier interest. On the back of the expected market imbalance, prime rents are expected to grow to a new headline of £25.00 per sq ft in 2018 and the middle market will undoubtedly grow in tandem.
“
“
ALASDAIR STEELE, EDINBURGHWe expect 2018 to be a strong year for Edinburgh offices. The supply and demand dynamic should result in continued strong rental growth, whilst yields for UK regional offices in general look attractive when compared with mainland European cities. There are already signs that UK regional office yields are hardening, with sales in both Manchester and Birmingham breaking through the 5% yield barrier, and the sheer weight of money focussed on the city means Edinburgh yields are likely to follow suit and continue to harden. With both UK institutional and overseas money seeking to invest in the sector the biggest challenge this year will undoubtedly be finding buyable opportunities.
““
HENRIE WESTLAKE, LEEDSLeeds will see the continued blurring of the lines between work and play as a new type of firm is conceived where technology and people merge to offer business solutions and innovative products. Property owners who will win shall treat office space as a service when working with customers. We will see a drive within real estate for long-term core space, with flexible supplementary accommodation taken on a project-by-project or task basis. Expect to see more rockstar’s and disrupters entering the market who are reinventing office life, where unique workspaces and cultural venues for entrepreneurs, investors, inventors and big business can collaborate. The future for offices in Leeds is seductive and alluring and the question for Leeds is fast becoming “Not Why” but “Why Not”.
34 35
36 37
UK REGIONAL CITIES REVIEW 2018
DATADASHBOARDOCCUPIER
£BN 10 YR AVERAGE
YIELD PEAK OF THE LAST CYCLE
4.75
5.25
5.00
5.00
5.25
5.50
5.50
5.75
6.00
6.50
2016
2017
2015
2014
2013
2012
2011
2010
2009
2008
1.3
1.5
2.1
1.5
1.0
1.7
3.4
3.3
3.4
2.5
UKInstitutions
42%
OverseasInvestor
32%
UK PropertyCompany
21%
PrivateInvestor
3%
Other2%
TAKE-UP M SQ FT 10 YR AVERAGE
2016
2017
2015
2014
2013
2012
2011
2010
2009
2008
5.7
4.4
5.0
4.9
4.7
5.5
6.9
6.5
5.9
7.0 RENT PEAK OF THE LAST CYCLE
34.0
0
33.5
0
33.5
0
32.5
0
32.0
0
30.0
0
29.5
0
25.0
0
24.0
0
23.5
0
Shef
field
Aber
deen
New
cast
le
Card
iff
Glas
gow
Bris
tol
Man
ches
ter
Leed
s
Edin
burg
h
Birm
ingh
am
Shef
field
Aber
deen
New
cast
le
Card
iff
Glas
gow
Bris
tol
Man
ches
ter
Leed
s
Edin
burg
h
Birm
ingh
amOther business segments accounted for 11%
Retail, Distribution & Transport 2%Pharmaceutical & Healthcare 2%Charities 2%Energy & Utilities 4%Construction & Engineering 5%Finance, Banking, Insurance 11%TMT 18%Professional Services 20%Public Sector & Not-for-profit 25%
FIGURE 4
Combined city investment volumes £bn
FIGURE 1
Combined city take-up (m sq ft)
FIGURE 5 Combined city investment by purchaser
FIGURE 2 Combined city take-up by sector
FIGURE 6
Prime yields %
FIGURE 3
Prime rent £ per sq ft
Source for all charts and data table: Knight Frank Research, Property Data
INVESTMENT
2015 2016 2017 Y-on-Y Long-term average
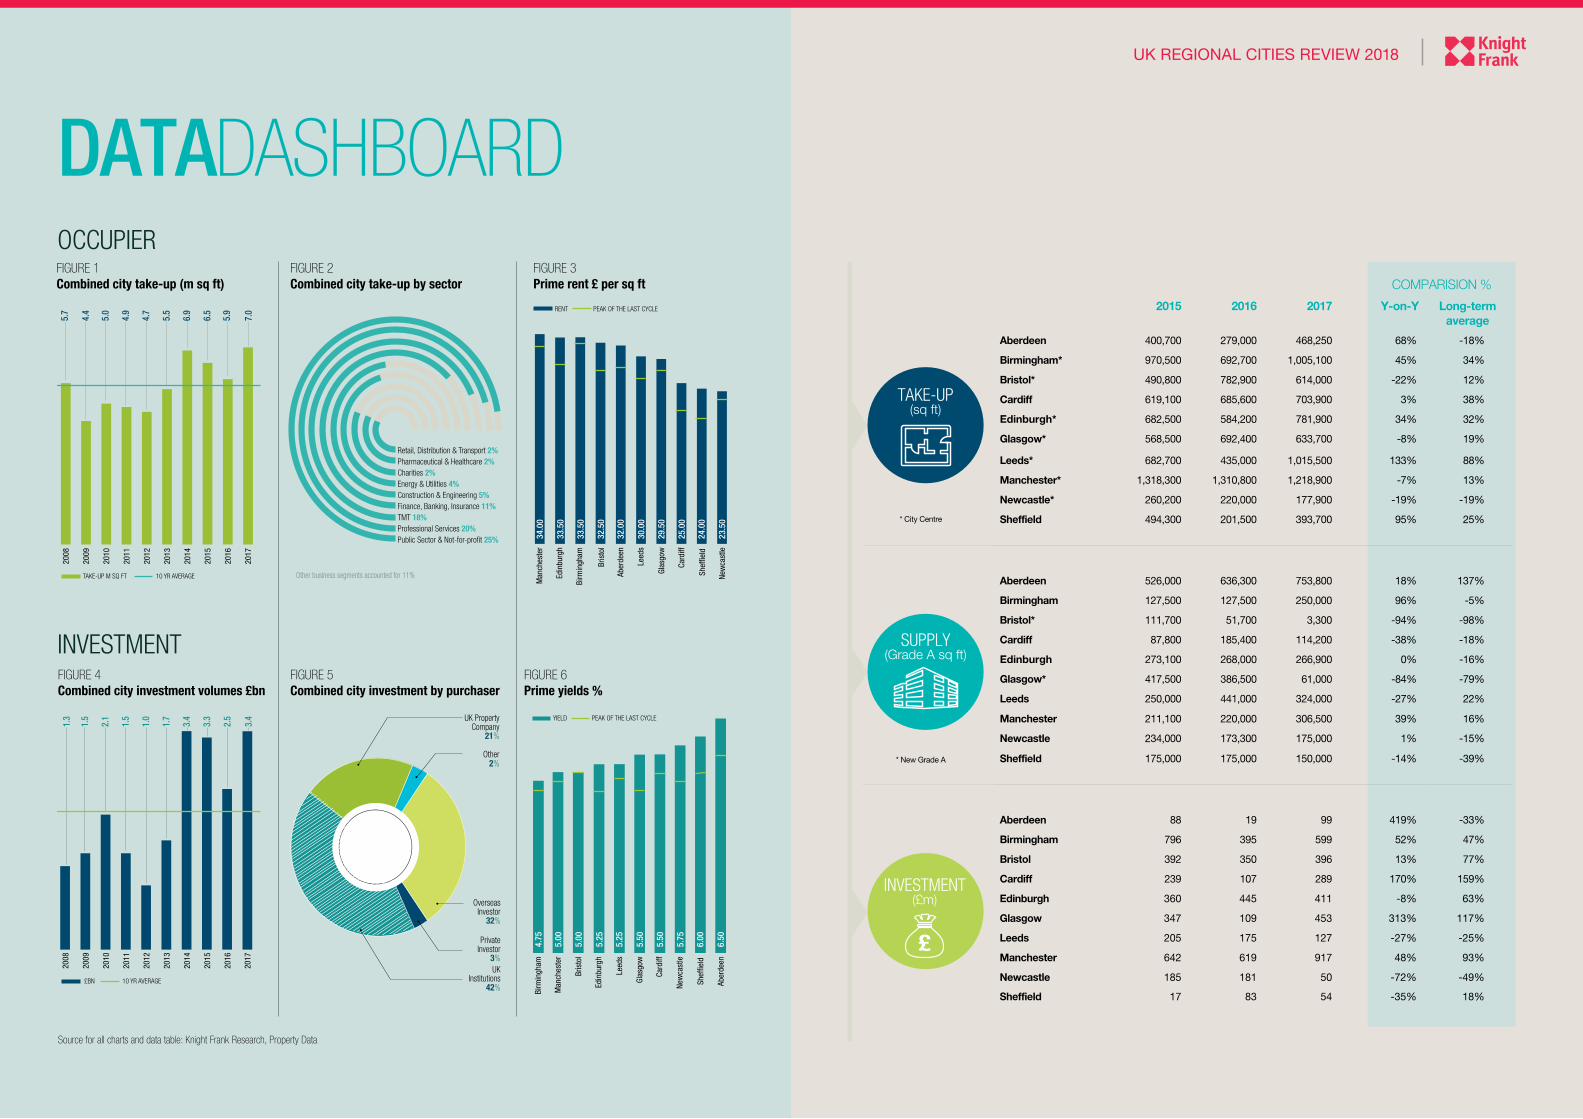
Aberdeen 400,700 279,000 468,250 68% -18%
Birmingham* 970,500 692,700 1,005,100 45% 34%
Bristol* 490,800 782,900 614,000 -22% 12%
Cardiff 619,100 685,600 703,900 3% 38%
Edinburgh* 682,500 584,200 781,900 34% 32%
Glasgow* 568,500 692,400 633,700 -8% 19%
Leeds* 682,700 435,000 1,015,500 133% 88%
Manchester* 1,318,300 1,310,800 1,218,900 -7% 13%
Newcastle* 260,200 220,000 177,900 -19% -19%
Sheffield 494,300 201,500 393,700 95% 25%
Aberdeen 526,000 636,300 753,800 18% 137%
Birmingham 127,500 127,500 250,000 96% -5%
Bristol* 111,700 51,700 3,300 -94% -98%
Cardiff 87,800 185,400 114,200 -38% -18%
Edinburgh 273,100 268,000 266,900 0% -16%
Glasgow* 417,500 386,500 61,000 -84% -79%
Leeds 250,000 441,000 324,000 -27% 22%
Manchester 211,100 220,000 306,500 39% 16%
Newcastle 234,000 173,300 175,000 1% -15%
Sheffield 175,000 175,000 150,000 -14% -39%
Aberdeen 88 19 99 419% -33%
Birmingham 796 395 599 52% 47%
Bristol 392 350 396 13% 77%
Cardiff 239 107 289 170% 159%
Edinburgh 360 445 411 -8% 63%
Glasgow 347 109 453 313% 117%
Leeds 205 175 127 -27% -25%
Manchester 642 619 917 48% 93%
Newcastle 185 181 50 -72% -49%
Sheffield 17 83 54 -35% 18%
COMPARISION %
INVESTMENT (£m)
£
SUPPLY (Grade A sq ft)
UK REGIONAL CITIES REVIEW 2018
TAKE-UP (sq ft)
* New Grade A
* City Centre

38 39
UK REGIONAL CITIES REVIEW 2018
ALASDAIR STEELE PARTNER, HEAD OF SCOTLAND+44 131 222 [email protected]
EDINBURGH
DAVID PORTER PARTNER, OFFICE HEAD +44 161 833 [email protected]
MANCHESTER
JOHN RAE PARTNER, OFFICE HEAD +44 141 566 [email protected]
GLASGOW
ERIC SHEARER PARTNER, OFFICE HEAD+44 122 441 [email protected]
ABERDEEN
MATT PHILLIPS PARTNER, OFFICE HEAD +44 292 044 [email protected]
CARDIFF
PETER WHITELEY PARTNER, OFFICE HEAD +44 114 241 [email protected]
SHEFFIELD
STEVE OADESPARTNER, OFFICE HEAD +44 117 917 [email protected]
BRISTOL
HENRIE WESTLAKE PARTNER, OFFICE HEAD +44 113 297 [email protected]
LEEDS
ASHLEY HUDSONPARTNER, OFFICE HEAD +44 121 233 [email protected]
BIRMINGHAM
PETER BOWDEN PARTNER, OFFICE HEAD +44 191 594 [email protected]
NEWCASTLE RESEARCH
DARREN MANSFIELDASSOCIATE+44 20 7861 [email protected]
LONDON
ALASTAIR GRAHAM-CAMPBELL PARTNER, REGIONAL HEAD +44 20 7861 1219alastair.graham-campbell @knightfrank.com
The Knight Frank regional team is market leading, offering expertise across all property sectors throughout the UK.
REGI
ONAL
CONT
ACTS
UK REGIONAL CITIES REVIEW 2018
The M25 Report 2017
THE M25 REPORT
For the latest news, views and analysisof the commercial property market, visitknightfrankblog.com/commercial-briefing/
COMMERCIAL BRIEFING
Important Notice
© Knight Frank LLP 2018 – This report is published for general information only and not to be relied upon in any way. Although high standards have been used in the preparation of the information, analysis, views and projections presented in this report, no responsibility or liability whatsoever can be accepted by Knight Frank LLP for any loss or damage resultant from any use of, reliance on or reference to the contents of this document. As a general report, this material does not necessarily represent the view of Knight Frank LLP in relation to particular properties or projects. Reproduction of this report in whole or in part is not allowed without prior written approval of Knight Frank LLP to the form and content within which it appears. Knight Frank LLP is a limited liability partnership registered in England with registered number OC305934. Our registered office is 55 Baker Street, London, W1U 8AN, where you may look at a list of members’ names.
Knight Frank Commercial Research provides strategic advice, consultancy services and forecasting to a wide range of clients worldwide including developers, investors, funding organisations, corporate institutions and the public sector. All our clients recognise the need for expert independent advice customised to their specific needs.
RECENT MARKET-LEADING RESEARCH PUBLICATIONS
Knight Frank Research Reports are available at KnightFrank.com/Research
Global Cities Report - 2018
GL
OB
AL
CIT
IES
THE 2018 REPORT
4th EditionNGKF.COM/GLOBALCITIES
KNIGHTFRANK.COM/GLOBALCITIES
ELON MUSK
THE FUTURE OF REAL ESTATE
TRAINS, ROCKETS & SOLAR ENERGY
THE TRENDS SHAPING 40 LEADING CITIES
The London Report 2018
Knight Frank The Birmingham Report
1
THE
REPORT
The Birmingham Report 2017