UK Pay Gap Report - allenovery.com Pay Gap Report 2018l.pdf · allenovery.com 3 Building a more...
12
UK Pay Gap Report 2018 allenovery.com
Transcript of UK Pay Gap Report - allenovery.com Pay Gap Report 2018l.pdf · allenovery.com 3 Building a more...

UK Pay Gap Report 2018
allenovery.com

© Allen & Overy LLP 2018
2 | UK Pay Gap Report 2018

allenovery.com
3
Building a more gender-balanced and diverse workforce is one of our five strategic business priorities. Full transparency about our actions, challenges and progress is central to achieving this, so we are extending what we cover in our pay gap report from this year onwards.
We will now publish our pay gap figures in September each year, following the preparation of our annual financial accounts, so that the data we report is relevant and timely. Our report will cover:
– Gender pay gap for UK partners
– Combined pay gaps for all UK partners and employees, for both gender and ethnicity
– Gender pay gap (in line with regulatory requirements1) for our London office
– Gender pay gap for our Belfast office
Key findings for 2018
– Our overall headline gender pay gap for London employees is relatively unchanged from last year.
– Including partners in a combined gender pay gap figure increases our pay gap in favour of men, as expected, as we have a much higher proportion of men in our partnership.
– In the lower to upper-middle pay quartiles in London there is no material gender pay gap. In 2018 the gender pay gap favours women in those quartiles.
– The pay gaps for partners, senior lawyers and the upper pay quartile in London have all reduced in 2018.
– In Belfast, there is no material gender pay gap in any of the pay quartiles.
While we are moving in the right direction in narrowing the gender pay gap for partners, senior lawyers and those in our upper pay quartile in London, any gender pay gaps tell us there is still work to do. At the start of 2018, we introduced a new gender strategy with more ambitious targets for promoting women to our partnership.
We have also been looking more closely at the day-to-day experiences of our women in the knowledge that this has the greatest impact on whether they choose to stay with us and, if they do, whether they make the progress they should. As well as supporting women’s personal development, we’re focusing on how work and other opportunities are allocated, how we support different styles and patterns of working, and how – by supporting both men and women to be the kind of parents they want to be – we build a culture where family responsibilities can be shared equally.
We rely on our people to report their ethnicity data and have worked hard over the past year to build a fuller picture of our Black, Asian and Minority Ethnic (BAME) population. We now have ethnicity data for over 90% of our UK population – a high figure which helps inform our work in this area. We have launched a race and ethnicity network to build greater awareness and inclusion, and to actively promote visible BAME role models. We will continue our work to grow the representation of BAME colleagues at the most senior levels of A&O, and will report on our ethnicity pay gap figures each year to drive action.
Building gender balance and diversity
1In accordance with the Equality Act 2010 (Gender Pay Gap Information) Regulations 2017 (the regulations).
Sasha Hardman Global HR Director
Published 6 September 2018

| UK Pay Gap Report 2018
© Allen & Overy LLP 2018
4
1.Combined employee and partner pay gapsThis year, we are reporting the gender and ethnicity pay gaps for our combined UK partner and employee population in our London and Belfast offices. At the time of publication, this is outside the scope of the regulations so there is no guideline for preparing this calculation. Partners are remunerated differently from employees so the most accurate way for us to calculate the combined gender and ethnicity pay gaps is to look at the total annual earnings of all UK partners and the total annual FTE (full-time equivalent) earnings of our UK employees. This is done on an annual rather than hourly basis as partners are paid through a share of the firm’s profits rather than a basic salary (our gender pay gap for employees, as required under the regulations, is covered in section 2).
2018 2017Mean 61.2% 65.0%Median 39.0% 42.1%
Our overall gender pay gap is more pronounced when we include our partners because we have a much higher proportion of men than women in our partnership, as well as a higher number of men in the most senior partner positions.
We are focused on reducing this year on year and know that achieving real progress relies on improving the gender balance at the most senior levels of our business.
When we look at the gender balance and gender pay gap of our UK workforce by role type, the gap is much smaller.
We have no material mean gender pay gap for our Senior Lawyers, Lawyers and Professional Support Staff. Our overall partner gender pay gap of 15.9% in 2018 is explained by the higher representation of men at the more senior levels of our partnership. Having significantly more men in our partnership, and at the more senior levels, has the effect of bringing the median pay figure down for our women partners.
While the overall pay gap for our Senior Professional Support Staff is 23.1%, the median pay gap is -4.7%. This is because we have more women in this group than men and women are less well represented at the most senior levels of this group. The median pay gap for our Professional Support Staff is driven by the fact that two-thirds of this population are women.
Gender
Our overall combined UK partner and employee gender pay gap is:
Proportion of men in groupProportion of women in groupMean pay gap Median pay gap
0
20
40
60
80
100
20172018 20172018 20172018 20172018 20172018
Partners Senior Lawyers Lawyers Senior ProfessionalSupport Staff
ProfessionalSupport Staff
20%
80%
20%
80%
46%
54%
47%
53%
51%
49%
51%
49% 41.5%
58.5%60.1%
38.9%
19.7% 7.0% -4.9% 22.6%15.9% 2.6% 0.92% 23.8%20.0% 7.7% -0.8% -5.0% -11.4%23.5% 5.8% 0% -4.7% -12.2%
32%
68%
33%
67%
-1.7%-0.7%
0
20
40
60
80
100
20172018 20172018 20172018 20172018 20172018
Partners Senior Lawyers Lawyers Senior ProfessionalSupport Staff
ProfessionalSupport Staff
20%
80%
20%
80%
46%
54%
47%
53%
51%
49%
51%
49% 41%
59%60%
40%
19.7% 7.0% -4.9% 22.6%15.9% 2.6% 0.9% 23.8%20.0% 7.7% -0.8% -5.0% -11.4%23.5% 5.8% 0.0% -4.7% -12.2%
32%
68%
33%
67%
-1.7%-0.7%
0
20
40
60
80
100
20172018 20172018 20172018 20172018 20172018
Partners Senior Lawyers Lawyers Senior ProfessionalSupport Staff
ProfessionalSupport Staff
20%
80%
20%
80%
46%
54%
47%
53%
51%
49%
51%
49% 41.5%
58.5%60.1%
38.9%
19.7% 7.0% -4.9% 22.6%15.9% 2.6% 0.92% 23.8%20.0% 7.7% -0.8% -5.0% -11.4%23.5% 5.8% 0% -4.7% -12.2%
32%
68%
33%
67%
-1.7%-0.7%
Definitions at a glance
Total annual FTE earnings: FTE salary, FTE bonus, firm pension contributions and other benefits the firm pays for on behalf of our employees.
Negative pay gap (-%): A negative percentage figure in this section indicates a pay gap in favour of women.
Mean: The difference between the mean (average) total annual earnings for all UK partners and staff in Belfast and London, for men and women.
Median: The difference between the ‘middle’ rate of pay for all men and the ‘middle’ rate of pay for all women, when total annual earnings are ranked in numerical order.

allenovery.com
5
2018 2017Mean 21.6% 22.8%Median -26.8% -14.9%
As the size of the two populations (BAME and non-BAME) differs so significantly, very small workforce composition changes can cause a large change to the overall mean and median ethnicity pay gap. When we look at the mean and median ethnicity pay gap by group, the gap is much smaller. As part of our wider diversity strategy, we are working to grow the representation of BAME employees across our business and particularly in senior positions.
Ethnicity
In order to understand and improve the diversity of our business more widely, we will report on our ethnicity pay gap each year.
Currently, 14% of our UK partner and employee population are Black, Asian or Minority Ethnic (BAME) – based on those who have reported their ethnicity. This is up from 12.8% in 2017.
Our overall combined ethnicity pay gap is:
Definitions at a glance
BAME: Partners and employees who have reported their ethnicity as Black, Asian or Minority Ethnic.
Ethnicity pay gap: The difference in average total annual earnings between our non-BAME employees and partners and our BAME employees and partners in London and Belfast.
Negative pay gap (-%): A negative percentage figure in this section indicates a pay gap in favour of BAME employees and partners.
Mean: The difference between the mean (average) total annual earnings for BAME and non-BAME UK partners and employees in Belfast and London.
Median: The difference between the ‘middle’ rate of pay for all BAME and the ‘middle’ rate of pay for all non-BAME employees and partners, when total annual earnings are ranked in numerical order.
Mean pay gap Median pay gap
Partners
2018
2017
3.5% 11.7%
-4.5% -8.8%
London employees
2018
2017
8.9% 12.3%
10.3% 20.8%
Belfast employees
2018
2017
11.0% -0.78%
-2.6% -3.1%

| UK Pay Gap Report 2018
© Allen & Overy LLP 2018
6
2. Employee gender pay gap – LondonIn accordance with the regulations, our gender pay gap is the difference between the average hourly pay for all male and all female employees in London2, regardless of their role or seniority. The gender pay gap is not a comparison of how much we pay men and women in the same or similar roles and is therefore not a report on equal pay.
Our mean and median gender pay gap as at 5 April 2018 (compared to 2017):
Hourly gender pay gap
2018 2017Mean 20.0% 19.8%Median 32.8% 27.4%
Definitions at a glance
Mean: The difference between the mean (average) hourly rate of pay (or bonus) for all men and all women.
Median: The difference between the ‘middle’ rate of pay (or bonus) for all men and the ‘middle’ rate of pay (or bonus) for all women, when hourly pay is ranked in numerical order.
Our gender pay gap continues to reflect the composition of our workforce. As was the case last year, over 25% of our people in London are women in business support (administrative) roles.
On a pay quartile basis, we have no material gender pay gap in our lower to upper-middle pay quartiles, and have seen a reduction in the pay gap of our upper quartile. While our overall gender pay gap has widened marginally between 2017 and 2018, this is attributed to the changing composition of our workforce each year.
Hourly pay gap quartiles Proportion of men in pay quartileProportion of women in pay quartile
While we are pleased about narrowing the gender pay gap in the upper quartile, we are aware that the gender pay gap for this quartile is driven by the wide variety of roles and levels of seniority. We will continue to work towards improving the representation of women in the most senior levels within our business.
The employee population in our upper pay quartile is the most diverse in terms of seniority and role type and ranges from Associates to Counsel and Senior Managers to Directors.
Lower
2017 20172017 2017
Lower Middle Upper Middle Upper
29%
71%
37%
63%
47%
53%
48%
52%
-1.1% 0.5% 13.5%
2018 20182018 2018
27%
73%
38%
62%
43%
57%
50%
50%
Mean gender pay gap-7.8%
-0.7% 1.1% 10.9%
Mean genderpay gap-4.9%
2For the avoidance of doubt, partners are not included in this population.
allenovery.com
7
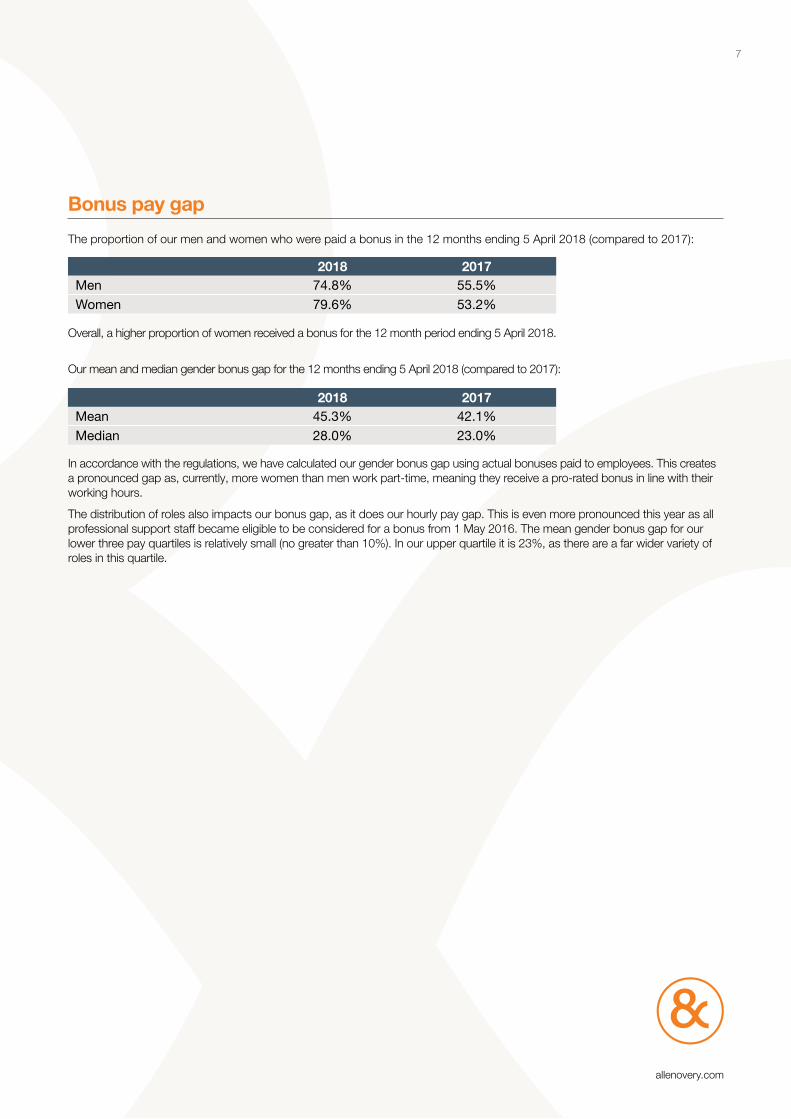
Bonus pay gap
2018 2017Men 74.8% 55.5%Women 79.6% 53.2%
The proportion of our men and women who were paid a bonus in the 12 months ending 5 April 2018 (compared to 2017):
Overall, a higher proportion of women received a bonus for the 12 month period ending 5 April 2018.
Our mean and median gender bonus gap for the 12 months ending 5 April 2018 (compared to 2017):
2018 2017Mean 45.3% 42.1%Median 28.0% 23.0%
In accordance with the regulations, we have calculated our gender bonus gap using actual bonuses paid to employees. This creates a pronounced gap as, currently, more women than men work part-time, meaning they receive a pro-rated bonus in line with their working hours.
The distribution of roles also impacts our bonus gap, as it does our hourly pay gap. This is even more pronounced this year as all professional support staff became eligible to be considered for a bonus from 1 May 2016. The mean gender bonus gap for our lower three pay quartiles is relatively small (no greater than 10%). In our upper quartile it is 23%, as there are a far wider variety of roles in this quartile.
Hourly pay gap quartiles Proportion of men in pay quartileProportion of women in pay quartile
| UK Pay Gap Report 2018
© Allen & Overy LLP 2018
8
26%
74%
40%
60%
52%
48%
54%
46%
Mean gender pay gap-1.7%
1.0% -1.5% 1.3%
Lower Lower Middle Upper Middle Upper
29%
71%
39%
61%
54%
46%
54%
46%
Mean gender pay gap0.5%
1.7% 3.6% 2.0%
2017 20172017 2017
2018 20182018 2018
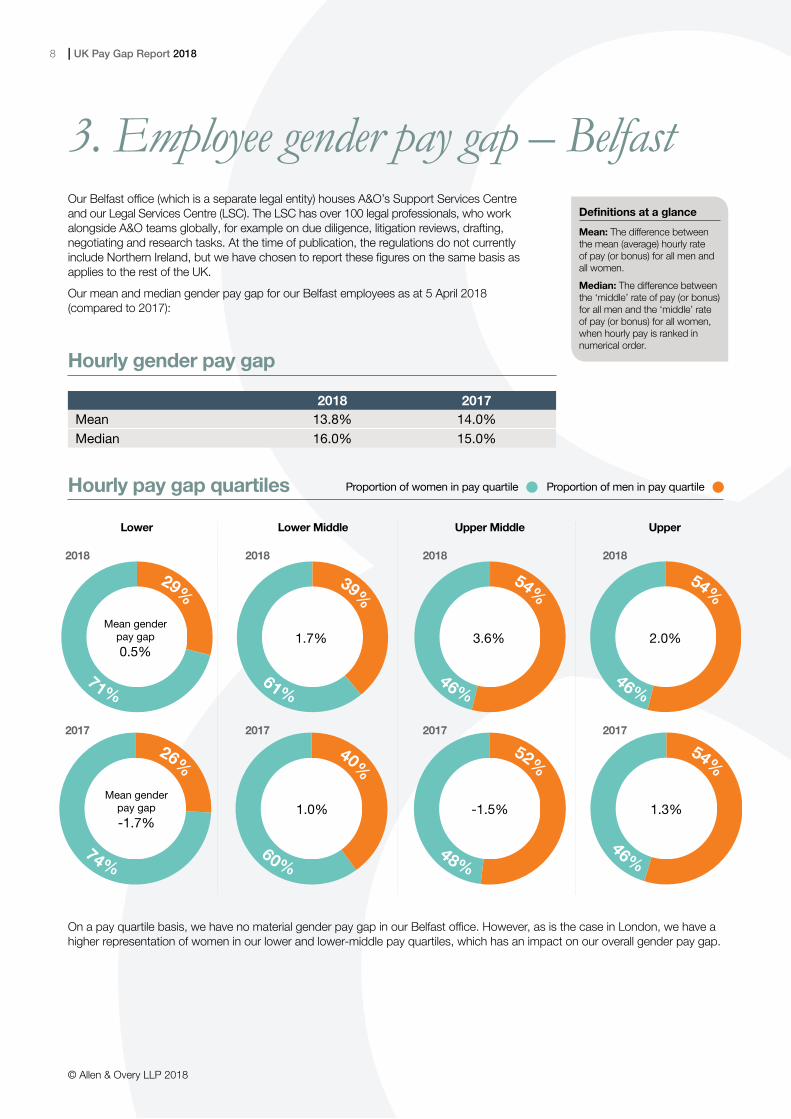
On a pay quartile basis, we have no material gender pay gap in our Belfast office. However, as is the case in London, we have a higher representation of women in our lower and lower-middle pay quartiles, which has an impact on our overall gender pay gap.
Hourly gender pay gap
2018 2017Mean 13.8% 14.0%Median 16.0% 15.0%
3. Employee gender pay gap – BelfastOur Belfast office (which is a separate legal entity) houses A&O’s Support Services Centre and our Legal Services Centre (LSC). The LSC has over 100 legal professionals, who work alongside A&O teams globally, for example on due diligence, litigation reviews, drafting, negotiating and research tasks. At the time of publication, the regulations do not currently include Northern Ireland, but we have chosen to report these figures on the same basis as applies to the rest of the UK.
Our mean and median gender pay gap for our Belfast employees as at 5 April 2018 (compared to 2017):
Definitions at a glance
Mean: The difference between the mean (average) hourly rate of pay (or bonus) for all men and all women.
Median: The difference between the ‘middle’ rate of pay (or bonus) for all men and the ‘middle’ rate of pay (or bonus) for all women, when hourly pay is ranked in numerical order.

Bonus pay gap
2018 2017Men 64.2% 32.1%Women 69.4% 35.6%
The proportion of our men and women who were paid a bonus in Belfast in the 12 months ending 5 April 2018 (compared to 2017):
Overall a higher proportion of our women received a bonus for the period ending 5 April 2018.
Our mean and median gender bonus gap for the 12 months ending 5 April 2018 (compared to 2017):
2018 2017Mean 53.1% 55.2%Median 31.5% 42.0%
As with London, the bonus pay gap has been calculated in accordance with the regulations by using actual bonuses. This creates a pronounced gap as currently more women than men in our Belfast office work part-time, meaning they receive a pro-rated bonus in line with their working hours. The distribution of roles also impacts our bonus gap, as it does our hourly pay gap.
allenovery.com
9

© Allen & Overy LLP 2018
10 | UK Pay Gap Report 2018
Changing practices and behaviours that have existed around the world for decades is hard, but we have to work every day to do just that. We have to address diversity and gender balance right at the top of our business by really committing to change – by introducing targets and holding ourselves accountable for them, and by measuring progress all the time. And we have to address diversity at the bottom by understanding where the barriers really are (not where we’ve assumed they are for years) and by challenging out-dated perceptions and practices when we see them in the daily realities here – whether that’s checking biases and assumptions, or providing better emergency childcare and hub offices to reduce commuting times.
When Andrew Ballheimer and I took office in 2016, we made diversity and inclusion one of our top five business priorities because we genuinely believe it’s an area that needs more action if we are to stay at the top of our field. We had a very open debate about this at our global partners’ conference this year, and know we need to look harder for and support diverse talent wherever it exists – not just assume the best people will always make it to the top.
Over the coming years, we will continue building on the work that’s already going on across our network. We are determined to see more change happening, particularly among the partnership and other senior positions – and not just in the UK but right across our business. This is how, we believe, we will start to lower pay gaps wherever they exist and really create a diverse and well-balanced organisation.
Committing to change
Wim Dejonghe Senior Partner

allenovery.com
11

allenovery.com
© Allen & Overy LLP 2018 | CS1807_CDD-51895_ADD-77080
Allen & Overy means Allen & Overy LLP and/or its affiliated undertakings. The term partner is used to refer to a member of Allen & Overy LLP or an employee or consultant with equivalent standing and qualifications or an individual with equivalent status in one of Allen & Overy LLP’s affiliated undertakings.
GLOBAL PRESENCE
Allen & Overy is an international legal practice with approximately 5,500 people, including some 550 partners, working in 44 offi ces worldwide. Allen & Overy LLP or an affi liated undertaking has an offi ce in each of:
Abu DhabiAmsterdamAntwerpBangkokBarcelonaBeijingBelfastBratislavaBrussels
Bucharest (associated offi ce)
BudapestCasablancaDohaDubaiDüsseldorfFrankfurtHamburgHanoi
Ho Chi Minh CityHong KongIstanbulJakarta (associated offi ce)
JohannesburgLondonLuxembourgMadridMilan
MoscowMunich New YorkParisPerthPragueRiyadh (cooperation offi ce)
RomeSão Paulo
SeoulShanghaiSingaporeSydneyTokyoWarsawWashington, D.C.Yangon