
UK Office Rents: Benchmarking 165 Centres - JLL Office Rents Benchmark - June 2010 UK Office Rents:...
9
UK Office Rents Benchmark - June 2010 UK Office Rents: Benchmarking 165 Centres The UK Office Rents report is a national guide to prime rents. It provides comparisons of the rental levels currently achievable (ERVs) and the incentives on offer in over 165 major towns and cities of England, Wales, Scotland and Northern Ireland. With unrivalled national coverage this report provides vital tools for corporate and landlord clients alike.
Transcript of UK Office Rents: Benchmarking 165 Centres - JLL Office Rents Benchmark - June 2010 UK Office Rents:...
UK Office Rents Benchmark - June 2010
UK Office Rents: Benchmarking 165 Centres
The UK Office Rents report is a national guide to prime rents. It provides comparisons of the rental levels currently achievable (ERVs) and the incentives on offer in over 165 major towns and cities of England, Wales, Scotland and Northern Ireland.
With unrivalled national coverage this report provides vital tools for corporate and landlord clients alike.
2 On Point • UK Office Rents Benchmark • June 2010
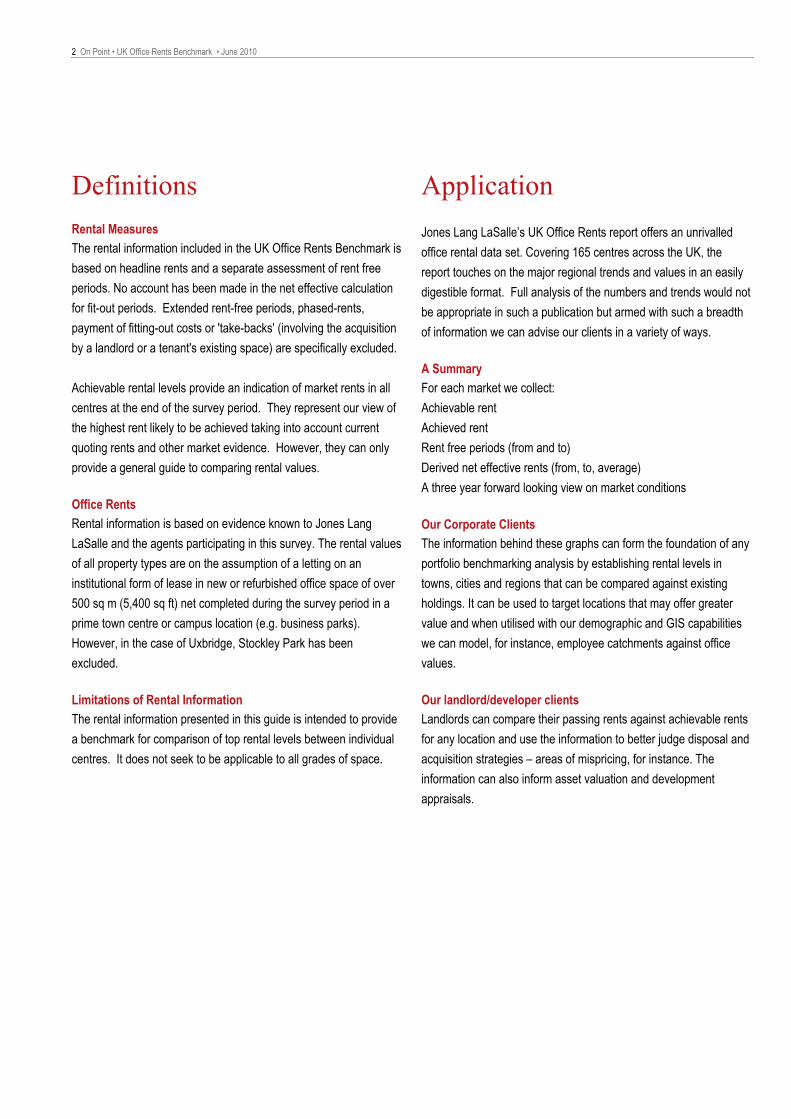
Definitions Rental Measures The rental information included in the UK Office Rents Benchmark is based on headline rents and a separate assessment of rent free periods. No account has been made in the net effective calculation for fit-out periods. Extended rent-free periods, phased-rents, payment of fitting-out costs or 'take-backs' (involving the acquisition by a landlord or a tenant's existing space) are specifically excluded.
Achievable rental levels provide an indication of market rents in all centres at the end of the survey period. They represent our view of the highest rent likely to be achieved taking into account current quoting rents and other market evidence. However, they can only provide a general guide to comparing rental values.
Office Rents Rental information is based on evidence known to Jones Lang LaSalle and the agents participating in this survey. The rental values of all property types are on the assumption of a letting on an institutional form of lease in new or refurbished office space of over 500 sq m (5,400 sq ft) net completed during the survey period in a prime town centre or campus location (e.g. business parks). However, in the case of Uxbridge, Stockley Park has been excluded.
Limitations of Rental Information The rental information presented in this guide is intended to provide a benchmark for comparison of top rental levels between individual centres. It does not seek to be applicable to all grades of space.
Application Jones Lang LaSalle’s UK Office Rents report offers an unrivalled office rental data set. Covering 165 centres across the UK, the report touches on the major regional trends and values in an easily digestible format. Full analysis of the numbers and trends would not be appropriate in such a publication but armed with such a breadth of information we can advise our clients in a variety of ways.
A Summary For each market we collect: Achievable rent Achieved rent Rent free periods (from and to) Derived net effective rents (from, to, average) A three year forward looking view on market conditions
Our Corporate Clients The information behind these graphs can form the foundation of any portfolio benchmarking analysis by establishing rental levels in towns, cities and regions that can be compared against existing holdings. It can be used to target locations that may offer greater value and when utilised with our demographic and GIS capabilities we can model, for instance, employee catchments against office values.
Our landlord/developer clients Landlords can compare their passing rents against achievable rents for any location and use the information to better judge disposal and acquisition strategies – areas of mispricing, for instance. The information can also inform asset valuation and development appraisals.
On Point • UK Office Rents Benchmark • June 2010 3
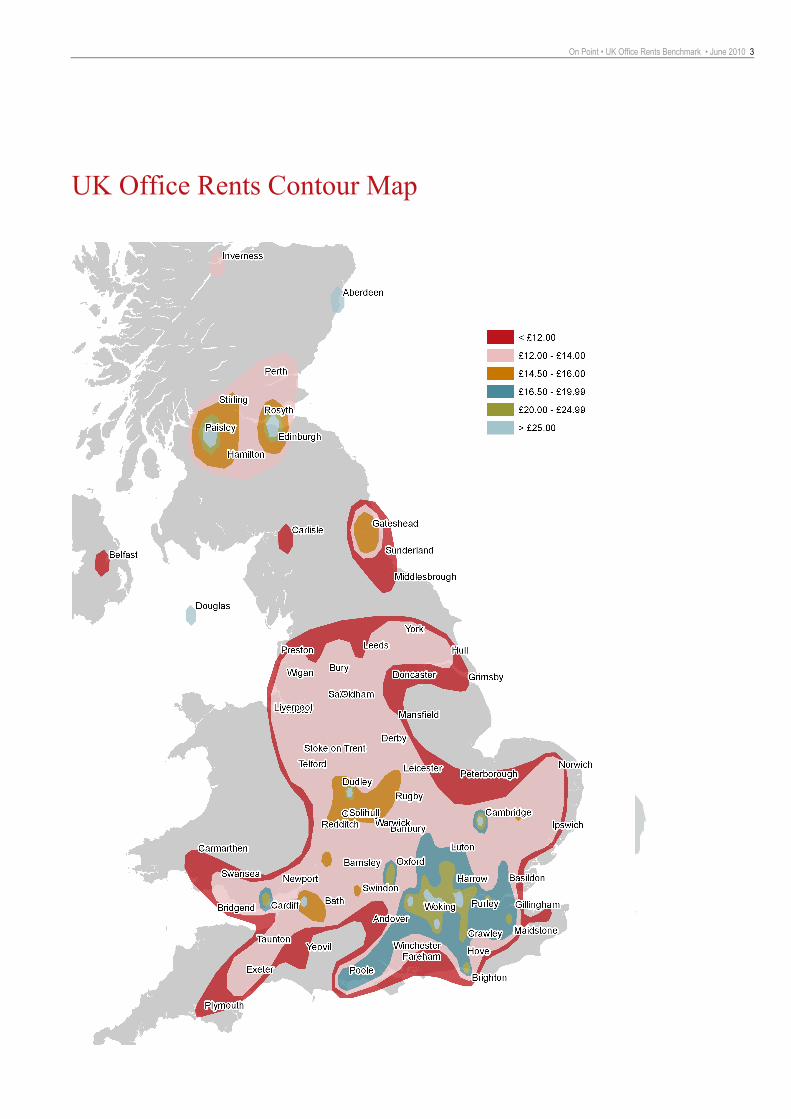
UK Office Rents Contour Map
4 On Point • UK Office Rents Benchmark • June 2010
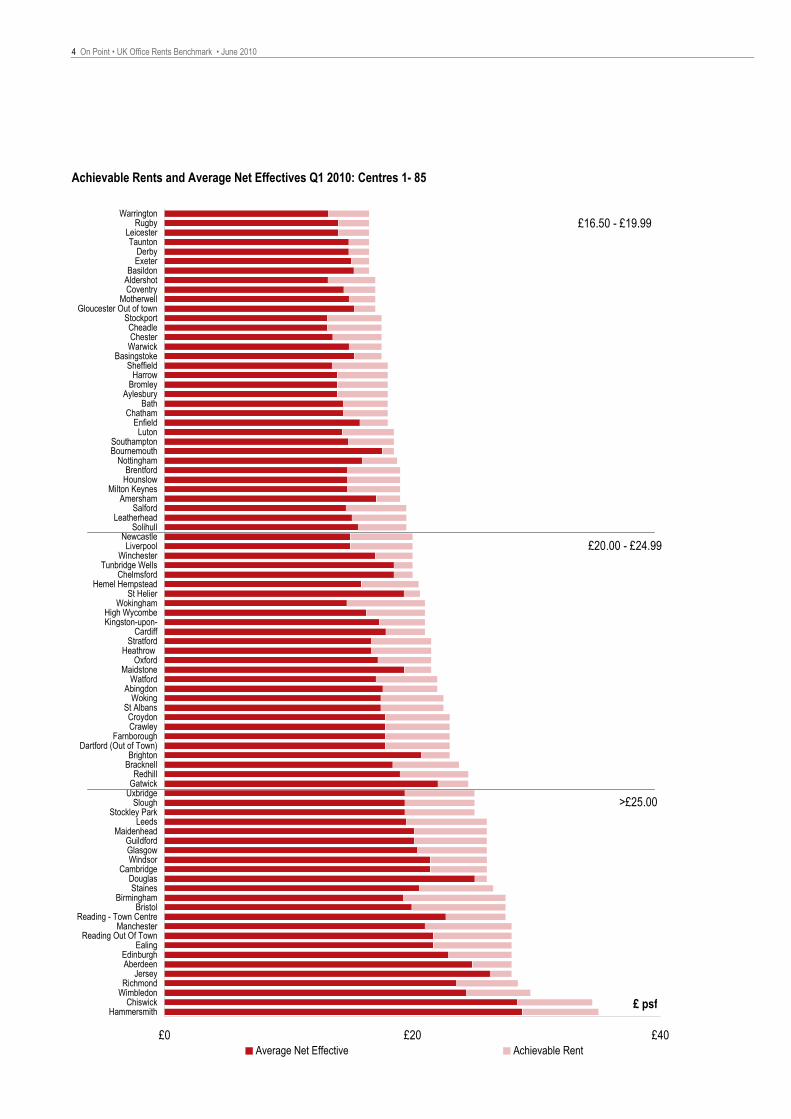
Achievable Rents and Average Net Effectives Q1 2010: Centres 1- 85
£0 £20 £40
HammersmithChiswick
WimbledonRichmond
JerseyAberdeenEdinburgh
EalingReading Out Of Town
ManchesterReading - Town Centre
BristolBirmingham
StainesDouglas
CambridgeWindsorGlasgowGuildford
MaidenheadLeeds
Stockley ParkSlough
UxbridgeGatwickRedhill
BracknellBrighton
Dartford (Out of Town)Farnborough
CrawleyCroydon
St AlbansWoking
AbingdonWatford
MaidstoneOxford
Heathrow Stratford
CardiffKingston-upon-High Wycombe
WokinghamSt Helier
Hemel HempsteadChelmsford
Tunbridge WellsWinchester
LiverpoolNewcastle
SolihullLeatherhead
SalfordAmersham
Milton KeynesHounslowBrentford
NottinghamBournemouthSouthampton
LutonEnfield
ChathamBath
AylesburyBromleyHarrow
SheffieldBasingstoke
WarwickChesterCheadle
StockportGloucester Out of town
MotherwellCoventryAldershotBasildon
ExeterDerby
TauntonLeicester
RugbyWarrington
Average Net Effective Achievable Rent
£16.50 - £19.99
£20.00 - £24.99
>£25.00
£ psf
On Point • UK Office Rents Benchmark • June 2010 5
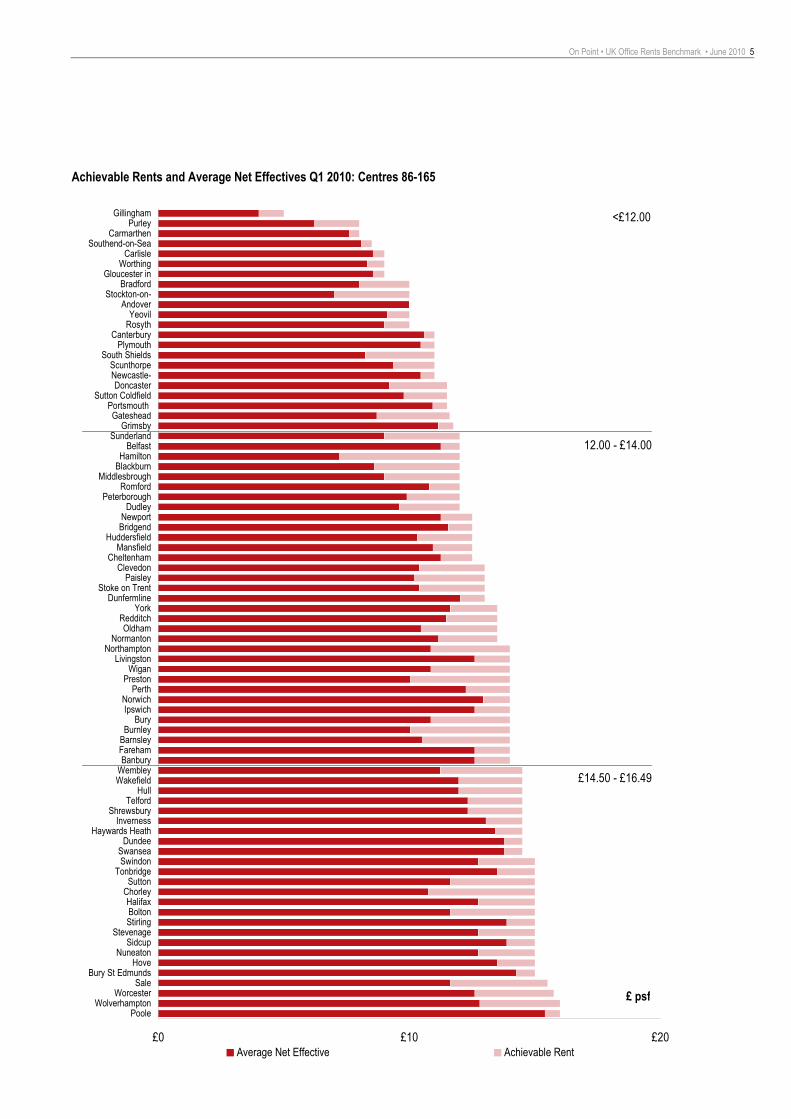
Achievable Rents and Average Net Effectives Q1 2010: Centres 86-165
£0 £10 £20
PooleWolverhampton
WorcesterSale
Bury St EdmundsHove
NuneatonSidcup
StevenageStirlingBoltonHalifax
ChorleySutton
TonbridgeSwindon
SwanseaDundee
Haywards HeathInverness
ShrewsburyTelford
HullWakefieldWembleyBanbury
FarehamBarnsleyBurnley
BuryIpswichNorwich
PerthPreston
WiganLivingston
NorthamptonNormanton
OldhamRedditch
YorkDunfermline
Stoke on TrentPaisley
ClevedonCheltenham
MansfieldHuddersfield
BridgendNewport
DudleyPeterborough
RomfordMiddlesbrough
BlackburnHamilton
BelfastSunderland
GrimsbyGateshead
Portsmouth Sutton Coldfield
DoncasterNewcastle-Scunthorpe
South ShieldsPlymouth
CanterburyRosythYeovil
AndoverStockton-on-
BradfordGloucester in
WorthingCarlisle
Southend-on-SeaCarmarthen
PurleyGillingham
Average Net Effective Achievable Rent
<£12.00
12.00 - £14.00
£14.50 - £16.49
£ psf
6 On Point • UK Office Rents Benchmark • June 2010
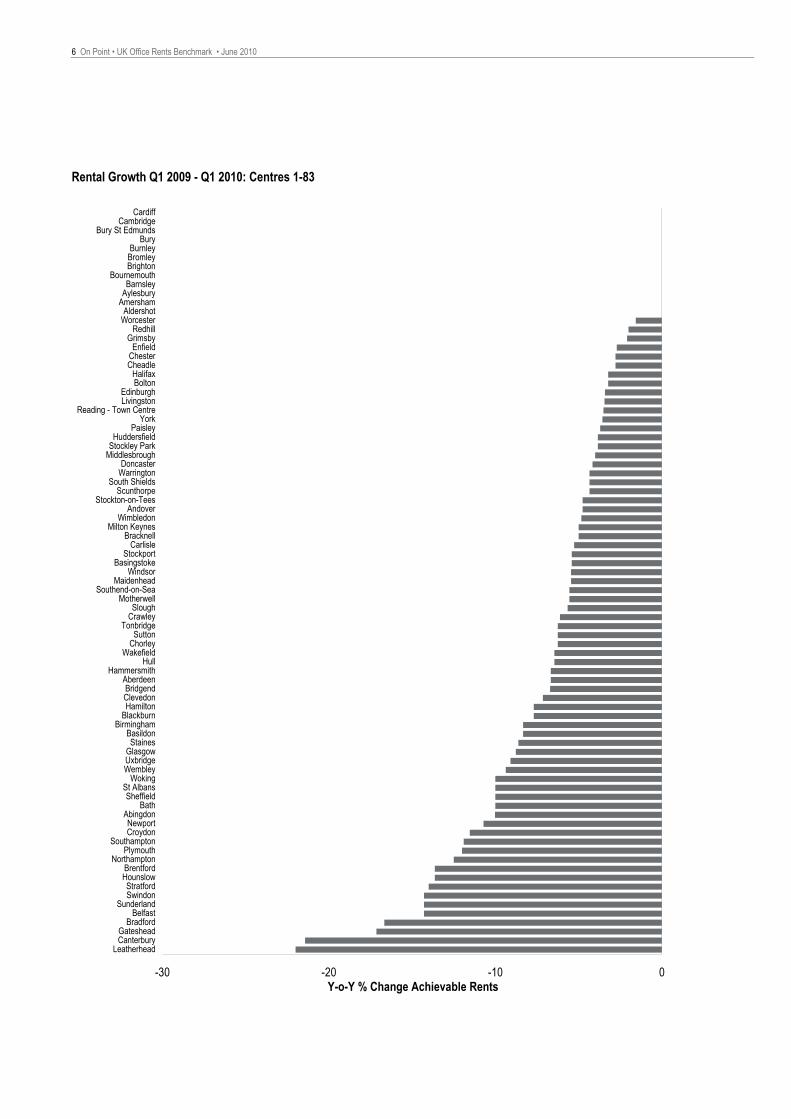
Rental Growth Q1 2009 - Q1 2010: Centres 1-83
Y-o-Y % Change Achievable Rents-30 -20 -10 0
LeatherheadCanterburyGateshead
BradfordBelfast
SunderlandSwindonStratford
HounslowBrentford
NorthamptonPlymouth
SouthamptonCroydonNewport
AbingdonBath
SheffieldSt Albans
WokingWembleyUxbridgeGlasgow
StainesBasildon
BirminghamBlackburnHamiltonClevedonBridgend
AberdeenHammersmith
HullWakefield
ChorleySutton
TonbridgeCrawleySlough
MotherwellSouthend-on-Sea
MaidenheadWindsor
BasingstokeStockport
CarlisleBracknell
Milton KeynesWimbledon
AndoverStockton-on-Tees
ScunthorpeSouth Shields
WarringtonDoncaster
MiddlesbroughStockley ParkHuddersfield
PaisleyYork
Reading - Town CentreLivingstonEdinburgh
BoltonHalifax
CheadleChesterEnfield
GrimsbyRedhill
WorcesterAldershot
AmershamAylesburyBarnsley
BournemouthBrightonBromleyBurnley
BuryBury St Edmunds
CambridgeCardiff
On Point • UK Office Rents Benchmark • June 2010 7
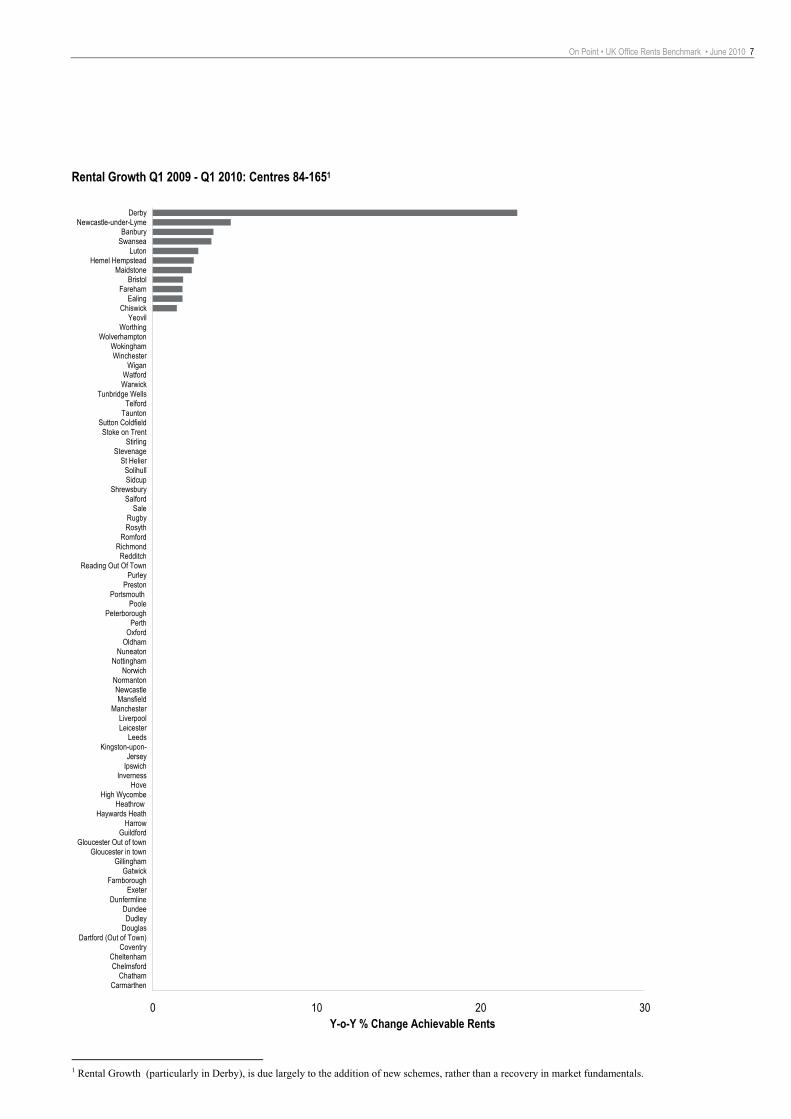
Rental Growth Q1 2009 - Q1 2010: Centres 84-1651
Y-o-Y % Change Achievable Rents0 10 20 30
CarmarthenChatham
ChelmsfordCheltenham
CoventryDartford (Out of Town)
DouglasDudley
DundeeDunfermline
ExeterFarnborough
GatwickGillingham
Gloucester in townGloucester Out of town
GuildfordHarrow
Haywards HeathHeathrow
High WycombeHove
InvernessIpswichJersey
Kingston-upon-Leeds
LeicesterLiverpool
ManchesterMansfield
NewcastleNormanton
NorwichNottingham
NuneatonOldhamOxford
PerthPeterborough
PoolePortsmouth
PrestonPurley
Reading Out Of TownRedditch
RichmondRomford
RosythRugby
SaleSalford
ShrewsburySidcupSolihull
St HelierStevenage
StirlingStoke on Trent
Sutton ColdfieldTaunton
TelfordTunbridge Wells
WarwickWatford
WiganWinchester
WokinghamWolverhampton
WorthingYeovil
ChiswickEaling
FarehamBristol
MaidstoneHemel Hempstead
LutonSwanseaBanbury
Newcastle-under-LymeDerby
1 Rental Growth (particularly in Derby), is due largely to the addition of new schemes, rather than a recovery in market fundamentals.
8 On Point • UK Office Rents Benchmark • June 2010
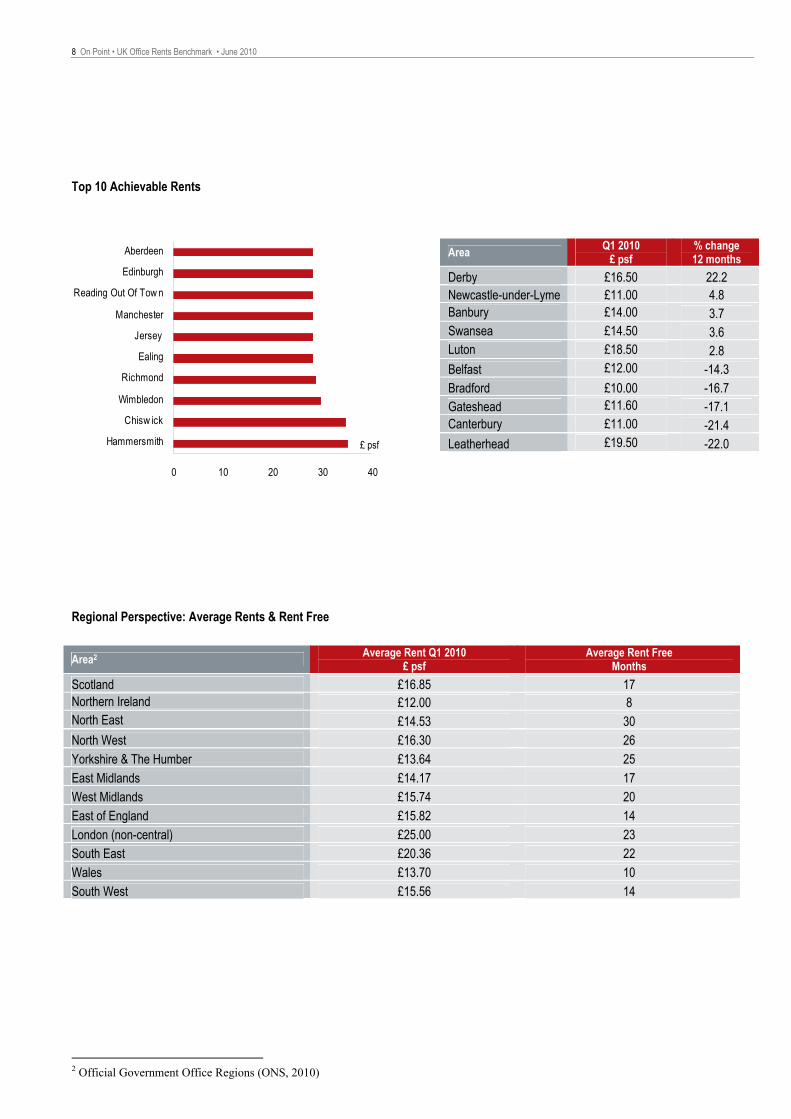
Top 10 Achievable Rents
Regional Perspective: Average Rents & Rent Free
2 Official Government Office Regions (ONS, 2010)
Area Q1 2010 £ psf
% change 12 months
Derby £16.50 22.2 Newcastle-under-Lyme £11.00 4.8 Banbury £14.00 3.7 Swansea £14.50 3.6 Luton £18.50 2.8 Belfast £12.00 -14.3 Bradford £10.00 -16.7 Gateshead £11.60 -17.1 Canterbury £11.00 -21.4 Leatherhead £19.50 -22.0
Area2 Average Rent Q1 2010 £ psf
Average Rent Free Months
Scotland £16.85 17 Northern Ireland £12.00 8 North East £14.53 30 North West £16.30 26 Yorkshire & The Humber £13.64 25 East Midlands £14.17 17 West Midlands £15.74 20 East of England £15.82 14 London (non-central) £25.00 23 South East £20.36 22 Wales £13.70 10 South West £15.56 14
0 10 20 30 40
Hammersmith
Chisw ick
Wimbledon
Richmond
Ealing
Jersey
Manchester
Reading Out Of Tow n
Edinburgh
Aberdeen
£ psf
Business Contacts
James Finnis Head of National Offices National Offices Stockley Park +44 (0) 7788 188 863 [email protected]
Tom Bayne-Jardine Head of UK Corporate Accounts Corporate Accounts London West End +44 (0) 207 399 5496 [email protected]
James Nicholson Surveyor National Offices London West End +44 (0) 20 7399 5478 [email protected]
Regional Contacts
Jeff Pearey Director - Head of Leeds Office National Offices - Leeds Leeds +44 (0) 113 261 6236 [email protected]
Trevor Sloan Director National Offices - Manchester Manchester +44 (0) 161 828 6430 [email protected]
Jonathan Fear Director National Offices - Birmingham Birmingham +44 (0) 121 634 6564 [email protected]
Cameron Stott Director Edinburgh Agency Edinburgh +44 (0) 131 301 6715 [email protected]
Mike Buchan Director Glasgow Agency Glasgow +44 (0) 141 567 6623 [email protected]
Research Contacts
Karen Williamson Research Analyst EMEA Research Canary Wharf +44 (0) 203 147 1197 [email protected]
Bill Page Head of EMEA Offices Research EMEA Research Canary Wharf +44 (0) 203 147 1212 [email protected]
UK Office Rents Benchmark – June 2010 OnPoint reports from Jones Lang LaSalle include quarterly and annual highlights of real estate activity, performance and specialised surveys and forecasts that uncover emerging trends.
www.joneslanglasalle.co.uk
COPYRIGHT © JONES LANG LASALLE IP, INC. 2010. All rights reserved. No part of this publication may be reproduced or transmitted in any form or by any means without prior written consent of Jones Lang LaSalle. It is based on material that we believe to be reliable. Whilst every effort has been made to ensure its accuracy, we cannot offer any warranty that it contains no factual errors. We would like to be told of any such errors in order to correct them.
Acknowledgements: We gratefully acknowledge the help and assistance of the following firms and organisations in the preparation of this material: Alder King, Caxtons, Elsom Spettigue Associates, Garner Wood, Goadsby, John Ryde Commercial, Kemsleys, King Sturge, Linnells, London Clancy, Rowland Jones & Partners, Percy Howes Commercial, Savills, Sibley Pares & Partners, Stiles Harold Williams, Stratton Creber Commerical, Thompsons, Vail Williams


