UK Economic Outlook March 2020 - Global pandemic · growth 38 Current outlook ... to demand, as...
48
Global pandemic UK Economic Outlook Special focus UK gilt market New technologies March 2020 kpmg.com/uk/economicoutlook
Transcript of UK Economic Outlook March 2020 - Global pandemic · growth 38 Current outlook ... to demand, as...

Global pandemicUK Economic Outlook
Special focus
UK gilt market
New technologies
March 2020
kpmg.com/uk/economicoutlook

Testing times for the economy
The COVID-19 pandemic is destined to dominate our daily lives over the coming months. Our thoughts are with everyone and foremost with those whose health is likely to be seriously affected and with their loved ones.
The outbreak is set to have a material impact on the global economy, at least in the short term, although it is too early to tell with any certainty how long the impact could last. A lot will depend on when a viable vaccine becomes available and how the pandemic evolves.
Governments around the world are putting measures in place to contain the pandemic and support local people and businesses. More most probably will be needed as the pandemic escalates and essential supplies and finances become increasingly under strain.
The global health crisis puts other things in perspective. Let’s hope that it will encourage the resumption of greater multilateral co-operation, as the world joins forces to find a cure for this pandemic. While the closure of borders shows how fragile free movement can become.
There is a lot to be done once the COVID-19 pandemic is behind us. The UK government has set itself an ambitious objective to ‘level up’ UK regions, making economic prospects across the UK more equal. The Chancellor has allocated sizeable funding for public investment to facilitate that. The challenge will be to spend the money wisely in order to make a genuine and long-lasting difference to weaker regions.
Regional policy will need to be put in the broader context of efforts to raise productivity, successfully integrate new technologies and address climate change. The UK will also need to forge new trade relationships with the EU and its other main trading partners, as the transition period post Brexit ends. These are enormous tasks the government will not be able to deal with alone. We will all need to play our part.
Things are moving very fast, and I will be writing short updates each week. Please get in touch if you’d like to receive them.
Yael Selfin Chief Economist, KPMG in the UK
Economic Outlook Report
2
© 2020 KPMG LLP, a UK limited liability partnership and a member firm of the KPMG network of independent member firms affiliated with KPMG International Cooperative (“KPMG International”), a Swiss entity. All rights reserved.

Executive summary 04
COVID-19 06
The global economic backdrop 08
Our forecast for the UK economy 10
The story so far 16
The new abnormal in the UK government bond market 30
How new technologies could accelerate future growth 38
Current outlook
March 2020
33
© 2020 KPMG LLP, a UK limited liability partnership and a member firm of the KPMG network of independent member firms affiliated with KPMG International Cooperative (“KPMG International”), a Swiss entity. All rights reserved.

Executive summary
— The short-term outlook for the UK and global economy is dominated by the impact of the COVID-19 pandemic. As the number of cases mounts, the global economy will suffer both from the direct impact of the illness and the measures taken to slow its spread.
— Financial markets reacted sharply and adversely as fresh news of the spread of the pandemic exposed the scale of the public health emergency. Worries about liquidity and sector exposure have fuelled drops in both equity prices and bond yields as investors have sought the relative safety of the latter, with recent falls in bond prices amid urgent need to meet redemptions.
— The UK economy cannot escape the impact of the global pandemic, which is set to test the limits of the nation’s health service. In the Budget, the Chancellor promised to provide public services with whatever resources prove to be necessary, with initial funds of £12bn made available. More substantial assistance has been announced since, with very significant help to protect households’ income and businesses’ cash-flow.
— The Bank of England reduced its policy rate by 50 basis points on the day of the Budget, and cut rates further to 0.1% on 19 March.
— In our main scenario, the public health measures around the world stem the rise in the number of cases by summer 2020; in this case, while the economy remains flat in the second half of this year, there will be a sharp recovery in the first half of 2021, as uncertainties around the pandemic dissipate. GDP in the UK would fall by 2.6% in 2020 then grow by 1.7% in 2021.
— In our downside scenario, the pandemic persists until the second half of next year. UK GDP contracts by 5.4% in 2020 and by another 1.4% in 2021, representing a slightly more severe recession than the downturn experienced in 2008-09.
— The pandemic represents a combination of a shock to demand, as social distancing measures and falling consumer confidence reduce the willingness and ability of households to spend; and a shock to supply, as sickness and value chain disruption interrupt production.
— We expect the weakness in demand to pull consumption down by 2.5% in 2020, as social distancing measures take their toll on consumer confidence and limit spending opportunities, before picking up by 1.6% in 2021.
— COVID-19 related disruptions and uncertainty result in investment contracting by 11.2% in 2020 in our main scenario. A recovery from the pandemic should support a pick up in investment with growth of 5.2% in 2021.
— Despite this, we expect the labour market to cope relatively well with the temporary disruption and to avoid mass layoffs; we anticipate the rate of unemployment averaging 4.7% in 2020, falling to 4.1% next year.
— Inflation is also set to stay low, averaging 1.4% in 2020, as weakness in demand combines with falling global oil prices and changes to household energy tariffs over the course of the year.
— Interest rates are expected to stay just above zero, as the Bank of England uses the policy rate to support the economy through the outbreak and the subsequent recovery. This translates into lower market rates and easier financial conditions.
— In addition to the COVID-19 measures, the Budget unveiled an ambitious public investment and spending programme for the next five years. Public investment is set to rise to 3% of GDP by 2022 and from next year, spending on public services will be rising by 2.1% in real term every year.
— Given that extra investment is intended to ‘level up’ the UK economy, the government will need to assess potential projects carefully to ensure the money is spent wisely. The latest data on regional economies points to a continuing outperformance from London and the South East and limited spare capacity; this increases the risk that funds are wasted.
— In our special article we look at the potential technologies that could enable faster productivity growth in the future and the implications for transport and logistics, financial services and manufacturing sectors.
4
Economic Outlook Report
© 2020 KPMG LLP, a UK limited liability partnership and a member firm of the KPMG network of independent member firms affiliated with KPMG International Cooperative (“KPMG International”), a Swiss entity. All rights reserved.

A snapshot of the UK
economy*
Unemployment rate
2019
3.8%
2020
4.7%
2021
4.1%
GDP
1.4%
2019
-2.6%
2020
1.7%
2021
Inflation vs interest rate
0.75%
1.8%
0.10%
1.4%
2019 2020 2021
2.0%
0.25%
Investment
5.2%
2021
2020
-11.2%
2019
0.4%
GDP growth in our main and downside scenarios
Quarter-on-quarter % change
-2.1%
1.1%
0.1% 0.4%
-0.1%
0.4%
-1.2%
1.1%
2020 Q2 2021 Q22020 Q3 2021 Q32020 Q4 2021 Q42020 Q1 2021 Q12020 Q2 2021 Q22020 Q3 2021 Q32020 Q4 2021 Q42020 Q1 2021 Q1
-3.9%
-1.9%
-1.0%
-0.4%
0.4%
2.0% 1.9%
-1.6%
Main scenario
Downside scenario
Consumer spending
2021
1.6%
2019
1.4%
2020
-2.5%
* Figures for GDP, consumer spending, investment and inflation represent % change on previous year. Interest rates are quoted as of the end of the year.
5
March 2020
© 2020 KPMG LLP, a UK limited liability partnership and a member firm of the KPMG network of independent member firms affiliated with KPMG International Cooperative (“KPMG International”), a Swiss entity. All rights reserved.

COVID-19 at the centre of the short-term outlook
The COVID-19 outbreak has quickly expanded globally with measures to contain the pandemic expected to be eased only gradually.
COVID-19 is a respiratory disease caused by new coronavirus, SARS-CoV-2, that is related to the SARS coronavirus, the cause of epidemic in 2003. Both viruses have the potential to lead to lung infections that can become lethal in severe cases.
Compared to SARS, the new strain is less deadly but more contagious.1 According to the World Health Organization, around 80% of people recover from the virus without needing any special treatment. However, the rapid speed at which the disease spreads means a higher overall human cost than with SARS, because the total number of infections is greater: by 10 March, the number of deaths attributed to COVID-19 was already more than five times higher than with SARS.
The most severely ill patients develop difficulties with breathing and need medical care. Although the data suggests only a sixth or so of patients become seriously ill, the scale of the numbers means a country’s public health system can quickly be overwhelmed by patients in need of respiratory support.
Developments in the first three months
The earliest cases of COVID-19 were identified in China in the city of Wuhan in December 2019. With a population of eight million, Wuhan is among the most densely populated and well-connected cities in China, which made it easier for the disease to quickly build up within the city and to progress to other cities. To make matters worse, the outbreak of COVID-19 coincided with the Lunar New Year, when hundreds of millions of Chinese travel across provinces for family reunions. By 29 January, COVID-19 cases had been reported in every province of China; by 15 March, China had 81,020 confirmed cases, with 72,499 patients recovered and 4,103 deaths.2
Chart 1: The evolution of COVID-19 outbreak in selected countries by 15 March
JapanUK
France
Germany
S. Korea
Italy
ChinaN
umbe
r of
con
firm
ed c
ases
Days after number of confirmed cases passes 100
100,000
1,000
10,000
100
101917 181614 151311 12108 974 5 63210-1-2-3-4
Iran
US
Source: WHO via Johns Hopkins University.
The disease has spread across countries and continents at exceptional speed since mid-January. By 15 March, cases of COVID-19 had been reported in 148 countries, with 88,367 cases worldwide outside China. The worst-affected countries were Italy, Iran and South Korea. Iran faces additional challenges dealing with the crisis given its weak public health system and scarce medical supplies, while Italy’s close economic and travel ties with the rest of Europe could have a major impact on the continent. Other major European countries, including Spain, France and Germany, had witnessed rapid increases in their number of cases by early March. Numbers in the US were more modest, though this may reflect limited testing in the early months of the outbreak; the number of US cases is likely to rise significantly in the coming months.
1 More information on COVID-19 can be found on who.int/news-room/q-a-detail/q-a-coronaviruses. 2 Data according to Johns Hopkins University.
6
Economic Outlook Report
© 2020 KPMG LLP, a UK limited liability partnership and a member firm of the KPMG network of independent member firms affiliated with KPMG International Cooperative (“KPMG International”), a Swiss entity. All rights reserved.

The race to limit transmission
China initially sought to tackle COVID-19 with mild efforts at containment, such as universal temperature monitoring, masking and hand washing. As these quickly proved insufficient to bring the disease under control, China’s government started to take bolder measures.
Currently there is no effective treatment for COVID-19. The only proven method of minimising transmission is through rapid detection and the immediate isolation of cases. At the epicentre of the outbreak, the city of Wuhan was locked down. Public transport ceased operation and all residents were required to stay at home regardless of their health status. The city set up large-scale isolation facilities for suspected cases and mild cases to monitor their health. Hospitals with scarce treatment facilities were reserved for patients with severe conditions.
Across the rest of China, the government introduced temporary suspensions of public gatherings, shut down theatres and tourist sites, and imposed travel restrictions. Workers and students were advised to work or study from home. Local governments urgently increased investment in acute care beds and public health capacity to cope with a potential surge in cases. Simultaneously, local communities attempted to track the contact history of individuals with a history of travel to Wuhan in order to achieve early identification and isolation of potential cases.
Other countries battling the outbreak have responded with different levels of urgency. Countries facing limited numbers of imported cases were more inclined to adopt mild measures, including isolating identified cases, hand washing and disinfecting public spaces. Countries that were unable to prevent further escalation to large-scale community transmission often found themselves left with no choice but to adopt more extreme measures. South Korea, Italy and Iran, where sizable clusters of outbreak emerged by early March, felt compelled to implement lockdowns of cities or regions to interrupt the chain of human transmission.
The outlook for this year
The number of new cases in China seems to have peaked by the middle of February as a result of the strict travel restrictions and quarantine measures imposed, although there is some risk of a resurgence as these measures are gradually lifted. Elsewhere, the situation is expected to escalate over the coming months before finally peaking. Both the timing and extent of the outbreak outside China are difficult to predict given the relatively early stages of the outbreak in other countries. We therefore consider two potential scenarios.
In our main scenario, as China gradually removes most quarantine measures and travel restrictions from March onwards, consumption and production resume. The outbreak outside China is expected to last longer. As of mid-March, our main scenario is for the number of new cases to peak towards the end of the second quarter in the UK and many other European economies. Quarantine measures may therefore be eased gradually from the third quarter of this year, but the impact of the pandemic on businesses will continue to be felt until early next year.
In our downside scenario, moderate quarantine and travel restrictions will be in place for longer and recovery in production will be more limited next year.
7
March 2020
© 2020 KPMG LLP, a UK limited liability partnership and a member firm of the KPMG network of independent member firms affiliated with KPMG International Cooperative (“KPMG International”), a Swiss entity. All rights reserved.
The global economic backdrop
The outbreak and rapid spread of the COVID-19 has derailed the nascent recovery in global economic growth. Instead, there is now a real risk of a significant slump in economic activity during the first half of 2020, with global economic weakness potentially lasting until 2021.
The pandemic could more than undo the positive effects of better news elsewhere this year, such as the stage one deal between the US and China, which has enabled a much needed de-escalation of the ongoing trade conflict between the two countries.
The prospect of a global pandemic has caused turmoil in financial markets, with sharp falls and rising volatility in equity markets around the globe. The FTSE 100 lost nearly a third of its value since the start of the year to 16 March, while the S&P 500 index fell by 23%. Policy measures, such as the Fed’s decision to lower interest rates to zero in two emergency rate cuts, have failed to restore confidence in the markets.
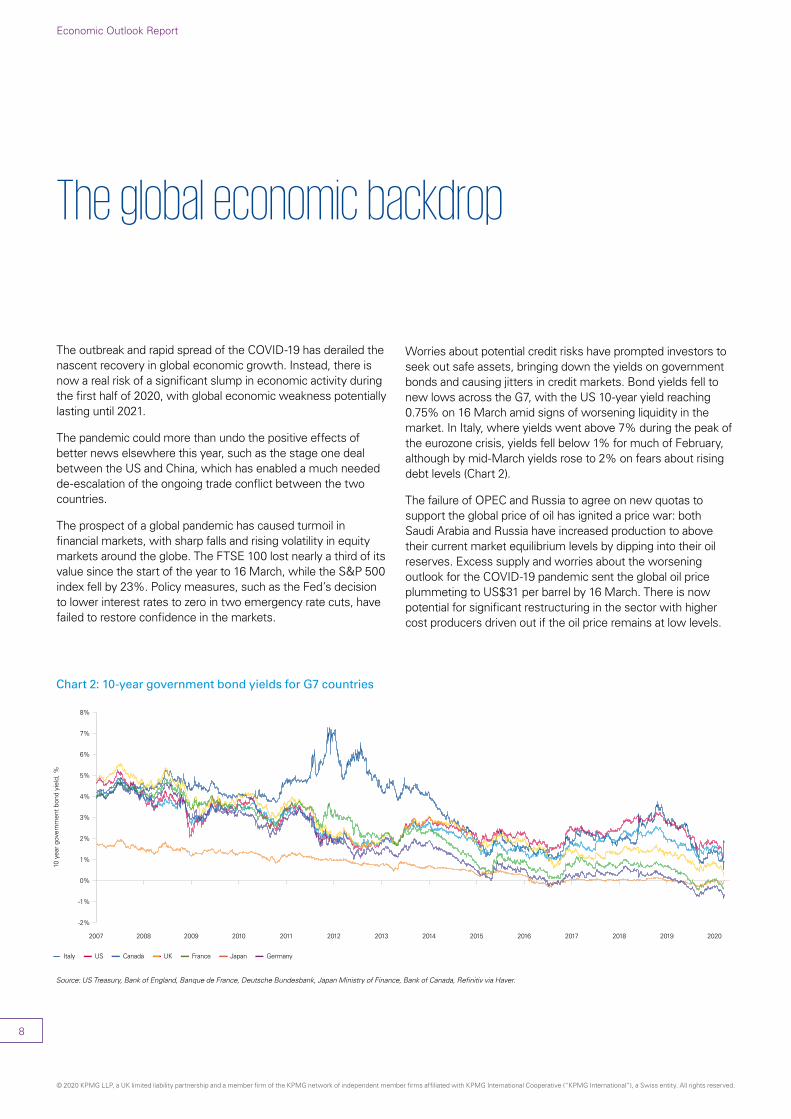
Worries about potential credit risks have prompted investors to seek out safe assets, bringing down the yields on government bonds and causing jitters in credit markets. Bond yields fell to new lows across the G7, with the US 10-year yield reaching 0.75% on 16 March amid signs of worsening liquidity in the market. In Italy, where yields went above 7% during the peak of the eurozone crisis, yields fell below 1% for much of February, although by mid-March yields rose to 2% on fears about rising debt levels (Chart 2).
The failure of OPEC and Russia to agree on new quotas to support the global price of oil has ignited a price war: both Saudi Arabia and Russia have increased production to above their current market equilibrium levels by dipping into their oil reserves. Excess supply and worries about the worsening outlook for the COVID-19 pandemic sent the global oil price plummeting to US$31 per barrel by 16 March. There is now potential for significant restructuring in the sector with higher cost producers driven out if the oil price remains at low levels.
Chart 2: 10-year government bond yields for G7 countries
10 y
ear
gove
rnm
ent
bond
yie
ld, %
8%
7%
5%
6%
2%
1%
0%
4%
3%
-2%
-1%
2007 20092008 2010 20122011 2013 20152014 20172016 2018 20202019
Italy US Canada UK France Japan Germany
Source: US Treasury, Bank of England, Banque de France, Deutsche Bundesbank, Japan Ministry of Finance, Bank of Canada, Refinitiv via Haver.
8
Economic Outlook Report
© 2020 KPMG LLP, a UK limited liability partnership and a member firm of the KPMG network of independent member firms affiliated with KPMG International Cooperative (“KPMG International”), a Swiss entity. All rights reserved.

The economic impact of COVID-19
In broad terms, the COVID-19 pandemic represents both a shock to demand, as people adjust their behaviour to reduce the risk of exposure to the virus; and a shock to supply, as the effect of factory closures reduces the productive capacity of the world economy. Both imply a period of weaker economic activity, leading to a temporary contraction in the worst-affected countries.
There are mixed implications for inflation and prices. Shortages of goods could put upward pressure on prices, which would be particularly acute for some goods in high demand, such as protective facemasks, medicines and sanitisers. By contrast, lower demand for travel and leisure services such as restaurants and cinemas, could see the introduction of significant temporary discounts.
It is still too early to assess the full impact of the outbreak, but the damage already done to China’s economy and the effects of quarantine measures taken around the world so far suggest it will be significant this year.
Our main scenario assumes that the outbreak is contained by the end of the year in most economies around the world. Despite a modest easing of quarantine measures in the summer, global growth could slow to at least 1.5% in 2020, with many advanced economies slipping into recession.
A more severe downside scenario, with the global pandemic only brought under control during 2021, could see the global economy enter into a deep recession, comparable to the downturn in 2008-09. Furthermore, some of the economic fallout will extend the downturn into next year, before a recovery can commence.
On the demand side, travel and tourism will be among the most severely affected sectors, together with hospitality and entertainment. These industries are likely to experience a period of weak demand across the world as consumers and businesses alter their behaviour to minimise the risk of virus transmission. On a broader scale, businesses that depend on face-to-face interactions will experience a drop in consumer numbers. The bricks and mortar retail sector, for example, will experience a period of weak activity as shoppers opt to make more purchases online.
As for the supply side, quarantine measures and sick workers will lead to a loss of production due to fewer available staff and some factory shutdowns. This will serve to interrupt the supply chains of other businesses. China is deeply embedded in global supply chains, with factory shutdowns there already impacting manufacturing across the world earlier this year.
Global economic outlook
Policymakers concerned about the economic fallout of the COVID-19 pandemic have announced a range of measures to mitigate its impact around the world. More measures are expected to be announced as the outbreak evolves.
In China, where the outbreak began, while the number of new cases have nearly fallen back to zero; the economic impacts of the outbreak are becoming apparent. Latest data for February shows that industrial output fell by 13.5% compared to a year ago, while retail sales fell by 20.5% over the same time span prompting a raft of monetary and fiscal measures to support the economy.
In the US, a protracted outbreak could lead to significant credit concerns if companies are unable to access the liquidity they need to weather the crisis. The overall impact on GDP growth is highly uncertain and could result in a 2.8% contraction in 2020.
The US Federal Reserve acted swiftly to bring policy rates to around zero by mid-March. In response to the crisis, the US government announced expanding provisions for paid sick leave and free tests for the new virus. Further announcements to support the economy through fiscal easing are likely.
In the eurozone, the scope to respond to a severe outbreak is more limited, with policy interest rates already in negative territory. The European Central Bank (ECB) has so far opted instead for other measures, such as increasing the scale of its quantitative easing programme, to deal with the effects of the virus. This means that across the eurozone, fiscal policy will inevitably need to bear more of the burden in dealing with the economic impacts of the outbreak, but differences in fiscal space could lead to wide a variation in response.
Italy, which so far has experienced the worst outbreak of European economies, could see its economy contract significantly in 2020. The overall eurozone is expected to grow by only 0.8% this year according to the ECB, however this could be optimistic as Europe becomes the epicentre of the pandemic around the world.
The position of the Japanese economy was already precarious at the start of 2020, with negative impacts from a rise in the consumption tax, trade tensions with Korea and the adverse effects of Typhoon Hagibis. Following an estimated contraction of 1.8% in the fourth quarter of 2019 and facing an increasing impact from the COVID-19 pandemic, the Japanese economy is expected to contract further this year. The Bank of Japan has so far focused on expanding the scale of its QE programme with limited room to cut headline interest rates as they are already negative. Japan’s government has also unveiled stimulus measures focusing on providing loans to businesses affected by the slowdown as well as subsidies for working parents affected by school closures.
The global economy in 2020 therefore represents a difficult backdrop for the UK economy.
3 ECB, Macroeconomic projections, March 2020.9
March 2020
© 2020 KPMG LLP, a UK limited liability partnership and a member firm of the KPMG network of independent member firms affiliated with KPMG International Cooperative (“KPMG International”), a Swiss entity. All rights reserved.

Our forecast for the UK economy
© 2020 KPMG LLP, a UK limited liability partnership and a member firm of the KPMG network of independent member firms affiliated with KPMG International Cooperative (“KPMG International”), a Swiss entity. All rights reserved.


The outlook for the economy is clouded by COVID-19 this year
COVID-19 has overtaken Brexit as the dominant risk factor in the short-term outlook for the UK economy. The disease, and the social distancing measures enforced to limit its spread, will drag the UK economy into a recession this year.
After December’s decisive election result and the aversion of a cliff-edge Brexit, 2020 began with a wave of optimism about the outlook for the UK economy. But that did not last. The disruptive outbreak of COVID-19 put paid to the upbeat sentiment, with the new coronavirus set to dominate the economic picture at least this year. Things are moving fast. These are our forecasts as of mid-March. We will issue regular updates on the economic outlook that you will be able to access here.
This is an unusual type of economic shock. Its size will depend on the effectiveness of public health measures and the potential development of a vaccine.
Given the extreme uncertainty about the longevity and likely extent of the COVID-19 pandemic in the UK and elsewhere, we are working on the basis of two potential scenarios:
1) Main scenario: the negative economic impacts of COVID-19 peak in the UK at the end of the first half of this year, quarantine measures are gradually lifted from the summer, but economic activity doesn’t fully recover until early next year.
2) Downside scenario: the outbreak persists in 2021, with some quarantine measures and significant disruptions to supply chains during the first half of next year.
Our main scenario
In our main scenario, the economy slows sharply in the spring and remains flat in the second half of this year before a recovery begins early in 2021. Overall GDP falls by 2.6% in 2020, before picking up by 1.7% in the following year. Both consumption and investment fall sharply due to falling confidence, as well as the impact of public health measures put in place to contain the virus; these are only partially offset by the range of measures taken by the Bank of England and the government to support the economy.
We expect the quarantine measures and negative effects on consumer confidence to erode demand for a wide swathe of consumer goods and services – from spending on travel to high street retail as well as in the restaurant and hospitality sectors. As consumers take steps to avoid exposure to the disease, whether voluntary or enforced, they will spend less, creating a temporary dip in demand in these sectors. We expect consumer spending to fall by 2.5% in 2020 as a whole. We then anticipate a modest recovery, with 1.6% growth in 2021.
In addition, we expect the temporary closure of some workplaces and the disruption of supply chains to limit the productive capacity of many sectors. Shortages of intermediate components will lead to mothballing of production until supplies can be restored. As inventories become depleted, delivery delays of some goods will become increasingly likely.
Even so, we do not expect the overall rate of consumer price inflation to rise; rather, to continue on its recent low trend. While shortages of some goods may push up prices slightly in certain categories, the overall impact on headline inflation will be moderated by the falling price of products and services affected by lower demand as a result of the outbreak. The additional introduction of charging caps on water bills by the industry regulator Ofwat from April will bring overall inflation further down. We expect inflation to average 1.4% in 2020 before rising to 2% in 2021.
Whether owing to weaker demand or to production difficulties, many businesses will suffer falling revenues, potentially leading to liquidity problems and a possible spike in insolvency and bankruptcy rates. The Bank of England and the Chancellor have announced measures to help support small businesses and the most affected industries, however, the loss of some businesses may be inevitable. 12
Economic Outlook Report
© 2020 KPMG LLP, a UK limited liability partnership and a member firm of the KPMG network of independent member firms affiliated with KPMG International Cooperative (“KPMG International”), a Swiss entity. All rights reserved.

March 2020
1313

Some support will come from lower interest rates, which the Bank of England reduced by 50 basis points on 11 March, and by another 15 basis points on 19 March. We expect rates to remain low throughout 2020 and 2021, as the Bank of England keeps a very accommodative stance to ease the end of the Brexit transition period.
In the short term, as the COVID-19 outbreak takes hold, the government may announce additional measures to support the most vulnerable sectors and individuals in the economy. The Chancellor announced further measures on 17 March, just a week after the Budget on 11 March, but depending on how the pandemic evolves more may be needed.
Despite lower interest rates, the high level of disruption due to the COVID-19 pandemic will hold back investment in 2020. After a sharp fall in investment in the first half of 2020 a rebound only begins next year, with overall investment falling by 11.2% this year. Once the pandemic uncertainties clear, we expect a significant pick-up, with investment rising by 5.2% in 2021.
The disruption to business activity will cause a temporary rise in the unemployment rate in the first half of the year, which we expect to be mostly reversed by Q1 next year. This will leave the labour market slightly less tight, with an average unemployment rate of 4.7% in 2020 and 4.1% in 2021.
Table 1: KPMG forecast – main scenario
2019 2020 2021
GDP 1.4 -2.6 1.7
Consumer spending 1.4 -2.5 1.6
Investment 0.4 -11.2 5.2
Unemployment rate 3.8 4.7 4.1
Inflation 1.8 1.4 2.0
Base interest rate 0.75 0.10 0.25
Source: ONS, KPMG forecasts. Average % change on previous calendar year except for unemployment rate, which is average annual rate. Investment represents Gross Fixed Capital Formation, inflation measure used is the CPI and unemployment measure is LFS. Interest rate represents level at the end of calendar year.
Falling revenues, due to weaker demand and/or to production difficulties, will lead to liquidity problems for many businesses and a possible spike in insolvency and bankruptcy rates.
14
Economic Outlook Report
© 2020 KPMG LLP, a UK limited liability partnership and a member firm of the KPMG network of independent member firms affiliated with KPMG International Cooperative (“KPMG International”), a Swiss entity. All rights reserved.

In our downside scenario, a prolonged impact of COVID-19 will see the UK economy suffering a more severe downturn than seen in the 2008-09 recession.
Our downside scenario
Our downside scenario considers a prolonged impact from COVID-19, with the outbreak lasting into the first half of next year. While we do not expect a significant deterioration in the level of economic activity in the first half of 2021 in this scenario, we do envisage a further smaller fall in investment and consumer spending in the second half of this year. Consumer spending and investment should then pick up in the second half of 2021, perhaps as a vaccine is in sight.
In this scenario, we see GDP contracting by 5.4% in 2020 and by another 1.4% in 2021. This would represent a slightly more severe recession than the downturn experienced in 2008-09 (Chart 3).
This scenario increases the risks arising from the strain on the finances of businesses and households. The longer that economic activity is disrupted, the greater the risk of cashflow shortages, increased lay-offs and higher insolvency rates.
Finally, it is important to say that while the outbreak of COVID-19 and the associated economic impacts has prompted a significant downgrade of our forecasts, economic costs come second to the cost of lives. Measures to safeguard the population will rightly take priority over any short-term disruptions these may cause to the economy.
Chart 3: GDP growth in our main and downside scenarios
Q2 Q3 Q4Q1 Q2 Q3 Q4Q1 Q2 Q3 Q4Q1
Rea
l GD
P g
row
th, q
uart
er-o
n-qu
arte
r ch
ange
3.0%
0%
1.0%
2.0%
-2.0%
-1.0%
-3.0%
-4.0%
2019 2020 2021
Main scenario Downside scenario Historical
Source: ONS and KPMG analysis.
15
March 2020
© 2020 KPMG LLP, a UK limited liability partnership and a member firm of the KPMG network of independent member firms affiliated with KPMG International Cooperative (“KPMG International”), a Swiss entity. All rights reserved.

The story so far
UK businesses already suffering from weak demand 18
Mixed performance across the UK underlines the imperative to ‘level up’ 22
Labour market remains resilient 24
Weak inflation smooths the way for rate cuts 26
Public finances receive a boost in March 28
© 2020 KPMG LLP, a UK limited liability partnership and a member firm of the KPMG network of independent member firms affiliated with KPMG International Cooperative (“KPMG International”), a Swiss entity. All rights reserved.


UK businesses already suffering from weak demand
Even before the COVID-19 pandemic emerged, UK businesses faced a weak business environment. Growth stuttered during the final quarter of 2019; while the decisive general election result in December boosted business optimism, it did not make up for the weakness of the previous two months. And coming into 2020, improving business confidence in January did not translate into real economic growth. Then the coronavirus outbreak began to take hold.
Consumers wary of major spending
Consumer-facing businesses experienced a challenging fourth quarter in 2019. While household consumption has traditionally been the main driver of UK growth, the sector recorded its worst quarterly performance since 2015 (Chart 4).
Although a strong jobs market and healthy earnings growth helped keep household budgets afloat, consumers opted to save more rather than embark on a spending spree. Outstanding credit card lending declined for the second successive quarter over the final three months of 2019, suggesting consumers were making fewer major purchases on credit and seeking to reduce their debt. This could reflect a combination of factors, including increases in some credit card rates and falling consumer confidence (Chart 5). In addition, consumer expectations about the general economic situation over the next 12 months were already low. And while there was a significant bounce in consumer confidence at the beginning of 2020, it is likely to have been reversed by the coronavirus outbreak.
Chart 4: Growth was flat in the last quarter of 2019, with exports and government spending the main positive contributors
Qua
rter
-on-
quar
ter
chan
ge, %
5%
10%
0%
-5%
-10%
-15%
Consumption Investment GDPExports Imports Government
Q1 2019 Q2 2019 Q3 2019 Q4 2019
Source: ONS via Haver.
Note: Export growth in Q4 2019 is distorted by an anomalous increase in the export of precious metals.
Chart 5: The rise in consumer confidence in early 2020 was undermined by higher unsecured credit costs
Con
sum
er c
onfid
ence
inde
x
Inte
rest
rat
e, %
22%
20%
21%
19%
17%
18%
16%
15%
20
10
0
-10
-20
-30
-40
-502010 2011 2012 20142013 2015 2016 20182017 2019 2020
Index of consumer expectation for general economic condition over the next 12 months (RHS)
Credit card rates (LHS)
Source: Bank of England and GfK NOP/European Commission via Haver.
18
Economic Outlook Report
© 2020 KPMG LLP, a UK limited liability partnership and a member firm of the KPMG network of independent member firms affiliated with KPMG International Cooperative (“KPMG International”), a Swiss entity. All rights reserved.

19
March 2020

Weak consumer demand put pressure on consumer-facing services. The wholesale and retail sector, as well as hotels and restaurants, both contracted during the final quarter of 2019. Consumers were particularly reluctant to commit to major purchases, with household goods and electronic appliances most vulnerable to reduced appetite for spending. The Black Friday and Christmas season were both less helpful in boosting sales than retailers had hoped. Major retailers suffered a 0.9% decline in combined sales for November and December compared to the previous year according to the BRC-KPMG Retail Sales Monitor. Nor did improved consumer confidence in January and February translate into higher revenues for retailers.
Weak international demand constrains export expansion
International trade continued to suffer from the fallout of the US-China trade war during the final quarter of 2019. Goods exports to the European Union did improve, but goods exports to non-EU countries did not grow at all compared to the previous quarter. And while the US-China Phase One Agreement might have been expected to boost trade, it did not have time to translate into higher export sales before COVID-19 struck (Chart 6).
Exports of services have historically been more resilient to short-term economic volatility, but this area of trade also took a significant hit in the final quarter of 2019. Business surveys pointed to a sharp decline in new export orders in the months prior to the general election, as international clients switched away from UK service providers. Services exports regained some strength in December and January, but COVID-19 threatens this recovery.
Chart 6: Services exports took a hit in the final quarter of 2019, while goods exports to non-EU countries were flat against a backdrop of sluggish global growth
Valu
e of
tra
de in
ser
vice
s(m
illio
n, in
201
6 £)
Valu
e of
tra
de in
goo
ds
(mill
ion,
in 2
016
£)
60,000
70,000
50,000
30,000
40,000
20,000
10,000
230,000
220,000
210,000
200,000
190,000
180,000
170,0002014 2015 2016 2017 2018 2019
Export of goods (non-EU) (LHS) Export of services (RHS)Export of goods (EU) (LHS)
Source: ONS via Haver.
Value of trade in goods excludes erratics.
20
Economic Outlook Report
© 2020 KPMG LLP, a UK limited liability partnership and a member firm of the KPMG network of independent member firms affiliated with KPMG International Cooperative (“KPMG International”), a Swiss entity. All rights reserved.

Conservative spending by consumers weighed on UK businesses. Whereas businesses remained reluctant to invest amid high uncertainties, the public sector became a major pillar of growth.
Businesses remain reluctant to invest
Weak end demand has also put pressure on business-to-business sectors. Logistics, financial services and professional services all performed worse in the final three months of the year than in the third quarter (Chart 7). This trend looks to have continued: the CBI Service Sector Survey reported the fifth consecutive quarter of decline in profitability for business and professional service firms in the three months to February 2020, due to stronger competition amid the declining client demand.
These multiple challenges have been a drag on business investment, which contracted during the final quarter of last year. The level of business investment has now been almost stagnant for the past two years – and hopes that it could be revived following the general election have been dashed by the COVID-19 pandemic.
Public spending remains the bright spot
The government came to the rescue in the final quarter of 2019, making a notable contribution of 0.4% to growth, its most significant impact since the first quarter of 2012. March’s Budget signalled the government’s intention to do even more.4
It will take time to translate the government’s recent plans for ending austerity and investing in the regions into projects on the ground. However, sectors better supported by public funds have proved more resilient to volatile domestic demand. As Chart 7 reveals, the health and social services and education sectors were the only sectors to post rates of expansion in line with their historical averages during the final quarter of 2019.
4 For more details on the March Budget, please refer to the Public Finance section in this report.
Chart 7: Weakness was broad-based across major service sectors in the final quarter of 2019
Qua
rter
-on-
quar
ter
chan
ge
1.5%
1.0%
0.5%
-0.5%
0%
-1.0%Education Health
and socialservices
Professional and support
services
Logistics andcommunication
Financialservices
Wholesale and retail
Hotels andrestaurants
Q3 2019 Q4 2019
Source: ONS via Haver.
21
March 2020
© 2020 KPMG LLP, a UK limited liability partnership and a member firm of the KPMG network of independent member firms affiliated with KPMG International Cooperative (“KPMG International”), a Swiss entity. All rights reserved.

Mixed performance across the UK underlines the imperative to ‘level up’
With the medium-term focus of the government on how to ‘level up’ the regional economies of the UK. We look at how these economies are performing today and show that prioritising some areas of the UK will help to achieve the government’s policy ambitions.
Early estimates suggest that only London and the South East of England delivered regional GDP growth in 2019 that exceeded the national average, achieving 3.9% and 1.9% respectively. While no region experienced a contraction, the South West of England experienced the slowest pace of expansion, with GDP up by just 0.7% over the course of last year.
Last year’s pattern of growth was typical of the UK’s experience in recent years, with an outstanding level of performance in the London and the wider South East contrasting starkly with weaker growth elsewhere. The scale of the problem is significant: over the course of just a year, London opened a two percentage point gap between its performance and that of the wider economy.
Data from the latest survey of purchasing managers (PMI) suggests that this pattern of growth will persist over the next few months, with the fastest pace of expansion expected in London.
Those expectations may or may not prove accurate: the latest PMI data does not take into account the impact of the COVID-19 pandemic, which we expect to lead to a further deterioration in economic activity across the UK. It is highly likely that some hotspots of the outbreak will emerge in the UK, similar to the way South Korea’s outbreak has centred on Daegu City, Iran’s Qom has suffered disproportionately and the Lombardy region has fared worse in Italy. With local populations experiencing more severe impacts in these areas and facing tougher quarantine measures, they would also face more significant economic impacts.
Chart 8: Regional GDP growth in 2019 and latest PMI survey resultsCHART 8 Regional 1
2019
GD
P g
row
th r
ate,
chai
n vo
lum
e m
easu
re
4%
2%
3%
1%
-2%
-3%
0%
-1%
-4%Yorkshire andThe Humber
North WestLondon WalesSouth East West Midlands
East of England
East MidlandsScotland North East South WestNorthern Ireland
GDP growth in 2019 (LHS)
Reg
iona
l PM
I(v
alue
ove
r 50
indi
cate
s ex
pans
ion)
58
56
54
52
50
46
48
44
42
UK GDP growth in 2019
50.150.1
53.0
52.152.8
53.7
46.5
50.2
51.2
52.7
PMI (RHS)
56.0
52.6
Source: ONS, Scottish Government, NISRA, ESCOE, IHS Markit and KPMG estimates.
22
Economic Outlook Report
© 2020 KPMG LLP, a UK limited liability partnership and a member firm of the KPMG network of independent member firms affiliated with KPMG International Cooperative (“KPMG International”), a Swiss entity. All rights reserved.

COVID-19 aside, however, the PMI data suggests the relative economic success of the South East of England against the rest of the UK is an ongoing trend. The outlook for the North East and Northern Ireland in particular is more negative: the PMI surveys for these regions are consistent with a modest economic contraction over the next few months. As Chart 9 shows, the trajectory these regions are now on is also reflected in labour market conditions.
While the rate of unemployment in Northern Ireland is the lowest of any region or country of the UK, at 2.4% in the three months to January 2020, the data on economic inactivity in the region is not encouraging. Northern Ireland has the highest proportion of people aged 16-64 who are economically inactive in the UK, with more than one in four not in employment or seeking a job.
The economic slowdown in Northern Ireland has been associated with the political uncertainties of Brexit and the temporary suspension of the devolved government in Belfast, which was finally restored in January 2020. The easing of uncertainty should help stimulate activity and we therefore expect to see some improvement in the economic data for the early months of the year.
However, Northern Ireland’s economy remains exposed to significant risks from Brexit and the new trading relationship that the UK is set to agree with the European Union over the course of the year. A potential Brexit cliff edge at the end of 2020, and the risks posed by the COVID-19 pandemic in the first half of the year, both loom as severe downside risks.
The North East recorded a high rate of unemployment, at 6.2%, in the three months to January 2020. Alongside the high 23.4% inactivity rate in the region, this suggests a downbeat economic environment. While growth in 2019 reached 1.1%, there is clearly much more room for improvement.
The low overall level of unemployment in the UK presents a challenge as the government seeks to execute its ‘levelling up’ strategy; shortages of workers could put ambitious investment plans on hold. Making a difference will require significant long-term investment that is well targeted and creates lasting centres of growth outside London and South East that can drive positive momentum across the different regions. Our recent report UK regions: a framework for growth5, discusses the strategies that local and central government should follow to level up the UK economy.
5 See home.kpmg/uk/en/home/insights/2020/01/uk-regions-a-framework-for-growth.
Chart 9: Unemployment and economic inactivity across UK regionsCHART 9 unemployment
Une
mpl
oym
ent
rate
,ag
ed 1
6 an
d ov
er, %
7%
6%
5%
2%
1%
4%
3%
0%Yorkshire andThe Humber
North WestLondon WalesSouth EastWest Midlands
East of England
East Midlands ScotlandNorth East South West Northern Ireland
Unemployment rate (LHS) Economically inactive (RHS)
Eco
nom
ical
ly in
activ
e, a
ged
16 -
64, %
30%
25%
20%
10%
15%
5%
0%
Source: ONS.
23
March 2020
© 2020 KPMG LLP, a UK limited liability partnership and a member firm of the KPMG network of independent member firms affiliated with KPMG International Cooperative (“KPMG International”), a Swiss entity. All rights reserved.

Labour market remains resilient
Strong labour market was in the UK economy’s favour, as it faced up to the challenge of COVID-19, although the robust earnings growth workers enjoyed in 2019 cooled at the start of the year.
The UK economy entered the COVID-19 pandemic with a strong labour market. The number of jobs continued to rise during the fourth quarter of 2019, despite weaker economic growth, with firms increasing the number of vacancies at the start of 2020.
Employment started to pick up as the risk of a Brexit cliff edge receded in October and stayed at a historic level of 76.5% in the three months to January. The unemployment rate picked up slightly to 3.9% in the three months to January but remained close to its lowest level since 1974 (Chart 10).
One factor boosting demand for labour was the resumption of public sector hiring. In 2019, the public sector added twice the number of jobs as compared to the previous year. Private sector employment growth also accelerated in the last quarter of 2019 after weak performance in the previous three quarters (Chart 11).
Chart 10: The employment rate hit new highs at the start of the year
Em
ploy
men
t ra
te, a
ged
16 t
o 64
, %
Une
mpl
oym
ent
rate
, age
d 16
and
ove
r, %
7%
8%
6%
9%
5%
4%
2%
3%
1%
0%
78%
76%
74%
72%
70%
68%
66%2007 2008 2009 2010 2011 2012 20142013 2015 2016 20182017 2019
Employment rate (RHS)Unemployment rate (LHS)
Source: ONS via Haver.
Chart 11: Private sector employment growth regained strength in the last quarter of 2019
Public sector Private sector
Cha
nge
in e
mpl
oym
ent,
qua
rter
-on-
quar
ter
-50,000
0
50,000
100,000
150,000
200,000
250,000
300,000
350,000
2013 2014 2015 2016 2017 2018 2019
Source: ONS via Haver.
24
Economic Outlook Report
© 2020 KPMG LLP, a UK limited liability partnership and a member firm of the KPMG network of independent member firms affiliated with KPMG International Cooperative (“KPMG International”), a Swiss entity. All rights reserved.

Recovery in hiring intentions may be short-lived
The latest data on vacancies – a measure of demand for workers – suggests that businesses’ reluctance to hire amid the uncertainties dominating most of 2019 began to ease after November. ONS figures show that the number of vacancies increased moderately at the end of the year and the beginning of 2020, after previously falling almost every month since the start of 2019.
The KPMG-REC Permanent Vacancies Index also revealed renewed strength in hiring intentions since December 2019, with all four regional sub-indices on the rise (Chart 12). That suggests the increase was broad-based, though it was led by the North of England which recorded the most significant recovery in vacancies. Whether this recovery can be sustained, however, remains to be seen. The severity of the economic impacts of the COVID-19 pandemic will naturally impact the demand for labour in the short term.
For example, while the manufacturing sector led vacancy gains at the start of 2020, implementing delayed hiring plans once a cliff-edge Brexit was averted, the demand shock and supply chain disruptions caused by COVID-19 may put them on hold again.
The services sectors, meanwhile, were more reluctant to add jobs. Consumer services, including wholesale & retail trade and hotels & restaurants, saw minimal increase in job openings over the three months to January 2020 compared to the previous quarter. Professional services continued to see a fall in the number of vacancies.
Weak productivity growth puts pressure on earnings
At the end of 2019, more than a decade after the financial crisis, UK workers’ real earnings finally surpassed the pre-crisis peak achieved in spring 2008. Yet despite a tight labour market, earnings growth had started to soften from its peak in the middle of last year. This may mark the end of the relatively stronger growth in earnings observed in 2019.
Chart 12: Broad-based pick-up in hiring intentions across regions since December 2019
Perm
anen
t Vac
anci
es In
dex,
valu
e ov
er 5
0 in
dica
tes
expa
nsio
n
70
65
55
60
50
45Jan 2016
Sep 2016
Jan 2017
May 2017
Sep 2017
Jan 2018
May 2018
Sep 2018
Jan 2019
May 2016
Sep 2019
Jan 2020
May 2019
Midlands LondonSouth NorthUK
Source: KPMG-REC Report on Jobs, February 2020.
Chart 13: Earnings growth softened at the start of 2020 in both nominal and real terms
Year
-on-
year
% c
hang
e
5%
4%
2%
0%
1%
3%
-1%
-3%
-2%
2007 2008 2010 2011 2012 2013 2014 2015 20162009 2018 202020192017
Real earningsNominal earnings
Source: ONS via Haver.
Nominal and real earnings figures only account for regular pay excluding bonuses.
25
March 2020
© 2020 KPMG LLP, a UK limited liability partnership and a member firm of the KPMG network of independent member firms affiliated with KPMG International Cooperative (“KPMG International”), a Swiss entity. All rights reserved.

Weak inflation smooths the way for rate cuts
As markets losses and volatility increased, the Bank of England joined the international chorus of rate cuts to calm the markets with limited success.
A week after the US Fed’s emergency interest rate cut on 3 March, the Bank of England followed with an emergency rate cut of 50 basis points, followed by another cut of 15 basis points on 19 March. Inflation remained low, thanks to weak energy prices and a strong pound, making the decision to ease monetary policy easier for the Bank of England.
Inflation remains well below target
Inflation has been trending downwards since early 2018, with February the tenth consecutive month in which it stayed below the Bank of England’s 2% target rate (Chart 14).
Falling UK energy prices have been a significant factor in driving lower inflation. The effect of industry regulator Ofgem’s decision to lower the cap on energy tariffs has continued to pass through the economy (Chart 15). And a temporary rise in the year-on-year inflation figures in January this year reflected the one-year anniversary of Ofgem’s launch of the energy tariff cap in January 2019, rather than pointing to rising inflationary pressures so far this year.
Separately, the cost of road fuels has also eased due to the falling price of crude oil since spring last year, with weaker global trade and manufacturing output keeping the oil price in check. More recently, the breakdown of negotiations between Russia and OPEC, and Saudi Arabia’s decision to unilaterally increase production, sent oil prices on a free fall in early March. Concerns about the negative evolution of the COVID-19 pandemic put further downward pressure on oil prices in mid-March.
Chart 14: Inflation has trended downwards since 2018
Year
-on-
year
cha
nge
in C
PI
3.5%
3.0%
2.0%
2.5%
1.5%
1.0%Jan 2017
May 2017
Sep 2017
Jan 2018
May 2018
Sep 2018
Jan 2019
Sep 2019
Jan 2020
May 2019
All itemsAll excluding energy
Source: ONS via Haver.
Chart 15: UK energy prices suppressed by lower Ofgem tariff cap and weak oil prices
Cru
de o
il pr
ice,
£/b
bl
Con
sum
er p
rice
inde
x, 2
015=
100
120
110
115
105
95
100
90
85
70
60
50
40
30
20
102014 2015 2016 20182017 2019 2020
Oil priceCPI: Electricity, gas & miscellaneous energy
Source: ONS and Financial Times via Haver.
26
Economic Outlook Report
© 2020 KPMG LLP, a UK limited liability partnership and a member firm of the KPMG network of independent member firms affiliated with KPMG International Cooperative (“KPMG International”), a Swiss entity. All rights reserved.

Strong pound helped put inflation in check
Apart from energy, inflation has also been affected by a relatively strong exchange rate, easing import prices. This is significant since the UK imports a large proportion of consumer goods. However, the rise in the Sterling Effective Exchange Rate Index (ERI) in October 2019, when the potential of an immediate cliff edge was removed, was reversed at the end of February. This was partly driven by shifting interest rate expectations. The European Central Bank’s more hawkish stance reduced the interest gap between the euro and other currencies, making the euro more attractive for investors (Chart 16).
Flight to safety
Even before the effects of the COVID-19 pandemic reverberated across the developed world, a range of interest rates had begun to fall in the UK. Following poor data on GDP growth in January, the yield on the 10-year gilt fell well below the level of the Bank of England’s policy rate, in line with the already low rate on the two-year gilt. When more bad news in relation with the COVID-19 pandemic came out in March, the market started to panic. The dramatic downturn in equity markets worldwide further pushed investors into safe assets and gilt yields fell to historic lows (Chart 17). An emergency interest rate cut of 50 basis points, and the additional measures announced by the Bank of England, were aimed at softening some of the impacts from the outbreak.
Chart 16: Pound fell against the euro as expectations of monetary easing diverged
Exc
hang
e ra
te in
dex
(nar
row
)
Eur
o/U
S$
per
GB
P
1.5
1.4
1.2
1.3
1.1
1.0
84
82
80
78
76
74
722018 2019 2020
US$ per GBP (LHS)Euro per GBP (LHS) Effective exchange rate index (RHS)
Source: Bank of England via Haver.
Chart 17: The yield on the 10-year gilt fell to historic lows
Inte
rest
rat
e, %
2.0%
0.4%
0.6%
0.8%
1.0%
1.2%
1.6%
1.8%
1.4%
0.2%
0.0%2016 20182017 20202019
10-year gilt Base rate2-year gilt
Source: Bank of England and Reuters via Haver.
27
March 2020
© 2020 KPMG LLP, a UK limited liability partnership and a member firm of the KPMG network of independent member firms affiliated with KPMG International Cooperative (“KPMG International”), a Swiss entity. All rights reserved.

Public spending receives a boost in March
The government’s first Budget, unveiled on 11 March, set a new tone, with a significant boost to public spending and a number of tax giveaways, to be funded by an overall increase in government borrowing.
The COVID-19 pandemic dominated the government’s plans for short-term spending. It included £12bn of emergency measures aimed at combating the impacts of the outbreak, which has come to overshadow the short-term economic outlook. These measures included a promise to meet the needs of the NHS, potentially costing an extra £5bn or more, as well as measures to help workers and businesses weather the temporary shock of the pandemic.
In a further two announcements, less than a fortnight after the Budget, the Chancellor committed to a potentially unlimited intervention to help workers and businesses weather the pandemic. Overall measures included an offer to meet up to 80% of the wage costs of furloughed workers of up to £2,500 a month, interest-free loans for firms, mortgage holidays and other increases to the social safety net.
The rapid worldwide spread of COVID-19 wrong-footed the Office for Budgetary Responsibility (OBR), which did not have time to include the potential impact of the pandemic in the forecasts it published alongside the Budget. Accordingly, the Budget was based on hopelessly optimistic forecasts of short-term economic growth.
Measures announced in the Budget and subsequently to help workers are welcome from an economic standpoint, in that they will help to shore up household finances; importantly, they will also play a role in protecting public health by enabling people to self-isolate more effectively.
Alongside the measures linked to COVID-19, the core of the Budget featured a significant increase in overall government spending. Additional measures costing nearly £18bn in the current fiscal year, which were announced earlier last year, were supplemented by significant further spending rising to over £41bn by 2023-24. Most of the additional spending will be allocated in the Spending Review, due to take place over the summer.
28
Economic Outlook Report
© 2020 KPMG LLP, a UK limited liability partnership and a member firm of the KPMG network of independent member firms affiliated with KPMG International Cooperative (“KPMG International”), a Swiss entity. All rights reserved.

The most eye-catching pledges focused on increases in spending on public services of 2.8% per year, which amount to a 2.1% increase once the lost contribution from EU budget is accounted for, and a rise in the level of public investment by 2.9% of GDP on average over the next five years. OBR analysis suggests the latter measure could help revive productivity growth. However, it foresees a boost of only 0.1 percentage points each year, which will add up to an increase of just 2.5% by the time Rishi Sunak, the 39-year old Chancellor, nears retirement age. This may prove too pessimistic, but underlines the genuine challenge to ensure this major increase in investment is well spent.
On day-to-day spending, the increases announced in the Budget look set to put austerity policies in reverse. The OBR estimates that departmental spending per head will return to levels last seen in 2010-11 by 2024-25. However, as the Institute for Fiscal Studies notes, much more of the planned spending will be devoted to healthcare, with real spending per person on public services excluding health still facing a 14% cut in 2024-25 relative to 2010-11.
Disappointingly, the Budget sent mixed messages on the government’s stance towards climate change. The extra £1bn pledged towards greening the economy was swamped by a £27bn pledge on new road building and retention of the now decade-long freeze on fuel duties at a cost of £0.5bn per year. Still, investment in road building need not be a strict negative, if the UK can accelerate the switch to electric vehicles and move to lower emissions on power generation over the coming decades. Changes to the Climate Change levy on gas will also help bring the environmental impact in line with wider emissions from electricity, with effect from 2022-23. Nevertheless, more clearly needs to be done if the UK is to meet its ambitious zero net-emissions target by 2050.
As the government confronts the national emergency of COVID-19, the total cost of measures in the current fiscal year is not certain. Combined with deteriorating revenues from faltering economic growth, this could mean a big increase in borrowing. It is very likely that, contrary to the current projections from the OBR, these plans will make it difficult for the Chancellor to meet the current fiscal rules, although these are expected to be revised this year.
However, it is crucial that the government resists the pressure to deviate from the initial goal of seeking to level-up the UK economy. After years of flagging productivity and yawning regional imbalances, a consistent policy could generate a real boost for the UK’s economic prospects. Faster economic growth would then help bring the ratio of debt-to-GDP down, even as interest rates rise from their current low levels. If the government’s plans are less successful in driving stronger long-term growth, and growth stays weak, low interest rates are likely to persist. This will probably imply that public debt could remain affordable in the future, but will leave less room for future governments to borrow and spend significantly more.
Chart 18: The rise in real day-to-day spending per person will reverse austerity cuts
Cum
ulat
ive
chan
ge s
ince
201
0-11
, %
2%
-2%
0%
-4%
-6%
-8%
-12%
-10%
-14%
-16%
PlannedActual
2010 -11 2012 -13 2014 -15 2016 -17 2018 -19 2020 -21 2022 -23 2024 -25
Source: OBR.
29
March 2020
© 2020 KPMG LLP, a UK limited liability partnership and a member firm of the KPMG network of independent member firms affiliated with KPMG International Cooperative (“KPMG International”), a Swiss entity. All rights reserved.

The new abnormal in the UK government bond marketSusana Cervero Senior Manager, KPMG in the UK
© 2020 KPMG LLP, a UK limited liability partnership and a member firm of the KPMG network of independent member firms affiliated with KPMG International Cooperative (“KPMG International”), a Swiss entity. All rights reserved.


The new abnormal in the UK government bond market
— The impact of the COVID-19 pandemic and the ability of the UK government to avoid a prolonged recession and manage the shock will be crucial in restabilising some normality in the bond market.
— The government’s ambition to level-up the UK’s economic prospects across different regions requires a sustained and significant commitment to higher public sector investment, most of which will be financed by fresh bond issues during the 2020-21 fiscal year and beyond. This, together with the extraordinary measures aimed at fighting the economic impact of the COVID-19, will increase government debt significantly.
— Bond issuance is slowly regaining its position as an important driver of the fixed income market. This should continue as the economy slowly recovers following the fiscal and monetary stimulus once the impact of the COVID-19 pandemic is successfully managed and global markets are no longer subject to unprecedented volatility swings.
— We envisage a decrease in 10-year government bond yields to 0.6% by year end as the need to sell bonds in order to gain liquidity. There should be some gains in the next four years, to 1.4% by the end of 2024; this reflects an increased supply of bonds thanks to fiscal expansion and an improvement in economic conditions.
— The adjustment in yield will be heralded by the limited proportion of investors who do not need to hold UK government bonds (gilts) and can trade in and out of the asset class, such as hedge funds.
— We do not envisage material issues placing the extra gilts in the market but there will be a need for more auctions (and thus, more opportunities for demand to dwindle). There will be a greater incentive to focus on the demand coming from structural investors, who seem to favour index-linked bonds and medium-duration conventional bonds; there is also huge appetite for green bonds that can be tapped. That said, the economic crisis is likely to affect buyers of bonds which could, to some extent, weaken demand.
— Government exposure to interest rate, inflation and operational risk will increase.
32
Economic Outlook Report
© 2020 KPMG LLP, a UK limited liability partnership and a member firm of the KPMG network of independent member firms affiliated with KPMG International Cooperative (“KPMG International”), a Swiss entity. All rights reserved.

A new fiscal framework to help levelling-up
The Conservative government has announced a historical surge in public borrowing in its March Budget. The stimulus is targeted at improving the economic prospects of all UK regions so that opportunities across the country are more equally shared, as well as tackling the short-term impact of the coronavirus outbreak. This follows a coordinated emergency rate cut by the Bank of England to 0.25% on 11 March. Importantly, the counter cyclical capital buffer for banks was also reduced to 0%, which should increase their lending capacity and facilitate credit flows to the private sector. In addition the Bank of England cut rates further to 0.1% on 19 March.
After a decade of austerity and with limited appetite to raise taxes, it is not surprising that most of the additional investment will be financed by an increase in public debt. This will require revisiting the fiscal framework proposed by the former Chancellor, Sajid Javid, in late 2019. The new fiscal framework will be announced later this year and will be designed to accommodate the expenditure envelope set up in the Budget for the Spending Review and any further additional fiscal stimulus announced to mitigate the economic impact of the extraordinary circumstances surrounding the COVID-19 outbreak.
In this section, we consider the likely evolution of bond yields over the next five years, taking into account the rise in borrowing associated with the fiscal expansion, including the extraordinary measures aimed at mitigating the impact of the COVID-19 outbreak on the economy and the impact of the outbreak itself which seems to have triggered a fire selling in the market.
We envisage an easing in 10-year government bond yields late in the year, as quarantine measures are gradually lifted and economic expectations improve with some gains in the subsequent next four years. We expect yields to continue to rise as a result of the new bond issuance. We present two different scenarios for yields and consider the operational aspects of the extra issuance and the key risks the government will be subject to.
Our forecast for sovereign bonds
Fixed income markets have been distorted by quantitative easing (QE). The central bank’s balance sheet expansion has possibly created a scarcity of bonds of certain maturities, which has further muffled market responsiveness to economic and political developments. Disruption has been amplified by recent market dislocation, including sharp movements in oil prices, unprecedented volatility in equity markets and concerns over a corporate debt crisis as a result of the COVID-19 outbreak – all of which would usually spur investors towards safe havens such as government bonds, but not at the moment.
However, the need to meet redemptions and, to some extent, the expected surge in bond issuance, seems to have triggered a sell-off in the bond market. Nervousness and uncertainty about the full impact of the COVID-19 outbreak is currently dominating market movements and redefining the concept of a safe haven; we believe this will change to some degree in the future, but not before the end of 2021.
33
March 2020
© 2020 KPMG LLP, a UK limited liability partnership and a member firm of the KPMG network of independent member firms affiliated with KPMG International Cooperative (“KPMG International”), a Swiss entity. All rights reserved.

Our central scenario
Indicators of activity in early 2020 have been disappointing. This, together with the harm to activity caused by the pandemic nature of the coronavirus and the need to put social distancing measures in place, make us expect a significant contraction of 2.6% in GDP growth in 2020. The outbreak will have a significant, but temporary, impact on the economy. Extra emergency help will most likely be met via further fiscal measures, as suggested by the Chancellor.
During this period, we do not expect any active unwinding of the bonds bought by the BoE as part of QE; rather, it is likely these bonds will simply continue to mature and that the BoE will thus become a less significant owner of gilts over time (see Chart 21). However, full unwinding will take a considerable amount of time since c.46% of the bonds within the BoE’s asset purchasing facility have a maturity of more than 10 years.
Investors will continue to react and adjust to coronavirus-related news in the next few months. The natural tendency towards buying bonds as a way of protecting against unprecedented market turmoil and a bear equity market may not be prevalent unless measures are put into place to help those who need liquidity. Otherwise, bonds will continue to be sold as a way to obtain cash quickly, raising yields, until economic prospects improve.
As global markets recover and the economic situation stabilises aided by the emergency fiscal and monetary measures, some sort of normality will be regained, where bonds will be considered a safe haven, with investors gravitating away from them as economic prospects start to improve in 2022. The more successful government’s plans in eventually stirring growth, the higher is the likelihood of an increase in expected inflation and therefore in interest rates (and yields) in the medium term.
We expect yields to decline as the fire selling normalises and reach 0.6% by the end of 2020, rising to 0.9% by end-2022 and to 1.4% by end-2024. These will primarily be caused by the increase in the supply of government bonds and expected inflation, heralding moderate but sustained increases in the base rate.
Our pessimistic scenario
In our pessimistic scenario, the fiscal package increases government borrowing and the debt-to-GDP ratio but has a negligible impact on capacity and medium-term growth. The COVID-19 pandemic keeps having a significant negative impact on markets and activity worldwide and the emergency measures can only muffle the impact of a small part of the shock. The currency depreciates further and the economy enters a prolonged recession. Inflation remains low for a protracted period and the poor economic performance generates further pessimism. There are further credit downgrades. The need to obtain liquidity feeds a sell-off in the bond markets, raising yields further in the short term.
Quantitative easing is perceived as ineffective at supporting economic activity. Although domestic demand has grown rather insensitive to interest rates cuts, the BoE reluctantly reduces rates below the 0 threshold to -0.5%, in a desperate attempt to stimulate growth. The UK economy becomes liquidity ‘insensitive’ in the medium term, in the sense that the extra liquidity does not have any impact on the real economy and consumers prefer to hold cash, in similar fashion to the problems experienced by the Japanese economy. Confidence remains low and pessimism permeates economic decisions. The yield curve becomes rather volatile in the short term but flat in the following years, with 10-year bond yields remaining low but positive.
Chart 19: Expected 10-year yields on gilts under different scenarios
10 y
ear
yiel
d, %
1.5
1.0
0
0.5
1.1
0.4 0.4 0.4
0.7
0.5
0.9 0.9
0.6
0.8
1.4
2019 2020 2021 2022 2023 2024
Pessimistic scenarioCentral scenario
Source: Haver, KPMG forecasts.
34
Economic Outlook Report
© 2020 KPMG LLP, a UK limited liability partnership and a member firm of the KPMG network of independent member firms affiliated with KPMG International Cooperative (“KPMG International”), a Swiss entity. All rights reserved.

The financial remit
The government will soon decide on the structure of its financing remit, in accordance with its debt management objective, the debt management framework and wider policy considerations. For the 2020-21 round, these decisions will be taken in the context of an already high debt-to-GDP ratio and high and increasing government borrowing in a period of no fiscal consolidation.
The remit specifies the annual total of gilt sales planned for the financial year and how this breaks down between index-linked and conventional gilts (plus, within conventional gilts, the maturity split between short, medium and long maturities). It reflects a debt management strategy that weighs five key risks: interest rate risk, refinancing risk, inflation risk, liquidity risk and execution risk.
The weight placed on each risk can change over time, though governments tend to attach particularly high importance to minimising near-term exposure to refinancing risk. This risk is managed by avoiding concentrating redemptions in particular years, thus spreading gilt debt issuance along the maturity spectrum. The average maturity of the UK’s debt stock is relatively high compared to other G7 countries: in December 2018, it stood at 15.2 years compared to fewer than eight years in Germany, the US, Canada, France and Japan. This may look unnecessary at a time when short-term real interest rates are negative, but the Debt Management Office (DMO) also has to encourage the development of a liquid and efficient gilt market, which demands issuance across the maturity spectrum.
Chart 20 shows the composition of central government sterling debt by instruments and over time. In February 2020, 56% of the debt portfolio consisted of index-linked and long conventional gilts.
This includes a stock of index-linked debt that accounts for about 28% of the government portfolio (considerably higher than in other G7 countries). This reflects, to some extent, the strong demand for index-linked gilts in the UK, especially from institutional investors, such as domestic pension funds and insurance companies. Meeting this demand has brought clear cost advantages, though this relatively large stock of index-linked debt also increases the sensitivity of the public finances to inflation shocks.
Chart 20: Composition of government debt (February 2020)
Index-linked
Ultra-Short Conventional
Short Conventional
Medium Conventional
Long Conventional
28%
17%
14%
14%
28%
Source: DMO.
The previous government’s commitment to reducing the proportion of index linked issuance in a measured fashion in the context of fiscal consolidation. We believe this commitment could be broken by the current government and that a significant proportion of the fresh extra debt will still be funded with index-linked government bonds (possibly long-dated), which will increase government exposure to inflation risk. The structure of the retail price index may also change following the joint consultation between the government and UK Statistics Authority.
Execution risk poses an interesting challenge. There is an operational aspect to consider since while the DMO is both efficient and competent, there are some basic capacity issues to deal with when government borrowing increases. Usually, most of the planned issuance is placed via auctions (75.2% in 2019-20), followed by syndication (18.4%, especially for long-dated conventional bonds) and unallocated issue. The number of auctions and their average size are likely to increase in 2020-21 to cope with the larger amount of gilts issuance. It may also be convenient to allow for a large amount of gilts to be placed in an unallocated form, which increases flexibility. More auctions create more opportunities for demand to dwindle.
35
March 2020
© 2020 KPMG LLP, a UK limited liability partnership and a member firm of the KPMG network of independent member firms affiliated with KPMG International Cooperative (“KPMG International”), a Swiss entity. All rights reserved.

In addition, the DMO has been updating its systems for deal input, settlement, risk management and accounting. There is an added pressure in increasing gilt issuance while implementing a relatively new operational framework.
The bids to cover ratio at auctions are strong, averaging 2.2 times over the 12 months to mid-February 2020. The two auctions with the lowest ratio (1.7 and 1.8) were of bonds with a relatively long maturity (30 years) while index-linked and 10-year maturities were more in demand (with ratios of up to 2.6 for both types). The latter become more popular during periods of uncertainty because they are typically used to hedge risk or as benchmarks in contracts.
These are healthy figures, but they are mostly lower than the average cover ratio at gilts auctions in 2017-18, which was 2.30. Since the DMO tends to front load issuance along its issuance calendar, it will be interesting to monitor whether there is any gradual change in these ratios as we enter the new fiscal year in April 2020. The presence of a deep and well-functioning gilt market remains critical to the DMO’s ability to successfully deliver its debt management objective.
We do not envisage significant problems in placing the extra debt in the short term (especially judging by the results of recent European sovereign bond placements), but the reputational risk attached to waning demand is possibly too high to run. For this reason, we believe there is a strong incentive to meet demands from institutional investors, who lately seem to favour index-linked and medium-duration gilts. Issuance of short and ultra-short bond are a given, considering the cash management responsibilities of the DMO.
This may also be a good time to reassess the benefits of issuing green bonds, which have become more popular amongst UK and international investors. However, Robert Stheeman, the head of the DMO, has expressed some caution about green bonds due to the expected higher costs attached to their issuance.
In short, the need for higher borrowing will subject the government to increasing interest, inflation and execution risk.
Demand for gilts
The three largest groups of investors in gilts are insurance companies and pension funds (holding 32% of stocks), overseas investors (28%), and the Bank of England’s Asset Purchase Facility (23%).
The UK government is relatively fortunate in that it enjoys strong structural demand for bonds from domestic institutional investors (pension funds and insurance companies), which need to buy gilts to match their liabilities and mirror their policies as part of their business as usual activities. By matching the duration of their liabilities against the duration of a fixed-income portfolio, these groups protect themselves against interest rate risk and acquire assets that increase or decrease in value inversely to their liabilities.
In addition, banks and building societies (which hold about 7% of the stock of gilts) need to buy a constant flow of bonds in order to meet their ongoing regulatory capital and liquidity needs. We note that from January 2022, the Basel IV regulation will come into force and the expectation is that capital requirements will increase. This should also help sustain an increasing demand for gilts prior to January 2022 and subsequently. Although this is a European requirement and Brexit will determine the specifics surrounding Basel IV implementation in the UK, if the BoE’s objective is to aim for regulatory equivalence, the UK will be expected to fulfill the minimum implementation timeline.
36
Economic Outlook Report
© 2020 KPMG LLP, a UK limited liability partnership and a member firm of the KPMG network of independent member firms affiliated with KPMG International Cooperative (“KPMG International”), a Swiss entity. All rights reserved.

There is structural demand for UK government bonds from international investors, though these are traditionally perceived as less ‘sticky’ than domestic buyers. There is no public data on overseas gilts investors, but all central banks which manage their exchange rates need to hold reserves and therefore will buy and hold gilts (examples include China, Switzerland and Norway). These institutions may need to readjust their sterling-denominated holdings if the pound depreciates so that the value on their balance sheet remains reasonably stable; this would partially offset the drop in demand that would typically follow a depreciation of the pound. Such investors seem to favour short-dated bonds; in December 2018 overseas investors held 49% of Treasury bills according to the DMO.
In aggregate, there are many buyers both domestically and abroad who need to buy gilts, but also some gilts holders for whom the asset class is optional; they could, for example, choose to hold UK equities or US bonds instead, which offer a higher return. For investors searching for yield and safety, UK bonds are still attractive, especially when compared to some European bonds with negative returns. Appetite for bonds as
a safe haven destination may however alter if yields become negative, if inflation increases sharply or if the equity market is perceived to have reached its bottom following the intense market volatility created by the COVID-19 outbreak.
However, overseas investors such as hedge funds from G7 countries are far more price- and FX-sensitive, and can take market positions very quickly. The supply of gilts within the market will also be affected by whether these price-sensitive investors consider the government to be more or less capable of preventing a prolonged and significant recession and eventually deliver growth. Such investors will, therefore, play an important role in the adjustment towards higher yields in the medium and long term, and in shaping the risk premium as the political situation evolves.
Although we do not envisage material issues placing the extra gilts in the market, we need to acknowledge that the economic crisis is likely to affect buyers of bonds which could, to some extent, weaken demand.
Chart 21: Gilts holding by sector (% of total)
% o
f to
tal
100%
40%
20%
0
80%
60%
-20%
Overseas investors Other financial institutionsInsurance companies and pension fundsBanks and building societiesBank of England* Other
20082004 2005 2006 2007 2009 2010 2011 2012 2013 2014 2015 2016 2017 2018 2019
Source: DMO, BoE.
*BoE data for Q3 2019 is an estimate.
37
March 2020
© 2020 KPMG LLP, a UK limited liability partnership and a member firm of the KPMG network of independent member firms affiliated with KPMG International Cooperative (“KPMG International”), a Swiss entity. All rights reserved.

So how many gilts are too many gilts?
The price of gilts can plummet if the perception is that the government is issuing too many. The judgement as to how many are too many is not independent from the overall economic environment and these are clearly exceptional circumstances. The ability to borrow is meant to be used during periods of national emergency.
For as long as nominal GDP growth remains above interest rates, it is possible that the UK’s debt-to-GDP ratio can continue to increase at a relatively limited pace without generating alarm.
The relevant interest rate in the case of the UK is the 15-year yield since this is closer to the average maturity of the existing debt stock. This return tends to be higher than the 10-year bond yield. Nominal GDP growth in the second half of 2019 was 3.0% (a figure that would also be compatible with an inflation rate between 1.5% and 2%, and a potential real growth rate of between 1.5% and 1%). The 15-year nominal forward curve tends to be between 1.9% and 2%. In other words, there is a cushion of more than a percentage point. While rates remain low, it is difficult to envisage a situation where paying the interest on accumulated debt would become significantly burdensome.
If flows are not the immediate issue, what about the stock? The rise in borrowing associated with the proposed fiscal package and the additional measures aimed at combating the impact of the COVID-19 will translate into gross government debt-to-GDP ratio rising above the current 82% in the medium term. The threshold for the gross debt-to-GDP ratio which, according to Reinhart and Rogoff (2010), could have a negative impact on growth is 90%. Although controversial, the Reinhard and Rogoff paper offers a benchmark. However, experience suggests that the threshold for developed countries may be higher, with a 135% debt-to-GDP ratio in Italy and 238% debt-to-GDP ratio in Japan.
Future governments are likely to have to undertake sustained fiscal tightening in order to address the costs of an ageing population and upward pressures on health spending. Eventually, tax increases will be needed to balance the accounts, even when allowing for stronger productivity growth in the future. However, a responsible government can move towards an unsustainable fiscal path (for example due to an ageing population and upward pressure on health spending), without ever coming close to default, if it adopts economic policies that generate a meaningful primary surplus.
Once the UK economy is on a stronger path, the international environment has become more supportive of growth, COVID-19 pandemic is over and interest rates have moved well above current levels, the UK will need to engage, yet again, in discussions about fiscal discipline. This will require more than five years, but nonetheless, as we head into the new normal, we should be mindful that history will repeat itself.
38
Economic Outlook Report
© 2020 KPMG LLP, a UK limited liability partnership and a member firm of the KPMG network of independent member firms affiliated with KPMG International Cooperative (“KPMG International”), a Swiss entity. All rights reserved.

3939

How new technologies could accelerate growth
© 2020 KPMG LLP, a UK limited liability partnership and a member firm of the KPMG network of independent member firms affiliated with KPMG International Cooperative (“KPMG International”), a Swiss entity. All rights reserved.


How new technologies could accelerate growth
Emerging technologies offer the promise of faster growth in productivity and incomes. This would be a decisive break from the experience of the past decade when weak productivity growth became part of the ‘new normal’.
In this section we explore the economic changes potentially prompted by these technologies and how different sectors might fare in what is sometimes referred to as the ‘second machine age’. We expect the greatest impacts to be felt in:
— Transport and logistics, with the advent of electric and autonomous vehicles transforming automotive, transport and insurance;
— Manufacturing, where 3D printing, the internet of things and industrial robotics will transform production;
— Financial services, where artificial intelligence (AI), machine learning and digital business models offer new ways to provide financial services.
While a number of emerging technologies are competing for attention, in this section we look in particular at five technologies we expect to have a significant impact on these sectors and the broader global economy:
— The internet of things – the addition of sensors and internet connectivity to machines, warehouses and other physical infrastructure, enables tracking and automatic verification and responses;
— Machine learning and AI – it is increasingly possible to automate decision making, as well as some of the tasks that are currently performed by humans; radiology and accounting6 are just a few examples of professions at risk of automation;
— Industrial robotics – even more highly automated manufacturing will enhance both productivity and the flexibility of manufacturing;
— 3D printing – objects built up from materials on site enable benefits such as local production of more complex part;
— Autonomous vehicles – this is a specific but important application of machine learning.
6 See WEF, The Future of jobs Report, 2018.
42
Economic Outlook Report
© 2020 KPMG LLP, a UK limited liability partnership and a member firm of the KPMG network of independent member firms affiliated with KPMG International Cooperative (“KPMG International”), a Swiss entity. All rights reserved.

Transport and logistics
Technological advances in transport and logistics could evolve as the result of sequential developments across related and complementary technologies:
— Electric vehicle (EV) adoption;
— Autonomous vehicle (AV) adoption;
— The development of mobility-as-a-service (MaaS).
Given that human error is the cause of at least nine in ten road accidents7, such advances have the potential to significantly improve road safety. Other benefits include improving the efficiency of public transport and freight services8, and enabling cleaner cities with more green space and room for recreation activities.
The overall economic impacts of this technology could include:
— lower cost passenger transport and logistics;
— significant transformation of some sectors’ business models, including motor insurance, car servicing, and fuel stations;
— reduced demand for labour in the sector.
Large-scale investment would be required to facilitate a shift to new energy source, and public investment may be needed to fund the early phases of developing new infrastructure. Further investment, for example in 5G telecoms infrastructure, will be necessary for the full implementation of AV technology to go ahead.
Electric vehicle technology
Cost continues to be the main obstacle to the widespread adoption of EV technology, with batteries accounting for the most significant element of overall vehicle cost. KPMG estimates that in terms of total ownership cost – the cost of acquiring and operating a vehicle – we will reach parity between EVs and vehicles with traditional combustion engines in the early 2020s, with further cost reductions subsequently.
Another challenge is range of travel (which is related to the cost of battery), where EVs do not currently match conventionally fuelled cars. Widespread adoption will also require significant investment in charging infrastructure, with some public subsidy potentially needed in early stages.
The benefits from EV adoption range from a cleaner environment to falling vehicle servicing costs as a result of fewer engine parts.
The shift will require a change to the current model of the after-sale care market and prompt a gradual reduction in demand for conventional fuels, accompanied by increased demand on the electricity network.
7 See a summary by Bryant Walker Smith from Stanford Law School on http://cyberlaw.stanford.edu/blog/2013/12/human-error-cause-vehicle-crashes.8 See https://arrival.com.
43
March 2020
© 2020 KPMG LLP, a UK limited liability partnership and a member firm of the KPMG network of independent member firms affiliated with KPMG International Cooperative (“KPMG International”), a Swiss entity. All rights reserved.

Autonomous vehicle technology
Automation could drastically reduce the cost of moving goods and people around. However, automation technology is expected to gradually emerge in distinct stages, unlocking novel economic applications (see Chart 22).
While the final phase of full automation may still be some way off, substantial operational cost savings and safety benefits are available from earlier phases. We are already between stage 1 and 2 of adoption, enjoying benefits from vehicles that provide ‘lane assistance’ and that can perform some manoeuvres such as parking. More advanced technologies are at various stages of testing and preliminary deployment in different countries.
The benefits from wide-scale adoption of autonomous vehicle adoption could include:
— improved safety and reduced insurance costs;
— the potential transformation of public transport, enabling providers to move from fixed-route, fixed-timetable bus services to on-demand autonomous alternatives, providing a more efficient and effective way to take people from door to door;
— increased efficiency in transport and logistics, thanks to ideas such as platooning, where one human-driven vehicle leads a convoy of autonomous ones, reducing air resistance and saving fuel;
— enabling public authorities to track and optimise the flow of vehicles.
The adoption of autonomous vehicles would lead to the gradual elimination of human input in the transport and logistics sector,
and falling demand for drivers. There is also likely to be a gradual shift of the insurance burden to the manufacturer for the responsibility of driving, which will require changes in the motor insurance industry.
AV could herald a new era of vehicles that are in use 24 hours a day, rather than mostly sat idle. This will mean fewer vehicles are needed, capital can be deployed more efficiently and roads infrastructure will suffer less congestion during peak times.
It could also influence where people choose to live and spend their leisure time, with less accessible places becoming more popular. This could ease pressure on housing within cities’ green belts, as well as make more remote places attractive.
Mobility-as-a-service
In the UK, mobility-as-a-service (MaaS) is expected to generate a shift in the ownership model for vehicles, with people summoning vehicles as and when they need transport rather than keeping their own car. Uber and other mobile platforms offer a preview of what MaaS could enable and there is already some evidence of lower vehicle ownership and driving licence uptake amongst younger people.
Taking EVs, AVs and MaaS together, we could see:
— less capital tied up in vehicles and logistics infrastructure;
— lower costs of transport and logistics;
— less labour required for this sector;
— a reshaping of the urban and suburban landscape, with regions beyond large urban centres benefiting from increased demand for second homes and short breaks.
Chart 22: Stages in AV adoption
Stage 1Driver assistance
Limited improvements in safety and efficiency in specific contexts.
Stage 2Partial automation
Further improvements in safety and efficiency in specific contexts.
Stage 3Conditional automation
Potential improvements in fuel efficiency due to platoon driving on highways. Further potential safety improvements in specific contexts.
Stage 4High automation
Potential for safety improvements, potential reduction in human involvement due to remote driver intervention. Insurance burden shifts away from driver and onto car manufacturer.
Stage 5Full automation
Fully automated logistics, higher utilisation rate for vehicles, lower costs of transportation.
Source: KPMG, Connected and autonomous vehicles – The UK economic opportunity.44
Economic Outlook Report
© 2020 KPMG LLP, a UK limited liability partnership and a member firm of the KPMG network of independent member firms affiliated with KPMG International Cooperative (“KPMG International”), a Swiss entity. All rights reserved.

Manufacturing
Many technologies already available have the potential to impact on multiple stages of the production cycle. The term ‘Industry 4.0’ is often used to describe these technologies and their impact collectively.
The many value-additive opportunities offered by these technologies span multiple stages in the manufacturing process, from design and development to after-market servicing. We consider three stages of the value chain.
Research & development and planning
Traditionally, this is the stage of production with some of the highest margins in the entire value chain and new technologies could improve these further. There is the potential to enhance both productivity and efficiency, reducing the cost of conducting research and the time required to take a product to market.
For example, in the pharmaceuticals sector, algorithms can help identify the most promising chemical structures before they are tested and used to develop new drugs.9 In the building industry, real-time location data can help planners observe and analyse how people use public spaces so that designs take their needs into account.
In addition, big data analytics can play a role in optimising the manufacturing process, particularly as the development of the internet of things makes it possible to observe and track the workflows across the shop floor.10 It is already possible to create ‘digital twins’ of assets or components11, which can be used to improve the reliability of real assets, enhance production and reduce maintenance costs. As further advances are made, these technologies are likely to become more widespread and will impact a large proportion of existing value chains in the production sectors.
Buy and make
Increased automation of manufacturing processes is already progressing apace. At the beginning of 2020, the Industrial Federation of Robotics reported that there were 2.4 million industrial robots already operating in factories around the world.12 These help to improve productivity, but also drive improvements in quality and quality assurance processes during production.
Additionally, increasing the use of 3D printing could lead to the development of new products that can be customised for end-users, and make it viable to produce items in smaller production runs. Hearing aid manufacturers, for example, are using 3D printing tools to manufacture each aid to better fit the user, improving the efficiency of the device.13
3D printing represents a radical break from traditional production processes and offers:
— reduced loss due to material wastage as parts are built up;
— lower production lead times as once prepared, the 3D printer can manufacture any part, regardless of complexity or shape;
— relatively fixed variable costs for each part produced as the only cost is material and printer time.
We expect 3D printing to become more widely used as new materials become available and the capital cost of 3D printers declines. The cost structure of the 3D printing process makes it relatively more attractive to small production runs, particularly for the production of custom parts shaped to users’ preferences.
9 See Francesca Lake , ‘Artificial intelligence in drug discovery: what is new, and what is next?’, Future Drug Discovery 2019 1:2.10 See Yingfeng Zhang, Fei Tao, ‘Optimization of Manufacturing Systems Using the Internet of Things’, Academic Press, 2017.11 See GE, Digital twin, accessed from: https://www.ge.com/digital/applications/digital-twin.12 See IFR, 2020, accessed from: https://ifr.org/ifr-press-releases/news/facts-about-robots-worldwide. 13 See Christian G. Sandström, ‘The non-disruptive emergence of an ecosystem for 3D Printing — Insights from the hearing aid industry’s transition 1989–2008’,
Technological Forecasting & Social Change, 2015.45
March 2020
© 2020 KPMG LLP, a UK limited liability partnership and a member firm of the KPMG network of independent member firms affiliated with KPMG International Cooperative (“KPMG International”), a Swiss entity. All rights reserved.

Logistics, sales and aftersales
Autonomous vehicles could drastically reduce the costs of logistics and delivery, especially as drones can be used to make last-mile deliveries. Amazon is already actively seeking to develop drone technologies to make deliveries using its ‘Prime Air’ service14, which in future could be used to make deliveries to customers.
The biggest impact on the after-sale market is likely to come from increased use of sensors and the internet of things.15 Rather than offering a reactive service following a failure of a device or part, by embedding sensors and monitoring performance; failures in components could be diagnosed and prevented before they occur. This opens new opportunities where manufacturers could offer to lease parts and components for fixed number of operating hours, with technology enabling an efficient execution of these contracts.
With a wide range of potential applications and a variety of different uses, the overall impact of these technologies may take decades to be fully realised and will have a significant impact on productivity.
Financial services
Developments in financial technology (fintech) – especially those powered by new developments in AI – could have a significant impact on activity in the financial services sector. While a number of different applications are already in use or can be envisaged, we expect the largest impacts to come from widening access and reducing the transactions costs of existing financial services.
For example, consider the M-PESA mobile payment service launched on a pilot basis in October 2005 in Kenya. The service gives mobile phone users without access to a bank account many of the benefits of financial services, including the ability to transfer money and make payments. Some estimates suggest this system has lifted 2% of Kenyan households out of poverty.16
Elsewhere, financial services companies are making better use of data in order to enable lending to some borrowers who lack collateral. This is the model used by Ant Financial in China17, which analyses data on previous transactions and bill-paying behaviours when considering loans to small- and micro-businesses, rather than demanding collateral they are unlikely to possess. Access to finance is an important enabler for these businesses, which in turn drives positive effects for the broader economy.
In general, the impacts of fintech can be separated into two groups: some technologies reduce costs and improve efficiency for existing users; while others provide new ways to ensure access to financial products and services for customers who were previously excluded.
14 See Amazon Prime Air, accessed from: https://www.amazon.com/Amazon-Prime-Air/b?ie=UTF8&node=8037720011.15 See Harvard Business Review, ‘How Smart, Connected Products Are Transforming After-Sales Service’, 2015.16 See Tavneet Suri, and, William Jack (2016). “The Long-run Poverty and Gender Impacts of Mobile Money”. Science. 354 (6317): 1288–1292.17 See International Finance Corporation, Leveraging Big Data for Lending in China Case Study, World Bank Group.
46
Economic Outlook Report
© 2020 KPMG LLP, a UK limited liability partnership and a member firm of the KPMG network of independent member firms affiliated with KPMG International Cooperative (“KPMG International”), a Swiss entity. All rights reserved.

Conclusion: dealing with change
As the majority of technologies on the horizon have a bias towards increasing the capital-intensity of production, there are question marks over whether demand for labour can be sustained. Technological unemployment may become a reality if the job-stealing effect of these new technologies is not mitigated by simultaneous and robust growth in other labour-intensive tasks. This may attract significant level of public attention.
The greatest challenge may lie in the need to equip workers with the skills to work with constantly evolving AI technologies. An increasing emphasis on lifelong learning is essential as the expected pace of change will be much faster than traditional educational systems can support.
Equally, regulation, particularly on the way data is used and owned, is an essential pre-condition to wider adoption. Without regulation that secures public trust, acceptance will be difficult and hostility towards these technologies will increase.18
There is also a pressing need for flexibility because the full impacts of these emerging technologies are not yet clear. Some authors have pointed to the limited nature of these technologies compared to the enormous changes that took place during the 20th century19, inferring that the likely boost to productivity growth would remain small. Others are more optimistic and argue that since new technologies require a period of investment and adoption, current low pace of productivity growth is temporary and is set to accelerate in the near future.20 Our response will need to evolve as the picture becomes clearer, but at the moment new technology in the pipeline looks promising.
18 See KPMG, ‘How the UK can win the AI race’, 2018.19 For example, Robert Gordon, ‘The Economics of Secular Stagnation’, American Economic Review: Papers & Proceedings 2015, 105(5): 54–59. 20 For example, Brynjolfsson, Erik, Daniel Rock, and Chad Syverson. The productivity J-curve: How intangibles complement general purpose technologies.
No. w25148. National Bureau of Economic Research, 2018.47
March 2020
© 2020 KPMG LLP, a UK limited liability partnership and a member firm of the KPMG network of independent member firms affiliated with KPMG International Cooperative (“KPMG International”), a Swiss entity. All rights reserved.

Contact details
Yael Selfin Chief Economist, KPMG in the UK T +44 (0)20 7311 2074 E [email protected]
Dennis Tatarkov Senior Economist, KPMG in the UK T +44 (0)20 7311 2210 E [email protected]
Weiye Kou Economist, KPMG in the UK T +44 (0)20 7311 5073 E [email protected]
© 2020 KPMG LLP, a UK limited liability partnership and a member firm of the KPMG network of independent member firms affiliated with KPMG International Cooperative (“KPMG International”), a Swiss entity. All rights reserved. Printed in the United Kingdom.
The KPMG name and logo are registered trademarks or trademarks of KPMG International.
The information contained herein is of a general nature and is not intended to address the circumstances of any particular individual or entity. Although we endeavour to provide accurate and timely information, there can be no guarantee that such information is accurate as of the date it is received or that it will continue to be accurate in the future. No one should act on such information without appropriate professional advice after a thorough examination of the particular situation.
CREATE | CRT124765 | March 2020