
Who Cares Wins: employer support and employment rights for carers in the UK Madeleine Starr MBE
Upload
truongngocCategory
view
220download
3
Evidence Report 81January 2014
UK Commission’s Employer Skills Survey 2013: UK Results

Header title here…
The UK Commission’s Employer Skills Survey 2013: UK Results
Winterbotham M., Vivian D., Shury J. and Davies B.
IFF Research
Genna Kik
Senior Research Manager
UK Commission for Employment and Skills
January 2014

2
Foreword
Employers in the UK today face many challenges, including on-going globalisation,
technological change and changing consumer demands. After one of the harshest economic
crises seen for a generation, UK productivity is still below the levels seen before the
recession. Looking to the future, if we are to achieve sustained economic growth and global
competitiveness, investment in the skills and talents of the UK workforce will be crucial.
The UK Commission’s Employer Skills Survey gives us reliable, timely and valuable insight
into the skills issues being faced by employers and the action they are taking to address
these. The survey provides a wealth of data on these issues and, for the first time, we can
investigate change over time on a consistent basis right across the UK labour market. The
Commission is very grateful to the more than 91,000 businesses, across all sectors, who
participated in the research.
So what do to findings tell us about how employers are behaving? In support of the
economic turnaround, the survey highlights some positive trends. However, it also identifies
some clear priorities for action.
Today too many organisations find it hard to recruit the skilled people they need; this poses
serious risks to the health and survival of businesses and to their bottom line performance.
The survey reveals a sharp rise in skills shortages which may be holding back the UK’s
economic recovery. This is not a new phenomenon. Such deficiencies have persisted over
time in some sectors and occupations indicating that there is a need to take decisive action.
At the same time as a growing shortage of certain skills there is also evidence of a surplus
and mismatch in other areas, with the survey finding that almost half of employers report
having staff with skills and qualifications beyond those required for their current job. There
are also indications of pressures on skills investment. For example, the amount spent on
training has fallen by £2.5 billion since 2011. The survey also questions whether UK
employers are being ambitious enough when it comes to both investing in their people and
their broader business strategies.
At the UK Commission for Employment and Skills we will continue to work with and through
our partners to develop solutions to the skills challenges highlighted in this survey. As a
social partnership led by Commissioners from large and small employers, trade unions and
the voluntary sector, our aim is to improve the future of workforce skills in the UK by
providing access to investment, world-class research and expert insight.

3
I hope you find this report useful. It will be followed by evidence toolkits for each of the
nations of the UK and local partners, as well as thematic reports exploring key issues within
the survey.
We are keen to make the data and analysis in this report as accessible as possible and to
assist with its interpretation in the commentary provided. We would also welcome feedback
on how we could make our research even more relevant. If you have any queries or
comments on this report, or would just like to know more about the Commission’s work,
please e-mail [email protected], quoting the report title.
Sir Charlie Mayfield,
Chairman, John Lewis Partnership
Chair, UK Commission for Employment and Skills

4
Acknowledgements
Many individuals and organisations have been involved in the design and execution of the
UK Commission’s Employer Skills Survey 2013. Particular thanks are given to the 91,000
businesses who responded to the questionnaire. As the lead contractor, we have been
supported by the research agencies who conducted much of the fieldwork: BMG Research,
GfK-NOP and Ipsos MORI.
The project was supported by the four UK governments; a steering group was established to
guide the direction of the project. Members attending this group were: Robin Elliot-Marshall,
Department for Business, Innovation and Skills (BIS); Dominic Rice, BIS; Vikki McCauley,
BIS; Kate Murphy, BIS; Stuart King, Scottish Government; Joanne Corke, Welsh
Government; James Carey, Welsh Government; Victor Dukelow; Department for
Employment and Learning Northern Ireland (DELNI); Graham Belshaw, DELNI; Tracy
Power, DELNI; Alastair Yeo, Department for Work and Pensions (DWP); Lewis Childs,
DWP; Kate Lager, DWP; Ella Taylor, DWP; Anthony Clarke, Department for Education
(DFE); Stuart Vickers, Skills Funding Agency; Carol Stanfield, UK Commission for
Employment and Skills (UKCES); and Vicki Belt, UKCES.
Particular thanks are also due to staff at the UK Commission who supported the preparation
of this report, including Vicki Belt, Rebecca Jones, Thomas Glynn, Charlotte McDonough,
Angela Thompson, Marc Bayliss, and in particular to the project manager throughout the
course of the survey, Genna Kik at the UK Commission.
Jan Shury
Joint Managing Director, IFF Research Ltd.
Table of Contents
Glossary ................................................................................................................ 6
Key findings ......................................................................................................... 8
Executive Summary ............................................................................................. 9
1 Introduction ................................................................................................ 15
1.1 The UK-wide employer skills survey ................................................................... 15
1.2 Methodological overview ...................................................................................... 16
1.2.1 Survey sampling .................................................................................................... 16
1.2.2 Survey questionnaire ............................................................................................ 17
1.2.3 Survey fieldwork .................................................................................................... 17
1.2.4 Data weighting ....................................................................................................... 18
1.3 The nature of UK establishments: describing the survey population ............. 18
1.4 Structure of this report .......................................................................................... 21
1.5 Reporting conventions .......................................................................................... 22
2 Employers’ Experience of Skill Shortages .............................................. 23
2.1 Chapter Summary .................................................................................................. 23
2.2 Introduction ............................................................................................................ 24
2.3 Vacancies ............................................................................................................... 25
2.4 Skill-shortage vacancies ....................................................................................... 27
2.4.1 The incidence, volume and density of skill-shortage vacancies ...................... 27
2.4.2 Skills lacking in the available labour market ...................................................... 31
2.4.3 The impact of skill-shortage vacancies on employers ...................................... 33
2.5 Wider recruitment challenges and hard-to-fill vacancies .................................. 34
2.6 Conclusions ........................................................................................................... 35
3 The Internal Skills Challenge .................................................................... 36
3.1 Summary ................................................................................................................. 36
3.2 Introduction ............................................................................................................ 37
3.2.1 The prevalence of skills gaps ............................................................................... 38
3.2.2 The occupational distribution of skills gaps ...................................................... 40
3.3 The causes of skills gaps ..................................................................................... 43
3.4 Skills lacking internally ......................................................................................... 44
3.5 The impact of skills gaps ...................................................................................... 46
3.6 Employer response to skills gaps ........................................................................ 47
3.7 Skills deficiencies among existing staff and when recruiting .......................... 49

2
3.8 Under-use of skills ................................................................................................. 49
3.8.1 The prevalence of under-use of skills ................................................................. 49
3.9 Upskilling ................................................................................................................ 51
3.9.1 The prevalence of upskilling needs ..................................................................... 51
3.9.2 Occupations most affected by the need for upskilling ...................................... 53
3.9.3 Upskilling: skills that need improving or updating ............................................ 54
3.10 Conclusions ........................................................................................................... 55
4 Training and Workforce Development ..................................................... 56
4.1 Summary ................................................................................................................. 56
4.2 Introduction ............................................................................................................ 57
4.3 Incidence of training and workforce development ............................................. 57
4.4 Other wider activity to aid the development of staff .......................................... 59
4.5 Barriers and limits on training .............................................................................. 60
4.6 Types of training provided .................................................................................... 63
4.7 Numbers trained .................................................................................................... 64
4.8 Training days .......................................................................................................... 66
4.9 Training to qualifications ...................................................................................... 69
4.10 Investment in Training .......................................................................................... 71
4.11 Conclusions ........................................................................................................... 76
5 Recruitment of Young People .................................................................. 78
5.1 Summary ................................................................................................................. 78
5.2 Introduction ............................................................................................................ 79
5.3 Recruitment of education leavers ........................................................................ 81
5.3.1 Recruitment from different stages of education ................................................ 82
5.4 Perceived work readiness of education leavers ................................................. 85
5.5 Skills and attributes lacking in education leavers ............................................. 88
5.6 Recruitment of young people ............................................................................... 89
5.7 Barriers to recruiting young people..................................................................... 90
5.8 Skills deficiencies and training among employers who recruit young people 92
5.9 Conclusions ........................................................................................................... 93
6 High Performance Working Practices and Product Market Strategies . 95
6.1 Chapter Summary .................................................................................................. 95
6.2 Introduction ............................................................................................................ 96
6.3 High Performance Working .................................................................................. 96
6.3.1 The relationship between HPW and skills shortages ........................................ 98
6.3.2 The relationship between HPW and skills gaps ................................................. 99
3
6.3.3 The relationship between HPW and training .................................................... 100
6.4 Product market strategies .................................................................................. 100
6.4.1 Deriving a composite Product Market Index ..................................................... 102
6.4.2 Profiling higher and lower composite PMS score employers ......................... 103
6.4.3 Relationship between PMS and skills shortages ............................................. 104
6.4.4 The relationship between PMS and skills gaps ................................................ 106
6.4.5 The relationship between PMS and training ..................................................... 107
6.5 Conclusions ......................................................................................................... 108
7 Conclusions ............................................................................................. 110
Annex A: Supplementary Tables .................................................................... 114
Annex B: National Time Series Tables ........................................................... 167
Annex C: Industry Coding ............................................................................... 172
Annex D: Occupational Coding ...................................................................... 176
Annex E: Sampling Error and Statistical Confidence ................................... 177
Annex F: Weighted Base Sizes ...................................................................... 179
Annex G: Unweighted Base Sizes ................................................................. 180
Annex H: A Note on Proficiency and Skills Gaps……………………………..181
Annex I: Technical Appendix .......................................................................... 182
Employer Skills Survey: Wave 1 ...................................................................................... 182
Employer Skills Survey: Investment in Training follow-up .......................................... 185
Annex J: Effect of the 2+ Employment Reweight on 2011 Data ................... 187
Annex K: Bibliography .................................................................................... 189
Annex L: List of Previous Publications………………………………………….190

4
Table of Graphs and Charts
Table 1.1 Survey response rates ................................................................................................. 18
Figure 1.1 Headline information on the profile of UK establishments and employment ...... 20
Table 2.1 Incidence and density of vacancies by country ....................................................... 26
Table 2.2 Incidence and density of skill-shortage vacancies (SSVs) by country .................. 27
Figure 2.1 Density and number of skill-shortage vacancies by occupation (2011 vs 2013) 29
Figure 2.2 Density of skill-shortage vacancies – occupation, occupation within sector, and by sector……………… ................................................................................................................... 30
Figure 2.3 Skills lacking among applicants (prompted) ......................................................... 322
Figure 2.4 Impact of skill-shortage vacancies (prompted) ...................................................... 34
Table 3.1: Incidence, number and density of skills gaps by country (2011 vs. 2013) ............ 39
Table 3.2: Number and density of skills gaps by occupation (2011 vs. 2013) ....................... 40
Figure 3.1 Density of skills gaps by sector, occupation and occupation within sector ....... 42
Table 3.3: Main causes of skills gaps (prompted), by nation .................................................. 44
Table 3.4 Skills lacking among staff with skills gaps followed up, by nation ........................ 45
Table 3.5 Impact of skills gaps (prompted), by nation ....................................................... 47
Figure 3.2: Actions taken to overcome skills gaps (prompted) .............................................. 48
Table 3.6 Incidence, number and density of staff who are both over-qualified and over-skilled by country (2011 vs. 2013) ............................................................................................... 50
Table 3.7: Whether expect employees will need to acquire new skills or knowledge in the next 12 months, and the reasons for this (prompted), by country .......................................... 52
Figure 3.3 Single occupation most affected by the need for upskilling ................................. 53
Figure 3.4 Skills which need improving or updating in the next 12 months (prompted) ...... 54
Figure 4.1 Training provision over the last 12 months............................................................. 58
Figure 4.2: Employer interest in undertaking more training over the last 12 months than they were able to provide ............................................................................................................. 62
Figure 4.3 Types of training provided over the last 12 months by employers that train (prompted)…. .................................................................................................................... ………..63
Table 4.1 Number of staff trained over the last 12 months and the proportion of staff trained by establishment size and country ................................................................................ 65
Figure 4.4 Proportion of staff trained over the last 12 months by occupation 2013 vs. 2011………….. ................................................................................................................................ 66
Table 4.2 Total training and development days, and days per person trained and per employee (2011 vs. 2013) ............................................................................................................. 68
Table 4.3 Training to nationally recognised qualifications over the previous 12 months .... 70
Table 4.4 Total training expenditure and spend per person trained and per employee (2011 vs. 2013)……… ............................................................................................................................... 72
Table 4.5 Total training expenditure broken down by individual components (2011 vs. 2013)………… ................................................................................................................................. 74
Table 4.6: Training expenditure by country and size, the proportion spent on off-the-job elements, and the breakdown of total training expenditure (both on-the-job and off-the-job) by key elements ............................................................................................................................. 75
Figure 5.1 Employer recruitment of young people - summary ................................................ 80

5
Table 5.1 Incidence of recruitment of education leavers into their first jobs by country (2011 vs. 2013) ............................................................................................................................... 82
Figure 5.2 Incidence of recruitment in the last 2-3 years of education leavers into their first jobs by size of establishment ...................................................................................................... 83
Table 5.2 Sector patterns of recruitment of education leavers ............................................... 84
Figure 5.3 Work-readiness of those recruited straight from education ................................. 86
Table 5.3 Skills and attributes lacking in education leavers ................................................... 88
Figure 5.4 Reasons why some recruiting employers do not recruit young people .............. 90
Table 5.4 Skills deficiencies and training activity among employers who recruit young people and education leavers ...................................................................................................... 92
Figure 6.1 Employer adoption of High Performance Working Practices................................ 97
Figure 6.2 Incidence and density of vacancies, hard-to-fill vacancies and skill-shortage vacancies by HPW classification and size ................................................................................. 99
Table 6.1 Incidence, volume and density of skills gaps by HPW classification .................... 99
Figure 6.3 Product Market Strategy positions ......................................................................... 101
Table 6.2 Overall composite Product Market Strategy scores .............................................. 102
Table 6.3 Overall composite Product Market Strategy scores by size ................................. 103
Figure 6.4 Incidence of vacancies, hard-to-fill vacancies and skill-shortage vacancies by Product Market Strategy classification ..................................................................................... 104
Figure 6.5 Proportion of all vacancies that were hard-to-fill and that were skill-shortage vacancies by Product Market Strategy classification ............................................................. 105
Table 6.4 Incidence, volume and density of skills gaps by Product Market Strategy classification ……………………………………………………………………………………………106
Table 6.5 Main causes of skills gaps (prompted), by Product Market Strategy................... 107
Figure 6.6 Incidence of training by Product Market Strategy classification ........................ 108

6
Glossary
This glossary gives a short guide to the key terms used in this report:
Establishment (also referred to as workplace, business, employer, site)
A single location of an organisation with people
working at it.
Vacancy density The number of vacancies as a proportion of all
employment.
Hard-to-fill vacancies Vacancies which are proving difficult to fill, as
defined by the establishment (from question: “Are
any of these vacancies proving hard-to-fill?”).
Hard-to-fill vacancy density
The number of hard-to-fill vacancies as a proportion
of all vacancies.
Skill-shortage vacancies (SSVs)
Vacancies which are proving difficult to fill due to
the establishment not being able to find applicants
with the appropriate skills, qualifications or
experience.
Skill-shortage vacancy density
The number of skill-shortage vacancies as a
proportion of all vacancies
Skills gaps A “skills gap” is where an employee is not fully
proficient, i.e. is not able to do their job to the
required level. See Annex H.

7
Skills gap density
The number of staff reported as being not fully
proficient as a proportion of all employment.
Under-use of skills An employee is “under-used” if the employer reports
they have both more skills and more qualifications
than are required to perform the job role they are
currently in.
Upskilling A need for employees to gain new skills, beyond the
requirements of their current job role, in order to
perform their role in future.
Product Market Strategy (PMS)
An establishment’s PMS score is worked out from
the combined answers of four questions:
How customised their output is;
How price dependent their offering is;
How innovative the establishment is;
Whether outputs are premium or basic quality.
A high PMS score would indicate outputs are
customised, not price-dependent, premium quality
and the establishment often leads the way in
product development.
Level 4 and above qualifications
Qualifications at or above Level 4 on the National
Qualifications Framework. Includes HNDs, HNCs,
foundation degrees and degrees, postgraduate
degrees, and some vocational and professional
qualifications.
Sector For definitions of the different sector groupings used
in this report please refer to Annex C.
Occupations For definitions of the occupational groups used in
this report please refer to Annex D.

8
Key findings
UK
CE
SS
20
11
UK
CE
SS
20
13
Vacancies and skill-shortage vacancies
% of establishments with any vacancies 14% 15%
% of establishments with any hard-to-fill vacancies 4% 5%
% with SSVs 3% 4%
% of all vacancies which are SSVs 16% 22%
Number of vacancies 586,500 655,000
Number of skill-shortage vacancies 91,400 146,200
Skills gaps
% of establishments with any staff not fully proficient 17% 15%
Number of skills gaps 1,485,500 1,409,900
Number of staff not fully proficient as a % of employment 6% 5%
Training
% of establishments training staff over the last 12 months 65% 66%
% of establishments providing off-the-job training in the last 12 months
47% 49%
% of workforce trained 55% 62%
Total days training 115m 113m
Total training expenditure £45.3bn £42.9bn
Vacancies, skill-shortage vacancies and skills gaps rounded to the nearest 100.
2011 data has been reweighted to be comparable to 2013 data. For details see Annex J of this report, and
the Technical Report that accompanies this volume.

9
Executive Summary
Executive Summary
The UK Commission’s Employer Skills Survey is the definitive source of intelligence on
employer investment in skills in the UK. The survey was first conducted at UK wide level
in 2011, developing from a series of legacy surveys conducted in each of the countries of
the UK during the 1990s and the 2000s. The 2013 survey represents the second edition
in the combined UK series. It explores the skills challenges that employers face both
within their existing workforces and in terms of bringing in new skilled labour, the levels
and nature of training investment, recruitment of young people and education leavers and
the relationship between skills challenges, training activity and business strategy.
Like its predecessor, the study reports on the experiences of employers at the
establishment level, rather than at the enterprise level. Sole traders and establishments
with just one employee and no working proprietors were excluded from the survey
population.
The survey constitutes a powerful data source: this report presents an initial cut of
findings. Accompanying the report are also data tabulations and a data file which can be
found here: www.ukces.org.uk/ourwork/employer-skills-survey . Further reports looking at
the survey in more depth from different perspectives will follow throughout 2014.
Skill shortages
The survey supports a picture of a UK economy which is moving towards recovery.
The number of employers reporting vacancies at the time of the survey (March to July
2013) was higher than at the equivalent time in 2011 (up from 14 per cent to 15 per cent),
as was the number of vacancies that they reported (655,000 in 2013, a rise of 12% from
2011).
Within England vacancies are back to pre-recession levels, employers reported a total of
559,600 job vacancies, a rise of 45% per cent from 2009.
While the more recent macroeconomic data are more encouraging, signs of recovery
were less clear in Northern Ireland, where the proportion of employers reporting
vacancies has remained consistently behind the UK average (and unchanged at ten per
cent in 2011 and 2013).

10
Economic growth and recovery may be constrained by skill shortages as the
labour market responds to employer requirements. While in most cases demand for
skills is met through successful recruitment, almost three in ten vacancies are reported to
be hard-to-fill, and shortages in suitably skilled, qualified and/or experienced workers are
the main reason for this. Overall, such skill-shortage vacancies represent more than one
in five of all vacancies (22 per cent), up from one in six in 2011 (16 per cent).
The picture of skill shortages across the UK varies by country as does the change
in available skills since 2011. The largest shortfall is reported in Scotland where a
quarter of all vacancies are hard-to-fill because of a shortage in available skills, up from
15 per cent in 2011. Within England, the longer time series available shows the number
of skill-shortages has nearly doubled since 2009, increasing from 63,100 to 124,800.
Skill shortages differ by occupation and pockets of shortages remain largely
unchanged since 2011. Skilled Trades roles remain the most common occupation
where skill shortages are likely to be encountered when employers recruit for these roles.
In 2011, managerial roles were the next most challenged by shortages in available skills;
since then, the challenge has shifted towards Professionals, Associate Professionals,
Caring, Leisure and Other services staff and Machine Operatives.
There appears to have been an increased difficulty finding appropriate oral and written
communication, literacy and numeracy skills. These core generic skills were all cited as
lacking by greater proportions of employers reporting skill-shortage vacancies than in
2011.
Skill gaps
Most employers report that they have a proficient workforce with no skill gaps: 15
per cent report that some of their staff are not fully proficient, and these skills gaps
represent only one in 20 employees (five per cent). This represents a slight fall in the
proportion of workplaces with proficiency challenges since 2011 (when the figures stood
at 17 per cent), but a broadly consistent picture in terms of the proportion of the workforce
which is affected.
A larger proportion of employers face skills gaps in Scotland (19 per cent) than elsewhere
in the UK, although this figure has fallen since 2011 when it stood at 21 per cent.
Proficiency problems affect a slightly larger proportion of employees in Northern Ireland,
Scotland and Wales than in 2011; in England a smaller proportion of the workforce has
skills gaps than was the case in 2011, and skills gaps are now at their lowest level in a
decade.

11
In most cases (three-quarters of all skills gaps), proficiency problems are due at
least in part to employees being new in their roles and/or still in training for their
roles. These factors are both (predominantly) transient: that is to say one would expect
skills gaps resulting from these causes to be eliminated once staff have settled into their
new roles and/or existing training has been completed.
Job roles where (internal) skills gaps are most prominent tend to be ones in which there
are relatively few (external) skill shortages. The occupations where skills gaps are most
acute are Sales and Customer Services staff and Elementary staff, which are two of the
occupations with the lowest density of skill shortages (alongside Administration roles).
Conversely, the occupations in which skill shortages were the most acute, Associate
Professionals and Machine Operatives, present average levels of skills gaps, while skills
gaps are relatively uncommon among Professional and Caring, Leisure and Other
Services staff. In the eyes of employers, skills gaps affect Managers less than other
occupations.
Employers tend to be challenged either in terms of having inadequate skills among some
of their existing workforce or struggling to find new recruits with the skills that the vacant
positions require. It is very rare for employers to be challenged from both directions; just
one per cent of all employers experienced both skill-shortage vacancies and skills
gaps. It is more commonly the case that employers are not fully utilising their
workforces’ skills.
Half of UK employers (48 per cent) report skills under-use, and 4.3 million workers
(16 per cent of the total UK workforce) are reported as being over-skilled and over-
qualified for the jobs that they are currently doing. Employers in the devolved
administrations were more likely than those in England to report that any of their staff
were over-skilled and over-qualified. Employers in the Hotels and Restaurants sector
were particularly likely to report this to be the case, and those in the Public Administration
and Manufacturing sectors are least likely.
An even greater proportion of employers (71 per cent) predict that their skills
requirements will change over the next 12 months. The occupational groups most likely to
be affected are Professional occupations and Caring, Leisure and Other occupations; the
skills of staff currently employed in these roles tend to stand up quite well against
employer need (low density of skills gaps), but they are both occupations in which it is
relatively more difficult to find suitably skilled candidates for new positions (high density of
skill-shortage vacancies).

12
Training and Workforce Development
Most employers fund or arrange training for their staff: two-thirds had done so over
the previous 12 months (66 per cent), a figure in line with 2011 (65 per cent). While most
employers could be described as being in ‘training equilibrium’ having been able to
provide all the training that they wanted over the previous 12 months, over two-fifths of all
employers (42 per cent, including non-trainers that had not delivered any) wanted to
provide more training than they had been able to do. By far the most common reason that
employers do not provide training is that they believe all their staff to be fully proficient in
their roles.
There have been some notable changes since 2011 in the nature of training activity
conducted. There is evidence of more employers providing off-the-job training, and
training being more widely offered across the workforce. More employers have
arranged any off-the-job training (49 per cent compared to 47 per cent in 2011) and fewer
have only offered on-job training (17 per cent compared to 19 per cent in 2011); and the
proportion of staff trained over the previous 12 months has risen substantially from 55 per
cent to 62 per cent.
On the other hand, there is evidence of less training being provided on an
individual basis. Each person trained received fewer days training over the last 12
months in 2013 than in 2011 (an average of 6.7 days compared with 7.8 days in 2011)
meaning that the total number of training days employers had provided over the previous
12 months has decreased slightly since 2011 (from 115 million to 113 million days).
Moreover, total employer investment in training decreased by five per cent in the
period 2011 to 2013 (from £45.3bn to £42.9bn). Training investment per person trained
fell by 17 per cent, from around £3,075 in 2011 to £2,550 in 2013 although this was in the
context of a large increase in the number of staff being trained.
In the context of tightened economic circumstances, it is not unreasonable for employers
to seek to invest more widely in training. Although training spend and the numbers of
days spent training are slightly down across the UK as a whole, this has been achieved in
combination with an increase in the number of staff trained, an increase in the ratio of off-
the-job to on-the-job training (a crude measure of the quality of training) and an increase
in the proportion of training that leads to a recognised qualification. This could suggest a
more efficient allocation of resource to partially offset a relatively modest cut in the level
of overall spend.

13
There is some variation in training activity by country: Employers in Scotland were the
most likely to have funded or arranged any training in the previous 12 months (70 per
cent) and those in Wales the least likely (62 per cent). Employers in Scotland also trained
a greater proportion of their workforce (65 per cent) than employers elsewhere in the UK
(as was the case in 2011 also); employers in Northern Ireland trained the lowest
proportion of their workforce (59 per cent).
Recruitment of Young People
Most “recruiting employers” (by which we mean employers who recruited anyone over
the previous two to three years) recruited at least one young person: overall 44 per
cent of all employers recruited a young person in the two to three years preceding the
survey.
Around a quarter of employers recruited at least one education leaver in that period.
Around one in five employers only recruited young people not entering their first job out of
education, and did not recruit any education leavers.
The main obstacle to (more) young people getting new jobs is competition in the
market place. Half of recruiting employers who had not recruited young job applicants
had opted instead for older candidates who were better placed; in this instance young
people who applied for these jobs may have been suitable, but the recruiters opted for a
candidate over the age of 25 to fill the role. Where young applicants were not considered
to meet the requirements of the role, the main reasons cited were lack of skills and
experience, and sometimes both. Three in five recruiting employers (61 per cent) who
had not recruited a young person said they had had no applications from young people.
The reasons why some young people were not successful in their job applications
mirrored the reasons why some employers were disappointed with the preparedness of
recruits entering the job market in their first roles since leaving education. Most
employers find the education leavers they take on to be well or very well prepared for
work, although as many as four in ten employers taking on school leavers at 16 from
schools in England, Northern Ireland or Wales described the recruits as poorly prepared
(as do three in ten employers in Scotland taking new recruits from Scottish schools
between the ages of 16 and 18).
High Performance Working practices and Product Market Strategies
High Performance Working (HPW) is defined by the UK Commission as ‘a general
approach to managing organisations that aims to stimulate more effective employee
involvement and commitment in order to achieve high levels of performance’ (UKCES
2009).

14
The survey identifies a minority of employers – 12 per cent – who are “HPW employers”
in the sense that they adopt a number of HPW practices.
Such employers are considerably more active in the recruitment market than
average: twice as many have a vacancy as non-HPW employers (29 per cent compared
to 13 per cent). The evidence suggests that they find it easier to fill the vacancies they
have than non-HPW employers: under a quarter of HPW employers’ vacancies were
proving hard-to-fill (22 per cent) compared to a third among non-HPW employers.
Similarly a smaller proportion of HPW employers’ vacancies are skill-shortage vacancies
(19 per cent, compared to 25 per cent among non-HPW employers).
HPW employers are also considerably more likely to experience skill gaps than non-HPW
employers (23 per cent compared to 14 per cent), although the proportion of their
workforce that lacks proficiency is in line with the national average (five per cent).
HPW employers are more likely to train and train a higher proportion of their workforce.
Product Market Strategies (PMS) are defined within the survey by aggregating responses
to a series of questions exploring pricing strategies, approaches to innovation and the
nature of the product market (the extent to which the market attracts a “premium” and the
extent of customisation of products and services in the market).
Aggregating these responses classifies two in five private sector employers in the UK as
having a high or very high product market strategy indicating that their competitive
success is not dependent on price, they pursue innovation, they compete on quality
and/or that they offer customised goods or services.
Employers with a higher composite PMS score are more likely to have a vacancy, hard-
to-fill vacancy or skill-shortage vacancy than employers with a lower score. However, the
evidence suggests that the recruitment challenge is greater for employers with a low
composite PMS score in the sense that a greater proportion of their vacancies are
reported to be hard-to-fill than is the case among employers with a high composite PMS.
Similarly, employers with a high composite PMS score are more likely to identify skill
gaps than employers with a low score, but the proportion of their workforce that lacks
proficiency is no higher.
In a similar vein, employers with a higher composite PMS score are more likely to fund or
arrange training for their staff.
15
1 Introduction
1.1 The UK-wide employer skills survey
This report presents the headline findings from the UK Commission’s Employer Skills
Survey 2013 (UKCESS 2013), the latest in a series of research studies designed by the
UK Commission to provide a definitive picture of the skills challenges faced by employers
across the UK.
The 2013 survey represents the second in the UKCESS series, with 2011 the first year
the UK-wide survey was run. Previously each nation of the UK conducted its own survey.
These were similar in style but varied in the employer population they covered and the
timescales in which they were conducted, meaning it was not possible to fully compare
results across nations. The 2011 survey brought these separate entities together into one
survey, which means that whilst time series data on the skills measures does not now go
back further than 20111, we are able to look at the picture across the UK as a whole and
have scope to compare between the constituent nations.
The Employer Skills Survey is designed to complement and supplement the UK
Commission’s Employer Perspectives Survey series (UKCEPS) which explores how
employers go about meeting their skills needs, particularly looking at their recruitment
processes, their use of external skills services, and their engagement with vocational
qualifications. The latest edition of UKCEPS (UKCEPS 2012) presented evidence that
showed that employers are more likely to use private sector training firms than public
providers in further and higher education to deliver external training, raising questions
about the availability / suitability of public training provision; UKCESS 2013 explores
employers’ training spend in these public sector markets to continue this line of
investigation.
Based on over 91,000 interviews with employers in every sector, the UKCESS 2013
provides an opportunity to assess how skills deficiencies might be impacting on business
performance. It measures the prevalence, nature and impact of skills challenges, and
details the nature and extent of employer investment in skills.
This evidence report represents an initial overview of the survey’s findings, in which we:
Present findings across the UK, including time series analysis comparing 2013
results with 20112;
1 The lack of a longer time series relates to the UK as a whole: it is possible to trace valid time series data for employers in
England going back to 1999. 2 The population of employers in scope for the 2013 survey differed from the population included in 2011; as a result the
figures quoted in this report as 2011 figures often differ from figures published at the time. Full details can be found in Annex J and the technical report that accompanies this volume [www.ukces.org.uk/ourwork/employer-skills-survey ].

16
Compare experiences and behaviours between employers across the countries of
the UK both in 2013 and in terms of trends over time;
Examine the interrelationship between the key UKCESS measures - skills gaps,
skills shortages and workforce development activity.
As well as written commentary, the appendices to this report include abridged data
tabulations detailing key survey measures.
Full UK data tabulations have also been published alongside this report and are available
here: www.ukces.org.uk/ourwork/employer-skills-survey
1.2 Methodological overview
Like its predecessors, UKCESS 2013 was carried out in two parts: a core survey of UK
employers, and a follow-up survey of workplaces which had funded or arranged training
for employees in the 12 months preceding the survey, to look at the investment they had
made in this training (the “Investment in Training Survey”); both surveys were conducted
by telephone.
This section briefly summarises the key features of the methodology adopted across both
surveys. Further detail can be found in the separate technical report which accompanies
this report (www.ukces.org.uk/ourwork/employer-skills-survey).
1.2.1 Survey sampling
Sampling for the survey covered establishments (as opposed to enterprises) in the UK
with at least two staff (including both employees and working proprietors). Sole traders
and establishments with just one employee and no working proprietors were excluded
from the survey population.
The survey encompasses establishments across the full geographical spread of the UK,
in all sectors of the economy (across the commercial, public and charitable spheres). The
profile of this population was established through the Office for National Statistics (ONS)
based on data from the Inter-Departmental Business Register (IDBR) March 2012
statistics.
Contact details for employers were sourced from Experian’s commercial database of
establishments, supplemented by some records supplied directly through the IDBR (in
order to ensure full representation of establishments in certain non-commercial sectors in
particular).
17
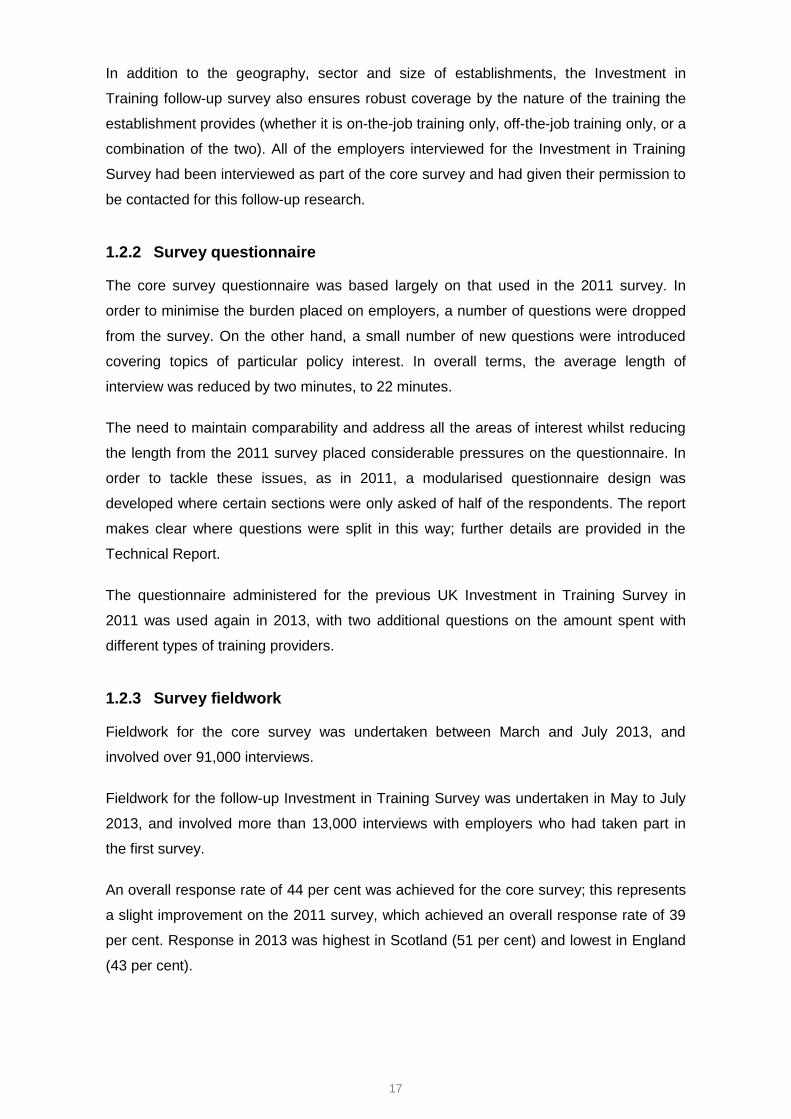
In addition to the geography, sector and size of establishments, the Investment in
Training follow-up survey also ensures robust coverage by the nature of the training the
establishment provides (whether it is on-the-job training only, off-the-job training only, or a
combination of the two). All of the employers interviewed for the Investment in Training
Survey had been interviewed as part of the core survey and had given their permission to
be contacted for this follow-up research.
1.2.2 Survey questionnaire
The core survey questionnaire was based largely on that used in the 2011 survey. In
order to minimise the burden placed on employers, a number of questions were dropped
from the survey. On the other hand, a small number of new questions were introduced
covering topics of particular policy interest. In overall terms, the average length of
interview was reduced by two minutes, to 22 minutes.
The need to maintain comparability and address all the areas of interest whilst reducing
the length from the 2011 survey placed considerable pressures on the questionnaire. In
order to tackle these issues, as in 2011, a modularised questionnaire design was
developed where certain sections were only asked of half of the respondents. The report
makes clear where questions were split in this way; further details are provided in the
Technical Report.
The questionnaire administered for the previous UK Investment in Training Survey in
2011 was used again in 2013, with two additional questions on the amount spent with
different types of training providers.
1.2.3 Survey fieldwork
Fieldwork for the core survey was undertaken between March and July 2013, and
involved over 91,000 interviews.
Fieldwork for the follow-up Investment in Training Survey was undertaken in May to July
2013, and involved more than 13,000 interviews with employers who had taken part in
the first survey.
An overall response rate of 44 per cent was achieved for the core survey; this represents
a slight improvement on the 2011 survey, which achieved an overall response rate of 39
per cent. Response in 2013 was highest in Scotland (51 per cent) and lowest in England
(43 per cent).

18
For the Investment in Training follow-up, respondents were already engaged with the
survey so a much higher response rate of 71 per cent was achieved; this ranged from 76
per cent in Northern Ireland to 65 per cent in Wales.
Table 1.1 Survey response rates
UK England
Northern
Ireland Scotland Wales
Core survey
Interviews 91,279 75,255 4,014 6,014 5,996
Response rate 44% 43% 47% 51% 45%
Investment in Training follow up
Interviews 13,138 9,140 1,070 1,496 1,432
Response rate 71% 70% 76% 75% 65%
1.2.4 Data weighting
Findings from the core survey have been weighted and grossed up to accurately
represent the total population of UK establishments in which at least two people work.
This has been done on a size, sector and regional basis. Separate weights have been
generated which allow findings to be presented (a) based on the number of workplaces
reporting a particular experience, and (b) based on the number of employees and/or job
roles affected by different challenges.
Findings from the Investment in Training survey have been weighted and grossed up to
reflect the population of training employers as generated by the weighted Wave 1
findings.
1.3 The nature of UK establishments: describing the survey population
In order to give some context to the findings that are presented throughout this report,
and to facilitate understanding of the differences in employers’ experiences and practices,
this section describes some of the key characteristics of the UK employer population.
It is important to note that the statistics presented in this section of the report are
variously based on official counts of establishments provided by the Office of National
Statistics (ONS) and on weighted survey findings; the footnotes on each table or chart
detail the source.

19
ONS figures show there were around 1.7 million “in-scope” establishments in the UK in
March 2012, with around 27 million people were working in them3 (see Table A.1.1 in
Annex A).
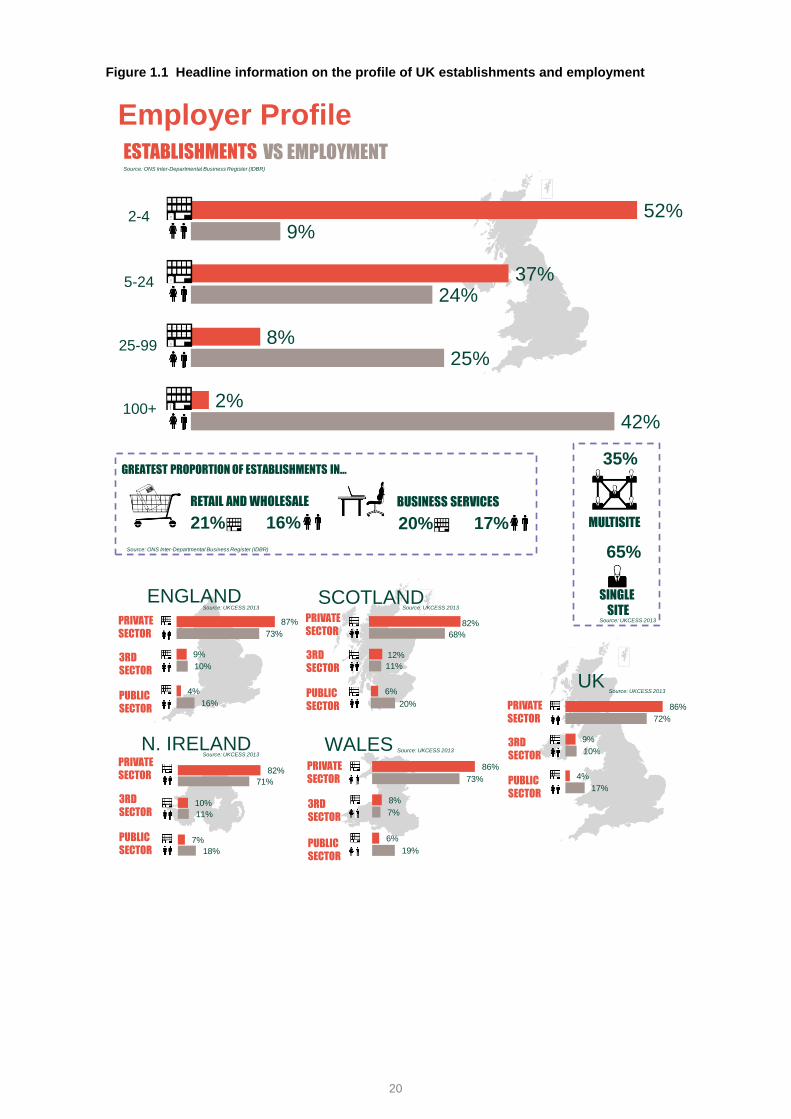
Figure 1.1 summarises key information on the profile of establishments and employment
across the UK, based on ONS data. This reveals that while most establishments (52 per
cent) are small and employ fewer than five staff, these very small employers account for
just nine per cent of all employment. In contrast, sites with 100 or more staff make up just
two per cent of the employer population, but account for two-fifths (42 per cent) of total
employment. Public sector employers are much larger than average: they account for
four per cent of all establishments but 17 per cent of all employment (see Table A.1.2 in
Annex A).
3 All establishments with two or more people working at them were in-scope for the survey. See Annex I for further details.
20
Figure 1.1 Headline information on the profile of UK establishments and employment
42%
25%
24%
9%
2%
8%
37%
52%2-4
5-24
25-99
100+
ESTABLISHMENTS VS EMPLOYMENT
Employer Profile
MULTISITE
SINGLE
SITE
35%
65%
RETAIL AND WHOLESALE BUSINESS SERVICES
21% 16% 20% 17%
GREATEST PROPORTION OF ESTABLISHMENTS IN…
PRIVATE
SECTOR
3RD
SECTOR
PUBLIC
SECTOR
ENGLAND
73%
87%
10%
9%
16%
4%
SCOTLANDPRIVATE
SECTOR
3RD
SECTOR
PUBLIC
SECTOR
68%
82%
12%
11%
6%
20%
N. IRELANDPRIVATE
SECTOR
3RD
SECTOR
PUBLIC
SECTOR
71%
82%
11%
10%
18%
7%
WALESPRIVATE
SECTOR
3RD
SECTOR
PUBLIC
SECTOR
73%
86%
7%
8%
19%
6%
PRIVATE
SECTOR
3RD
SECTOR
PUBLIC
SECTOR
UK
72%
86%
10%
9%
17%
4%
Source: ONS Inter-Departmental Business Register (IDBR)
Source: UKCESS 2013
Source: UKCESS 2013
Source: UKCESS 2013
Source: UKCESS 2013
Source: UKCESS 2013
Source: UKCESS 2013
Source: ONS Inter-Departmental Business Register (IDBR)

21
1.4 Structure of this report
This report has been structured into five key sections followed by a chapter drawing out
conclusions.
Chapter 2: Employers’ experience of skill shortages
This chapter looks at employer recruitment activity, measuring the extent, causes
and impacts of recruitment difficulties, with a particular focus on skill shortages
within the labour market and the impact such labour market failure has on
establishments.
Chapter 3: The internal skills challenge
This chapter explores the proficiency of establishments’ existing workforces, and
describes these skills gaps in detail, for example examining the skills lacking by
occupation. It covers employers’ predictions of the need for new skills among their
staff (“upskilling”) and also looks at the under-utilisation of skills where
establishments report that employees have more skills and qualifications than
required for their current job role.
Chapter 4: Employer investment in training and skills
The fourth chapter explores in detail the extent and nature of employer training
and workforce development, including the investment made in training. It
examines the number of staff provided with training over the previous 12 months,
the type and duration of this training, the extent to which employers would have
liked to provide more training and development than they did, and the barriers that
prevented increased training activity.
Chapter 5: Recruitment of young people
This chapter looks at the recruitment of young people, including those recruited
directly from education, and examines employer perceptions of how well prepared
they are for work.
Chapter 6: Working practices and product market strategies
Chapter six explores the working practices being adopted by employers in regard
to how they manage, develop, engage with and incentivise their staff, and seeks
to assess the prevalence of High Performance Working (HPW) practices.
It also explores the Product Market Strategies (PMS) of employers, and whether
this impacts on their skill needs and training practices.
Chapter 7: Conclusions
The final chapter revisits the key stories emerging from the different strands of the
survey, bringing them together and considering their implications.

22
1.5 Reporting conventions
The survey was carried out at an establishment level. The terms “establishment”,
“employer”, “workplace” and “business unit” are used for this interchangeably throughout
this report to avoid excessive repetition and to aid reading.
Throughout the report unweighted base figures are shown on tables and charts to give an
indication of the statistical reliability of the figures. These figures are always based on the
number of establishments answering a question, as this is the information required to
determine statistical reliability. This means, for example, that where percentages are
based on “all vacancies” (such as the percentage of all vacancies which are hard-to-fill
because of a lack of the required skills among applicants) the base figure quoted is the
unweighted number of establishments with vacancies.
In tables, “zero” is denoted as a dash (“-“); and an asterisk is used (“*”) if the figure is
larger than zero but smaller than 0.5 per cent.
Throughout the report, figures with a base size of fewer than 25 establishments are not
reported (a double asterisk, “**”, is displayed instead), and figures with a base size of 25
to 49 are italicised and should be treated with caution.
The scale and scope of data collected by the UK Commission’s Employer Skills Survey
2013 means that it is a valuable research resource supporting detailed and complex
statistical analysis of the inter-relationships between employer characteristics, and their
practices and experiences. The findings presented in this report reflect a descriptive
exploration of the data; however, it should be noted that in all cases where differences by
nation are commented on they are statistically significant at the 95 per cent level. Further
statistical information can be found in Annex E.

23
2 Employers’ Experience of Skill Shortages
2.1 Chapter Summary
The survey supports a picture of a UK economy which is moving towards recovery.
The number of employers reporting vacancies at the time of the survey (March to July
2013) was higher than at the equivalent time in 2011 (up from 14 per cent to 15 per cent),
as was the number of vacancies that they reported (655,000 in 2013, a rise of 12% from
2011).
Within England vacancies are back to pre-recession levels, employers reported a total of
559,600 job vacancies, a rise of 45% per cent from 2009. Signs of recovery were less
clear in Northern Ireland, where the proportion of employers reporting vacancies has
remained consistently behind the UK average (and unchanged at ten per cent of
employers in both 2011 and 2013).
Economic growth and recovery may be constrained by skill shortages as the
labour market responds to employer requirements. While in most cases demand for
skills is met through successful recruitment, almost three in ten vacancies are reported to
be hard-to-fill, and shortages in suitably skilled, qualified and/or experienced workers are
the main reason for this. Overall, such skill-shortage vacancies represent more than one
in five of all vacancies (22 per cent), up from one in six in 2011 (16 per cent).
The picture of skill shortages across the UK varies by country as does the change
in available skills since 2011. The largest shortfall is reported in Scotland where a
quarter of all vacancies are hard-to-fill because of a shortage in available skills, up from
15 per cent in 2011. Within England, the longer time series available shows the number
of skill-shortages has nearly doubled since 2009, increasing from 63,100 to 124,800.
Skill shortages differ by occupation and pockets of shortages remain largely
unchanged since 2011. Skilled Trades roles remain the most common occupation
where skill shortages are likely to be encountered when employers recruit for these roles.
In 2011, managerial roles were the next most challenged by shortages in available skills;
since then, the challenge has shifted towards Professionals, Associate Professionals,
Caring, Leisure and Other services staff and Machine Operatives.
There appears to have been an increased difficulty finding appropriate oral and written
communication, literacy and numeracy skills. These core generic skills were all cited as
lacking by greater proportions of employers reporting skill-shortage vacancies than in
2011.

24
2.2 Introduction
At a macro level recruitment tends to signify a healthy labour market and is an indicator of
growth and a burgeoning economy. Indeed, in recent years, against a backdrop of
economic uncertainty and difficulty, employer skills surveys have generally reported
depressed levels of recruitment activity.
At an individual employer level there can be various reasons for having vacancies.
Depending on the context, they can be a positive indicator of growth or more negative if
they signify a loss of key personnel or high staff turnover levels.
The outcomes of having vacancies are less ambiguous. Either the labour market is able
to meet employer requirements (the most common scenario) or it isn’t. Typically where
employers do struggle to fill their vacancies this is due to a lack of skills, qualifications or
experience amongst applicants. Collectively these are known as “skill-shortage
vacancies”. Vacancies can also prove ‘hard-to-fill’ for other, non skills-related reasons,
principally a lack of applicants to the role, issues with applicants’ attitude, personality or
motivation, or specific issues related to the job role (e.g. poor terms and conditions or
unsociable hours) or the organisation recruiting (e.g. remote location or poor transport
links).
The UK Commission’s Employer Skills Survey 2013 provides us with a detailed
understanding of the level and nature of employer demand for new staff and the ability of
the market to meet such demand. This sets the context for then exploring imbalances and
mismatches in the labour market that result from a lack of skills.
The key measures used in this chapter are as follows:
Vacancies Hard-to-fill
vacancies
Incidence
Density
Skill-shortage
vacancies
The proportion of establishments
reporting at least one vacancy
The number of vacancies per
100 employees
The proportion of establishments
reporting at least one hard-to-fill
vacancy
Hard-to-fill vacancies as a proportion of all
vacancies
The proportion of establishments
reporting at least one skill-shortage
vacancy
Skill-shortage vacancies as a proportion of all
vacancies

25
Following a brief analysis of vacancies, this chapter focuses specifically on skill-shortage
vacancies (those vacancies that employers find difficult to fill specifically as a result of a
lack of applicants in the labour market with the required skills, qualifications and/or
experience). The chapter examines their incidence, volume and profile, before exploring
the specific skills that employers find lacking and the impact that this has. It closes with a
brief discussion of the extent of wider recruitment challenges that employers face beyond
skills deficiencies. Time series for the headline measures by country can be found in
Annex B.
2.3 Vacancies
Most employers have recent experience of recruitment. The latest version of the UK
Commission’s Employer Perspectives Survey (UKCES, 2012b) reported that around half
of employers had at least one vacancy over the 12 months prior to the survey, while
almost two-thirds reported recruiting in the previous two to three years. However, at any
one point in time, the majority of establishments are not looking to recruit new staff; 15
per cent had a current vacancy at the time of UKCESS 2013 fieldwork.
Although most employers reported having no current vacancies, there has been an
increase in recruitment activity since the 2011 survey when 14 per cent of establishments
reported having a vacancy. This is also an increase from when the previous skills surveys
were conducted in the individual countries of the UK4.
In total, there were around 655,000 vacancies across the UK at the time of the survey
(equivalent to 2.4 per cent of total employment). This is an increase of 12 per cent
compared to 2011 when there were around 587,000 vacancies (equivalent of 2.2 per cent
of total employment).
As shown in Table 2.1, evidence of a recovery in the labour market can be seen across
England, Scotland and Wales, though not in Northern Ireland (although more recent
macroeconomic data are suggesting that the recovery is taking root there too).
4 With the exception of Wales, although this was conducted much earlier in 2005 .

26
Table 2.1 Incidence and density of vacancies by country
% of establishments
with a vacancy (incidence)
Vacancies as a % of employment
(density)
Unweighted base 2011 2013 2011 2013
2011 2013 % % % %
UK 86,522 91,279 14 15 2.2 2.4
Country
England 74,156 75,255 14 15 2.2 2.5
Northern Ireland 3,921 4,014 10 10 2.4 2.1
Scotland 2,487 6,014 14 15 1.9 2.4
Wales 5,958 5,996 12 14 1.9 2.2
Base: All establishments
Percentages in the final two columns are shown as a proportion of all employment.
There is substantial variation in the extent and pattern of recruitment activity by size of
establishment and by sector. Whilst the proportion of establishments reporting vacancies
increases with the size of establishment, the density of vacancies is larger among the
smaller establishments. By sector, the proportion of establishments reporting vacancies
ranges from five per cent in Agriculture to 29 per cent in Education while density of
vacancies ranges from 1.4 per cent of total employment in Agriculture to 3.7 per cent in
Hotels and Restaurants and Community, Social & Personal Service Activities.
The survey also identifies the occupational groups and jobs where vacancies exist5. As in
2011, there is a particularly high level of demand for Associate Professional roles, with six
vacancies for every 100 people working in these roles; this is also the occupation for
which employers were most likely to report vacancies (19 per cent of employers with
vacancies do so).
Tables A.2.1 and A.2.2 in Annex A provide a detailed breakdown of recruitment activity
by country, size of establishment, sector and occupation.
5 For a definition of occupational groups, see Annex D

27
2.4 Skill-shortage vacancies
While recruitment activity has increased, the labour market typically appears able to meet
employer requirements with approaching three-quarters of vacancies across the UK (71
per cent) reported as not difficult to fill6. However, the majority of vacancies that are
difficult for employers to fill are, at least in part, a result of a lack of skills, qualifications or
experience amongst applicants (77 per cent of all vacancies that are hard-to-fill)7. The
rest of this section explores these skill-shortage vacancies in more detail.
2.4.1 The incidence, volume and density of skill-shortage vacancies
For the vast majority of establishments, demand for skills is met through successful
recruitment (or through their current workforce, as will be explored in the next chapter).
Only four per cent of establishments reported having vacancies at the time of the survey
that they were having difficulties filling due to a lack of skills, qualifications or experience
in applicants for the role.
While it is relatively uncommon for employers to report such skills shortages, this
represents an increase from the three per cent reported in 2011, with employers across
all countries more likely to report skill-shortage vacancies. Moreover, the proportion of all
vacancies that employers found hard-to-fill at least in part due to a shortage of skills in
the labour market (often referred to as skill-shortage vacancy density) has increased from
16 per cent to 22 per cent.
Table 2.2 Incidence and density of skill-shortage vacancies (SSVs) by country
% of establishments
with an SSV (incidence) % of vacancies which
are SSVs (density)
Unwtd base 2011 2013 2011 2013
2011 2013 % % % %
UK 86,522 91,279 3 4 16 22
Country
England 74,156 75,255 3 4 15 22
Northern Ireland 3,921 4,014 2 3 21 19
Scotland 2,487 6,014 3 4 15 25
Wales 5,958 5,996 3 4 18 20
Base: Columns 1 and 2 All establishments; Columns 3 and 4 All establishments with vacancies
Percentages in Columns 3 and 4 are shown as a proportion of all vacancies.
Note: the 2013 “% of vacancies which are SSVs” figure for Northern Ireland has been updated since this
report was first published (updated July 2014).
6 Of course very recent vacancies may not be described as hard-to-fill but may become so over time.
7 During the survey, employers were first asked to give their reasons for not being able to fill vacancies spontaneously (i.e.
without being presented with a list of possible reasons). Any employers not reporting skills-related issues were then prompted as to whether any of their hard-to-fill vacancies were proving hard-to-fill due to a lack of skills, experience or qualifications among applicants, and these responses combined to give an overall picture of the incidence and volume of skill-shortage vacancies in the market.

28
In volume terms there were around 146,000 skill-shortage vacancies reported in the UK
at the time of the survey. This is an increase of 60 per cent compared to 2011 when there
were just over 91,000; therefore growth in the number of skill-shortage vacancies has
outpaced the 12 per cent growth in the number of vacancies over the same period.
It is in Scotland and England where the greatest proportion of vacancies were hard-to-fill
due to lack of skills, qualifications or experience in applicants for the role. This reverses
the pattern seen in 2011 where the density of skill-shortage vacancies was highest in
Wales and Northern Ireland. Within England, the number of skill-shortage vacancies are
higher than pre-recession levels seen in 2009 (see Annex B).
As in 2011, vacancies in smaller establishments were more likely to be hard-to-fill due to
the difficulties in finding applicants with appropriate skills, qualifications or experience.
Approaching a third of all vacancies in establishments with fewer than five staff were
hard-to-fill as a result of a lack of skills, qualifications or experience compared to 15 per
cent in the largest establishments. There has been an increase in skill-shortage vacancy
density across all size bands since 2011.
By sector, the proportion of vacancies reported as hard-to-fill as a result of a lack of skills,
qualifications or experience ranges from 10 per cent in Financial Services to 30 per cent
in Manufacturing. In line with the increase seen in England and Scotland and across all
size bands, most sectors have experienced an increase in skill-shortage vacancy density
with Public Administration and Health and Social Work seeing their density more than
double. It is in the Manufacturing and Agriculture sectors where skills deficiencies when
recruiting are most concentrated and persistent - these sectors reported the highest skill-
shortage vacancy density in both 2011 and 2013. However, other sectors are closing the
gap and are now facing similar levels of skills deficiencies, in particular Business Services
and Transport and Communication.
The Financial Services sector bucks the general trend with a reduction in density from 17
per cent to 10 per cent.
Tables A.2.3 and A.2.4 in Annex A provide a detailed breakdown of skill-shortage
vacancies by country, size of establishment and sector.
As seen in 2011, as well as in all previous skills surveys conducted in the individual
countries of the UK, it is amongst Skilled Trades where the greatest proportion of
vacancies were hard-to-fill because of skills deficiencies in the available labour market
(39 per cent). This compares to an average of 22 per cent across all occupations.
29
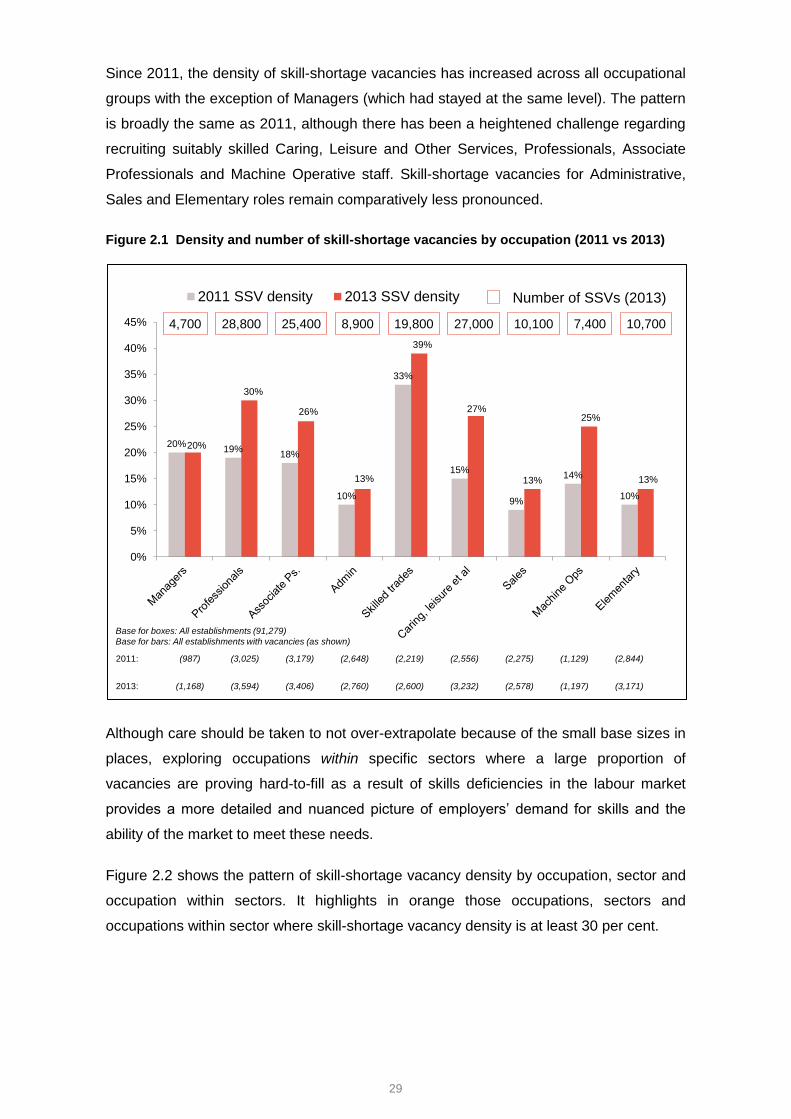
Since 2011, the density of skill-shortage vacancies has increased across all occupational
groups with the exception of Managers (which had stayed at the same level). The pattern
is broadly the same as 2011, although there has been a heightened challenge regarding
recruiting suitably skilled Caring, Leisure and Other Services, Professionals, Associate
Professionals and Machine Operative staff. Skill-shortage vacancies for Administrative,
Sales and Elementary roles remain comparatively less pronounced.
Figure 2.1 Density and number of skill-shortage vacancies by occupation (2011 vs 2013)
Although care should be taken to not over-extrapolate because of the small base sizes in
places, exploring occupations within specific sectors where a large proportion of
vacancies are proving hard-to-fill as a result of skills deficiencies in the labour market
provides a more detailed and nuanced picture of employers’ demand for skills and the
ability of the market to meet these needs.
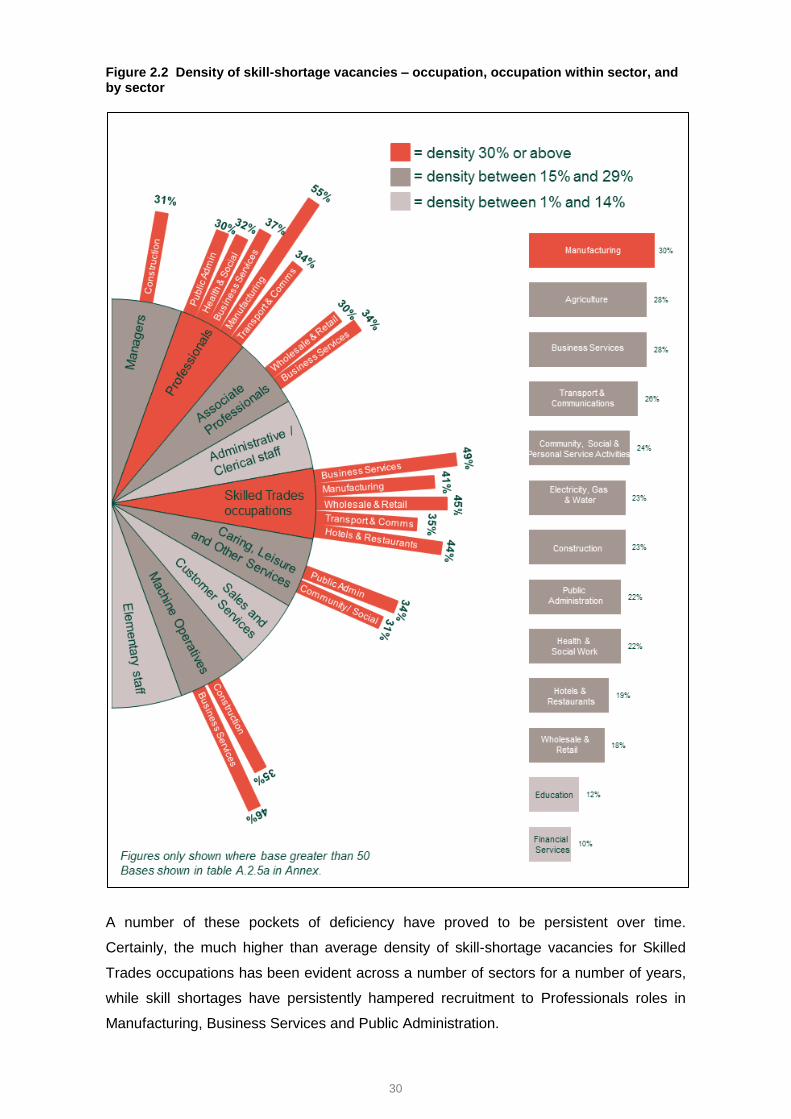
Figure 2.2 shows the pattern of skill-shortage vacancy density by occupation, sector and
occupation within sectors. It highlights in orange those occupations, sectors and
occupations within sector where skill-shortage vacancy density is at least 30 per cent.
Base for boxes: All establishments (91,279)
Base for bars: All establishments with vacancies (as shown)
2011: (987) (3,025) (3,179) (2,648) (2,219) (2,556) (2,275) (1,129) (2,844)
2013: (1,168) (3,594) (3,406) (2,760) (2,600) (3,232) (2,578) (1,197) (3,171)
20%19%
18%
10%
33%
15%
9%
14%
10%
20%
30%
26%
13%
39%
27%
13%
25%
13%
0%
5%
10%
15%
20%
25%
30%
35%
40%
45%
2011 SSV density 2013 SSV density
4,700 28,800 25,400 8,900 19,800 27,000 10,100 7,400 10,700
Number of SSVs (2013)
30
Figure 2.2 Density of skill-shortage vacancies – occupation, occupation within sector, and by sector
A number of these pockets of deficiency have proved to be persistent over time.
Certainly, the much higher than average density of skill-shortage vacancies for Skilled
Trades occupations has been evident across a number of sectors for a number of years,
while skill shortages have persistently hampered recruitment to Professionals roles in
Manufacturing, Business Services and Public Administration.

31
However, there are also a number of emerging pockets of skills deficiency. These include:
Professionals in Health and Social Work
Associate Professionals in Business Services
Machine Operatives in Business Services and Construction
Caring, Leisure and Other Services roles in Public Administration
Conversely, while skill-shortage vacancy density has increased across all occupations
(except Managers) and across most sectors, there are a handful of specific occupations
within sectors where skills-related recruitment difficulties have eased. This includes
Professionals in the Construction sector and Managers in the Health and Social Work
sector.
Tables A.2.5 and A.2.5a in Annex A provide a full and detailed breakdown of skill-
shortage vacancy density by occupation within sector.
2.4.2 Skills lacking in the available labour market
Employers who reported having vacancies that were difficult to fill because of skill
shortages were read a list of types of skills and asked, for each occupation in which they
reported skill-shortage vacancies, which skills were lacking. Figure 2.3 shows results
based on the total number of skill-shortage vacancies (as opposed to establishments with
skill-shortage vacancies).
Almost two-thirds of all skill-shortage vacancies were ascribed to a lack of technical,
practical or job-specific skills.
Generic or “softer” skills such as planning and organisation, customer handling, problem
solving and team working were each cited in connection with between one-third and two-
fifths of skill-shortage vacancies.
This is a broadly similar pattern to 2011 although there has been an increase in the
proportion of skill-shortage vacancies resulting from a lack of communication skills,
particularly oral communication (41 per cent, up from 37 per cent in 2011), as well as a
lack of literacy (34 per cent up from 28 per cent in 2011) and numeracy skills (26 per
cent, up from 24 per cent)8.
8 There has also been a marked decrease in the proportion of skill-shortage vacancies attributed to a lack of technical,
practical or job specific skills. However, it should be noted that in 2011 there were separate codes for “technical/practical skills” and “job-specific skills”. The extent to which the combining of these into one single “technical, practical or job specific skills” code has impacted on this decrease is difficult to tell.

32
Figure 2.3 Skills lacking among applicants (prompted)
Table A.2.6 in Annex A provides a picture of the skills lacking in the available labour
market in each of the countries. Although care should be taken when interpreting these
findings due to the relative low base sizes outside England, a number of the softer skills
(e.g. team working and problem solving) were reported as being particularly hard to find
in Northern Ireland.
Table A.2.7 in Annex A provides a breakdown of skills lacking by occupation. A lack of
technical, practical or job-specific skills was particularly likely to affect Skilled Trades,
Associate Professionals, Professionals and Process, Plant and Machine Operative
occupations. Softer skills were more frequently reported to be lacking among Sales and
Customer Service, Administrative / Clerical and Elementary applicants.
16%
17%
22%
26%
30%
33%
34%
37%
38%
40%
41%
41%
63%
Basic computer literacy / using IT
Foreign language skills
Advanced IT or software skills
Numeracy skills
Strategic Management skills
Team working skills
Literacy skills
Problem solving skills
Written communication skills
Customer handling skills
Oral communication skills
Planning and Organisation skills
Technical, practical or job specific skills
Base : All establishments with skills shortage vacancies - up to 6 occupations followed up (4,897)

33
2.4.3 The impact of skill-shortage vacancies on employers
Although skill-shortage vacancies are only reported by a small minority of employers (four
per cent), for those that have them the impact can be significant. In total, 95 per cent of
employers that had difficulty filling their vacancies solely as a result of skill shortages9
reported that these were having an impact on the establishment.
Most commonly the impact was felt on other staff with 84 per cent of these employers
reporting that they result in an increased workload for other staff.
Approaching half of employers that had difficulty filling their vacancies solely as a result of
skill shortages reported that they were having a more direct impact on the organisation in
terms of causing difficulties in meeting customer service objectives (49 per cent), delays
developing new products or services (44 per cent), a loss of business or orders to
competitors (42 per cent) or increased operating costs (42 per cent).
The landscape has changed very little since 2011 in terms of the impact of skill-shortage
vacancies and the relative prevalence of each of the impacts.
9 The survey does not measure the impact of skill-shortage vacancies on employers specifically (i.e. it does not ask
employers with skill-shortage vacancies what the impacts of these are on the establishment, only the impact of vacancies that are proving difficult to fill as a whole). However, we can isolate the effect of skill deficiencies by exploring the impact of hard-to-fill vacancies in establishments where all the hard-to-fill vacancies were caused by skills-related issues. Given the majority of establishments with hard-to-fill vacancies fall into this group (76 per cent) – in part reflecting that the majority have just a single vacancy that proved difficult to fill - this is a suitable sample from which we can gain a robust measurement.

34
Figure 2.4 Impact of skill-shortage vacancies (prompted)
2.5 Wider recruitment challenges and hard-to-fill vacancies
As discussed earlier, while recruitment difficulties are most commonly a result of skill
shortages in the available labour market, employers can face other recruitment
challenges and have difficulty filling their vacancies for non skills-related reasons. These
include a lack of applicants to the role, issues with the job role, terms, hours or location,
or issues with applicants’ attitude, personality or motivation. Often there can be a number
of underlying factors and they can be inter-related (e.g. a lack of applicants as a result of
the poor pay on offer).
The proportion of all vacancies that employers found hard-to-fill at least in part due to a
shortage of skills in the labour market was 22 per cent, an increase from 16 per cent in
2011. A further seven per cent of vacancies have proved difficult to fill exclusively for
reasons not related to skills, similar to the proportion reported in 2011.
Table A.2.8 in the annex provides further detail by country, size of establishment, sector
and occupation on the ratio of skill-shortage vacancies compared to vacancies that
employers are having difficulty filling for entirely non-skills related reasons. The very
largest employers (those with 250 employees or more) and those in Manufacturing and
Business Services sectors stand out as those where recruitment challenges are
particularly centred on skills deficiencies.
5%
21%
24%
29%
35%
37%
42%
42%
44%
49%
84%
None
Difficulties introducing technological change
Withdraw from offering certain products / services
Outsource work
Have difficulties meeting quality standards
Have difficulties introducing new working practices
Experience increased operating costs
Lose business or orders to competitors
Delay developing new products or services
Difficulties meeting customer services objectives
Increased workload for other staff
Base: All establishments where all hard-to-fill vacancies caused by skills related issues (4,675)

35
2.6 Conclusions
Indicative of a move towards economic recovery, the survey findings reveal increased
employer recruitment activity in 2013 compared with 2011. More employers had
vacancies at the time of the interview, and the number of vacancies (as a proportion of
the workforce) had increased.
While few establishments (four per cent) reported having skills-related recruitment
difficulties at the time of the study, this is an increase compared with 2011. Moreover, the
proportion of vacancies in the UK that employers found hard-to-fill due to skill shortages
has increased markedly from 16 per cent in 2011 to 22 per cent in 2013; within England
this is the first rise seen since 2005. This suggests increased employer competition and
demand for skills, and highlights the potential for skill shortages in the labour market to
act as a brake on economic recovery.
Continuing longer term trends, skill shortages in the labour market are concentrated in
particular sectors and occupations, and are particularly likely to be found in
Manufacturing, and where employers are recruiting for Skilled Trades and Professional
roles. There have been noticeable increases in the difficulty recruiting suitably skilled
Caring, Leisure and Other Services, Professionals, Associate Professionals and Machine
Operative staff compared with 2011, suggesting these are areas where the labour market
is facing growing challenges in meeting employer demand.

36
3 The Internal Skills Challenge
3.1 Summary
Most employers say they have a proficient workforce with no skills gaps: 15 per cent
report that some of their staff are not fully proficient, and these skills gaps represent one
in 20 employees (five per cent). This represents a slight fall in the proportion of
workplaces with proficiency challenges since 2011 (when the figures stood at 17 per
cent), but a broadly consistent picture in terms of the proportion of the workforce which is
affected.
A larger proportion of employers face skills gaps in Scotland (19 per cent) than elsewhere
in the UK, although this figure has fallen 2011 (21 per cent). Proficiency problems affect a
slightly larger proportion of employees in Northern Ireland, Scotland and Wales than in
2011; in England a smaller proportion of the workforce has skills gaps than was the case
in 2011, taking skills gaps to their lowest level in a decade.
In most cases (three-quarters of all skills gaps), proficiency problems are due at least in
part to employees being new in their roles and/or still in training for their roles. These
factors are both (predominantly) transient: that is to say one would expect skills gaps
resulting from these causes to be eliminated once staff have settled into their new roles
and/or existing training has been completed.
Job roles where (internal) skills gaps are most prominent tend to be ones in which there
are relatively few (external) skill shortages. The occupations where skills gaps are most
acute are Sales and Customer Services staff and Elementary staff, which are two of the
occupations with the lowest density of skill shortages (alongside Administration roles).
Conversely, the occupations in which skill shortages were the most acute, Associate
Professionals and Machine Operatives, present average levels of skills gaps, while skills
gaps are relatively uncommon among Professional and Caring, Leisure and Other
Services staff. In the eyes of employers, skills gaps affect Managers less than other
occupations10.
10
This runs counter to the view expressed elsewhere that deficiencies in leadership skills are having a significantly detrimental effect on the UK economy (for example, Leadership and Management in the UK – the Key to Sustainable Growth, BIS 2012)

37
Employers tend to be challenged either in terms of having inadequate skills among some
of their existing workforce or struggling to find new recruits with the skills that the vacant
positions require. It is very rare for employers to be challenged from both directions; just
one per cent of all employers experienced both skill-shortage vacancies and skills gaps. It
is more commonly the case that employers are not fully utilising their workforces’ skills.
Half of UK employers (48 per cent) report that they have staff whose skills are not being
under used and who are over-qualified for their job role; some 4.3 million workers (16 per
cent of the total UK workforce) are reported as being over-skilled and having skills that
are under-used.
An even greater proportion of employers (71 per cent) predict that their skills
requirements will change over the next 12 months. The occupational groups most likely to
be affected are Professional occupations and Caring, Leisure and Other occupations; the
skills of staff currently employed in these roles tend to stand up quite well against
employer need, but they are both occupations in which it is relatively more difficult to find
suitably skilled candidates for new positions.
3.2 Introduction
In the previous chapter we looked at the extent to which employers are challenged in
sourcing the skilled labour that they require, and the impact that shortages in the
available labour market can have on delivery or profitability (either directly or through the
knock-on impact on the existing workforce). In this chapter we look at skills challenges
from an internal perspective, identifying and describing workplaces and job roles within
which there is a mismatch. A ‘skills mismatch’ can occur as a result of either under- or
over-skilling: some employees lack the skills required to be fully proficient in their job
roles (a “skills gap”), whereas others do not fully utilise their existing skill set. The former
may hinder establishments’ ability to function efficiently, which in turn may then impact
negatively on productivity; the latter suggests a ‘missed opportunity’ for the employer to
get the most out of their staff.
The chapter focuses predominantly on skills gaps, that is, where employees are regarded
as lacking the requisite skills for their current job roles. It explores the prevalence,
volume, profile and causes of such skills gaps, before considering the specific skills that
employers report as lacking, the impact of these skills deficiencies and the actions taken
in an attempt to overcome them.
The chapter then turns to the prevalence of skills under-use in the workplace.

38
Finally, the chapter explores the extent to which employers anticipate that staff will need
to acquire new skills, the reasons underlying these upskilling needs, and the occupations
where the need to upskill are likely to be most acutely felt.
The main measures used in this chapter are as follows:
Time series for skills gaps by country can be found in Annex B.
3.2.1 The prevalence of skills gaps
The vast majority of establishments (85 per cent) consider their entire workforce to be
fully proficient. The remaining 15 per cent of employers identify at least some skills gaps
amongst their employees: a total of 1.4 million employees are deemed not to be fully
proficient in their job roles, equating to 5.2 per cent of the total UK workforce.
Since 2011, there has been a small fall in the proportion of employers reporting skills
gaps across the UK (from 17 per cent to 15 per cent); the proportion of employees
identified as not being fully proficient has remained broadly consistent, however in 2011,
5.5 per cent of the total UK workforce was identified as having skills gaps compared to
5.2 per cent in 2013.
This consistency across the UK masks considerable variation across the countries.
Employers in England buck the UK trend in that they report a lower skill gap density than
in 2011, and density is now at its lowest since 2003; employers in all the other nations of
the UK report a considerably higher density of skill gaps than in 2011.
Skills gaps Under-use of skills
Incidence
Density
Upskilling
The proportion of establishments reporting
employees not being fully proficient
Skills gaps as a proportion of employment
The proportion of establishments reporting
over-qualified and over-skilled staff
Proportion of staff reported as being over-
qualified and over-skilled
The proportion of establishments
anticipating staff needing to acquire new skills / knowledge over
coming year
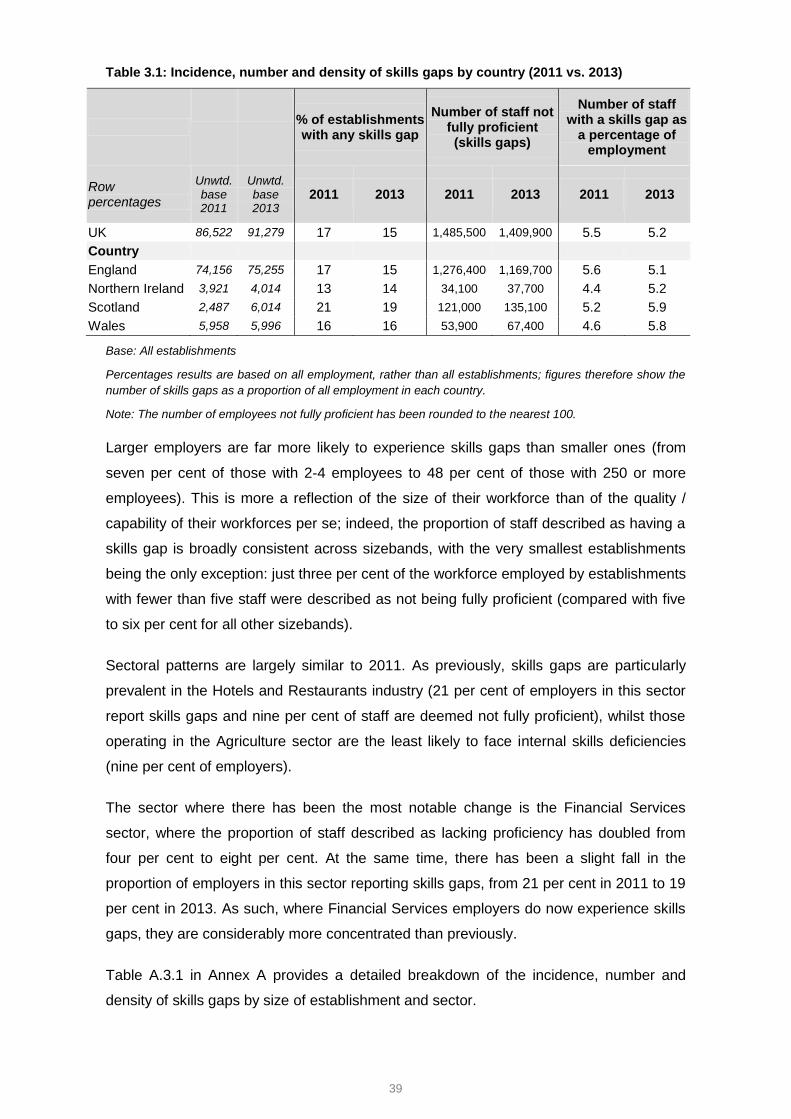
39
Table 3.1: Incidence, number and density of skills gaps by country (2011 vs. 2013)
% of establishments with any skills gap
Number of staff not fully proficient (skills gaps)
Number of staff with a skills gap as
a percentage of employment
Row percentages
Unwtd. base 2011
Unwtd. base 2013
2011 2013 2011 2013 2011 2013
UK 86,522 91,279 17 15 1,485,500 1,409,900 5.5 5.2
Country
England 74,156 75,255 17 15 1,276,400 1,169,700 5.6 5.1
Northern Ireland 3,921 4,014 13 14 34,100 37,700 4.4 5.2
Scotland 2,487 6,014 21 19 121,000 135,100 5.2 5.9
Wales 5,958 5,996 16 16 53,900 67,400 4.6 5.8
Base: All establishments
Percentages results are based on all employment, rather than all establishments; figures therefore show the
number of skills gaps as a proportion of all employment in each country.
Note: The number of employees not fully proficient has been rounded to the nearest 100.
Larger employers are far more likely to experience skills gaps than smaller ones (from
seven per cent of those with 2-4 employees to 48 per cent of those with 250 or more
employees). This is more a reflection of the size of their workforce than of the quality /
capability of their workforces per se; indeed, the proportion of staff described as having a
skills gap is broadly consistent across sizebands, with the very smallest establishments
being the only exception: just three per cent of the workforce employed by establishments
with fewer than five staff were described as not being fully proficient (compared with five
to six per cent for all other sizebands).
Sectoral patterns are largely similar to 2011. As previously, skills gaps are particularly
prevalent in the Hotels and Restaurants industry (21 per cent of employers in this sector
report skills gaps and nine per cent of staff are deemed not fully proficient), whilst those
operating in the Agriculture sector are the least likely to face internal skills deficiencies
(nine per cent of employers).
The sector where there has been the most notable change is the Financial Services
sector, where the proportion of staff described as lacking proficiency has doubled from
four per cent to eight per cent. At the same time, there has been a slight fall in the
proportion of employers in this sector reporting skills gaps, from 21 per cent in 2011 to 19
per cent in 2013. As such, where Financial Services employers do now experience skills
gaps, they are considerably more concentrated than previously.
Table A.3.1 in Annex A provides a detailed breakdown of the incidence, number and
density of skills gaps by size of establishment and sector.

40
3.2.2 The occupational distribution of skills gaps
At an overall level, trends by occupation are very similar to in 2011, with skills gaps
continuing to be concentrated in specific pockets. People employed in what are
traditionally described as unskilled or semi-skilled occupations, namely those in
Elementary and Sales and Customer Service positions, remain the most likely to have
skills gaps. As shown in Table 3.2, eight per cent of staff in Sales and Customer Services
occupations and seven per cent of those in Elementary positions are reported as lacking
full proficiency (these patterns are in line with the findings in 2011)
Conversely, those in the most highly skilled occupations, namely Managers and
Professionals, are the least likely to be described as having skills gaps (three per cent
and almost four per cent respectively), again closely mirroring the occupational picture in
2011.
Table 3.2: Number and density of skills gaps by occupation (2011 vs. 2013)
Number of staff not fully proficient (skills gaps)
% of staff reported as having skills
gaps
2011 2013 2011 2013
Row percentages Unwtd base 2011
Unwtd base 2013
% %
UK 86,522 91,279 1,485,500 1,409,900 5.5 5.2
Occupation
Managers 82,426 87,946 161,300 146,200 3.2 3.0
Professionals 16,337 17,407 129,800 120,700 4.2 3.8
Associate Professionals 13,731 12,577 89,900 83,400 4.9 5.3
Administrative and Clerical
50,656 53,759 169,100 165,500 4.9 4.9
Skilled Trades 20,507 23,644 101,300 105,600 5.4 5.5
Caring, Leisure and Other services
12,712 14,017 124,500 133,300 5.4 4.8
Sales and Customer Service
26,739 27,417 289,500 283,000 8.3 7.8
Machine Operatives 13,369 14,059 115,500 99,600 6.0 5.4
Elementary occupations 30,609 32,192 304,500 272,600 7.6 7.3
Base: All establishments with staff in each occupation.
Percentages are based on all employment, rather than all establishments; figures therefore show the number
of skills gaps as a proportion of all employment in each occupation.
Note: The number of employees not fully proficient has been rounded to the nearest 100.

41
Drilling down to occupations within specific sectors where a large proportion of skills gaps
exist yields a more detailed picture of employers’ experience of skills lacking.
Figure 3.1 shows skills gap density by sector, occupation, and occupations within sectors.
Highlighted in blue are occupations within a sector where skills gaps density is at least 10
per cent.
As witnessed previously, pockets of deficiency are most acute in “lower level”
occupations.
Two sectors also stand out as experiencing high skills gap densities across multiple
occupations, namely:
Hotels and Restaurants: Sales and Customer Services, Machine Operatives and
Elementary occupations; and
Financial Services – Sales and Customer Services and Elementary occupations.

42
Figure 3.1 Density of skills gaps by sector, occupation and occupation within sector
Tables A.3.2 and A.3.3 in Annex A provide detailed breakdowns of skills gap density by
occupation within country and sector respectively.
Financial services
= density 10% or above
= density between 5% and 9%
= density between 1% and 4%
Figures only shown where base greater than 50
3.8%
4.0%
4.4%
4.4%
4.4%
4.7%
4.8%
5.0%
5.1%
5.8%
5.8%
7.3%
8.1%
8.9%
Manufacturing
Agriculture
Business
Services
Transport &
Comms
Community
Social activities
Electricity, Gas
& Water
Construction
Public
Administration
Health &
Social Work
Hotels &
Restaurants
Wholesale &
Retail
Education
Financial
Services
Mining &
Quarrying
Skilled Trades
occupations

43
3.3 The causes of skills gaps
Skills gaps most commonly result from staff being new to the role (either because they
have recently started the job or have been promoted to a higher level role) and, related to
this, training only being partially completed. Respectively, 62 per cent and 57 per cent of
all skills gaps are attributed, at least in part, to these reasons. These factors are both
(predominantly) transient, that is to say you would expect skills gaps resulting from these
causes to be eliminated once staff have settled into their new roles and/or existing
training has been completed. Three-quarters (75 per cent) of all skills gaps are attributed,
at least partially11, to one of these causes; but only four per cent of employers with skill
gaps report that all of these gaps are transient gaps, wholly and solely attributable to one
of these factors.
Two other factors relating to training, namely training proving ineffective and staff not
receiving the appropriate training, are also relatively common causes, attributed to 39 per
cent and 29 per cent of skills gaps respectively.
A perceived lack of staff motivation is reported by employers to be an underlying factor
for around two in five skills gaps (42 per cent), rising to 61 per cent in Northern Ireland
and 52 per cent in Wales.
Around a quarter of skills gaps (26 per cent) result from an inability to recruit
appropriately skilled individuals (rising to 31 per cent in Northern Ireland and 35 per cent
in Wales), and approaching one in five (18 per cent) arise from retention difficulties (rising
to 24 per cent in Wales). Table A.3.9 in Annex A details the proportion of employers who
reported having either a skill-shortage vacancy or skills gaps amongst their present
workforce.
The main causes of staff not being fully proficient by nation are presented in Table 3.3.
The figures show what proportions of skills gaps are caused by the various factors
reported by employers. Respondents could give more than one cause for skills gaps
within each occupation.
11
It should be noted that employers were able to give multiple responses to this question. As such, although 75 per cent of skills gaps were at least in part due to transient issues, this does not imply that just 25 per cent relate to longer-term issues.

44
Table 3.3: Main causes of skills gaps (prompted), by nation
UK England Northern Ireland
Scotland Wales
Unweighted base 20,228 16,563 733 1,713 1,219
% % % % %
Staff are new to the role 62 62 64 60 63
Their training is currently only partially completed
57 58 49 56 47
Staff lack motivation 42 41 61 39 52
They have been on training but their performance has not improved sufficiently
39 38 54 39 47
The introduction of new working practices
32 31 48 34 29
Staff have not received the appropriate training
29 29 29 27 27
Unable to recruit staff with the required skills
26 25 31 27 35
The development of new products and services
21 20 30 22 21
The introduction of new technology
20 20 27 24 20
Problems retaining staff 18 17 17 17 24
Summary: New to role and/or training incomplete
75 75 78 76 74
Base: All establishments with skills gaps; up to two skills gaps followed up.
Percentages shown as a proportion of all skills gaps followed up rather than all establishments with skills
gaps. Figures therefore show the proportion of skills gaps in each nation caused by each stated reason.
Table A.3.4 in Annex A provides a breakdown of skills gaps causes by occupation. Of
particular note, skills gaps are most likely to be attributed to staff not receiving the
appropriate training among Managers (34 per cent, compared with 22 to 27 per cent in all
other occupations).
3.4 Skills lacking internally
Employers reporting skills gaps were read a list of types of skills and asked, for each
occupation where they reported that some staff lacked full proficiency, which skills were
lacking. Table 3.4 again shows results based on the total number of skills gaps (as
opposed to establishments).
Close to three in five employees (58 per cent) described by their employers as not fully
proficient were reported to be lacking the requisite technical, practical or job-specific
skills. These were also the most commonly cited skills lacking in 2011.

45
Although the hierarchy of skills lacking is broadly similar to in 2011, it should be noted
that the distance has narrowed between technical/practical/job-specific skills and a
number of other key skills such as planning and organisation, team working and customer
handling. Indeed, in Wales, for example, planning/organisation and team working skills
are more likely to be reported as lacking (57 and 56 per cent respectively) than
technical/practical/job-specific skills (48 per cent)12.
Table 3.4 Skills lacking among staff with skills gaps followed up, by nation
UK England Northern Ireland
Scotland Wales
Unweighted base 20,228 16,563 733 1,713 1,219
% % % % %
Technical, practical or job-specific
58 57 64 63 48
Planning and organisation 57 57 52 60 57
Team working 54 53 65 51 56
Customer handling 50 52 46 48 38
Problem solving 49 49 50 47 51
Oral communication 47 48 39 46 40
Written communication 36 36 33 31 43
Basic computer literacy / using IT
26 25 30 28 36
Strategic Management 25 25 27 21 19
Literacy 25 24 25 21 35
Advanced IT or software 23 22 23 24 31
Numeracy 23 23 23 16 33
Foreign language 12 12 13 11 19
Oral Welsh language skills
n/a n/a n/a n/a 28
Written Welsh Language Skills
n/a n/a n/a n/a 27
Base: All establishments with skills gaps; up to two skills gaps followed up
Percentages shown as a proportion of all skills gaps followed up rather than all establishments with skills
gaps. Figures therefore show the proportion of skills gaps in each nation caused by each stated reason.
Questions about Welsh Language skills were not asked in England, Northern Ireland or Scotland.
12
It should be noted that for the 2011 study ‘Technical or practical skills’ and ‘Job specific skills’ were two discrete categories.

46
Table A.3.5 in Annex A provides an occupational breakdown of skills lacking among staff
with skills gaps. The two skills most frequently cited as lacking are common across most
occupational groups (technical/practical/job-specific and planning/organisation skills
respectively affect 42 to 69 per cent and 44 to 63 per cent of non-proficient staff in each
occupation). As would be expected though, certain other skills are more acutely
associated with a single occupational group. One example is strategic management skills
being a particular issue for Managers, lacking in 54 per cent of Managers that have skills
gaps in contrast to between 15 and 29 per cent for other occupations. Another is, a lack
of team working skills, which is most commonly attributed to Caring, Leisure and Other
services staff and Elementary occupations (64 per cent and 60 per cent respectively,
compared with 40 to 56 per cent across all other occupations).
3.5 The impact of skills gaps
Around two in five employers with skills gaps (37 per cent) report these having no
tangible impact on the establishment’s performance; a slightly lower proportion reported
this being the case than in 2011 (39 per cent).
However, 16 per cent of employers with skills gaps said these have a major impact on
performance, with approximately half (48 per cent) feeling it has a minor impact. These
figures are also in line with 2011, when 15 per cent of employers with skills gaps reported
that these had a major impact and 46 per cent a minor impact. Overall, 63 per cent of
employers with skills gaps report these impacting upon performance (rising to 69 per cent
in Northern Ireland). This equates to 10 per cent of all employers having skills gaps at the
time of the interview which were negatively affecting their business performance.
The four per cent of employers with skill gaps who report having solely ‘transient’ skills
gaps (i.e. skills gaps resulting from staff being new to the role and/or training only being
partially completed) are significantly less likely to report that skills gaps have an impact
on performance: two in five of them (41 per cent) state that these have an effect on how
the establishment performs. In contrast, seven in ten employers (69 per cent) citing other
reasons for skills gaps13 report that these impact on business performance.
Just as skill-shortage vacancies most commonly impact on other, existing staff, so do
skills gaps. Approximately half of employers with skills gaps (53 per cent) report that
these result in an increased workload for others in the workforce; this is a higher
proportion than in 2011 (49 per cent). There is relatively little variation by nation (ranging
from 52 to 56 per cent). This proportion falls to 30 per cent among those solely reporting
transient skills gaps.
13
either exclusively or in addition to transient skills gaps

47
While it is sometimes possible for an increased workload to be absorbed by other staff,
some employers will need to pay for overtime or bring in temporary staff to cover the
work. Overall 26 per cent of employers with skills gaps reported that these had resulted in
increased operating costs (broadly in line with the 28 per cent of employers reporting this
in 2011).
Difficulties in meeting quality standards or introducing new working practices were each
adverse consequences for around a quarter of employers reporting internal skills
deficiencies (26 per cent and 25 per cent respectively). Around a fifth of those with skills
gaps (21 per cent) reported that they had lost business or orders to competitors as a
consequence of experiencing these skills gaps.
Table 3.5 Impact of skills gaps (prompted), by nation
UK England Northern Ireland
Scotland Wales
Unweighted base 20,228 16,563 733 1,713 1,219
% % % % %
Increased workload for other staff
53 52 56 56 54
Have higher operating costs 26 26 28 27 28
Have difficulties meeting quality standards
26 26 29 27 25
Have difficulties introducing new working practices
25 24 30 25 28
Lose business or order to competitors
21 21 19 20 23
Delay developing new products or services
17 16 20 18 17
Outsource work 10 10 14 9 10
No impact 37 37 31 36 36
Any impact 63 63 69 64 64
Base: All establishments with skills gaps
3.6 Employer response to skills gaps
The majority of employers (86 per cent) identifying skills gaps among their workforce
have taken measures to improve the proficiency of these employees, with a further six
per cent planning to do so in the future. For around one in twelve (eight per cent),
however, no action has been taken and no plans are in place to tackle these issues.
Encouragingly, since 2011, there has been a marked rise in the proportion of employers
with skills gaps that have taken action to tackle the issue (86 per cent in 2013 in contrast
to 76 per cent in 2011).

48
Approximately two-thirds of employers with skills gaps among their workforce have either
increased the amount of training they provide or increased the amount they spend on
training (68 per cent).
The next most common responses to skills gaps involve increasing supervision (60 per
cent), reviews and/or mentoring (51 per cent), thereby broadly using the experience of
existing staff to oversee and assist those lacking skills.
The hierarchy of actions taken remains the same as in 2011, though the proportion of
employers undertaking each has increased and there is a suggestion that employers are
looking to other responses than training to resolve skill gaps, perhaps reflecting
pressures to constrain spending.
Figure 3.2: Actions taken to overcome skills gaps (prompted)
Table A.3.6 in Annex A provides a breakdown of actions taken to tackle skills gaps by
country. Of particular note here is that employers in Northern Ireland with skills gaps are
less likely to have taken any action, 77 per cent have done so in comparison with the UK
average of 86 per cent. Employers in Northern Ireland are also considerably less likely to
have increased training-related activities more specifically (58 per cent in contrast with
the UK average of 68 per cent).

49
3.7 Skills deficiencies among existing staff and when recruiting
The previous chapter examined skill shortages encountered when recruiting and this one
has explored skills gaps among the existing workforce.
The reality of the labour market is that there may be a good deal of substitution between
these two measures of labour market deficiency. Some employers when faced with
inadequate applicants will leave the vacancy unfilled, in which case the issue reveals
itself as a skill-shortage vacancy, other employers may feel it is better to recruit someone
who is not appropriately skilled; in which case the deficiency will reveal itself as a skills
gap.
Overall, 18 per cent of establishments were suffering from either form of skills deficiency
(compared with 19 per cent in 2011), including one per cent suffering from both (the
same proportion as in 2011). As previously, establishments that experience both are
more likely to be larger and reporting a larger number of vacancies.
3.8 Under-use of skills
As well as shortages of skills in the available labour market and/or among the existing
workforce, employers can experience a skills imbalance when the skills held by
individuals are not fully deployed in the workplace. We refer to this in this report as
‘under-use of skills’ (though the phenomenon is sometimes referred to elsewhere as
‘over-skilling’, ‘over-qualification’ and/or ‘under-employment’). In UKCESS 2013, ‘under-
use of skills’ was measured by asking employers how many staff, if any, had both
qualifications and skills that are more advanced than required for their current job role.
3.8.1 The prevalence of under-use of skills
Across the UK, approaching half of all establishments (48 per cent) report having some
employees with both qualifications and skills that are more advanced than required for
their current job role. In volume terms, 4.3 million workers or 16 per cent of the workforce
have under-utilised skills. That is to say, the under-use of skills affects a considerably
larger proportion of employers and of the workforce than skills deficiencies do.
As Table 3.6 illustrates, these figures are virtually unchanged at the UK level since 2011
when 48 per cent of establishments reported skills under-use and there were 4.2 million
workers with both qualifications and skills at a more advanced level than demanded by
their job role (15 per cent of the workforce).
Employers in England are less likely to report that their employees skills are under-used
than employers in the rest of the UK, and there was no change in the figures between
2011 and 2013.

50
Outside of England, among employers based in Northern Ireland, Wales and Scotland
there has been considerable movement. In the former two nations, there has been a
marked increase in both the proportion of employers reporting under-use of skills and in
the proportion of the workforce which is underused. In Scotland, there has been a marked
decrease in the proportion of employers reporting that some staff are under-used,
although the proportion of the workforce affected has remained the same.
Table 3.6 Incidence, number and density of staff who are both over-qualified and over-skilled by country (2011 vs. 2013)
% of establishments reporting skills under-use
% of staff reported as being over-qualified and
over-skilled
Row percentages Unwtd base 2011
Unwtd base 2013
2011 2013 2011 2013
UK 86,522 45,644 48 48 15 16
Country
England 74,156 37,559 47 47 15 15
Northern Ireland 3,921 2,015 44 49 15 18
Scotland 2,487 3,044 57 51 17 17
Wales 5,958 3,026 45 50 13 21
Base: Columns one and two all establishments; columns three and four all employment.
Reflecting patterns witnessed in 2011, the incidence of skills under-use is broadly
consistent by establishment size. However, the proportion of staff described as being
over-qualified and over-skilled is considerably higher amongst smaller establishments,
notably those with 2-4 employees, where 30 per cent of staff are considered over-skilled
and over-qualified. This is likely to reflect the more ‘hands-on’ roles that many senior staff
take on in smaller establishments and fewer formal opportunities for progression and
promotion, as well as a greater awareness of qualifications and skills levels in
establishments with fewer staff.
On a sectoral basis, as in 2011, incidence and density of skills under-use are greatest in
the Hotels and Restaurants sector (60 per cent and 24 per cent respectively), a sector
typically characterised by lower skills requirements though employing relatively large
numbers of people with higher-level qualifications.
Conversely, in the Public Administration and Manufacturing sectors, staff are
considerably less likely to be considered over-skilled and over-qualified (nine per cent
and 10 per cent respectively).

51
Table A.3.7 in Annex A provides a detailed breakdown of the incidence, number and
density of staff who are both over-qualified and over-skilled by size of establishment and
by sector.
3.9 Upskilling
Having considered the under-use of skills, this chapter now turns to the notion of
‘upskilling’, that is to say where employers anticipate that staff will need to acquire new
skills over the coming year, as a result of a variety of internal and external factors14.
3.9.1 The prevalence of upskilling needs
Seven in ten employers (71 per cent) expect that at least some of their staff will need to
acquire new skills or knowledge over the next twelve months.
Although in some cases this is likely to reflect a dynamic environment of fast-changing
skills needs (i.e. while current skill levels may be sufficient, over the next 12 months these
skills will become outdated), it is often likely to reflect that, for many employers, staff that
they classify as proficient still have plenty of scope to add to their skill set.
The larger the establishment the more likely they are to anticipate an upskilling need over
the next 12 months, rising from two-thirds (65 per cent) of those with fewer than five staff
to nine in ten employers (90 per cent) of those with at least 250 employees.
Employers reporting current skills gaps are more likely than average to expect that some
of their staff will need to acquire new skills or knowledge over the coming year (83 per
cent), though still 69 per cent of those who report that all their staff are fully proficient
anticipate an upskilling need.
Between two in five and half of all employers reported a need to upskill because of new
legislative or regulatory requirements (46 per cent), the introduction of new
technologies/equipment (44 per cent), the development of new products and services (43
per cent), and/or the introduction of new working practices (42 per cent). Approaching a
third also felt that the need to upskill would arise as a result of competitive pressure (31
per cent).
As illustrated in Table 3.7, there are relatively few differences by country, though
employers in Scotland and Wales are slightly more likely to attribute upskilling needs to
new legislative or regulatory requirements (51 per cent in each case) than those in
England and Northern Ireland (45 per cent and 47 per cent respectively).
14
Further information documenting UKCES’ long term forecasts of labour market demands can be found in Working Futures http://www.ukces.org.uk/ourwork/working-futures

52
Table 3.7: Whether expect employees will need to acquire new skills or knowledge in the next 12 months, and the reasons for this (prompted), by country
UK England Northern Ireland
Scotland Wales
Unweighted base: 45,644 37,559 2,015 3,044 3,026
% % % % %
Expect employees to need to acquire new skills / knowledge
71 70 72 74 72
New legislative or regulatory requirements 46 45 47 51 51
The introduction of new technologies or equipment 44 44 47 46 46
The development of new products and services 43 43 40 44 45
The introduction of new working practices 42 42 43 45 45
Increased competitive pressure 31 31 32 30 31
Base: All establishments in Module 2

53
3.9.2 Occupations most affected by the need for upskilling
Employers anticipating the need for staff to acquire new skills or knowledge were asked
which single occupation would be most affected. Four in ten establishments that employ
staff in Professional occupations (40 per cent) anticipate these staff being their priority in
terms of the need to acquire new skills in the next 12 months, and a similar proportion (37
per cent) anticipate the need for their Caring, Leisure and Other services staff to acquire
new skills. In contrast, just 12 per cent of establishments employing Administrative and
Clerical staff and 14 per cent employing Elementary staff foresee a priority need for these
staff to acquire new skills or knowledge in the coming year. Tables A.3.10 and A.3.10a in
Annex A provide a comparison of this measure by country.
Figure 3.3 Single occupation most affected by the need for upskilling
32%
40%
29%
12%
31%
37%
29%
21%
14%
Man
ag
ers
Pro
fes
sio
na
lo
cc
up
ati
on
s
As
so
cia
tep
rofe
ss
ion
als
Ad
min
istr
ati
ve
Skil
led
tra
de
s
Ca
rin
g a
nd
Le
isu
re
Sale
s a
nd
cu
sto
me
r se
rvic
e
Pro
ces
s, p
lan
t an
dm
ac
hin
eo
pe
rati
ves
Ele
me
nta
ry
Base: All establishments who employ staff in each occupation (Module 2)
Base: (44,018) (8,739) (6,268) (26,945) (11,811) (6,973) (13,690) (7,002) (16,100)

54
3.9.3 Upskilling: skills that need improving or updating
Across all occupational groups, the skills that are most likely to need improving or
updating are technical, practical and job-specific skills: this was identified by 57 per cent
of employers who said that they needed to upskill over the next 12 months.
Following technical, practical and job-specific skills, planning and organisation skills were
reported by 44 per cent of employers needing to upskill staff over the coming year. A
number of other skill areas were then mentioned by around a third: problem solving skills
(35 per cent), advanced IT skills (34 per cent), team working skills (32 per cent) customer
handling skills (31 per cent), and strategic management skills (31 per cent). Broadly
speaking the order of the skills needing improving over the coming 12 months is similar to
that for where employers report existing skill gaps (see Table 3.4). It is notably however
that improving advanced IT skills appears a particular priority for the coming 12 months in
the sense of it being one of the most commonly mentioned priorities for the coming year,
but a relatively infrequently mentioned existing skills gap.
Figure 3.4 Skills which need improving or updating in the next 12 months (prompted)
Table A.3.8 in Annex A provides an occupational breakdown of the skills cited in
connection with upskilling needs.
10%
12%
13%
18%
22%
24%
31%
31%
32%
34%
35%
44%
57%
Foreign language skills
Literacy skills
Numeracy skills
Written communication skills
Oral communication skills
Basic computer literacy / using IT
Strategic management skills
Customer handling skills
Team working skills
Advanced IT or software skills
Problem solving skills
Planning and organising skills
Technical, practical or job specific skills
Base: All establishments who anticipate a need to upskill staff in next 12 months
excluding those where main occupation is not known (32,630)

55
3.10 Conclusions
Although the vast majority of establishments consider their entire workforce to be
proficient, 1.4 million employees are nonetheless regarded as not being fully proficient in
their job roles, equating to 5.2 per cent of the total UK workforce.
As with skill-shortage vacancies, skills gaps continue to be concentrated in certain
pockets of the economy. People employed in what are traditionally described as unskilled
or semi-skilled occupations – namely those in Elementary and Sales and Customer
Service positions – remain the most likely to have skills gaps. Sectorally, skills gaps are
particularly prevalent in the Hotels and Restaurants industry.
Encouragingly, since 2011, there has been a marked rise in the proportion of employers
with skills gaps that have taken action to tackle them, though there is still scope for more
widespread, targeted responses to address these issues.
At the same time, 4.3 million workers (16 per cent of the workforce) are reported as
having under-used skills; harnessing these latent capabilities could clearly yield wide-
ranging benefits for some employers.
Looking to future skills needs, establishments that employ staff in Professional and
Caring and Leisure occupations anticipate these staff being their priority in terms of the
need to acquire new skills. This presents a particular challenge, however, insofar as
these are both occupations in which it is relatively more difficult for employers to find
suitably skilled candidates for new positions. As such, this puts an onus on training to
develop the skills of existing staff (rather than recruitment of new employees) as the most
appropriate and effective solution.

56
4 Training and Workforce Development
4.1 Summary
Most employers fund or arrange training for their staff: two-thirds had done so over the
previous 12 months (66 per cent), a figure in line with 2011 (65 per cent). While most
employers could be described as being in ‘training equilibrium’ having been able to
provide all the training that they wanted over the previous 12 months, over two-fifths of all
employers (42 per cent, including non-trainers that had not delivered any) wanted to
provide more training than they had been able to do. By far the most common reason that
some employers do not provide training is that they believe all their staff to be fully
proficient in their roles.
There have been some notable changes since 2011 in the nature of training activity
conducted. There is evidence of more employers providing off-the-job training, and
training being more widely offered across the workforce. More employers have arranged
any off-the-job training (49 per cent compared to 47 per cent in 2011) and fewer have
only offered on-job training (17 per cent compared to 19 per cent in 2011); and the
proportion of staff trained over the previous 12 months has risen substantially from 55 per
cent to 62 per cent.
On the other hand, each person trained received fewer days training over the last 12
months in 2013 than in 2011 (an average of 6.7 days compared with 7.8 days in 2011),
meaning that the total number of training days employers had provided over the previous
12 months has decreased slightly since 2011 (from 115 million to 113 million days).
Moreover, total employer investment in training decreased by around five per cent or just
short of £2½ billion in the period 2011 to 2013 (from £45.3bn to £42.9bn). Training
investment per person trained fell by 17 per cent from around £3,075 in 2011 to £2,550 in
2013, although this was in the context of a significant increase in the number of
employees receiving training.
In the context of tightened economic circumstances, it is not unreasonable for employers
to seek to invest more widely in training. Although training spend and the numbers of
days spent training are slightly down across the UK as a whole, this has been achieved in
combination with an increase in the number of staff trained, an increase in the ratio of off-
the-job to on-the-job training (a crude measure of the quality of training) and an increase
in the proportion of training that leads to a recognised qualification. This could suggest a
more efficient allocation of resource to partially offset a relatively modest cut in the level
of overall spend.

57
There is some variation in training activity by country: Employers in Scotland were the
most likely to have funded or arranged any training in the previous 12 months (70 per
cent) and those in Wales the least likely (62 per cent). Employers in Scotland also trained
a greater proportion of their workforce (65 per cent) than employers elsewhere in the UK
(this was the case in 2011 also); employers in Northern Ireland trained the lowest
proportion of their workforce (59 per cent).
4.2 Introduction
Training is widely recognised as a key means to improving skills and thereby to
maintaining and improving competitiveness and stimulating economic growth. Indeed in
the previous chapter, we saw that increasing training activity was the most common
employer response to attempt to tackle skill gaps among their workforce. This chapter
examines trends in employer training activity since 2011. It examines which employers
fund or arrange training and development for their employees, the types of training
provided and which employees they provide it for. It also explores the reasons employers
give for not providing training and development for their staff, and the barriers to
employers providing more training than they currently do. The final section of the chapter
looks at employer expenditure on training: results for this aspect of the research are
derived from the Investment in Training follow-up study with a proportion of the UKCESS
2013 sample (see the accompanying Technical Report for details of the methodology).
Throughout the chapter we discuss the training or development provided by employers in
terms of:
Off-the-job training or development: training undertaken away from the individual’s
immediate work position, whether on the employer’s premises or elsewhere;
On-the-job or informal training and development: activities that would be
recognised as training by staff, and not the sort of learning by experience which could
take place all the time.
Time series for the headline training measures by country can be found in Annex B.
4.3 Incidence of training and workforce development
Two-thirds of employers (66 per cent) had arranged or funded off- or on-the-job training
or development for any of their staff in the previous 12 months. Similar proportions had
provided off-the-job as on-the-job training (49 per cent and 52 per cent respectively), with
just over a third providing both (35 per cent of all employers).

58
While the proportion providing any training or development is in line with results in 2011
(65 per cent), there has been an increase in the proportion providing any off-the-job
training over the previous 12 months (49 per cent from 47 per cent in 2011) and a fall in
the proportion providing any on-the-job (52 per cent in 2013 compared with 53 per cent in
2011) and only providing on-the-job training (17 per cent from 19 per cent in 2011).
Figure 4.1 Training provision over the last 12 months
Employers in Scotland were the most likely to report having funded or arranged any
training in the previous 12 months (70 per cent) and those in Wales and Northern Ireland
the least likely (62 per cent and 63 per cent respectively). Despite employers in Scotland
being the most likely to have provided training in the 2013 survey (as they were in 2011),
the proportion providing training over the last 12 months was lower than in 2011 (73 per
cent).
The likelihood of providing training increases with employer size, and is almost universal
in establishments with 25 or more staff (93 per cent among those with 25-99 staff and 97
per cent among those with 100 or more employees). Among the very smallest sites
employing 2-4 staff just over half had provided any training (52 per cent), rising to three-
quarters (77 per cent) among those with 5 to 24 staff.
66% 66%63%
70%
62%
49% 48% 49%53%
47%
52% 52%
47%
57%
48%
0%
10%
20%
30%
40%
50%
60%
70%
80%
90%
100%
UK England NorthernIreland
Scotland Wales
Train Train off-the-job Train on-the-job
Base : All establishments (as shown)
17% 17% 17% 15%14%
Boxed figures =
percentage providing on-
the-job training ONLY
(91,279) (75,255) (4,014) (6,014) (5,996)

59
As in 2011, employers in Education, Public Administration, and Health and Social Work
were the most likely to provide any training (92, 90 and 89 per cent respectively), and
those in Agriculture the least likely (50 per cent).
More data on the incidence of training, and how this varies by country, size and sector,
and between 2011 and 2013, can be found in Table A.4.1 in Annex A.
Among employers that funded or arranged any training over the last 12 months three-
quarters (74 per cent) provided off-the-job training. While overall a quarter of employers
that train provided only on-the-job training (26 per cent), this was much higher among the
smallest employers (31 per cent of trainers with 2-4 staff), and those operating in
Wholesale and Retail (34 per cent) and Hotels and Restaurants (37 per cent).
4.4 Other wider activity to aid the development of staff
In addition to ‘formal’ on- or off-the-job training, employers can develop their staff in more
informal ways. Employers were asked whether they had undertaken three specific
activities in the last 12 months to aid the development of employees: supervision to guide
employees through their job role; providing staff with opportunities to spend time learning
through watching others perform their role; and allowing staff to perform tasks that go
beyond their strict job role and providing feedback on how well they have done.
The vast majority of employers (85 per cent) had provided at least one of these wider
development opportunities for their staff in the last 12 months (markedly lower at 76 per
cent among the smallest sites with fewer than five staff, but above nine in ten for all other
size of employer). A majority of employers had undertaken each of the three development
activities, indicating that employers generally use a suite of activities to meet their
development needs. The likelihood of providing wider development activities closely
matches the pattern for providing training and development, and is higher than average
among employers in Scotland, larger employers, and those in Education, Public
Administration and Health and Social Work. Data on how provision of wider development
activities differs by country, sector and size of employer both in 2013 and 2011, and the
nature of the development activity, is provided in Table A.4.2 in Annex A.
While most of the employers providing any of these wider development opportunities also
deliver more formal training, almost a quarter of all employers (23 per cent) did not
provide formal training but did provide some of these wider development opportunities.
Overall almost nine in ten employers (89 per cent) either funded or arranged on- or off-
the-job training or provided wider development opportunities.
60
One in nine employers (11 per cent) neither train nor offer any of the wider development
opportunities discussed in the survey. The vast majority of these are small employers
with fewer than five staff: among employers of this size 18 per cent neither train nor offer
these development opportunities. Employers in Agriculture and Construction were also
more likely than average to neither train nor offer these wider development opportunities
(24 per cent and 18 per cent respectively).
Although there has been no change in the incidence of training in 2013 compared to
2011, the proportion offering any of the three wider development activities in 2013 (85 per
cent) has increased compared to 2011 (82 per cent), particularly for supervision guiding
employees through their job role over time (up five percentage points from 2011 to 2013).
4.5 Barriers and limits on training
Some employers choose not to provide any workforce development for their staff. This
section explores the extent to which such decisions relate to demand (such as there
being no perceived need) and the extent to which they reflect issues of supply (pricing,
availability, accessibility etc.). From this perspective, employers who had not funded or
arranged any training were asked why they had not done so.
By far the main reason for employers not providing any training over the previous 12
months is low perceived demand, particularly the view that all their staff are fully proficient
(69 per cent). Low demand is also reflected in non-trainers saying training is not or has
not been a priority for the organisation (seven per cent). Managers being too busy to
organise training (three per cent), and employees being too busy to attend training (two
per cent) or to deliver training (two per cent) were also responses indicative of low
demand to the extent that training is clearly treated as a lower priority than more pressing
day-to-day issues.
One in ten non-trainers said the reason for not training was their having no money
available for training (10 per cent, rising to 17 per cent among non-trainers in the charity /
voluntary sector).
Perceived poor supply of training was infrequently given as the reason for not training:
Five per cent of non-trainers said training was not available in the subject area they
wanted;
Two per cent described training as too expensive;
One per cent of non-trainers said the courses they were interested in were not
available locally.

61
More data on the reasons for not providing training can be found in Table A.4.3 in Annex
A.
Approaching half of employers (47 per cent) that train would have liked to provide more
training over the last 12 months than they were able to fund or arrange. The larger the
size of the training employer, the more likely they were to have been limited in the
amount of training that they were able to provide (57 per cent of trainers with 100 or more
staff, compared with 44 per cent of those with fewer than five staff). Employers in
Scotland, Northern Ireland and Wales that trained were more likely than average to have
felt limited in the training they could provide (53, 52 and 50 per cent, respectively).
The reasons these employers give for being unable to deliver the amount of training they
would have liked generally relate to internal issues, in particular not having the funds to
provide more training (mentioned by 60 per cent of these employers) or not being able to
spare the time for staff to have more time training (48 per cent, rising to 56 per cent
among those in Scotland). Of course, both statements could be read as relating to the
supply of training in the sense that less expensive, better value training or training
requiring less time away from the workplace would lead to more training being
undertaken. Issues explicitly relating to the supply of training were infrequently mentioned
as barriers to further training. The most commonly mentioned were a difficulty finding
training providers that can deliver training where or when they want it, and a lack of
appropriate training / qualifications in the subject areas needed (each mentioned by four
per cent of trainers that would have liked to deliver more training over the previous 12
months).
More data on the proportion of training employers that would have liked to provide more
training over the previous 12 months, and the main barriers preventing them doing so,
can be found in Table A.4.4 in Annex A.

62
Figure 4.2 summarises results on the proportion of all employers that would have liked to
have undertaken more or, in the case of non-trainers any training, over the previous 12
months15 compared with the proportion that are in ‘training equilibrium’ (having no wish to
have undertaken more training). Overall just over two-fifths of all employers (42 per cent)
would have liked to have undertaken more training over the previous 12 months than they
were able to provide. The likelihood of not being in ‘training equilibrium’ (i.e. wanting to
have undertaken more training over the previous 12 months) increases with
establishment size (from 36 per cent among those with 2-4 staff, to around half for those
with 5 to 99 staff, to 60 per cent among those with 100 or more staff). It was also higher
among employers in Scotland (47 per cent, compared with 42 per cent among employers
in England, 43 per cent among those in Wales and 45 per cent among those in Northern
Ireland).
Figure 4.2: Employer interest in undertaking more training over the last 12 months than they were able to provide
Base: all establishments 91,279; establishments that train 69,842; establishments not providing training over
the last 12 months 21,437.
15
Results for non-trainers have been determined from their reasons for not training, rather than a direct question. Those answering that they had not provided any training because training was not considered to be a priority for their establishment, because all their staff were fully proficient or they had no need for training were regarded as being in skills equilibrium and having no perceived need to undertake training. Those not giving any of these reasons were classified as wanting to have undertaken training.

63
4.6 Types of training provided
Job-specific training aimed at developing the skills of a particular occupation or job role
was the most common type of training provided by employers (arranged by 85 per cent of
those that train). A majority of trainers had also funded or arranged health and safety
training including first aid (74 per cent) and / or induction training (58 per cent). The types
of training provided by employers for the 2013 survey were very similar to 2011 (all within
one percentage point).
Figure 4.3 Types of training provided over the last 12 months by employers that train (prompted)
There was quite wide variation by sector in the types of training provided over the last 12
months. Among employers that provided training:
Those in Education and Public Administration were more likely than average to have
provided each type of training. In both these sectors the majority had provided each
type of training other than supervisory training.
There was particularly wide variation in the proportion providing management training.
o It was higher in: Education (60 per cent), Public Administration (54 per
cent), Health and Social Work (45 per cent), Mining and Quarrying (44 per
cent), Financial Services (44 per cent), Wholesale and Retail (42 per cent),
and Hotels and Restaurants (42 per cent).
34%
35%
48%
58%
74%
85%
Supervisory training
Management training
Training in new technology
Induction training
Health and safety / first aid training
Job specific training
Base : All establishments that train (69,842)

64
o Provision of any management training in the last 12 months was far lower
than average in Agriculture (14 per cent), Construction (22 per cent),
Transport and Communications (26 per cent) and Manufacturing (26 per
cent)..
More details of results by sector, as well as country and establishment size, are provided
in Table A.4.5 in Annex A.
4.7 Numbers trained
Although the proportion of employers providing training was largely unchanged from 2011
to 2013, the number of staff receiving training has increased significantly. Around 16.8m
staff were trained over the last 12 months, equivalent to 62 per cent of the workforce,16 up
from 55 per cent in the 2011 survey.
Most of the increase in 2013 has come about through larger employers training more of
their staff than they did in 2011. The change is particularly marked among employers with
250 or more employees: in 2011 the number of staff trained over the previous 12 months
in these large establishments was equivalent to 54 per cent of the total workforce
employed in this size of site. In 2013 this had increased to 71 per cent.
The increase across the UK from 2011 to 2013 in the proportion of staff trained over the
previous 12 months has occurred across each country, though to a much lesser extent in
Northern Ireland, as shown in Table 4.1. Staff in Scotland were more likely than
elsewhere in the UK to have received any training in the previous 12 months (65 per
cent). Looking further back over time in England, the share of the workforce trained (62%)
is now higher than the pre-recession level seen in 2009 (56%), and back to similar levels
seen in 2005 and 2007 (Annex B).
16
The figure involves an element of over counting in that employers are asked about the number of staff they trained over the last 12 months whether or not they still work at the site. Hence someone who was trained at a site in the last 12 months but who left to join another employer who provided that person with training would be counted twice (if both employers were interviewed for the survey).

65
Table 4.1 Number of staff trained over the last 12 months and the proportion of staff trained by establishment size and country
2011 2013
Unwtd Base
Number trained
% of staff trained
Unwtd Base
Number trained
% of staff trained
UK 86,522 14.7m 55 91,279 16.8m 62
Country
England 74,156 12.3m 54 75,255 14.1m 62
Northern Ireland 3,921 0.4m 56 4,014 0.4m 59
Scotland 2,487 1.4m 58 6,014 1.5m 65
Wales 5,958 0.7m 56 5,996 0.7m 62
Size
2-4 17,905 1.0m 40 19,058 1.0m 41
5 to 24 47,770 3.4m 53 51,565 3.5m 54
25-49 9,416 2.0m 59 10,123 2.1m 63
50-99 5,416 2.0m 59 5,315 2.3m 66
100-249 3,270 2.4m 60 2,938 2.7m 68
250+ 1,626 4.0m 54 1,187 5.2m 71
Base: All establishments.
Percentages are based on all employment rather than all establishments, figures therefore show the
proportion of all staff within each subgroup trained over the last 12 months.
There were wide differences in the proportion of staff trained by sector. Employers in
Health and Social Work and Education trained the highest proportion of staff (80 per cent
and 76 per cent respectively; these two sectors also trained the highest proportion of staff
in 2011, although at much lower levels). Employers in Agriculture trained the lowest
proportion (41 per cent; again this sector trained the lowest proportion in 2011). Results
for the number and proportion of staff trained by sector, both in 2013 and 2011, are
provided in Table A.4.6 in Annex A.
By occupation, staff in Caring, Leisure and Other Services roles were the most likely to
receive training (81 per cent of all staff in these roles were trained in the last 12 months).
The proportion was also higher than average among Professionals and Associate
Professionals (70 per cent and 65 per cent respectively). Those employed as Managers
and Senior Officials were the least likely occupational group to receive training in the
previous 12 months (50 per cent).

66
We have seen that for the 2013 survey, more staff had been trained over the previous 12
months than was the case in 2011. As shown in Figure 4.4 this increase has occurred
across all occupational groups, and was particularly marked for those employed in
Caring, Leisure and Other Services roles and those working as Machine Operatives. As
reported in chapter two, these were the two occupations with particularly large increases
compared with 2011 in the density of skill-shortage vacancies. One hypothesis may be
that difficulties in finding suitable recruits in these occupations have led to an increase in
the training of existing staff in these roles.
Figure 4.4 Proportion of staff trained over the last 12 months by occupation 2013 vs. 2011
Percentages are based on all employment rather than all establishments, figures therefore show the
proportion of all staff trained in each subgroup.
Note: The figures for the proportion of staff trained have been calculated excluding those respondents unsure
of the exact number of people trained and who did not know the number trained by occupation.
4.8 Training days
Employers varied quite widely in terms of the average number of days training they
provided. One in eight employers that trained (12 per cent) said on average each
member of staff trained received one day or less training over the previous 12 months,
while one in twelve (eight per cent) said the typical person trained received more than 20
days. Results are similar to those found in 2011, though with fewer in 2013 providing 11
or more days training for the average person trained (18 per cent compared with 20 per
cent in 2011).
47%
65%
59%
47%
56%
73%
57%
48% 49%50%
70%
65%
52%
60%
81%
63%
57%55%
0%
10%
20%
30%
40%
50%
60%
70%
80%
90%
100%
Managers /Senior
Officials
Professionals Assoc.Professionals
Admin /clerical
SkilledTrades
Caring,Leisure,Other
services
Sales &Customer
service
Machineoperatives
Elementary
2011 2013
Base : All establishments with staff in each occupation
(87,946) (17,407) (12,577) (53,759) (23,644) (14,017) (27,417) (14,059) (32,192)

67
The average number of training days differed relatively little by country: the main variation
of note was employers that train in Northern Ireland were less likely than average to have
provided substantial training of 11 or more days on average per person trained (15 per
cent compared with a UK average of 18 per cent).
There was a clear pattern by size of establishment: as in 2011, the larger the
establishment the less likely they were to provide substantial training of 11 days or more
on average per person trained. Among training establishments with fewer than five staff,
19 per cent said that on average each person trained received 11 days training or more,
and the figure was similar for those with 5 to 24 staff (18 per cent); in comparison among
those with 250 or more staff it fell to eight per cent.
Table A.4.7 in Annex A provides detailed findings on the range of days training provided
by country, size and sector of employer.
Overall the average number of days training provided to each person trained has fallen
from just under eight days in 2011 to just under seven days in 2013. This is shown in
Table 4.2.
We have seen that a similar proportion of employers provided any training in 2013 as
2011, more staff in 2013 received training in the previous 12 months, but the average
number of training days provided to each person trained has fallen. The net effect is that
the overall number of training days reported by employers is slightly lower in 2013 than
2011: 113.2m training days compared with 114.6m in 2011.
There are some country-based nuances to this aggregate picture:
In England the total number of training days has fallen compared with 2011 (from c.
97m to c. 95m, a 2.3 per cent fall). This is a result of fewer days training being
provided to each person trained (6.7 days from 7.9 days in 2011) since the number of
people trained actually increased (from 12.3m in 2011 to 14.1m in 2013).
In Wales, there has been an increase in the total number of training days provided
over the last 12 months by employers in 2013 compared with 2011 (5.6m days up
from 4.9m in 2011).
In Northern Ireland the total number of training days provided by employers has not
changed since 2011, and as in 2011 those trained in Northern Ireland receive the
fewest days training per annum (an average of 6.3 days, equivalent to 3.7 days per
employee).

68
In Scotland, the total number of training days is almost unchanged (10.0m days in
2013 compared with 9.9m in 2011), though there has been a fall in the number of
days provided per person trained (from 7.3 in 2011 to 6.7 in 2013, a figure exactly
matching the UK average).
Table 4.2 Total training and development days, and days per person trained and per employee (2011 vs. 2013)
2011 2013
Unwtd Base
Total training
days
Days per person trained
Days per employee
Unwtd Base
Total training
days
Days per
person trained
Days per employee
UK 66,439 114.6m 7.8 4.2 69,842 113.2m 6.7 4.2
Country
England 56,713 97.1m 7.9 4.3 57,787 94.9m 6.7 4.2
Northern Ireland
2,903 2.7m 6.3 3.5 2,894 2.7m 6.3 3.7
Scotland 2,170 9.9m 7.3 4.2 4,884 10.0m 6.7 4.3
Wales 4,653 4.9m 7.5 4.2 4,277 5.6m 7.7 4.8
Size
2-4 9,121 10.0m 10.5 4.2 9,580 10.6m 10.7 4.4
5-24 37,758 30.3m 9.0 4.7 40,801 29.1m 8.3 4.5
25-49 9,416 16.7m 8.4 4.9 10,123 15.2m 7.3 4.6
50-99 5,416 16.2m 8.1 4.8 5,315 15.1m 6.7 4.4
100-249 3,150 16.1m 6.6 4.0 2,864 17.4m 6.3 4.3
250+ 1,578 25.3m 6.4 3.4 1,159 25.8m 5.0 3.5
Base: All establishments that train (though ‘days per employee’ is based upon employment across
all establishments).
There is a distinctive pattern by size of establishment.
The larger the site, the fewer days training are provided to each person trained;
When total annual training days is converted to a ‘days per employee’ figure, this is
lowest in the very largest sites with 250 or more employees (3.5 days), but similar for
smaller size bands (4.3 to 4.5 days training per employee per annum).
Results by sector for the total number of training and development days, and days per
person trained and per employee for 2013 and 2011 can be found in Table A.4.8 in
Annex A. These reveal:
A fall in the total number of training days provided in Manufacturing (6.2m from 8.9m
in 2011) and in Public Administration (7.4m from 9.4m in 2011);
An increase in the total number of training days provided among Business Services
employers (19.2m, up from 15.2m in 2011).

69
The number of days training provided to each person trained was highest, as in 2011,
in the Hotels and Restaurants sector (an average of 9.1 days, though this is lower
than the 11.4 days found in 2011).
It is worth noting that the fall from 2011 to 2013 in the number of days training per annum
provided to each person trained echoes findings reported in ‘Training in Recession: the
impact of the 2008-2009 recession on training at work’ (published in September 2013)17.
This report presented data from the Quarterly Labour Force Survey showing that intensity
of training (as measured by the hours of training in a given reference week among those
that were trained) had fallen in the 2005 – 2010 period18, and that this was part of a
longer term fall in training duration dating back to 1995.
4.9 Training to qualifications
As well as enabling an assessment of the quantity of training provided (the number
receiving any training and the number of days provided), the survey also provides an
assessment of the quality of the training being provided, in particular whether the training
provided by employers is leading to nationally recognised qualifications.
Just under half of employers that trained over the last 12 months had funded or arranged
any training intended to lead to a nationally recognised qualification (47 per cent,
equivalent to 31 per cent of all employers). The figure is slightly higher than in 2011
(when 46 per cent of employers that trained had arranged any training leading to
nationally recognised qualifications). As in 2011 trainers in Northern Ireland were the
least likely to have trained any staff towards nationally recognised qualifications (45 per
cent), while those in Wales were the most likely (53 per cent). Results are shown on
Table 4.3.
Size is a key determinant of whether or not employers that train use nationally recognised
qualifications. Just over a third of the smallest employers (with 2-4 staff) do so (36 per
cent), rising to half among trainers with 5-24 staff (50 per cent), around two-thirds of
those with 25-49 staff (63 per cent) or 50-99 staff (69 per cent) and three-quarters of
those with 100 or more staff (76 per cent).
17
Training in Recession: The impact of the 2008-2009 recession on training at work (UKCES, 2013), http://www.ukces.org.uk/assets/ukces/docs/publications/evidence-report-72-training-in-recession.pdf 18
Note, the Labour Force Survey question changed in 2011, and hence longitudinal data only exists up to 2010.

70
Relatively few employers trained any staff to Level 1 qualifications over the last 12
months (nine per cent of those that train, equivalent to six per cent of all employers). In
comparison, use of Level 2, 3 and 4 and above qualifications was more common (among
employers that train 17 per cent, 18 per cent and 15 per cent respectively had used
each, equivalent to 11, 12 and 10 per cent respectively of all employers). More
employers in 2013 reported training to Level 4 qualifications or higher (10 per cent of all
employers) than in 2011 (eight per cent).
Employers in Wales were more likely to have trained any staff to each individual Level
than employers elsewhere in the UK, and more likely to have trained staff to any
nationally recognised qualifications in the last 12 months (53 per cent compared with 47
per cent in England and Scotland, and 45 per cent among employers in Northern Ireland).
Table 4.3 Training to nationally recognised qualifications over the previous 12 months
2011 2013 2013
All employers: Employers that train:
UK UK UK England Northern Ireland
Scotland Wales
Unweighted Base: 86,522 91,279 69,842 57,787 2,894 4,884 4,277
% % % % % % %
Establishments training any staff to a qualification
30 31 47 47 45 47 53
Trained any to Level 1 6 6 9 9 10 11 12
Trained any to Level 2 10 11 17 18 15 11 21
Trained any to Level 3 11 12 18 18 15 13 22
Trained any to Level 4 or above
8 10 15 15 15 15 17
Number trained to a qualification
3.3m 3.6m 3.6m 3.0m 0.1m 0.3m 0.2m
Of staff trained, the % trained to a qualification over the last 12 months
22% 21% 21% 21% 18% 20% 30%
Of all employees, % trained to a qualification over the last 12 months
12% 13% 13% 13% 10% 13% 18%
Base: Columns 1 and 2 ‘All establishments’, columns 3 to 7 ‘Establishments that train’;
Note: The row ‘number trained to a qualification’ shows how many individuals were undertaking
training leading to nationally recognised qualifications in the 12 months prior to interview, not how
many staff had achieved these qualifications.
Note also in the final row the base for the number of employees is all employers not just
employers that train.

71
Overall 3.6m staff benefited from training aimed at achieving a nationally recognised
qualification over the last 12 months. This is slightly higher than in 2011 (3.3m). A fifth (21
per cent) of staff trained in 2012-13 received training intended to lead to a nationally
recognised qualification, equivalent to 13 per cent of all employees. These percentages
are within one percentage point of those found in 2011, and therefore suggest that the
increase in the volume of training leading to qualifications is more to do with an increase
in the number of staff being trained than any change in the proportion of those trained
receiving this kind of training.
As on a number of training measures, results on training to nationally recognised
qualifications were below the UK average in Northern Ireland, and above average in
Wales. For example, 18 per cent of all employees in Wales were trained to a nationally
recognised qualification in the last 12 months, compared with 10 per cent in Northern
Ireland.
Findings on the incidence and extent of provision of training leading to qualifications by
size and sector can be found in Table A.4.9 in Annex A. This shows that although larger
employers that train were more likely to have trained any staff to a nationally recognised
qualification over the previous 12 months, the proportion of all employees trained to a
qualification varied relatively little by size of establishment. By sector, Health and Social
Work employers that trained were the most likely to have trained any staff to a
qualification (65 per cent), and trained the highest proportion of their workforce to
nationally recognised qualifications (24 per cent, compared to the UK average of 13 per
cent).
4.10 Investment in Training
Employer expenditure on training and development over the previous 12 months was
£42.9bn, equivalent to around £2,550 per person trained and just under £1,600 per
employee. (This expenditure includes the wages of staff while being trained, and of staff
delivering training; Table 4.5 provides a breakdown of total expenditure into constituent
parts.)
The pattern of training spend per person trained and per employee is inversely correlated
with establishment size: the larger the employer the less is spent (Table 4.4). This
appears to reflect economies of scale for larger employers. Although the smallest
employers with fewer than five staff provide approximately twice as many training days
per person trained as those with 100 or more employees (10.7 days per annum
compared with 5.5 days respectively), they spend more than three and a half times as
much per person trained per annum (£5,630 per person trained, compared with £1,570
among employers with 100 or more staff (£1,570).

72
Results are shown on Table 4.4, with comparisons with 2011. It is worth noting that here,
and throughout this chapter, training expenditure figures for 2011 were as reported at the
time of the 2011 survey and have not been adjusted for inflation.
Table 4.4 Total training expenditure and spend per person trained and per employee (2011 vs. 2013)
2011 2013
Unwtd Base
Total
Spend per
person trained
Spend per employee
Unwtd Base
Total Spend per
person trained
Spend per employee
UK 11,027 £45.3bn £3,080 £1,680 12,522 £42.9bn £2,550 £1,590
Country
England 7,872 £38.6bn £3,140 £1,700 8,704 £36bn £2,550 £1,580
Northern Ireland
990 £1.2bn £2,810 £1,570 1,028 £1.1bn £2,540 £1,490
Scotland 682 £4bn £2,920 £1,690 1,429 £4.2bn £2,800 £1,810
Wales 1,483 £1.5bn £2,280 £1,280 1,361 £1.6bn £2,200 £1,350
Size
2-4 1,774 £5.5bn £5,740 £2,310 2,317 £5.5bn £5,630 £2,320
5-24 6,542 £11.9bn £3,550 £1,860 6,953 £12.8bn £3,650 £1,980
25-49 1,452 £5.6bn £2,810 £1,650 1,722 £6.5bn £3,080 £1,940
50-99 708 £5.9bn £2,930 £1,730 928 £5.6bn £2,480 £1,630
100+ 551 £16.4bn £2,560 £1,440 602 £12.5bn £1,570 £1,100
Base: Establishments completing the Investment in Training study.
Note: The figures for spend per person trained and per employee have been rounded to the nearest £10.
There is evidence of decreasing employer financial investment in training since 2011
both in terms of total spend and spend per trainee19. In 2011 total employer investment in
training among those with employment of two plus staff was £45.3bn20. The fall in total
training expenditure from 2011 to 2013 is driven mainly by a fall in expenditure among:
Employers in England (from £38.6bn in 2011 to £36.0bn). In contrast expenditure has
increased slightly in nominal terms in Scotland and Wales (by £0.2bn and £0.1bn
respectively).
Large employers with 100 or more staff (from £16.4bn in 2011 to £12.5bn).
19
Indeed the figure for spend per person trained and per employee in England 2013 is also unchanged from that reported in 2005 (http://www.ukces.org.uk/assets/ukces/docs/research-data/2005nat-nationalemployersskillssurvey2005mainreport-re-june2006.pdf), when the figures were £2,500 and £1,550 respectively. 20
It is important to note that this figure for the 2011 survey is different (lower) to that quoted in the 2011 UK report (http://www.ukces.org.uk/assets/ukces/docs/publications/ukces-employer-skills-survey-11.pdf) for two reasons. First the UKCESS 2011 survey included some establishments that were not eligible for the 2013 survey, namely those with one employee and no working proprietors. Hence to make valid comparisons between 2011 and 2013, data from 2011 was re-run excluding these establishments, and the data re-weighted. This applies to all 2011 data in this report. Second, a figure on the Eurostat website used to derive the total employer investment in training figure from the survey responses was updated subsequent to the 2011 survey, and the data presented here uses this revised figure. The revision relates to the figure for wages and salaries as a percentage of total labour costs, which is used to upweight wage/salary responses to the full costs of employing labour either being trained or providing training. At the time of the 2011 survey Eurostat was showing this percentage for the UK as 80.51%, but this has subsequently been revised to 85.9%. This lowers the upweight factor and hence lowers the total investment in training figure.

73
Employers in Public Administration (from £3.8bn to £2.2bn) and in Education (from
£6.2bn to £5.3bn in 2013). This is likely to reflect tight budgetary constraints in the
broadly defined public sector in recent years.
Data on total investment in training, spend per person trained and spend per employee
by sector for both 2011 and 2013 can be found in Table A.4.10 of Annex A.
As shown in the Table 4.5, the fall in total training expenditure is also predominantly the
result of lower expenditure on on-the-job training (from £23.6bn in 2011 to £21.6bn in
2013), while off-the-job spending has fallen only slightly since 2011 (£21.3bn from
£21.7bn).
This has led to a slight change in the composition of overall training expenditure. In 2011,
on-the-job training accounted for just over half of overall training expenditure (52 per
cent). In 2013 there was an exactly even split in expenditure between on- and off-the-job
training. The fact that off-the-job training accounts for a larger proportion of total
investment in training in 2013 than in 2011 reflects the increase in the incidence of
employers providing off-the-job training and a fall in the proportion providing on-the-job
training discussed earlier in the chapter.

74
Table 4.5 Total training expenditure broken down by individual components (2011 vs. 2013)
2011 2013
Unweighted Base: 11,027 12,522
£bn % £bn %
Total training expenditure £45.3bn 100 £42.9bn 100
Off-the-job training: total £21.7bn 48 £21.3bn 50
Off-the-job training: Course-related: total
£18.1bn 40 £17.9bn 42
Trainee labour costs £5.1bn 11 £5.2bn 12
Fees to external providers £2.9bn 6 £2.4bn 6
On-site training centre £2.8bn 6 £2.7bn 6
Off-site training centre (in the same company)
£0.6bn 1 £0.5bn 1
Training management £6.1bn 13 £6.5bn 15
Non-training centre equipment and materials
£0.4bn 1 £0.4bn 1
Travel and subsistence £0.4bn 1 £0.4bn 1
Levies minus grants -£0.2bn -1 -£0.2bn -1
Off-the-job training: other (seminars, workshops etc.): total
£3.6bn 8 £3.4bn 8
Trainee labour costs £2.5bn 6 £2.5bn 6
Fees to external providers £1.1bn 2 £0.9bn 2
On-the-job training: Total £23.6bn 52 £21.6bn 50
Trainee labour costs £14.8bn 33 £13.9bn 32
Trainers' labour costs £8.9bn 20 £7.7bn 18
Base: Establishments completing the Investment in Training study
A large component of the overall training expenditure figure presented in the table above
is the wages of staff being trained; indeed this accounts for half (50 per cent) of all
training expenditure (similar to the 49 per cent in 2011). The wages / salaries of those
providing on-the-job training also account for around a fifth (18 per cent) of all training
expenditure. In comparison relatively little is spent on payments to external training
providers (eight per cent of total investment in training, similar to the nine per cent in
2011).
Table 4.6 summarises results by country and by size of establishment.
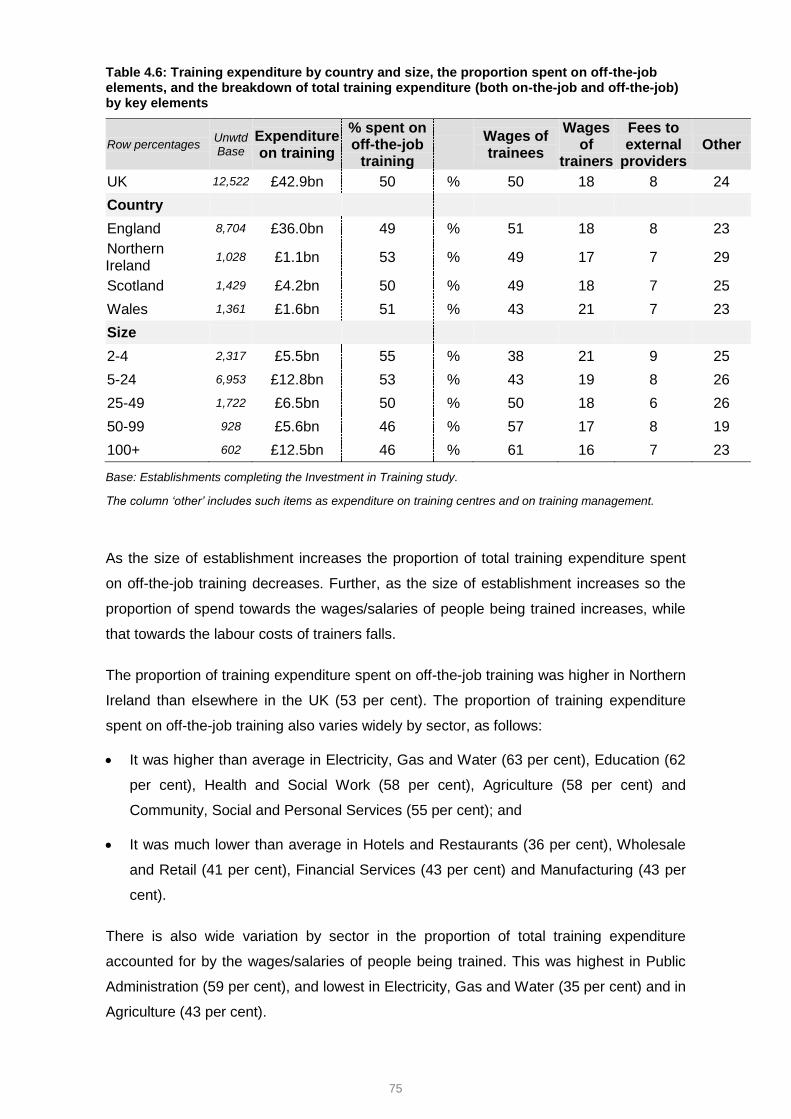
75
Table 4.6: Training expenditure by country and size, the proportion spent on off-the-job elements, and the breakdown of total training expenditure (both on-the-job and off-the-job) by key elements
Row percentages Unwtd Base
Expenditure on training
% spent on off-the-job
training
Wages of trainees
Wages of
trainers
Fees to external
providers Other
UK 12,522 £42.9bn 50 % 50 18 8 24
Country
England 8,704 £36.0bn 49 % 51 18 8 23
Northern Ireland
1,028 £1.1bn 53 % 49 17 7 29
Scotland 1,429 £4.2bn 50 % 49 18 7 25
Wales 1,361 £1.6bn 51 % 43 21 7 23
Size
2-4 2,317 £5.5bn 55 % 38 21 9 25
5-24 6,953 £12.8bn 53 % 43 19 8 26
25-49 1,722 £6.5bn 50 % 50 18 6 26
50-99 928 £5.6bn 46 % 57 17 8 19
100+ 602 £12.5bn 46 % 61 16 7 23
Base: Establishments completing the Investment in Training study.
The column ‘other’ includes such items as expenditure on training centres and on training management.
As the size of establishment increases the proportion of total training expenditure spent
on off-the-job training decreases. Further, as the size of establishment increases so the
proportion of spend towards the wages/salaries of people being trained increases, while
that towards the labour costs of trainers falls.
The proportion of training expenditure spent on off-the-job training was higher in Northern
Ireland than elsewhere in the UK (53 per cent). The proportion of training expenditure
spent on off-the-job training also varies widely by sector, as follows:
It was higher than average in Electricity, Gas and Water (63 per cent), Education (62
per cent), Health and Social Work (58 per cent), Agriculture (58 per cent) and
Community, Social and Personal Services (55 per cent); and
It was much lower than average in Hotels and Restaurants (36 per cent), Wholesale
and Retail (41 per cent), Financial Services (43 per cent) and Manufacturing (43 per
cent).
There is also wide variation by sector in the proportion of total training expenditure
accounted for by the wages/salaries of people being trained. This was highest in Public
Administration (59 per cent), and lowest in Electricity, Gas and Water (35 per cent) and in
Agriculture (43 per cent).

76
Details of total training expenditure by sector and how this breaks down by individual key
elements is shown in Table A.4.11 in Annex A.
The proportion of total training expenditure spent on fees to external training providers
varied relatively little by establishment size, country and sector (see Table 4.6 and Table
A.4.11). A new question for the 2013 survey asked respondents what proportion of their
fees to external providers were paid to FE (Further Education) colleges or to Universities
or other Higher Education institutions. Results suggest that around £0.4bn was spent by
employers in the previous 12 months on fees to FE colleges and HEIs, equivalent to 13
per cent of total fees to external providers. Results differed relatively little by country and
size. By sector, a higher than average proportion of fees to external providers was spent
on FE colleges and HEIs in Manufacturing (17 per cent), Business Services (16 per cent)
and Agriculture (16 per cent).
Details of fees paid to FE colleges or to Universities or other Higher Education institutions
for training is shown in Table A.4.12 in Annex A.
4.11 Conclusions
Although the proportion of employers providing any training to staff over the last 12
months has changed little since 2011, with two-thirds doing so, there have been a
number of quite marked changes in the extent and nature of training provision between
2011 and 2013. In particular:
There has been a marked increase in the proportion of staff trained over the last 12
months;
At the same time there has been a marked fall in the average number of training days
provided to each person trained;
The net effect is a slight fall compared against 2011 in the total number of training
days funded or arranged by UK employers.
There has also been a fall in total training expenditure, driven mainly by a fall in
expenditure:
Among employers in England;
Large employers with 100 or more staff;
Employers in Public Administration and in Education; and
In regard to on-the-job training.

77
These findings appear to support other research which suggests that the recession has
led to employers ‘training smarter’ and ‘doing more for less’, with increased emphasis on
in-house training, training employees as trainers, reduced use of external providers and
enhanced use of e-learning21.
21
Training in Recession: The impact of the 2008-2009 recession on training at work, (UKCES, 2013), for example pages xiv and xv. http://www.ukces.org.uk/assets/ukces/docs/publications/evidence-report-72-training-in-recession.pdf

78
5 Recruitment of Young People
5.1 Summary
Most “recruiting employers” (by which we mean employers who recruited anyone over the
previous two to three years) recruited at least one young person during this time; overall,
44 per cent of all employers recruited a young person in the two to three years preceding
the survey.
Around a quarter of employers (27 per cent) recruited at least one education leaver in
that period. This represents a fall on 2011, when the figure stood at 29 per cent, despite
there having been an increase in recruitment activity since 2011. Around one in five
employers only recruited young people not entering their first job out of education, and
did not recruit any education leavers.
Among employers hiring new staff, the main obstacle to (more) young people getting new
jobs is competition in the labour market. Half of recruiting employers who had not
recruited young job applicants had opted instead for older candidates who were seen to
be better placed; in such cases, young people who applied for these jobs may have been
suitable but the recruiters opted for a candidate over the age of 25 to fill the role. Where
young applicants were not considered to meet the requirements of the role, the main
reasons cited were lack of skills and experience, and sometimes both. Of recruiting
employers who had not recruited a young person, three in five (61 per cent) said they had
not received any applications from young people.
The reasons why some young people were not successful in their job applications
mirrored the reasons why some employers were disappointed with the preparedness of
recruits entering the job market in their first roles since leaving education. Most
employers find the education leavers they take on to be either well or very well prepared
for work, although around 36 per cent of employers taking on school leavers at 16 from
schools in England, Northern Ireland or Wales described the recruits as poorly prepared
(as do three in ten employers in Scotland taking new recruits from Scottish schools
between the ages of 16 and 18). Perceptions of the preparedness of education leavers
are very much in line with those reported in 2011 (see Table A.5.5 in Annex A).

79
5.2 Introduction
Youth unemployment is a major social and economic issue for the UK, and has been on
the increase consistently over the last decade. It is widely considered that young adults
have suffered disproportionately in the labour market as a result of the downturn (The
Youth Employment Challenge, UKCES 2012b).
This report contributes to the understanding of the nature and scale of the youth
unemployment challenge by measuring how many employers recruit young people and
identifying key characteristics of these businesses; exploring how well prepared new
labour market entrants are for the world of work; and investigating what barriers stand in
the way of more employers recruiting young people.
Like its predecessor, UKCESS 2013 explores recruitment of young people into their first
job as they leave education at specific points: at 16, at 17 or 18 (whether from a school or
a Further Education college) and at the end of Higher Education22.
In a new area of investigation, it also looks separately at more general recruitment of
young people (aged under 25) i.e. recruitment of young people for whom the position was
not their first job on leaving school, college or university.
Figure 5.1 summarises recruitment of young people in these two groups across the UK. It
shows that:
Most employers who have recruited in the last two to three years have
recruited at least one young person aged under 25 (70 per cent of recruiting
employers, equating to 44 per cent of all employers)
Most employers who have recruited a young person have recruited at least
one education leaver: 58 per cent of employers who have recruited young
people in the last two to three years have recruited directly from education,
equating to 25 per cent of all employers.
22
Employers in Scotland were asked slightly different questions to those in England, Northern Ireland and Wales. Scottish employers were not asked to distinguish between 16 and 17-18 year old school leavers, but simply asked about employment of school leavers per se. Scottish employers were also asked to focus on their employment of young people in their first jobs on leaving a Scottish educational establishment.

80
While a quarter of establishments hired education-leavers under the age of
25, more employers recruit young people who are not entering their first job
after leaving education (whether this be young people who are going into their
second or third job, or young people who are still in education23): in the last two to
three years a third of employers (32 per cent) recruited young people under the
age of 25 who were not entering their first job after education. Enhanced
competition for jobs means employers are in a position to be able to select from a
wider pool of candidates, including those education-leavers who have secured
additional work experience.
Figure 5.1 Employer recruitment of young people - summary
23
A recent report by the Institute of Public Policy Research (IPPR) based on recent employment figures from ONS has suggested a large decrease in the proportion of young people who are working at the same time as they are studying.
1%
44% 20%
25%Recruited
education
leavers aged
over 25
32%
64% 36%
“Recruiting employers”
Recruited young people
Employers who have recruited anyone in the past two to three years
Recruited, but not
young people
Not recruited
Recruited young
person not from education
Recruited young
person from education
Employers who have recruited anyone under
the age of 25 in the past two to three years
Base: All establishments (91,279)
Base: All establishments (Module 2; 45,644)

81
5.3 Recruitment of education leavers
Just over a quarter of establishments (27 per cent) had recruited someone directly into
their first job after leaving education in the past 2-3 years. The vast majority of these (25
per cent) had recruited an education leaver aged under 25; a further one per cent had
recruited an HEI leaver aged 25 or over24.
By and large, patterns of recruitment of education leavers followed patterns of recruitment
of young people more generally:
Employers in Northern Ireland were less likely to recruit education leavers
compared to elsewhere in the UK (22 per cent in Northern Ireland compared with
27 per cent in England and Wales and 29 per cent in Scotland).
Larger employers were more likely to have recruited education leavers into their
first job than smaller employers. Across all countries, the majority of employers with
25 or more employees have recruited an education leaver over the last two to three
years, rising to over three-quarters of employers with 100 or more employees.
Employers in the Education sector were by far the most likely to have recruited
education leavers into their first job (50 per cent had done so), followed by 35 per
cent in the Hotels and Restaurants. Employers in the Agriculture and the
Construction sectors were by far the least likely (13 per cent and 18 per cent
respectively).
In overall terms these figures represent a decrease in recruitment of education leavers
since 2011, when 29 per cent of employers across the UK said they had recruited an
education leaver in the previous two to three years. The reduction is particularly marked:
in Northern Ireland, which previously recorded levels of recruitment of education
leavers close to the UK average at 28 per cent
among the smallest employers: in 2011, 17 per cent of employers with fewer
than five employees had recruited an education leaver, falling to 13 per cent in
2013. Conversely, the proportion of medium sized and larger employers who
recruited education leavers increased between 2011 to 2013.
within the Agriculture and Construction sectors, where recruitment of
education leavers fell, respectively, from 20 per cent to 13 per cent and from 25
per cent to 18 per cent. (Recruitment of young people fell across all sectors,
although to a less marked extent elsewhere).
24
These two figures (25 per cent and one per cent) combine to create the total figure for recruitment of education leavers of 27 per cent, with the apparent discrepancy being a result of rounding.

82
5.3.1 Recruitment from different stages of education
Young people leave education and enter the job market at a number of different stages
and from different types of institution.
The survey asked employers in England, Northern Ireland and Wales whether they had
recruited people: at age 16 from school, at age 17-18 from school, at age 17-18 from an
FE college or from an HEI (at whatever age).
After initially being asked whether they had taken on education leavers, employers in
Scotland were asked a slightly different set of follow-up questions. They were asked
about school leavers per se (rather than separating out those leaving at 16 from those
leaving at 17 to 18) and they were asked about their recruitment of leavers from Scottish
education institutions specifically. This was to ensure consistency with UKCESS 2011
and the historical Scottish Employer Skills Survey series.
Table 5.1 presents findings for both sets of questions and for employers across the UK,
for 2011 as well as for 2013.
Table 5.1 Incidence of recruitment of education leavers into their first jobs by country (2011 vs. 2013)
England
Northern Ireland
Wales Scotland
2011 2013 2011 2013 2011 2013 2011 2013
Unweighted base 74,156 72,255 3,921 4,014 5,958 5,996 2,487 6,014
% % % % % % % %
Recruited any education leaver
29 27 28 22 28 27 30 29
Recruited any school leaver 16 14 15 11 14 15 17 17
16 year old school leaver 9 8 7 6 9 8 N/A
17-18 year old school leaver 11 11 10 9 10 11
Recruited college leaver 10 12 9 8 11 11 10 11
Recruited HEI leaver 12 14 13 12 12 13 11 12
Base: All establishments
NB: The overall “any education leaver” figure shown here is the proportion who had recruited any education
leaver regardless of location for all countries. The figures broken down by education level differ between the
countries: employers in Scotland were responding to questions about their recruitment of people leaving
Scottish educational establishments, whereas the location of the establishment was not referenced in the
questions to English, Northern Irish or Welsh employers.
Note the 2011 “Recruited any education leaver” figure for Scotland has been updated since this report was
first published (updated July 2014).

83
In England, Northern Ireland and Wales the patterns of recruitment from different phases
of education are very similar: employers are least likely to recruit 16 year olds from
school, and most likely to recruit graduates. Employers in Northern Ireland are less likely
than their counterparts in England and Wales to recruit any of the groups of education
leaver. See Table A.5.1 in Annex A for a breakdown by size and sector.
It is difficult to make firm comparison between employers in Scotland and those in the
rest of the UK because the questions asked were slightly different, but the indications are
that patterns are broadly similar, in particular in respect of recruitment of college and HEI
leavers. See Table A.5.2 in Annex A for a breakdown by size and sector.
In the main, findings in 2013 are very similar to in 2011, with the notable exception of
decreased recruitment of young people from schools in Northern Ireland.
As with recruitment activity in general, the larger the establishment the more likely they
are to recruit an education leaver from each of the groups into their first job. Figure 5.2
shows that across all countries, the majority of employers with more than 100 employees
recruited at least one graduate into their first job on leaving HE.
Figure 5.2 Incidence of recruitment in the last 2-3 years of education leavers into their first jobs by size of establishment
Base: All establishments in England, Northern Ireland and Wales
(91,279) (17,949) (48,387) (10,078) (5,102) (2,674) (1,075)
8%3%
10%
18% 19%24%
30%
10%
3%
14%
27%32%
43%
51%
11%
4%
15%
29%34%
44%
54%
14%
5%
17%
36%
46%
60%
69%
27%
13%
37%
59%
67%
77%81%
Overall 2 to 4 5 to 24 25 to 49 50 to 99 100 to 249 250+
16 year old school leavers
17-18 year old school leavers
17-18 year old FE College leavers
University/HE leavers
Any education leavers
17%
8%
21%
35%
41% 40%
46%
11%
5%
12%
29%
35%
42%
55%
12%
5%
13%
34%
43%
51%
66%
26%
13%
32%
57%
63%
70%
79%
Overall 2 to 4 5 to 24 25 to 49 50 to 99 100 to 249 250+
Scottish School Leavers
Scottish FEC leavers
Scottish University leavers
Any Scottish education leavers
(6,014) (1,109) (3,178) (869) (482) (264) (112)

84
Hotels & Restaurants
Education 15 %
18%
23%
Health and social work 17%
Education 16 %
Hotels & Restaurants 19%
Education 38%
Public admin and defence,
compulsory social security 20%
Financial services
Health and social work 17%
18%
Real estate, renting
and business activities
Wholesale and
retail trade
17%
FOR SALE Real estate, renting
and business activities 9%
Financial services 10%
Agriculture, hunting,
forestry and fishing 8%
Transport storage
and communications 10%
Real estate, renting
and business activities 8%
Financial services 9%
Agriculture, hunting,
forestry and fishing 5%
Construction 6%
Manufacturing 9%
Agriculture, hunting,
forestry and fishing 3%
Construction 4%
FOR SALE
FOR SALE
HIGH LEVELS OF RECRUITMENT LOW LEVELS OF RECRUITMENT
HIGHER EDUCATION INSTITUTIONS
Establishments that recruited from….
FURTHER EDUCATION COLLEGESEstablishments that recruited from….
SCHOOL
Establishments that recruited from….
Base: All establishments
There is considerable variation in rates of recruitment of education leavers across the
different sectors of the economy. Full detail is shown in Table A.5.3 in Annex A; Table 5.2
below picks out some of the most marked differences and patterns.
Table 5.2 Sector patterns of recruitment of education leavers

85
Education employers have a high propensity to recruit education leavers at all levels;
employers in Hotels and Restaurants are frequent recruiters of education leavers from
schools or colleges; and employers in the Health and Social Work sector are frequent
recruiters of college leavers and of graduates.
It is rare for employers in the Agriculture sector to recruit education leavers at any level;
Construction employers are highly unlikely to recruit graduates or college leavers.
Financial Services employers and those in Business Services rarely recruit from school or
college but are among the most likely to recruit graduates.
5.4 Perceived work readiness of education leavers
It is often argued that the UK’s education system does not do enough to prepare young
people for the world of work. UKCESS 2013 asked employers directly how well prepared
for work they had found the young people they had recruited from education. In line with
2011 findings, the majority of employers found the majority of education leavers at each
educational stage to be well prepared.
In England, Northern Ireland and Wales, 59 per cent of employers felt 16 year old school
leavers they had recruited were very well or well prepared. Two-thirds (66 per cent) of
employers felt that 17-18 year olds recruited from school were well / very well prepared
and three-quarters (74 per cent) agreed that new recruits from FE colleges employed into
their first jobs were very well or well prepared. The highest level was found among those
taking on HE graduates where 83 per cent said their recruits were well / very well
prepared. For Scottish employers who recruited education leavers a similar pattern
emerges, with 65 per cent considering Scottish secondary school leavers to be prepared,
rising to 78 per cent amongst those employing recruits from FE colleges and to 85 per
cent for recruiters of Scottish HE graduates. Further detail is included in Tables A.5.4 and
A.5.4(i) in Annex A.
These figures are consistent with the 2011 Employer Skills Survey and reflect that
employers generally consider investment in education to pay off in delivering new recruits
who are increasingly prepared for the world of work the further they have pursued
education (see Table A.5.5 in Annex A).

86
Figure 5.3 Work-readiness of those recruited straight from education
In 2011 there was a clear pattern whereby smaller establishments were less likely to find
education leavers at each level to be well prepared than larger establishments. Although
less marked, this pattern persisted in 2013 in respect of HE leavers (75 per cent of
employers with 2-4 employees said their recruits from HE were well or very well prepared
but this figure rose to 86 per cent amongst employers with more than 250 staff).
However, it was not replicated amongst school leavers where there was little difference in
perceptions of preparedness by size band.
As detailed in Tables A.5.5(i) and A.5.5(ii) in Annex A, there were also some patterns
evident by sector including amongst establishments in England, Wales and Northern
Ireland in the proportions considering new recruits to be well prepared for work:
Amongst employers who had recruited 16 year old school leavers, those in
Wholesale and Retail and Agriculture were more likely to feel they were prepared
well (63 per cent and 67 per cent respectively), with those in Financial Services
(53 per cent) and Manufacturing (54 per cent) the least likely compared to the UK
average (59 per cent);
14%
19%
18%
18%
3%
4%
2%
4%
66%
60%
63%
61%
12%
13%
12%
13%
Scotland
Wales
NI
England
25%
33%
34%
28%
4%
8%
6%
7%
55%
47%
45%
48%
10%
8%
10%
11%
25%
26%
24%
5%
5%
5%
54%
57%
56%
11%
8%
10%
8%
12%
10%
11%
2%
1%
2%
62%
57%
63%
60%
23%
25%
23%
24%
16 year-
old
school
leavers
17-18
year-
old
school
leavers
17-18
year-old
FE
leavers
University
/HE
leavers
England
NI
Wales
Scotland all
school leavers
England
NI
Wales
England
NI
Wales
Scotland
(509)
(13,031)
(931)
(1,514)
(14,039)
(483)
(913)
(1,095)
(1,258)
(722)
(1,080)
(17,770)
Base: All establishments that have recruited each type of education leaver in the previous 2-3 years
(9,117)
(313)
(630)

87
Wholesale and Retail and Education employers were highly likely to feel 17-18
school leavers were well prepared (both 71 per cent) whilst sectors where
employers were less likely to report this included Manufacturing (59 per cent) and
Electricity, Gas and Water (58 per cent) than the economy average (66 per cent);
Among establishments taking on 17-18 year old FE College leavers, those in
Wholesale and Retail (78 per cent) and Education (78 per cent) were the most
likely to consider their recruits well prepared. Fewer employers in Transport and
Communications (64 per cent) and Electricity, Gas and Water (62 per cent) felt
new recruits were well prepared compared to the all-sector average (74 per cent);
In terms of the graduate recruitment market, Education employers (again) were
most likely to describe graduate recruits (91 per cent) as well prepared. Public
Administration employers also reported higher figures (88 per cent) than average
(83 per cent). Those in Business Services and Transport and Communications
were the least likely to consider their HE recruits as well prepared (79 and 75 per
cent).

88
5.5 Skills and attributes lacking in education leavers
Where establishments had signalled that their new recruits were poorly prepared for
work, employers were asked to indicate what specific skills or attributes their education
leavers were lacking. Findings are summarised for all nations in Table 5.3.
Table 5.3 Skills and attributes lacking in education leavers
Row percentages Unwtd base
Lack o
f w
ork
ing
wo
rld
, life
exp
eri
en
ce
or
matu
rity
Po
or
att
itu
de, p
ers
on
ality
or
lack o
f m
oti
vati
on
Lack o
f re
qu
ired
skil
ls o
r
co
mp
ete
ncie
s
Lack o
f co
mm
on
sen
se
Lit
era
cy/n
um
era
cy s
kills
Po
or
ed
ucati
on
al
att
ain
men
t
UK
School Leavers 19,597 % 22 18 10 5 4 3
FE College Leavers 16,530 % 13 10 7 3 2 1
University/HE Leavers 19,028 % 7 4 5 2 1 1
England
School Leavers 16,301 % 22 18 10 6 4 3
FE College Leavers 14,039 % 14 11 7 3 2 1
University/HE Leavers 15,968 % 8 5 5 2 1 1
Northern Ireland
School Leavers 608 % 22 16 14 6 3 2
FE College Leavers 483 % 13 9 7 2 2 1
University/HE Leavers 722 % 6 4 5 1 1 1
Wales
School Leavers 1,174 % 23 20 11 5 4 3
FE College Leavers 913 % 13 11 9 3 3 1
University/HE Leavers 1,080 % 10 7 5 2 * *
Scotland
School Leavers 1,514 % 21 14 9 2 3 1
FE College Leavers 1,095 % 9 7 9 4 1 1
University/HE Leavers 1,258 % 6 3 4 * * *
Base: Establishments who had recruited each type of education leaver
‘*’ denotes a figure larger than zero but smaller than 0.5%

89
The most commonly cited reason for education leavers of all types being poorly prepared
for work was that the new recruits lacked experience of the working world or experience
of life in general. This was mentioned in higher proportions amongst those recruiting
younger leavers (22 per cent of establishments who recruited school leavers) than older
cohorts (seven per cent for those recruiting HE leavers). In England, Northern Ireland and
Wales a distinction was made between 17-18 year old school leavers and FE College
leavers; lack of experience of the working world and life in general was notably more
likely to be cited by those recruiting school leavers of this age (18 per cent) compared to
those taking on their counterparts from FE (14 per cent).
The second most common area employers highlighted when they described education
leavers as poorly prepared was a lack of motivation and/or a poor attitude to work in
general. This was the case for almost one in five employers who had recruited a school
leaver (18 per cent) and for one in ten establishments who had recruited an FE College
leaver; lack of motivation or poor attitude among HE graduates was reported among just
five per cent of recruiting establishments.
Just under one in ten establishments who had recruited a school or college leaver of any
age perceived their new recruits to lack the required skills or technical competencies
necessary for the job. Only five per cent of those taking on HE graduates felt this way.
5.6 Recruitment of young people
Overall, 44 per cent of employers across the UK had recruited a young person under the
age of 25 in the two to three years prior to their interview.
Employers in England, Scotland and Wales were equally likely to have recruited young
people (45 per cent, 46 per cent and 45 per cent respectively); employers in Northern
Ireland were considerably less likely to have done so (35 per cent). This pattern of lower
rates of recruitment of young people in Northern Ireland than in the rest of the UK is in
line with that reported in UKCEPS 2012 which measured recruitment of young people
between Spring 2011 and Spring 2012.
As one would expect, there is considerable variance by size of employer. A quarter of
establishments with 2-4 employees (25 per cent) taking on staff have recruited a young
person in the past 2 to 3 years, compared to 94 per cent of establishments with 250 or
more employees. This reflects not only that larger employers are more likely to recruit,
but also that they recruit in greater numbers (with an enhanced likelihood that some of
their recruits are young people).

90
Rates of recruitment of young people vary considerably between sectors. On one hand,
three in five establishments in the Education sector (62 per cent) and a similar proportion
in the Hotels and Restaurants sector (59 per cent) had recruited a young person over the
last 2 to 3 years. On the other hand, a minority of employers in the Agriculture and
Construction sectors had recruited a young person in that time (23 per cent and 30 per
cent respectively)
5.7 Barriers to recruiting young people
In a new question area developed for the 2013 survey, the 30 per cent of employers who
recruited over the last two to three years but who had not taken on a young person
(equivalent to 19 per cent of all employers) were asked why they had not done so. They
were first asked whether it was because they had not received applications from young
people or because they had made a choice not to recruit young applicants. In the latter
case, employers were asked if this was simply a case of competition for jobs or if the
young applicants exhibited shortcomings which stopped them being recruited. Figure 5.4
represents their responses.
Figure 5.4 Reasons why some recruiting employers do not recruit young people
No candidates
under 25
61%
29% had
young
applicants
Base: All recruiting employers who described young
applicants as not meeting requirements (987)

91
In the majority of cases, no young people had been taken on for the simple reason that
none had applied. Almost two-thirds of recruiting employers (61 per cent) who had not
recruited young people reported this to be the case. This figure was higher in England
and Northern Ireland (both 62 per cent) than in Scotland (58 per cent) and Wales (55 per
cent).
Where employers had not taken on any young people who had applied, there were two
main explanations. Most commonly, it was a case of competition with other (presumably
older, more experienced) applicants being preferred over young applicant(s) who had the
required skills and experience to do the job: 53 per cent of establishments who had not
recruited any of their young applicants explained their choices in this way. A further small
group of employers (seven per cent of those receiving, but not taking on any young
applicants) said that the applications were speculative and that there were no vacant
posts for the young person to take at the time they applied. In a very small proportion of
cases (two per cent of employers who had not taken on young applicants) it was in fact
the young person who had turned down the offer of the job, rather than the employer
turning them down.
A large minority of employers (46 per cent) who had not taken on a young applicant(s)
said that this was because the young applicant(s) did not meet their requirements.
Employers in Scotland were less likely to state this (38 per cent) than those in England
(47 per cent) and Wales (45 per cent), although it was in Northern Ireland that this view
was most commonly expressed (51 per cent). Employers in Transport and
Communications (62 per cent) were particularly likely to have had this experience
compared to the economy-wide average (46 per cent).
Where employers considered young applicants not to meet requirements, the majority (63
per cent) said they lacked the necessary skills and 61 per cent relevant work experience.
Nearly a quarter (24 per cent) said they lacked both.
Employers in Northern Ireland who reported that young applicants did not meet
requirements were particularly likely to question their skills levels: 75 per cent said that
they lacked the necessary skills. A lack of work experience was particularly likely to be
given as a reason for failing to employ young people by employers in the Health and
Social Work, Financial Services and Transport and Communication sectors (71 per cent,
70 per cent and 72 per cent respectively).

92
Other less frequently mentioned reasons for not employing a young person included
where the employers felt that candidates lacked a professional or hardworking attitude or
the motivation that they typically look for (this was the case for 38 per cent of
establishments where young applicants did not meet the employer’s requirements). A
third of employers (33 per cent) felt that the young person had not communicated their
employability well enough either through their CV, covering letter, application form or at
interview. Finally, slightly lower proportions (29 per cent) said the candidates lacked the
necessary qualifications they look for in a suitable employee.
5.8 Skills deficiencies and training among employers who recruit young people
In this final section of the chapter we look briefly at the extent to which employers who
recruit young people experience skills deficiencies and at the extent of their workforce
development activity.
Table 5.4 highlights differences between employers who have recruited young people,
those who have recruited education leavers, and recruiting employers who have not
recruited a young person in terms of some of the key UKCESS measures: the prevalence
of vacancies and skills gaps, and the extent of training activity.
Table 5.4 Skills deficiencies and training activity among employers who recruit young people and education leavers
Recruited a Young Person
Recruited school leaver
Recruited FEC leaver
Recruited HE leaver
Recruited but not a Young Person
% % % % %
Unweighted base 27,067 19,597 16,530 19,028 7,867
Have vacancies 24 28 31 34 14
Have skill-shortage vacancies
7 8 9 10 4
Skill-shortage vacancies as % of all vacancies
22 21 21 21 25
Skill-shortage vacancies as % of all hard-to-fill vacancies
78 78 80 82 76
Have skill gaps 27 34 33 31 14
Skills gap density 6 7 7 6 4
Train at all 81 85 87 88 74
% of staff trained 65 68 71 71 55
Base: Establishments who had recruited each type of individual(s)

93
This analysis evidences some quite substantial differences between employers who had
recruited young people, including education leavers, and recruiting employers who had
not recruited from these groups.
Employers who had recruited young people and/or education leavers over the past two to
three years were around twice as likely to have vacancies, hard-to-fill vacancies and skill-
shortage vacancies as recruiting employers who didn’t recruit from these groups. This
suggests that they continue to have a greater demand for (new) labour.
It was not the case, however, that a larger proportion of their vacancies were proving to
be hard-to-fill, or indeed that a greater proportion of their hard-to-fill vacancies were skill-
shortage vacancies. So although they have a greater demand for (new) labour, they do
not appear to be more challenged in the labour market.
Employers who had recruited young people and/or education leavers over the past two to
three years were considerably more likely to have staff who were not fully proficient than
other recruiting employers, and a larger proportion of their workforce lacked proficiency.
They were also much more likely to fund or arrange training for their staff than those that
had not, and they funded and arranged training for a larger proportion of their workforce.
5.9 Conclusions
Although there has been an increase in recruitment activity since the 2011 survey, and
although most recruiting employers have recruited at least one young person over the
last two to three years, there has been a fall in the proportion of employers recruiting
young people from education.
Around a quarter of employers recruited at least one education leaver in that period (27
per cent, down from 29 per cent in 2011). Most of them found these recruits to be well or
very well prepared for work, although as many as four in ten employers taking on school
leavers at 16 from schools in England, Northern Ireland or Wales described the recruits
as poorly prepared (as do three in ten employers in Scotland taking new recruits from
Scottish schools between the ages of 16 and 18).
The main obstacle to (more) young people getting new jobs is competition in the market
place rather than perceptions that young applicants do not have the capability to perform
in the job role. Where it was felt a young applicant did not meet requirements for the role,
the main reasons cited were a lack of skills and experience, and sometimes both. Three
in five recruiting employers (61 per cent) who had not recruited a young person said they
had had no applications from young people.

94
Employers who had recruited young people and/or education leavers over the past two to
three years appeared to have a greater demand for (new) labour than other employers,
being around twice as likely to have vacancies. It was not the case, however, that a larger
proportion of their vacancies were proving to be hard-to-fill, or indeed that a greater
proportion of their hard-to-fill vacancies were skill-shortage vacancies. So although they
have a greater demand for (new) labour, they do not appear to be more challenged in the
labour market.
They are more challenged by skills in their existing workforce: they are more likely to
have staff who were not fully proficient than other recruiting employers, and a larger
proportion of their workforce lack proficiency. They are also more likely to train, and they
fund and arrange training for a larger proportion of their workforce.
This raises a number of questions including:
Whether these employers train more because they need to as a reflection of the
make-up of their workforce (for example the very fact that they have taken on
young people who need training); or whether their confidence in their training
structures makes the recruitment of young people / education leavers a less risky
choice for them;
Whether they train more because they have more skills gaps or whether they
recognise more skills gaps because they train more, and more assiduously;
Whether these employers take on young people because that is the only way for
them to satisfy their demand for labour, or whether their choice to recruit young
people is a more positive one that reflects the nature of their business operations
and the way in which they pursue them.
Further investigation will be required in order to develop answers to these questions.

95
6 High performance Working Practices and Product Market Strategies
6.1 Chapter Summary
High Performance Working (HPW) is defined by the UK Commission as ‘a general
approach to managing organisations that aims to stimulate more effective employee
involvement and commitment in order to achieve high levels of performance’ (UKCES
2009).
The survey identifies a minority of employers – 12 per cent – who are “High
Performance Working employers” in the sense that they adopt a number of specific
work practices.
Such employers are considerably more active in the recruitment market than average:
twice as many have a vacancy as non-HPW employers (29 per cent compared to 13 per
cent). The evidence suggests that they find it easier to fill the vacancies they have than
non-HPW employers do: under a quarter of HPW employers’ vacancies were proving
hard-to-fill (22 per cent) compared to a third among non-HPW employers. Similarly a
smaller proportion of HPW employers’ vacancies are skill-shortage vacancies (19 per
cent, compared to 25 per cent among non-HPW employers).
HPW employers are also considerably more likely to experience skill gaps than non-HPW
employers (23 per cent compared to 14 per cent), although the proportion of their
workforce that lacks proficiency is in line with the national average (five per cent).
HPW employers are more likely to train and to train a higher proportion of their workforce.
Product Market Strategies (PMS) are defined within UKCESS 2013 by aggregating
responses to a series of questions exploring pricing strategies, approaches to innovation
and the nature of the product market (the extent to which the market attracts a “premium”
and the extent of customisation of products and services in the market).
Aggregating these responses classifies two in five private sector employers in the UK as
having a high or very high product market strategy indicating that their competitive
success is not dependent on price, they pursue innovation, they compete on quality
and/or that they offer customised goods or services.

96
The higher an employer’s composite PMS score, the more likely it is that they will have a
vacancy, hard-to-fill vacancy or skill-shortage vacancy. On the other hand, recruitment
difficulties are broadly more pronounced among employers with a lower composite score
than among those with a higher PMS score, in the sense that a greater proportion of their
vacancies are hard-to-fill.
Similarly, employers with a high composite PMS score are more likely to identify skill
gaps than employers with a low score, but the proportion of their workforce that lacks
proficiency is no higher.
And in similar vein, employers with a higher composite PMS score are more likely to fund
or arrange training for their staff.
6.2 Introduction
In previous chapters, this report has looked at employers’ practice in funding and
arranging training and at their experience of skills deficiencies (both skill shortages in the
available labour market and gaps between the skills employers require and those which
their employees currently possess), considering how these challenges affect employers
in different parts of the UK, of different sizes and in different business sectors differently.
There are of course other ways of grouping employers to understand commonalities and
differences between them; and in this chapter we use two categorisations based on
combinations of responses to a number of survey questions to try to better understand
what might underlie or influence employers’ experiences of skill shortages and what
drives them to fund and arrange training for their employees. These two categorisations
are:
Whether or not the employers are High Performance Working (HPW) employers
The Product Market Strategies (PMS) that employers adopt
6.3 High Performance Working
High Performance Working (HPW) is defined by the UK Commission as ‘a general
approach to managing organisations that aims to stimulate more effective employee
involvement and commitment in order to achieve high levels of performance’ (UKCES,
2009). There exists a considerable body of evidence showing that wider adoption of HPW
practices can deliver improved business productivity and enhanced competitiveness;
reflecting this evidence, the wider adoption of HPW practices has been encouraged by
government and by labour market and business theorists as a means of augmenting
economic growth (Stone et al., 2012).

97
UKCESS 2013 included a series of questions relating to a set of recognised HPW
practices. These practices are illustrated in Figure 6.1 which shows the proportion of
employers who adopt each practice (the bar chart on the left hand side of the graphic)
and then the distribution of employers in terms of the total number of HPW practices they
adopt (the area chart on the right hand side). This shows that 12 per cent of employers
adopt 14 of the 21 High Performance Working practices that the survey covered;
employers adopting 14 or above practices are classified here as Higher Performance
Working employers (HPW employers).
Figure 6.1 Employer adoption of High Performance Working Practices
As one might expect there are considerable differences in the proportions of employers
adopting each practice, and in the total number of HPW practices that different types of
employers adopt. The key features are that:
larger employers are more likely to be HPW organisations than smaller
employers, although most HPW employers are nonetheless small. This is a function
of the overall profile of employers, which is overwhelmingly geared towards smaller
establishments. Around seven in ten HPW employers have 25 or fewer employees;
there is considerable variation by sector: as many as 36 per cent of employers in the
Public Administration, Education and Financial Services sectors are HPW employers,
compared to one in 50 in Agriculture and one in 25 in Construction.
11%
12%
12%
14%
14%
17%
29%
30%
31%
35%
39%
44%
44%
48%
51%
53%
63%
63%
67%
85%
85%
0% 20% 40% 60% 80% 100%
Creates teams to work on projects
Trade union consultation (non payrelated)
Employee consultation
Holds ISO9000
Processes to identify high potential /talented individuals
IIP
Flexible benefits
Training budget
Individual performance related pay
Awards performance related bonuses
Flexible working
Training plan
Formally assess performance aftertraining
Task discretion
Training needs assessments
Task variety
Annual performance review
Business plan
On or off job training
Equal opportunity policy
Work shadowing/stretching/supervision
0%
10%
20%
30%
40%
50%
60%
70%
80%
90%
100%
0 1 2 3 4 5 6 7 8 9 10 11 12 13 14 15 16 17 18 19 20 21
Base: All establishments (Module 1; 45,635)
Overall
12% of employers
are HPW
employers(defined as “having”
14 of 21 HPW
measures in place)

98
6.3.1 The relationship between HPW and skills shortages
It was reported in chapter two that 15 per cent of all establishments had at least one
vacancy at the time of their interview (in Spring-Summer 2013). HPW employers are
considerably more active in the recruitment market than average, with around twice as
many of them having a vacancy (29 per cent) compared to non-HPW employers (13 per
cent). In line with this greater propensity to recruit, HPW employers were also around
twice as likely as non-HPW employers to have at least one hard-to-fill vacancy and at
least one skill-shortage vacancy.
However, although HPW employers are more likely to experience at least one hard-to-fill
and/or skill-shortage vacancy, in volume terms the evidence suggests that they actually
find it easier to fill their vacancies. Under a quarter of all vacancies (22 per cent) reported
by HPW employers were proving hard-to-fill, compared to a third (33 per cent) among
non-HPW employers. Similarly, a smaller proportion of HPW employers’ vacancies are
considered skill-shortage vacancies (19 per cent, compared to 25 per cent among non-
HPW employers).
These quite marked differences do not appear to be a function of differences between
HPW and non-HPW employers in terms of their size (i.e. the fact that HPW employers
tend to be larger, on average, than non-HPW employers). Among employers with fewer
than 100 employees in particular, HPW employers are more likely to report vacancies,
hard-to-fill vacancies and skill-shortage vacancies than their non-HPW counterparts, and
– contrary to the overall trend - a higher proportion of their hard-to-fill vacancies are skill-
shortage vacancies (see Figure 6.2). The patterns are less clear among larger
employers. These data are also displayed in Table A.6.1 in Annex A.

99
Figure 6.2 Incidence and density of vacancies, hard-to-fill vacancies and skill-shortage vacancies by HPW classification and size
6.3.2 The relationship between HPW and skills gaps
HPW employers are also considerably more likely than other employers to experience
skills gaps, although the same proportion of the workforce lacks proficiency across both
types of employer (see Table 6.1). This could reflect that HPW employers are – by
definition – more likely to engage in activities that are likely to leave them better placed to
identify skill gaps (e.g. annual performance reviews, training needs assessments,
formally assessing performance after training).
Table 6.1 Incidence, volume and density of skills gaps by HPW classification
HPW employers Non-HPW employers
Unweighted Base 8,105 37,530
% %
% of establishments with a skills gap
23 14
% of workforce with skills gaps 5 5
Base: All establishments in Module 1 by HPW classification.
Number of skills gaps rounded to nearest 100.
‘Percentage of workforce with skills gaps’ is shown as a proportion of all employment
15%
23%
37%
48%
61% 61%
6% 7%10%
14%
19% 21%
5%6%
8% 11%
16%
19%
0%
10%
20%
30%
40%
50%
60%
70%
80%
90%
100%
2 to 4 5 to 24 25 to 49 50 to 99 100 to 249 250+
Have vacancies Have HtFVs
Have SSVs HtFVs as % of Vacs
SSVs as % of htfvs
HPW employers
8%
15%
30%
39%
57%
70%
3%5%
9% 10%
18% 18%
2%4%
7% 8%
15%16%
0%
10%
20%
30%
40%
50%
60%
70%
80%
90%
100%
2 to 4 5 to 24 25 to 49 50 to 99 100 to 249 250+
Have vacancies Have HtFVs
Have SSVs HtFVs as % of Vacs
SSVs as % of htfvs
Non-HPW employers
Base: All establishments by HPW classification and size (Module 1)
Base: (4,026)(426) (721)(1,003) (392) (21,835)(9,100) (745)(1,779) (206)(1,537) (3,865)

100
It is very clear that this heightened experience of skill gaps is not a function of
establishment size. The gap between HPW employers’ experience of skill gaps and
non-HPW employers’ experience of skill gaps is consistent within all size bands; and
across all size bands HPW employers and non-HPW employers report a similar
proportion of their staff as lacking proficiency (see Table A.6.2 in Annex A).
6.3.3 The relationship between HPW and training
As previously shown in Figure 6.1, funding or arranging training is defined within this
survey as a high performance working practice. It is unsurprising, therefore, that HPW
employers are more likely to train than non-HPW employers (97 per cent do so,
compared to 62 per cent of non-HPW employers). On average, HPW employers also
train a much higher proportion of their workforce (75 per cent, compared to 56 per cent of
non-HPW employers).
Again, these differences between HPW employers and non-HPW employers persist if
one “controls” for other characteristics. For example, within different size bands HPW
employers are more likely to train their employees and to train more of them; the story is
the same in different sectors (see Table A.6.3 in Annex A).
6.4 Product market strategies
Product market strategies (PMS) describe the ways in which organisations choose to
differentiate and position the products and services they provide within the markets in
which they operate. It is thought that employers operating ‘higher’ product market
strategies offer greater opportunity for sustainable business growth which should, in turn,
place a greater demand on skills (see for example High Performance Working in the
Employer Skills Surveys, UKCES 2013). The inter-relationship between PMS and
workforce skills is a theme of key policy interest for government as the availability of
workforce skills may have a bearing on the strategies that firms are able to pursue (and
on their medium and long-term success).
Within the survey, private sector employers were asked to rate their establishments on
a five-point scale, compared to other establishments in the same industries, in terms of:
the extent to which their competitive success depends on price;
the extent to which the establishment tends to lead the way in their industry in terms
of the development of new products, materials or techniques;
the extent to which the establishment competes in a ‘premium quality’ or ‘standard or
basic quality’ product market; and

101
the extent to which they offer goods or services with a substantial amount of
customisation according to customer requirements.25
Figure 6.3 illustrates the overall responses to each of these individual product market
‘position statements’ in both 2013 (the broader bars) and in 2011 (the thinner bars),
including the score attributed to each response.
Figure 6.3 Product Market Strategy positions
Employers’ responses to the first two product market ‘position statements’ – relating to
price dependency and innovation – distributed more or less normatively across the five
points of the scale as they did in 2011 (i.e. in both years, roughly equal numbers of
employers said they rarely led the way as said they always did, and roughly equal
numbers said their products / services were wholly price dependent as said they were not
at all price dependent).
A larger proportion of employers described their offer as at the premium quality end of the
scale than described their offer as “standard” or “basic” in quality. Again, responses very
closely mirrored those recorded in 2011.
25
Responses to the “no difference – substantial customisation” position statement were recorded on a 3 point scale in UKCESS 2011 and was switched to a 5 point scale in UKCESS 2013 in order to align it with the other ‘position statement’ questions.
11%
6%
21%
16%
7%
6%
13%
14%
24%
25%
26%
37%
22%
26%
17%
15%
29%
33%
18%
13%
1 2 3 4 5
Wholly price
dependent
Rarely leads the
way
Standard or
basic quality
No difference in
product/service
offering
Not at all price
dependent
Often leads the
way
Premium
quality
Substantial
customisation
32%
7%
18%
16%
6%
12%
15%
29%
25%
27%
38%
26%
18%
16%
34%
33%
20%
12%
Base: All establishments in the private sector (2013: 75,997; 2011: 70,761)
20
13
20
11
20
13
20
11
20
13
20
11
20
13
20
11

102
Similarly, a greater proportion of employers described their product / service offering as
allowing customisation than said it was standardised. Here things look different than they
did in 2011. In part this is due to the question having previously been asked in a different
way (in 2011, employers described the degree of customisation in their offer against a
prompted three-point scale). An impact of this different scale appears to have been that a
greater proportion of employers describe a degree of customisation in their offer than was
previously the case.
6.4.1 Deriving a composite Product Market Index
In order to discern the overall Product Market Strategies of different establishments, the
responses to the four product market ‘position statements’ were aggregated to derive a
composite PMS ‘score’. These composite scores were then converted to a fivefold
classification ranging from ‘very low’ to ‘very high’, as detailed in Table 6.2. A high
composite score indicates that the employer tends to lead the way in innovation in its
sector, tends not to compete on price and/or tends to offer a premium and/or highly
customised product or service. A low composite score indicates that the employer tends
not to do any of these things.
Table 6.2 Overall composite Product Market Strategy scores
Aggregate PMS score % of private sector UK establishments
% of private sector UK employment
1 to 7 Very low 4 2
8 to 10 Low 14 7
11 to 13 Medium 26 17
14 to 16 High 29 23
17 to 20 Very high 15 15
Base: All establishments in the private sector (75,997).
Overall, a greater proportion of establishments are classified as having a high PMS score
than a low one with approaching a fifth of establishments (18 per cent) categorised as
having a ‘low’ or ‘very low’ product strategy compared to almost a half (44 per cent)
categorised as having a ‘high’ or ‘very high’ product strategy.
It should be noted that due to the different ways in which the PMS questions were asked
in 2011, the potential for accurate time series comparisons by PMS score is limited and
has not been presented in this report.

103
6.4.2 Profiling higher and lower composite PMS score employers
Employers with a higher composite PMS score tend to be larger, on average, than those
with a lower composite PMS score, although the differences are marginal, reflecting that
the overwhelming majority of all establishments are small establishments with fewer than
25 employees (see Table 6.3). When one is talking about employers with a high
composite PMS rating, one is predominately talking about smaller establishments and if
we pick up on differences between PMS groupings, it is unlikely that these will be driven
(solely) by size.
Table 6.3 Overall composite Product Market Strategy scores by size
Very Low Low Medium High Very High
Unweighted Base: 2,818 9,507 19,333 23,106 12,729
% % % % %
Size
2-4 68 61 55 50 47
5-24 28 34 37 40 41
25-49 2 3 4 6 7
50-99 1 1 2 3 3
100-249 * 1 1 2 2
250+ * * * 1 1
Base: All establishments in the private sector (75,997).
‘*’ denotes a figure larger than zero but smaller than 0.5.
Table A.6.4 in Annex A provides further detail on the characteristics of employers in each
PMS category in terms of country and sector. In short:
Establishments with a ‘very high’ PMS score are disproportionately likely to operate in
the Business Services and Wholesale and Retail services sectors (combined, these
two sectors account for 46 per cent of all ‘very high’ PMS employers, compared to 41
per cent of all establishments).
At the other end of the scale, employers with a ‘very low’ PMS score are
disproportionately likely to be based in Wales (nine per cent, compared to five per
cent of all establishments) and to be engaged in Agriculture (16 per cent compared to
five per cent) or Construction (15 per cent compared to nine per cent).

104
6.4.3 Relationship between PMS and skills shortages
As discussed in chapter two, 15 per cent of all establishments have at least one vacancy,
a figure that falls to 14 per cent if one considers only those operating in the private
sphere. When differentiating these establishments based on their product market
strategies it is clear that employers with a higher PMS score are more active in the
recruitment market: 19 per cent of those with a very high score had a vacancy at the time
of interview, compared with only eight per cent of establishments with a ‘very low’ score.
In line with this, establishments at the higher end of the PMS scale were also more likely
to report both hard-to-fill vacancies and skill-shortage vacancies compared to those at the
lower end of the scale (see Figure 6.4).
Figure 6.4 Incidence of vacancies, hard-to-fill vacancies and skill-shortage vacancies by Product Market Strategy classification
8%
10%
12%
16%
19%
3%
4%
5%
6%
7%
2%
3%
4%
5%
6%
Very low PMS Low PMS Medium PMS High PMS Very high PMS
Vacancies Hard-to-filll vacancies Skill shortage vacancies
Base:
Base: All establishments in the private sector , in each PMS group
(2,818) (9,507) (19,333) (23,106) (12,729)

105
However, if one focuses on the proportion of all vacancies which are hard-to-fill and the
proportion of hard-to-fill vacancies where skill shortages were reported, a different picture
emerges. Recruitment difficulties are broadly more pronounced among employers with a
lower composite PMS score than among those with a higher PMS score, in the sense
that a greater proportion of their vacancies are hard-to-fill – although the relationship is
not linear. On the other hand, the role that skill shortages play in this difficulty is slightly
more marked among employers with a high composite PMS score – where a greater
proportion of hard-to-fill vacancies are attributed to a lack of skills among job applicants
(see Figure 6.5).
Figure 6.5 Proportion of all vacancies that were hard-to-fill and that were skill-shortage vacancies by Product Market Strategy classification
There are notable differences in the types of occupations where employers experience
hard-to-fill and skill-shortage vacancies depending on their product market strategies. As
detailed in Table A.6.5 and Table A.6.6 in Annex A, employers at the lower end of the
PMS index experience greater difficulty in recruiting among the Skilled Trades, Sales and
Customer Service and Machine Operatives occupations. On the other hand, employers at
the higher end of the PMS index experience most difficulty in recruiting Professionals and
Associate Professionals.
50%
28%
38%
30% 31%
0%
10%
20%
30%
40%
50%
60%
70%
80%
90%
Very low PMS Low PMS Medium PMS High PMS Very high PMS
Proportion of vacancies that arehard-to-fill
Skill-shortage vacancies as aproportion of hard-to-fill vacancies
Base:
Base: All establishments in each PMS group with vacancies
(261) (1,299) (3,393) (5,126) (3,194)

106
6.4.4 The relationship between PMS and skills gaps
It was detailed in chapter three that 15 per cent of all employers identify at least some
skills gaps amongst their employees: this figure was consistent across both public and
private sector establishments. This section examines the incidence and prevalence of
skills gaps among private sector establishments with differing Product Market Strategies.
As detailed in Table 6.4, the relationship between an establishment’s product market
positioning and the incidence of skills gaps is not entirely linear, though employers at the
higher end of the PMS index are more likely to have skills gaps among their staff than
those at the lower end. However, the proportion of the workforce that is affected by skills
gaps is fairly consistent across the differing categories of the PMS index. It does appear
likely that the differing size profiles of employers with a high composite PMS score and
those with a low composite PMS score drives this difference (see Table A.6.7 in Annex
A).
Table 6.4 Incidence, volume and density of skills gaps by Product Market Strategy classification
Very low Low Medium High
Very high
Unweighted Base 2,818 9,507 19,333 23,106 12,729
% % % % %
% of establishments with a skills gap
12 14 16 17 16
% of workforce with skills gaps
5 7 6 6 5
Base: All private sector establishments in each PMS classification.
Number of skills gaps rounded to nearest 100.
‘Percentage of workforce with skills gaps’ is shown as a proportion of all private sector employment
When considering the causes of skills gaps, there is a clear trend for establishments with
a higher product market positioning to attribute their skills gaps to staff being new to the
role and, related to this, training only being partially complete (see Table 6.5). This
perhaps reflects the fact that employers at the higher end of the PMS index were more
likely to be active in the recruitment market than those with a lower PMS rating. It can
take time for new staff to reach full proficiency and so it could be that the skills gaps
within higher PMS establishments are more transient than those in the lower PMS
categories.

107
Table 6.5 Main causes of skills gaps (prompted), by Product Market Strategy
Very low Low Medium High
Very high
Unweighted Base 504 2066 4743 5638 2801
% % % % %
Staff are new to the role 47 56 58 61 63
Their training is currently only partially completed
48 59 60 61 63
Staff lack motivation 39 36 36 33 30
They have been on training but their performance has not improved sufficiently
26 30 32 32 29
The introduction of new working practices
25 25 27 26 27
Staff have not received the appropriate training
28 29 29 27 25
Unable to recruit staff with the required skills
24 25 24 23 23
The introduction of new technology
21 20 19 20 21
The development of new products and service
16 17 20 21 23
Problems retaining staff 11 11 11 11 10
Summary: New to role and/or training incomplete
64 74 75 77 78
Base: All establishments in the private sector with skills gaps; up to two skills gaps followed up.
Percentages shown as a proportion of all skills gaps followed up.
6.4.5 The relationship between PMS and training
Figure 6.6 illustrates a linear relationship between an establishment’s product market
strategies and their level of training activity. As the PMS index increases the proportion of
establishments that train also increases (from 47 per cent in establishments in the ‘very
low’ group to 71 per cent in the ‘very high’ group) as well as the proportion of staff that
are trained within each establishment (from 43 per cent in establishments in the ‘very low’
group to 64 per cent in the ‘very high’ group).

108
Figure 6.6 Incidence of training by Product Market Strategy classification
This pattern of increasing proportions of employers training and an increasing proportion
of the workforce being trained as one moves through the composite PMS score
groupings mirrors the pattern of training activity by size of establishment that was
presented in chapter four. However, the pattern here does appear to be driven by PMS
position rather than by establishment size or by other characteristics. If one looks at
employers with different composite PMS scores within each size band it is invariably the
employers with the higher PMS score who are most likely to train. Similarly, within size
band the proportion of staff trained is greater for those operating at the higher end of the
PMS index (see Table A.6.8 in Annex A). So, like for like, employers operating higher
product market strategies appear to identify a greater need for skill development among
their staff.
6.5 Conclusions
In previous chapters of the report we have observed how employers of different sizes
operating in different sectors in different parts of the UK experience skill deficiencies and
training differently.
47%
55%
63%
69%71%
43%
49%
54%
60%
64%
0%
10%
20%
30%
40%
50%
60%
70%
80%
Very low PMS Low PMS Medium PMS High PMS Very high PMS
Percentage of establishments that train Proportion of staff trained
Base: All private sector establishments in each PMS group
Base: (2,818) (9,507) (19,333) (23,106) (12,729)

109
This chapter has looked at employers from a different perspective, focusing on business
and management strategy rather than firmographics. It has grouped employers according
to whether or not they pursue High Performance Working practices and according to the
nature of their Product Market Strategies.
The interest is in particular on employers with a high PMS as these are employers with
the potential to deliver sustainable business growth. Similarly, evidence suggests that
employers who adopt High Performance Working practices are more productive and
profitable than those who don’t. Therefore, if these employers are unable to access the
skills they require (from the external labour market and/or from their existing workforce)
and/or the training services that will develop these skills, then the potential impact on the
UK economy is great.
The evidence of this chapter by and large works to allay these fears of high value
employers being constrained in their operations. It has painted a picture of HPW
employers and employers with a high composite PMS score who – while generally more
active in the recruitment market than other employers – typically find it easier to fill their
vacancies. They are generally more likely to report skill gaps – but the proportion of their
workforce implicated is no greater than for other employers. And they are more likely to
fund or arrange training for their employees (which will work to reduce these gaps).
Nonetheless it has also suggested some pockets where HPW employers and employers
with a high composite PMS score are challenged by skills deficiencies. There will be
value in exploring these pockets more closely to understand how the market can work to
meet their challenges.

110
7 Conclusions
This survey has painted a picture which supports indications that the country is
emerging from the recession and economic downturn, with increased employer
recruitment activity in 2013 compared with 2011. More employers had vacancies at the
time of the interviews, and the number of vacancies (as a proportion of the workforce)
had increased.
There is potential, however, for skill shortages in the labour market to act as a
brake on economic recovery, or at least as an impediment to some employers reaching
their full growth and productivity potential.
Although only a very small minority of establishments (four per cent) are affected by skill-
shortage vacancies, in total more than one in five vacancies (22 per cent) across the
country are hard-to-fill due to skill shortages in the available labour pool.
These skill shortages are concentrated in particular sectors and occupations, and are
particularly likely to be found among Manufacturers, and where employers are recruiting
for Skilled Trades and Professional roles. There have also been notable increases in the
difficulty of recruiting suitably skilled Caring, Leisure and Other Services, Professionals,
Associate Professionals and Machine Operative staff compared with 2011, suggesting
these are areas where the labour market is facing growing challenges in meeting
employer demand.
In addition, some 1.4 million employees are regarded as not being fully proficient in their
job roles, equating to 5.2 per cent of the total UK workforce.
As with skill-shortage vacancies, skills gaps continue to be concentrated in certain
pockets of the economy. People employed in what are traditionally described as unskilled
or semi-skilled occupations – namely those in Elementary and Sales and Customer
Service positions – remain the most likely to have skills gaps. From a sector perspective,
skills gaps are particularly prevalent in the Hotels and Restaurants industry.

111
The existence of skill gaps may not necessarily indicate potential performance issues. In
a relatively large proportion of cases the employees in question are new to their job role
and/or are trainees, with the suggestion that their proficiency problems are temporary. In
other cases, skill gaps could be an indication of employer awareness of skills issues, or
higher expectations/ambitions. It is certainly the case that employers pursuing a strategy
of High Performance Working and employers recording a high Product Market Strategy
“score” (indicating that they are innovators, offering premium products or services) are
more likely to report skill gaps (although the proportion of the workforce employed by this
kind of progressive organisation that is lacking proficiency is no greater than the
proportion of the general workforce with a skills gap).
The most common response to having a skill gap is to provide (more) training. Overall,
around two-thirds of employers arrange or fund at least some training for at least some of
their workforce, a figure that has changed little since 2011. There have, however, been a
number of quite marked changes in the extent and nature of training provision between
2011 and 2013. In particular:
There has been a marked increase in the proportion of staff trained since 2011;
At the same time there has been a reduction in the amount of training individuals
receive, with a marked fall in the average number of training days provided to
each person trained;
The net effect of these trends is a slight fall compared against 2011 in the total
number of training days funded or arranged by UK employers.
There has also been a fall in total training expenditure, driven mainly by a fall in
expenditure:
Among employers in England;
Large employers with 100 or more staff;
Employers in Public Administration and in Education; and
In regard to on-the-job training.
In this regard, the survey findings provide support for theories that the recession
has led to employers ‘training smarter’ and ‘doing more for less’, with increased
emphasis on in-house training, training employees as trainers, reduced use of external
providers and enhanced use of e-learning26.
26
See Training in Recession: The impact of the 2008-2009 recession on training at work (UKCES 2013)

112
However, the survey also finds evidence of skills under-use: 4.3 million workers (16 per
cent of the workforce) are reported by employers to have skills and qualifications
that are more advanced than are required in their current job role. Better harnessing
these latent capabilities might potentially yield wide-ranging benefits for some employers,
and there is a need for further research to better understand the nature of skills under-
use, which employees are most affected by it, as well as its impact on both business
performance and career progression.
The survey also sheds some light on the issue of progression opportunities by paying
particular attention to the recruitment of young people, an area in which there is
significant current public and policy interest. Although the findings here suggest that there
has been an increase in recruitment activity since the 2011 survey, and although most
recruiting employers have recruited at least one young person over the last two to three
years, there has been a fall in the proportion of employers recruiting young people
from education across the UK as a whole.
Around a quarter of employers recruited at least one education leaver in that period (27
per cent, down from 29 per cent in 2011). Most of them found these recruits to be well or
very well prepared for work. However, as many as four in ten employers taking on school
leavers at 16 from schools in England, Northern Ireland or Wales described the recruits
as poorly prepared (as do three in ten employers in Scotland taking new recruits from
Scottish schools between the ages of 16 and 18). This highlights that employer views and
experiences with young people differ depending on age and stage of education.
However, the main obstacle to (more) young people getting new jobs is
competition in the market place, rather than perceptions that young applicants do
not have the capability to perform in the job role. Where the choice not to recruit a
young applicant was motivated by a belief that the young person did not have the
capabilities to do the job the main things lacking were skills and experience, and
sometimes both. Three in five recruiting employers (61 per cent) who had not recruited a
young person said they had had no applications from young people.
113
Employers who had recruited young people and/or education leavers over the past two to
three years appeared to have a greater demand for (new) labour than other employers,
being around twice as likely to have vacancies. They do not, however, appear to be more
challenged in the labour market than other employers: their recruitment challenges are no
more or less acute. These employers are though more challenged by skills in their
existing workforce: they are more likely to have staff who were not fully proficient than
other recruiting employers, and a larger proportion of their workforce lack proficiency.
They are also more likely to train, and to fund and arrange training for a larger proportion
of their workforce. These differences between those employers that had recruited young
people and those that hadn’t are also worthy of further investigation to aid understanding
of how to improve employment and progression opportunities for this group.
Overall, the findings from the UK Commission’s Employer Skills Survey 2013 make an
important contribution to larger debates about skills and the labour market in the UK. The
survey provides valuable insights into the range of skills issues employers are facing and
their investment behaviour, and raises questions for further research. The findings
highlight some positive developments that support indications of economic recovery, but
they also identify some more concerning trends and priorities for action that need to be
addressed if UK businesses are to realise their full potential. Whilst the survey findings
show that skills shortages and skills gaps affect different employers in varied ways,
looking to the future, the survey also finds that the majority of employers expect their staff
to need to acquire new skills or knowledge over the next year. If the UK is to remain
competitive in the global context it is vital to ensure that employers across the board are
able to make full use of the skills and talents of their people to drive business
performance and growth.

114
Annex A: Supplementary Tables
Chapter 1: Introduction
Table A.1.1 Profile of UK establishments and employment by sector
Number of
establishments % of
establishments Number of
staff % of employment
UK 1,743,847 100 26,959,038 100
Country
England 1,465,963 84 22,754,437 84
Northern Ireland 55,603 3 726,311 3
Scotland 140,948 8 2,308,322 9
Wales 81,333 5 1,169,968 4
Size
2-4 907,729 52 2,393,653 9
5-24 651,910 37 6,454,303 24
25-49 96,839 6 3,332,905 12
50-99 49,784 3 3,434,575 13
100-249 26,105 1 4,021,603 15
250+ 11,480 1 7,321,998 27
Sector
Agriculture 94,386 5 382,834 1
Mining and Quarrying 1,712 * 55,941 *
Manufacturing 99,955 6 2,307,610 9
Electricity, Gas and Water 9,339 1 282,213 1
Construction 162,801 9 1,251,352 5
Wholesale and Retail 372,433 21 4,424,002 16
Hotels and Restaurants 155,283 9 1,799,551 7
Transport and Communications
121,484 7 2,125,843 8
Financial Services 40,030 2 1,033,880 4
Business Services 348,735 20 4,468,096 17
Public Administration 21,408 1 1,432,573 5
Education 57,523 3 2,570,118 10
Health and Social Work 130,010 7 3,597,950 13
Community, Social & Personal Service Activities
128,748 7 1,227,074 5
‘*’ denotes a figure larger than zero but smaller than 0.5

115
Table A.1.2 Profile of UK establishments and employment
Row percentages
Unwtd Base:
Pri
vate
Se
cto
r
Th
ird
Se
cto
r
Pu
bli
c S
ecto
r
Sin
gle
sit
e
Mu
lti-
sit
e
UK 91,279 % 86 9 4 65 35
Country
England 75,255 % 87 9 4 66 34
Northern Ireland 4,014 % 82 10 7 70 30
Scotland 6,014 % 82 12 6 57 43
Wales 5,996 % 86 8 6 65 35
Size
2-4 19,058 % 89 9 1 76 24
5-24 51,565 % 86 9 5 58 42
25-49 10,947 % 75 9 15 43 57
50-99 5,584 % 70 10 19 38 62
100-249 2,938 % 68 13 18 32 68
250+ 1,187 % 67 10 23 24 76
Sector
Agriculture 3,407 % 99 1 * 93 7
Mining and Quarrying 138 % 99 0 1 31 69
Manufacturing 7,422 % 99 * * 76 24
Electricity, Gas and Water
1,148 % 94 4 2 65 35
Construction 7,202 % 100 * * 88 12
Wholesale and Retail 17,287 % 91 9 * 46 54
Hotels and Restaurants
8,888 % 94 5 * 64 36
Transport and Communications
6,890 % 96 2 2 73 27
Financial Services 2,330 % 95 3 * 46 54
Business Services 14,011 % 95 4 1 69 31
Public Administration 942 % 29 9 61 39 61
Education 5,796 % 31 22 47 67 33
Health and Social Work
8,460 % 46 43 11 52 48
Community, Social & Personal Service Activities
7,358 % 63 26 10 68 32
‘*’ denotes a figure larger than zero but smaller than 0.5

116
Chapter 2: Employers’ Experience of Skill Shortages
Table A.2.1 Incidence, number and density of vacancies by size and sector
% of
establishments with a vacancy
(incidence)
Number of
vacancies
Vacancies as a % of
employment (density)
Average (mean)
vacancies per establishment with vacancies
Base % Rounded to nearest 100
%
UK 91,279 15 655,000 2.4 2.5
Country
England 75,255 15 559,600 2.5 2.6
Northern Ireland 4,014 10 15,200 2.1 2.6
Scotland 6,014 15 54,500 2.4 2.5
Wales 5,996 14 25,700 2.2 2.3
Size
2-4 19,058 8 106,300 4.4 1.5
5-24 51,565 17 178,200 2.8 1.7
25-49 10,947 33 79,200 2.4 2.5
50-99 5,584 43 79,400 2.3 3.7
100-249 2,938 58 92,000 2.3 6.1
250+ 1,187 64 119,900 1.6 16.2
Sector
Agriculture 3,407 5 5,500 1.4 1.3
Mining and Quarrying 138 13 1,700 3.0 7.3
Manufacturing 7,422 15 36,800 1.6 2.5
Electricity, Gas and Water 1,148 17 5,900 2.1 3.8
Construction 7,202 7 21,900 1.8 1.8
Wholesale and Retail 17,287 12 84,300 1.9 1.8
Hotels and Restaurants 8,888 18 66,300 3.7 2.3
Transport and
Communications 6,890 14 49,100 2.3 2.9
Financial Services 2,330 17 27,000 2.6 3.9
Business Services 14,011 15 143,500 3.2 2.7
Public Administration 942 27 34,100 2.4 5.8
Education 5,796 29 47,200 1.8 2.8
Health and Social Work 8,460 23 86,600 2.4 2.9
Community, Social &
Personal Service Activities 7,358 16 45,100 3.7 2.1
Base: All establishments
Percentages in Column 3 are shown as a proportion of all employment.
Number of vacancies rounded to the nearest 100.

117
Table A.2.2 Incidence, number and density of vacancies by occupation (2011 vs 2013)
% of establishments with vacancies
who have a vacancy in occupation
Number of vacancies
Vacancy density
Unwtd Base: Rounded to nearest 100
Base: %
2011 17,093
Managers 6 19,300 987 0.4
Professionals 14 81,900 3,025 2.6
Associate Professionals 19 96,500 3,179 5.3
Administrative and Clerical 16 57,300 2,648 1.6
Skilled Trades 14 51,900 2,219 2.8
Caring, Leisure and Other services 13 70,000 2,556 3.0
Sales and Customer Service 14 79,300 2,275 2.3
Machine Operatives 6 35,600 1,129 1.8
Elementary occupations 15 80,500 2,844 2.0
TOTAL 586,500 2.2
2013 18,959
Managers 6 24,000 1,168 0.5
Professionals 16 97,400 3,594 3.1
Associate Professionals 19 98,500 3,406 6.3
Administrative and Clerical 15 67,100 2,760 2.0
Skilled Trades 13 50,800 2,600 2.7
Caring, Leisure and Other services 15 100,500 3,232 3.6
Sales and Customer Service 14 76,200 2,578 2.1
Machine Operatives 6 30,100 1,197 1.6
Elementary occupations 15 79,400 3,171 2.1
TOTAL 655,000 2.4
Base: Column 1: all establishments with vacancies; Column 2: all establishments; Column 3: all
establishments with vacancies in each occupation.
Column 4 percentages are based on all employment, rather than all establishments; figures therefore show
the number of vacancies as a proportion of all employment in each occupation
Note: Vacancies are rounded to the nearest 100. Vacancy total is higher than the sum of vacancies by
occupation as only six occupations per establishment were followed up.

118
Table A.2.3 Incidence, number and density of skill-shortage vacancies (SSVs) by country, size and sector
% of establishments
with a skill-shortage vacancy
Number of skill-shortage
vacancies
% of vacancies which are SSVs
Base: % Rounded to nearest 100
Base: %
UK 91,279 4 146,200 18,959 22
Country
England 75,255 4 124,800 15,894 22
Northern Ireland 4,014 3 2,900 550 19
Scotland 6,014 4 13,400 1,499 25
Wales 5,996 4 5,100 1,016 20
Size
2-4 19,058 2 32,200 1,403 30
5-24 51,565 5 46,900 8,969 26
25-49 10,947 8 16,300 3,653 21
50-99 5,584 10 15,200 2,435 19
100-249 2,938 15 17,500 1,737 19
250+ 1,187 18 18,100 762 15
Sector
Agriculture 3,407 1 1,600 167 28
Mining and Quarrying 138 3 300 22 **
Manufacturing 7,422 5 11,200 1,347 30
Electricity, Gas and Water 1,148 5 1,300 185 23
Construction 7,202 2 5,000 706 23
Wholesale and Retail 17,287 3 15,400 2,983 18
Hotels and Restaurants 8,888 5 12,400 2,447 19
Transport and
Communications 6,890 5 12,900 1,232 26
Financial Services 2,330 4 2,800 398 10
Business Services 14,011 5 40,300 3,147 28
Public Administration 942 6 7,400 283 22
Education 5,796 6 5,700 2,062 12
Health and Social Work 8,460 5 19,200 2,375 22
Community, Social &
Personal Service Activities 7,358 4 10,800 1,605 24
Base: Column 1 and 2: all establishments; Column 3: all establishments with vacancies
Percentages in Column 3 are based on all vacancies, rather than all establishments with vacancies; figures
therefore show the proportion of vacancies caused by skill shortages
Notes: The number of skill-shortage vacancies has been rounded to the nearest 100

119
Table A.2.4 Density of skill-shortage vacancies by country, size and sector (2011 vs 2013)
% of vacancies which are SSVs
2011 2013
Base: % Base: %
UK 17,093 16 18,959 22
Country
England 14,749 15 15,894 22
Northern Ireland 520 21 550 19
Scotland 729 15 1,499 25
Wales 1,095 18 1,016 20
Size
2-4 1,389 21 1,403 30
5-24 7,869 17 8,969 26
25-49 2,972 18 3,653 21
50-99 2,241 11 2,435 19
100-249 1,698 14 1,737 19
250+ 924 8 762 15
Sector
Agriculture 87 26 167 28
Mining and Quarrying 36 17 22 **
Manufacturing 1,424 24 1,347 30
Electricity, Gas and Water 205 13 185 23
Construction 575 18 706 23
Wholesale and Retail 2,549 14 2,983 18
Hotels and Restaurants 2,078 15 2,447 19
Transport and Communications 1,404 14 1,232 26
Financial Services 331 17 398 10
Business Services 2,945 17 3,147 28
Public Administration 402 10 283 22
Education 1,487 10 2,062 12
Health and Social Work 1,992 10 2,375 22
Community, Social & Personal Service
Activities 1,578 21 1,605 24
Base: all establishments with vacancies
Percentages are based on all vacancies, rather than all establishments with vacancies; figures therefore
show the proportion of vacancies caused by skill shortages
Notes: The number of skill-shortage vacancies has been rounded to the nearest 100
“**” denotes figure not shown because of a low base (fewer than 25 respondents); Figures in italics show
base is below 50 and figures should be treated with caution.

120
Table A.2.5 Density of skill-shortage vacancies by occupation and sector
Man
ag
ers
1.1
P
rofe
ssio
nals
1.2
A
sso
cia
te
Pro
fes
sio
nals
1.3
A
dm
inis
trati
ve /
Cle
rical
sta
ff
1.4
S
kille
d T
rad
es
occu
pati
on
s
1.5
C
ari
ng
, L
eis
ure
an
d O
ther
Serv
ices
Sale
s a
nd
Cu
sto
mer
Serv
ices
Mach
ine
Op
era
tive
s
1.6
E
lem
en
tary
sta
ff
UK 20 30 26 13 39 27 13 25 13
Agriculture ** ** ** ** 37 ** ** ** 23
Mining and Quarrying ** ** ** ** ** ** ** ** **
Manufacturing 26 55 28 14 41 ** 18 17 4
Electricity, Gas and Water
49 41 9 24 ** 17 5
Construction 31 16 19 11 29 ** 7 35 9
Wholesale and Retail 22 16 30 15 45 ** 13 15 14
Hotels and Restaurants
25 15 19 44 16 15 14 14
Transport and Communications
12 34 27 12 35 ** 26 28 29
Financial Services 6 12 15 8 ** ** 9 ** **
Business Services 25 37 34 23 49 21 12 46 13
Public Administration ** 30 13 5 ** 34 ** ** **
Education 14 13 15 6 27 12 ** ** 9
Health and Social Work
16 32 10 7 20 28 2 ** 7
Community, Social and Personal Services
15 20 23 11 20 31 10 31 3
Base: All establishments with vacancies within each occupation by sector
Densities are based on skill-shortage vacancies as a proportion of all vacancies within each occupation by
sector, rather than the number of establishments with vacancies.
‘**’ Figure not shown because of a low base (fewer than 25 establishments with vacancies)
Where base between 25 and 49 establishments with vacancies, figures are shown in italics
= density 30% or above
= density between 15% and 29%
= density between 1% and 14%
X
X
X

121
Table A.2.5a Bases for previous table (Table A.2.5)
Man
ag
ers
1.7
P
rofe
ssio
nals
1.8
A
sso
cia
te
Pro
fes
sio
nals
1.9
A
dm
inis
trati
ve /
Cle
rical
sta
ff
1.1
0
Skille
d T
rad
es
occu
pati
on
s
1.1
1
Cari
ng
, L
eis
ure
an
d
Oth
er
Se
rvic
es
Sale
s a
nd
Cu
sto
mer
Se
rvic
es
Mach
ine
Op
era
tive
s
1.1
2
Ele
men
tary
sta
ff
UK 1,168 3,594 3,406 2,760 2,600 3,232 2,578 1,197 3,171
Agriculture 27 95
Mining and Quarrying
Manufacturing 86 187 319 177 445 113 316 98
Electricity, Gas and Water 13 30 29 33 33 56 32
Construction 50 83 97 103 312 32 73 67
Wholesale and Retail 257 93 264 263 381 1,750 199 283
Hotels and Restaurants 177 60 224 711 129 117 96 1,741
Transport and Communications
54 369 335 182 150 14 121 219 79
Financial Services 25 32 133 189 74
Business Services 177 839 1,120 649 317 158 209 141 252
Public Administration 69 86 97 82
Education 43 1,227 258 268 41 678 172
Health and Social Work 145 551 356 272 86 1363 33 162
Community, Social and Personal Services
110 106 344 292 87 776 77 25 165

122
Table A.2.6 Skills lacking in applicants by country
UK England Northern Ireland
Scotland Wales
Base 4,897 4,057 144 427 269
% % % % %
Technical, practical or job specific skills
63 62 69 72 69
Oral communication skills 41 42 45 32 42
Planning and organisational skills
41 41 60 35 44
Customer handling skills 40 41 37 36 38
Written communication skills 38 38 40 31 33
Problem solving skills 37 37 56 33 37
Literacy skills 34 35 35 29 28
Team working skills 33 33 49 23 31
Strategic Management skills 30 30 44 32 26
Numeracy skills 26 26 27 28 33
Advanced IT or software skills
22 22 21 20 18
Foreign language skills 17 17 34 13 9
Basic computer literacy / using IT
16 16 27 15 18
Written Welsh language skills
n/a n/a n/a n/a 15
Oral Welsh language skills n/a n/a n/a n/a 13
Base: All establishments with skill-shortage vacancies
Percentages are based on all skill-shortage vacancies, rather than all establishments with skill-shortage
vacancies; proportions therefore show the percentage of skill-shortage vacancies within each country caused
by lack of each skill.
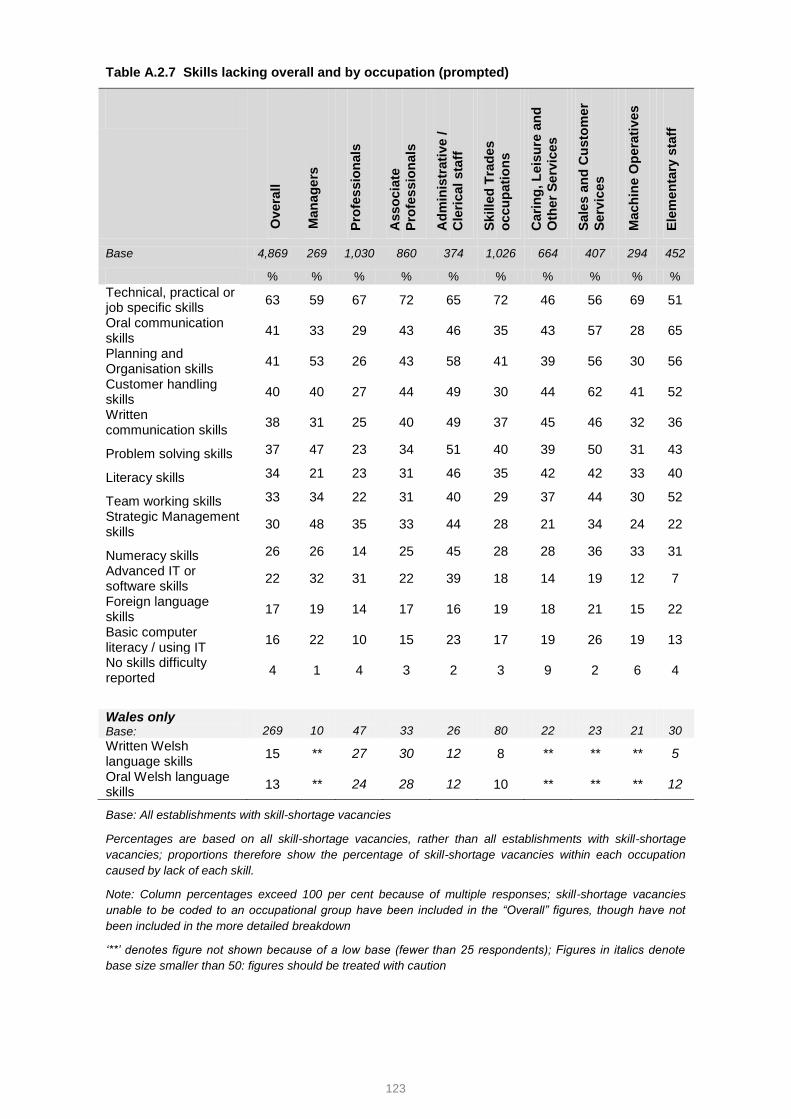
123
Table A.2.7 Skills lacking overall and by occupation (prompted)
Overa
ll
Man
ag
ers
1.1
3
Pro
fes
sio
nals
1.1
4
Asso
cia
te
Pro
fes
sio
nals
1.1
5
Ad
min
istr
ati
ve /
Cle
rical
sta
ff
1.1
6
Skille
d T
rad
es
occu
pati
on
s
1.1
7
Cari
ng
, L
eis
ure
an
d
Oth
er
Se
rvic
es
Sale
s a
nd
Cu
sto
mer
Serv
ices
Mach
ine
Op
era
tives
1.1
8
Ele
men
tary
sta
ff
Base 4,869 269 1,030 860 374 1,026 664 407 294 452
% % % % % % % % % %
Technical, practical or job specific skills
63 59 67 72 65 72 46 56 69 51
Oral communication skills
41 33 29 43 46 35 43 57 28 65
Planning and Organisation skills
41 53 26 43 58 41 39 56 30 56
Customer handling skills
40 40 27 44 49 30 44 62 41 52
Written communication skills
38 31 25 40 49 37 45 46 32 36
Problem solving skills 37 47 23 34 51 40 39 50 31 43
Literacy skills 34 21 23 31 46 35 42 42 33 40
Team working skills 33 34 22 31 40 29 37 44 30 52
Strategic Management skills
30 48 35 33 44 28 21 34 24 22
Numeracy skills 26 26 14 25 45 28 28 36 33 31
Advanced IT or software skills
22 32 31 22 39 18 14 19 12 7
Foreign language skills
17 19 14 17 16 19 18 21 15 22
Basic computer literacy / using IT
16 22 10 15 23 17 19 26 19 13
No skills difficulty reported
4 1 4 3 2 3 9 2 6 4
Wales only Base:
269
10
47
33
26
80
22
23
21
30
Written Welsh language skills
15 ** 27 30 12 8 ** ** ** 5
Oral Welsh language skills
13 ** 24 28 12 10 ** ** ** 12
Base: All establishments with skill-shortage vacancies
Percentages are based on all skill-shortage vacancies, rather than all establishments with skill-shortage
vacancies; proportions therefore show the percentage of skill-shortage vacancies within each occupation
caused by lack of each skill.
Note: Column percentages exceed 100 per cent because of multiple responses; skill-shortage vacancies
unable to be coded to an occupational group have been included in the “Overall” figures, though have not
been included in the more detailed breakdown
‘**’ denotes figure not shown because of a low base (fewer than 25 respondents); Figures in italics denote
base size smaller than 50: figures should be treated with caution

124
Table A.2.8 Ratio of skill-shortage vacancies to vacancies that are hard-to-fill for other non skills-related reasons by nation, size and sector
Number of skill-
shortage vacancies
Number of ‘other’ hard-
to-fill vacancies
% of hard-to-fill vacancies that are a result of skill shortages
Base Rounded to nearest 100
Rounded to nearest 100
%
UK 6,133 146,200 43,100 77
Country
England 5,073 124,800 35,200 78
Northern Ireland 181 2,900 1,100 73
Scotland 538 13,400 4,800 74
Wales 341 5,100 2,100 71
Size
2-4 536 32,200 13,300 71
5-24 3,033 46,900 12,500 79
25-49 1,115 16,300 6,200 72
50-99 697 15,200 5,100 75
100-249 528 17,500 4,900 78
250+ 224 18,100 1,200 94
Sector
Agriculture 74 1,600 600 71
Mining and Quarrying 5 ** ** **
Manufacturing 530 11,200 1,600 87
Electricity, Gas and Water 65 1,300 200 90
Construction 249 5,000 2,400 67
Wholesale and Retail 802 15,400 6,100 72
Hotels and Restaurants 841 12,400 6,500 66
Transport and Communications 499 12,900 3,200 80
Financial Services 121 2,800 500 85
Business Services 1,158 40,300 4,900 89
Public Administration 83 7,400 2,800 73
Education 480 5,700 2,100 73
Health and Social Work 736 19,200 6,900 74
Community, Social & Personal
Service Activities 490 10,800 5,100 68
Base: Establishments with hard-to-fill vacancies.
Percentages are based on all hard-to-fill vacancies, rather than all establishments with hard-to-fill vacancies;
proportions therefore show the percentage of hard-to-fill vacancies within each occupation caused by skill
shortages.
‘**’ denotes figure not shown because of a low base (fewer than 25 respondents)

125
Table A.2.9 – Impact of SSV’s by nation
Base: All establishments where all hard-to-fill vacancies caused by skills related issues
‘-‘ denotes a figure of zero * indicates a figure of greater than 0 but less than 0.5
UK England Northern Ireland
Scotland Wales
Base 4,675 3,879 136 407 253
% % % % %
Increase workload for other staff 84 83 90 91 90
Have difficulties meeting customer service objectives
49 48 51 57 49
Delay developing new products or services
44 43 52 43 47
Lose business or orders to competitors
42 42 42 41 45
Experience increased operating costs
42 42 39 39 43
Have difficulties introducing new working practices
37 36 49 44 38
Have difficulties meeting quality standards
35 34 35 41 37
Outsource work 29 29 35 26 32
Withdraw from offering certain products or services
24 24 33 24 23
Have difficulties introducing technological change
21 20 27 28 24
None of the above 5 5 3 4 3
Don’t Know * * - - -
ANY IMPACT 95 95 97 96 97

126
Table A.2.10 Profile of hard-to-fill vacancies
Total number of hard-to-fill vacancies for
those with vacancies
% of vacancies hard-to-fill
Average number of hard-to-fill
vacancies for those with hard-to-fill vacancies
Average number of hard-to-fill
vacancies for those with vacancies
Unwtd base
%
UK 18,959 189,300 29 2.1 0.7
Country
England 15,894 16,000 29 2.1 0.7
Northern Ireland 550 4,000 26 2.0 0.7
Scotland 1,499 18,200 33 2.2 0.8
Wales 1,016 7,200 28 1.9 0.7
Size
2-4 1,403 45,400 43 1.7 0.7
5-24 8,969 59,400 33 1.6 0.6
25-49 3,653 22,500 28 2.2 0.7
50-99 2,435 20,300 26 3.0 0.9
100-249 1,737 22,400 24 4.2 1.4
250+ 762 19,300 16 7.2 2.2
Sector
Agriculture 167 2,200 40 1.2 0.5
Mining and Quarrying 22 300 20 4.5 1.1
Manufacturing 1,347 12,800 35 2.2 0.9
Electricity, Gas and Water 185 1,500 25 2.2 0.8
Construction 706 7,400 34 1.8 0.6
Wholesale and Retail 2,983 21,500 26 1.7 0.5
Hotels and Restaurants 2,447 19,000 29 1.9 0.7
Transport and Communications
1,232 16,100 33 2.1 0.9
Financial Services 398 3,300 12 1.6 0.4
Business Services 3,147 45,200 32 2.1 0.8
Public Administration 283 10,200 30 5.3 1.6
Education 2,062 7,800 17 1.8 0.5
Health and Social Work 2,375 26,200 30 2.6 0.9
Community, Social & Personal Service Activities
1,605 15,900 35 2.3 0.8
Base: All establishments with vacancies
Notes: The number of hard-to-fill vacancies has been rounded to the nearest 100

127
Table A.2.11 Main causes of hard-to-fill vacancies
Country Size Band
UK
En
gla
nd
No
rth
ern
Ire
lan
d
Sc
otl
an
d
Wa
les
2-4
5-2
4
25-4
9
25-9
9
100-2
49
250+
% % % % % % % % % % %
Base: 6,133 5,073 181 538 341 536 3,033 1,115 697 528 224
Low number of applicants with the required skills 40 41 39 40 36 38 40 38 34 42 54
Lack of work experience the company demands
25 26 32 21 24 25 24 26 16 30 35
Not enough people interested in doing this type of job
18 18 26 15 20 19 18 18 19 18 15
Low number of applicants with the required attitude, motivation or personality
18 18 15 13 18 21 20 16 23 9 10
Lack of qualifications the company demands
18 18 22 17 9 16 18 14 11 14 34
Poor terms and conditions (e.g. pay) offered for post
13 13 11 16 16 16 11 13 14 21 7
Low number of applicants generally
13 13 13 13 17 11 13 14 16 14 15
Job entails shift work/unsociable hours 10 9 9 10 21 7 11 11 9 14 10
Too much competition from other employers 9 8 13 12 6 5 5 7 16 12 20
Remote location/poor public transport
8 7 9 17 19 6 8 11 9 12 5
Poor career progression / lack of prospects
3 3 3 1 4 5 2 2 2 1 2
Base: All establishments with hard-to-fill vacancies
Percentages are based on all hard-to-fill vacancies.
Reasons mentioned in more than one per cent of cases shown.

128
Chapter 3: The Internal Skills Challenge
Table A.3.1 Incidence, number and density of skills gaps by size and sector (2013 vs. 2011)
2011 2013
% o
f e
sta
blis
hm
en
ts w
ith
an
y s
kills
gap
s
Nu
mb
er
of
sta
ff n
ot
fully
pro
ficie
nt
(skills
gap
s)
% o
f sta
ff r
ep
ort
ed
as
hav
ing
skills
ga
ps
% o
f e
sta
blis
hm
en
ts w
ith
an
y s
kills
gap
s
Nu
mb
er
of
sta
ff n
ot
fully
pro
ficie
nt
(skills
gap
s)
% o
f sta
ff r
ep
ort
ed
as
hav
ing
skills
ga
ps
Unwtd Base
Row percentages Unwtd Base
Row percentages
UK 86,522 17 1,485,500 5.5 91,279 15 1,409,900 5.2
Size
2-4 17,905 8 85,600 3.6 19,058 7 69,900 2.9
5-24 47,770 23 352,800 5.5 51,565 21 315,600 4.9
25-49 10,239 35 185,200 5.5 10,947 32 169,500 5.1
50-99 5,712 39 186,900 5.5 5,584 36 178,100 5.2
100-249 3,270 44 235,800 5.8 2,938 44 221,100 5.5
250 + 1,626 47 439,100 6.0 1,187 48 455,700 6.2
Sector
Agriculture 921 11 17,200 4.6 3,407 9 16,700 4.4
Mining and Quarrying 185 14 1,800 3.1 138 14 4,100 7.3
Manufacturing 7,653 20 145,100 6.0 7,422 18 134,800 5.8
Electricity, Gas and Water
1,406 19 15,400 5.6 1,148 18 14,400 5.1
Construction 6,576 13 64,900 4.8 7,202 11 59,100 4.7
Wholesale and Retail 15,163 19 293,500 6.6 17,287 17 254,400 5.8
Hotels and Restaurants
8,421 23 155,600 9.0 8,888 21 159,400 8.9
Transport and Communications
7,810 15 99,300 4.6 6,890 13 94,500 4.4
Financial Services 1,853 21 46,000 4.4 2,330 19 83,800 8.1
Business Services 14,297 13 220,900 5.1 14,011 13 224,100 5.0
Public Administration 1,584 23 83,000 5.3 942 20 69,000 4.8
Education 5,422 22 94,900 3.8 5,796 18 97,700 3.8
Health and Social Work
8,067 20 180,200 5.2 8,460 19 143,600 4.0
Community, Social and Personal Services activities
7,164 16 67,800 5.6 7,358 14 54,200 4.4
Base: Columns one and four all establishments; remainder all employment.
Note: The number of employees not fully proficient has been rounded to the nearest 100.
Percentages are based on all employment, rather than all establishments; proportions therefore show the
percentage of staff with a skills gap.

129
Table A.3.2 Proportion of each occupation lacking full proficiency within country
UK England Northern Ireland
Scotland Wales
% % % % %
Managers 3 3 2 3 3
Professionals 4 4 2 5 3
Associate Professionals 5 5 2 5 4
Administrative / clerical staff 5 5 5 5 5
Skilled trades occupations 6 5 7 7 6
Caring, leisure and other services 5 4 5 6 9
Sales and customer services staff 8 8 10 7 7
Machine operatives 5 5 7 7 7
Elementary staff 7 7 6 8 9
Base: All establishments with staff in each occupation
Percentages are based on all employment, rather than all establishments; proportions therefore show the
percentage of staff with a skills gap.
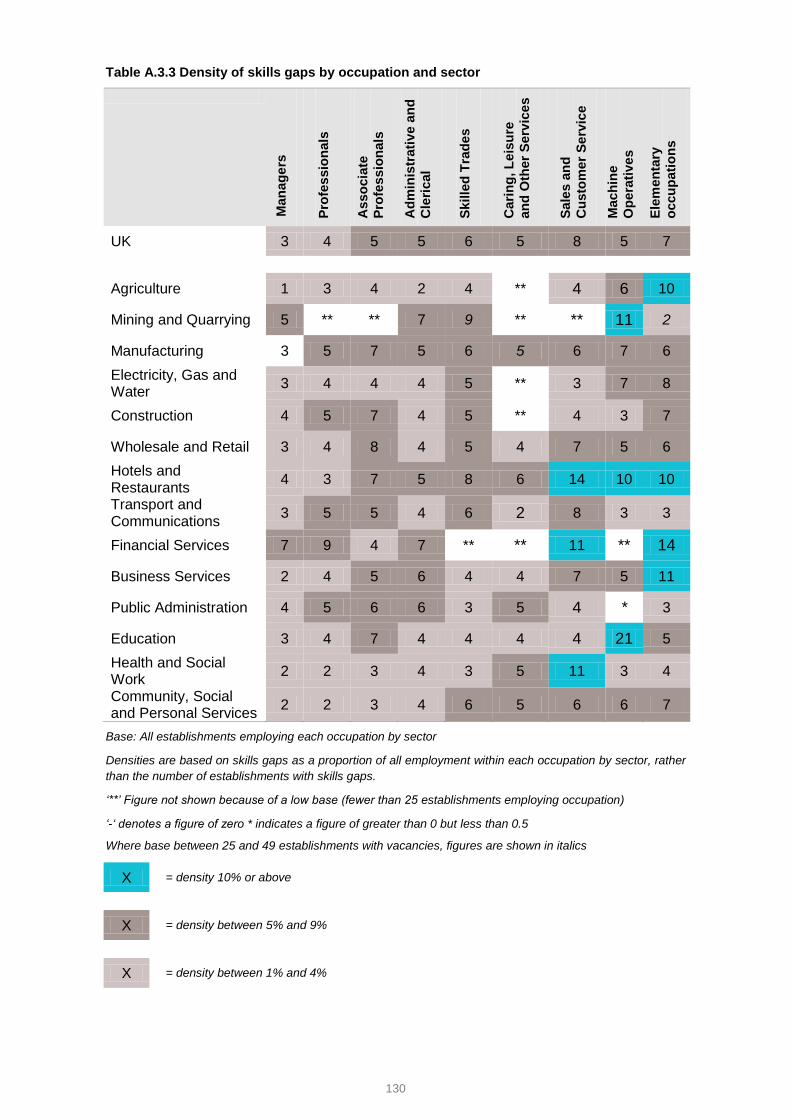
130
Table A.3.3 Density of skills gaps by occupation and sector
Man
ag
ers
1.1
9
Pro
fes
sio
nals
1.2
0
Asso
cia
te
Pro
fes
sio
nals
1.2
1
Ad
min
istr
ati
ve a
nd
Cle
rical
1.2
2
Skille
d T
rad
es
1.2
3
Cari
ng
, L
eis
ure
an
d O
ther
Serv
ice
s
Sale
s a
nd
Cu
sto
mer
Se
rvic
e
Mach
ine
Op
era
tive
s
1.2
4
Ele
men
tary
occu
pati
on
s
UK 3 4 5 5 6 5 8 5 7
Agriculture 1 3 4 2 4 ** 4 6 10
Mining and Quarrying 5 ** ** 7 9 ** ** 11 2
Manufacturing 3 5 7 5 6 5 6 7 6
Electricity, Gas and Water
3 4 4 4 5 ** 3 7 8
Construction 4 5 7 4 5 ** 4 3 7
Wholesale and Retail 3 4 8 4 5 4 7 5 6
Hotels and Restaurants
4 3 7 5 8 6 14 10 10
Transport and Communications
3 5 5 4 6 2 8 3 3
Financial Services 7 9 4 7 ** ** 11 ** 14
Business Services 2 4 5 6 4 4 7 5 11
Public Administration 4 5 6 6 3 5 4 * 3
Education 3 4 7 4 4 4 4 21 5
Health and Social Work
2 2 3 4 3 5 11 3 4
Community, Social and Personal Services
2 2 3 4 6 5 6 6 7
Base: All establishments employing each occupation by sector
Densities are based on skills gaps as a proportion of all employment within each occupation by sector, rather
than the number of establishments with skills gaps.
‘**’ Figure not shown because of a low base (fewer than 25 establishments employing occupation)
‘-‘ denotes a figure of zero * indicates a figure of greater than 0 but less than 0.5
Where base between 25 and 49 establishments with vacancies, figures are shown in italics
= density 10% or above
= density between 5% and 9%
= density between 1% and 4%
X
X
X

131
Table A.3.4 Causes of Skills Gaps, by occupation
Ma
na
ge
rs
Pro
fess
ion
als
As
so
cia
te
Pro
fess
ion
als
Ad
min
istr
ati
ve
an
d C
leri
cal
Sk
ille
d T
rad
es
Ca
rin
g,
Leis
ure
an
d
Oth
er
se
rvic
es
Sa
les
an
d
Cu
sto
me
r
Se
rvic
e
Ma
ch
ine
Op
era
tiv
es
Ele
me
nta
ry
occ
up
ati
on
s
% % % % % % % % %
Base: 3,673 1,568 1,369 3,909 3,032 2,340 4,840 1,488 4,630
New to the role 44 58 59 54 52 62 60 53 54
Training only partially completed 45 61 66 54 67 63 54 54 53
Staff lack motivation 31 28 23 27 26 34 36 33 41
Been on training but performance not improved sufficiently
26 29 24 26 24 31 35 27 34
Introduction of new working practices 33 26 26 30 21 31 25 22 21
Not received appropriate training 34 23 24 27 26 27 22 23 22
Unable to recruit staff with required skills 20 21 20 16 26 22 19 27 22
Development of new products and services 20 19 22 19 17 17 21 13 13
Introduction of new technology 23 20 20 25 19 15 17 20 12
Problems retaining staff 10 9 8 6 8 11 11 8 13
Summary: New to role / training not complete (transient factors) 60 76 78 68 78 79 72 68 69
Base: All establishments with skills gaps in each occupation – up to two occupations followed up
Percentages are based on all skills gaps, rather than all establishments with skills gaps; proportions therefore show the percentage of skills gaps attributed to each cause.

132
Table A.3.5 Skills lacking among staff with skills gaps followed up, by occupation
Ma
na
ge
rs
Pro
fess
ion
als
As
so
cia
te
Pro
fess
ion
als
Ad
min
istr
ati
ve
an
d C
leri
cal
Sk
ille
d T
rad
es
Ca
rin
g,
Leis
ure
an
d
Oth
er
se
rvic
es
Sa
les
an
d
Cu
sto
me
r
Se
rvic
e
Ma
ch
ine
Op
era
tiv
es
Ele
me
nta
ry
occ
up
ati
on
s
% % % % % % % % %
Base: 3,673 1,568 1,369 3,909 3,032 2,340 4,840 1,488 4,630
Technical, practical or job-specific 37 59 55 66 68 56 56 68 58
Planning and organisation 70 61 55 67 51 62 55 42 51
Team working 56 46 44 53 40 64 52 53 60
Customer handling 34 36 35 57 34 54 71 23 58
Problem solving 52 45 40 53 47 51 49 52 47
Oral communication 45 40 35 45 35 50 51 48 54
Written communication 32 35 33 48 30 58 25 39 34
Basic computer literacy / using IT 21 18 17 38 18 41 23 35 23
Strategic Management 65 42 29 20 21 15 20 12 16
Literacy 13 16 16 27 23 48 18 39 24
Advanced IT or software 33 33 26 44 17 24 16 15 11
Numeracy 13 14 11 28 19 36 23 31 22
Foreign language 8 11 7 7 9 21 12 13 16
Base: All establishments with skills gaps in each occupation – up to two occupations followed up
Percentages are based on all skills gaps, rather than all establishments with skills gaps; proportions therefore show the percentage of skills gaps attributed to each cause.
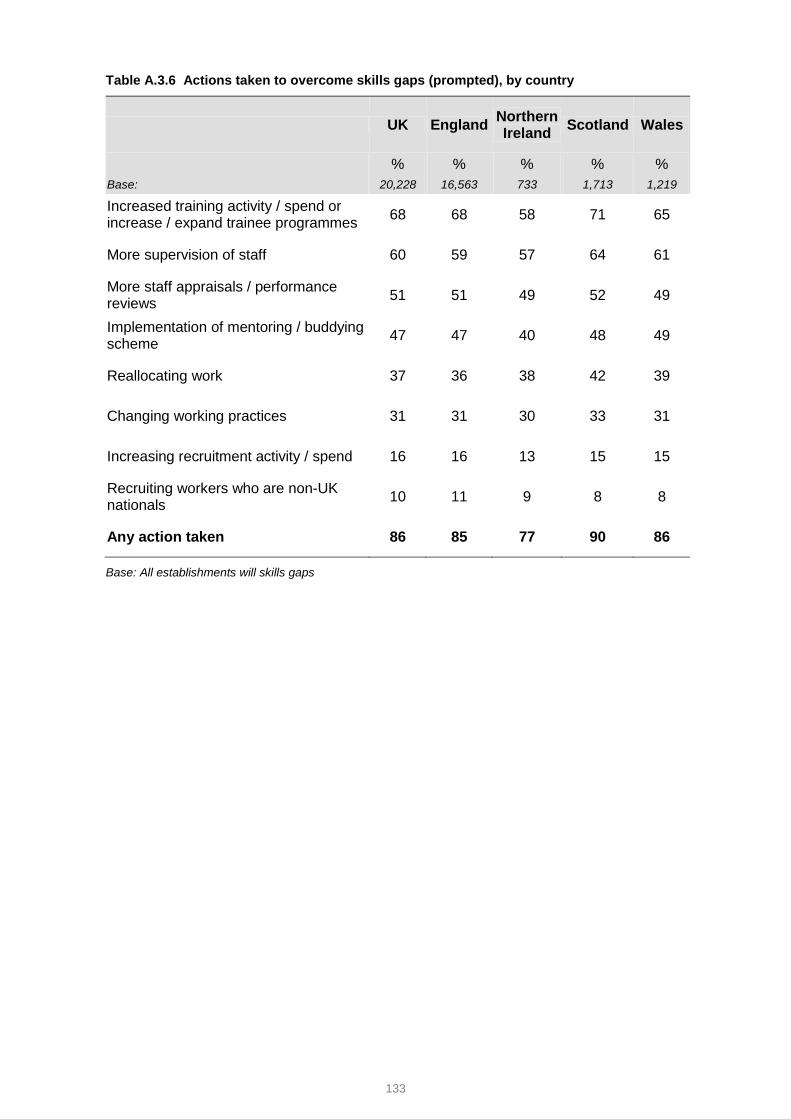
133
Table A.3.6 Actions taken to overcome skills gaps (prompted), by country
UK England Northern Ireland
Scotland Wales
% % % % %
Base: 20,228 16,563 733 1,713 1,219
Increased training activity / spend or increase / expand trainee programmes
68 68 58 71 65
More supervision of staff 60 59 57 64 61
More staff appraisals / performance reviews
51 51 49 52 49
Implementation of mentoring / buddying scheme
47 47 40 48 49
Reallocating work 37 36 38 42 39
Changing working practices 31 31 30 33 31
Increasing recruitment activity / spend 16 16 13 15 15
Recruiting workers who are non-UK nationals
10 11 9 8 8
Any action taken 86 85 77 90 86
Base: All establishments will skills gaps

134
Table A.3.7 Incidence, number and density of staff who are both over-qualified and over-skilled by size and sector (2011 vs. 2013)
2011 2013
Row percentages
% o
f e
sta
blis
hm
en
ts
rep
ort
ing
skills
un
der-
use
Nu
mb
er
of
over-
qu
alifi
ed
an
d o
ver-
skille
d s
taff
% o
f sta
ff r
ep
ort
ed
as
bein
g o
ve
r-q
ua
lifi
ed
an
d o
ver-
skille
d
% o
f e
sta
blis
hm
en
ts
rep
ort
ing
skills
un
der-
use
Nu
mb
er
of
over-
qu
alifi
ed
an
d o
ver-
skille
d s
taff
% o
f sta
ff r
ep
ort
ed
as
bein
g o
ve
r-q
ua
lifi
ed
an
d o
ver-
skille
d
Base Base
UK 86,522 48 4,168,000 15 45,644 48 4,283,000 16
Size
2-4 17,905 47 714,000 30 9,532 47 728,000 30
5-24 47,770 48 1,205,000 19 25,704 48 1,208,000 19
25-49 10,239 50 453,000 13 5,545 51 490,000 15
50-99 5,712 50 407,000 12 2,802 51 445,000 13
100-249 3,270 49 467,000 12 1,472 50 479,000 12
250+ 1,626 48 922,000 13 589 48 934,000 13
Sector
Agriculture 921 38 70,000 19 1,725 38 73,000 19
Mining and Quarrying 185 44 15,000 26 76 41 4,000 6
Manufacturing 7,653 41 234,000 10 3,763 39 233,000 10
Electricity, Gas and Water
1,406 42 27,000 10 571 45 36,000 13
Construction 6,576 41 226,000 17 3,623 40 181,000 14
Wholesale and Retail 15,163 51 760,000 17 8,731 50 762,000 17
Hotels and Restaurants
8,421 61 438,000 25 4,359 60 426,000 24
Transport and Communications
7,810 45 297,000 14 3,427 44 321,000 15
Financial Services 1,853 51 165,000 16 1,169 50 125,000 12
Business Services 14,297 45 659,000 15 6,939 44 704,000 16
Public Administration 1,584 53 216,000 14 480 53 135,000 9
Education 5,422 53 337,000 13 2,907 54 321,000 12
Health and Social Work
8,067 50 475,000 14 4,221 53 701,000 19
Community, Social and Personal Services activities
7,164 52 250,000 21 3,653 52 260,000 21
Base: All establishments in Module 2
Percentages are based on all employment, rather than all establishments; proportions therefore show the
percentage of staff who are over-qualified and over-skilled
Note: The number of employees reported as being over-qualified and over-skilled has been rounded to the
nearest 1,000.

135
Table A.3.8 Skills which need improving or updating in the next 12 months, by the single occupation most affected by upskilling need
Ma
na
ge
rs
Pro
fess
ion
als
As
so
cia
te
Pro
fess
ion
als
Ad
min
istr
ati
ve
an
d C
leri
cal
Sk
ille
d T
rad
es
Ca
rin
g,
Leis
ure
an
d
Oth
er
se
rvic
es
Sa
les
an
d
Cu
sto
me
r
Se
rvic
e
Ma
ch
ine
Op
era
tiv
es
Ele
me
nta
ry
occ
up
ati
on
s
% % % % % % % % %
Base: 11,552 3,369 1,666 2,602 3,423 2,562 3,966 1,469 2,021
Technical, practical or job specific skills 49 70 75 55 71 61 55 70 59
Planning and organising skills 44 43 43 41 38 53 50 34 47
Problem solving skills 32 32 35 34 35 41 44 31 44
Advanced IT or software skills 36 48 51 49 23 20 26 17 14
Team working skills 28 30 28 27 28 53 43 30 50
Customer handling skills 25 24 31 31 26 43 56 21 51
Strategic management skills 39 32 27 27 18 24 27 12 20
Basic computer literacy / using IT 24 18 17 29 23 32 28 24 25
Oral communication skills 18 17 18 22 18 35 34 20 38
Written communication skills 15 17 19 20 16 36 21 15 23
Numeracy skills 11 11 7 16 10 18 14 11 23
Literacy skills 10 11 8 15 11 23 15 10 18
Foreign language skills 11 10 8 10 5 10 12 5 11
Base: All establishments who anticipate an upskilling need in next twelve months (Module 2)
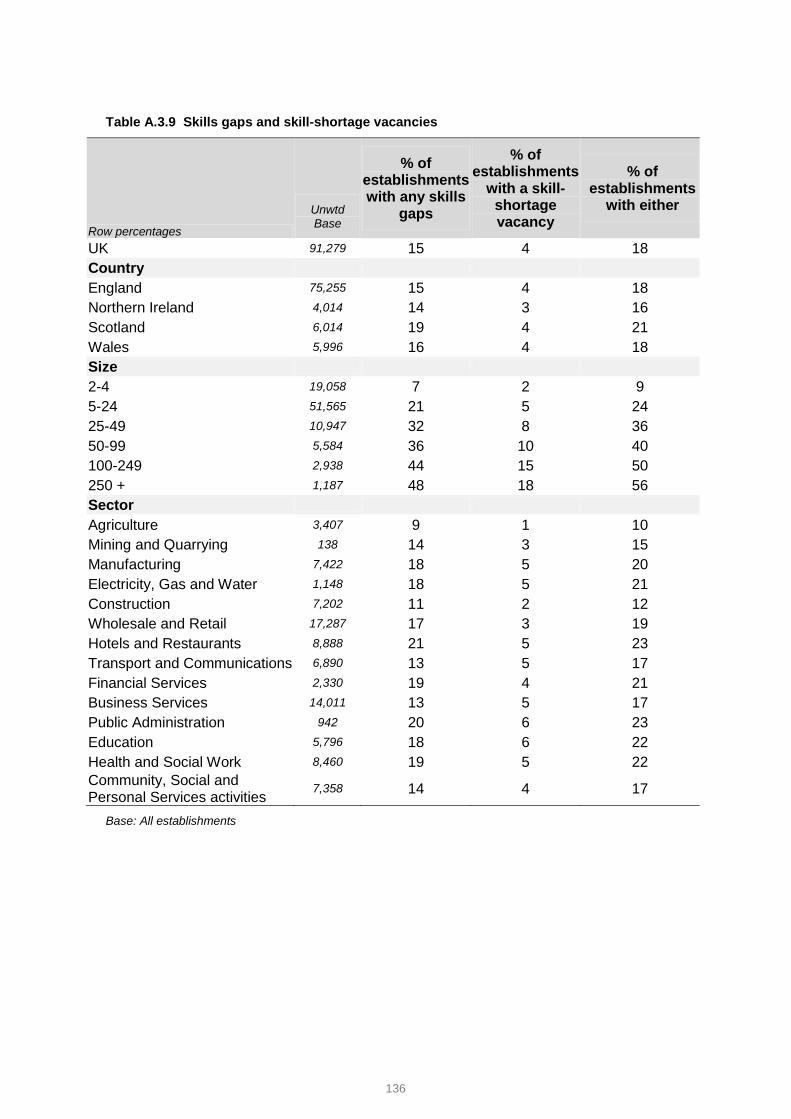
136
Table A.3.9 Skills gaps and skill-shortage vacancies
Row percentages
Unwtd Base
% of establishments with any skills
gaps
% of establishments
with a skill-shortage vacancy
% of establishments
with either
UK 91,279 15 4 18
Country
England 75,255 15 4 18
Northern Ireland 4,014 14 3 16
Scotland 6,014 19 4 21
Wales 5,996 16 4 18
Size
2-4 19,058 7 2 9
5-24 51,565 21 5 24
25-49 10,947 32 8 36
50-99 5,584 36 10 40
100-249 2,938 44 15 50
250 + 1,187 48 18 56
Sector
Agriculture 3,407 9 1 10
Mining and Quarrying 138 14 3 15
Manufacturing 7,422 18 5 20
Electricity, Gas and Water 1,148 18 5 21
Construction 7,202 11 2 12
Wholesale and Retail 17,287 17 3 19
Hotels and Restaurants 8,888 21 5 23
Transport and Communications 6,890 13 5 17
Financial Services 2,330 19 4 21
Business Services 14,011 13 5 17
Public Administration 942 20 6 23
Education 5,796 18 6 22
Health and Social Work 8,460 19 5 22
Community, Social and Personal Services activities
7,358 14 4 17
Base: All establishments

137
Table A.3.10 Single occupation most affected by the need for upskilling
Base: All establishments who employ staff in each occupation (Module 2)
Table A.3.10a – Base sizes for previous table
UK England Northern Ireland
Scotland Wales
% % % % %
Managers 32 32 33 31 34
Professionals 40 38 43 47 43
Associate Professionals 29 29 31 31 26
Administrative and Clerical 12 12 13 13 13
Skilled Trades 31 31 34 32 34
Caring, Leisure and Other services 37 37 38 42 39
Sales and Customer Service 29 30 27 29 28
Machine Operatives 21 22 24 18 21
Elementary Occupations 14 14 15 15 13
UK England Northern Ireland
Scotland Wales
% % % % %
Managers 44,018 36,342 1,915 2,884 2,877
Professionals 8,739 7,135 374 698 532
Associate Professionals 6,268 5,118 261 550 339
Administrative and Clerical 26,945 22,249 1,176 1,958 1,562
Skilled Trades 11,811 9,638 434 965 774
Caring, Leisure and Other services
6,973 5,746 290 523 414
Sales and Customer Service 13,690 11,380 603 919 788
Machine Operatives 7,002 5,704 271 605 422
Elementary Occupations 16,100 13,117 661 1,296 1,026

138
Chapter 4: Training and Workforce Development
Table A.4.1 Incidence of training 2011 vs 2013
2011 2013
Unwtd Base
Any Training
Any off-job
training
Any on-job
training Unwtd Base
Any Training
Any off-job
training
Any on-job
training
% % % % % %
UK 86,522 65 47 53 91,279 66 49 52
Country
England 74,156 65 46 52 75,255 66 48 52
Northern Ireland 3,921 65 48 50 4,014 63 49 47
Scotland 2,487 73 53 60 6,014 70 53 57
Wales 5,958 63 47 50 5,996 62 47 48
Size
2-4 17,905 51 34 38 19,058 52 36 37
5-24 47,770 77 56 64 51,565 77 58 63
25-49 10,239 92 75 83 10,947 93 77 83
50-99 5,712 95 82 87 5,584 95 83 88
100-249 3,270 96 84 91 2,938 97 87 92
250+ 1,626 97 87 94 1,187 97 89 93
Sector
Agriculture 921 52 37 36 3,407 50 40 30
Mining & Quarrying
185 76 61 65 138 69 62 58
Manufacturing 7,653 61 43 48 7,422 59 43 45
Electricity, Gas & Water
1,406 76 60 61 1,148 75 60 59
Construction 6,576 58 46 38 7,202 56 45 37
Wholesale & Retail
15,163 60 36 50 17,287 61 40 50
Hotels & Restaurants
8,421 61 38 50 8,888 62 39 51
Transport & Comms.
7,810 61 42 48 6,890 63 46 48
Financial Services
1,853 76 52 67 2,330 77 54 66
Business Services
14,297 67 50 52 14,011 67 51 52
Public Administration
1,584 90 73 81 942 90 73 79
Education 5,422 91 80 81 5,796 92 80 82
Health & Social Work
8,067 89 73 78 8,460 89 75 77
Community, Social & Personal Services
7,164 69 50 56 7,358 69 52 56
Base: All establishments

139
Table A.4.2 Incidence of wider development activities (2013 and 2011)
2013
Row percentages
2013 Unwtd Base
2011 Unwtd Base
Supervision guiding
employees through their
job role
Opportunities for staff to watch others
carry out their roles
Allowed to
perform tasks
beyond their job
roles
Any 2013
Any 2011
UK 91,279 86,522 % 74 69 66 85 82
Country
England 75,255 74,156 % 75 69 67 85 82
Northern Ireland 4,014 3,921 % 70 65 60 81 83
Scotland 6,014 2,487 % 77 72 67 86 84
Wales 5,996 5,958 % 71 66 62 81 79
Size
2-4 19,058 17,905 % 63 58 58 76 73
5-24 51,565 47,770 % 85 80 74 93 91
25-49 10,947 10,239 % 92 89 79 98 96
50-99 5,584 5,712 % 94 90 79 98 97
100-249 2,938 3,270 % 96 91 83 99 98
250+ 1,187 1,626 % 96 90 84 99 99
Sector
Agriculture 3,407 921 % 52 50 44 66 69
Mining & Quarrying 138 185 % 83 66 65 90 87
Manufacturing 7,422 7,653 % 70 65 60 81 79
Electricity, Gas & Water 1,148 1,406 % 77 70 63 86 85
Construction 7,202 6,576 % 63 55 53 74 72
Wholesale & Retail 17,287 15,163 % 76 73 70 87 83
Hotels & Restaurants 8,888 8,421 % 81 73 69 88 85
Transport & Comms. 6,890 7,810 % 69 64 63 82 80
Financial Services 2,330 1,853 % 85 79 75 91 90
Business Services 14,011 14,297 % 73 67 67 84 81
Public Administration 942 1,584 % 89 83 78 96 95
Education 5,796 5,422 % 88 86 78 96 94
Health & Social Work 8,460 8,067 % 90 83 76 95 94
Community, Social & Personal Services
7,358 7,164 % 79 73 70 88 86
Base: All establishments

140
Table A.4.3 Reasons for not funding or arranging training over the last 12 months (unprompted)
2011 2013
UK UK England Northern Ireland
Scotland Wales
Unweighted Base 19,363 20,704 16,850 1,095 1,081 1,678
% % % % % %
All our staff are fully proficient / no need for training
64 69 69 64 69 68
No money available for training 11 10 10 13 10 10
Training is not a priority for the establishment
9 7 7 11 8 10
No training available in relevant subject area
7 5 5 6 4 5
Managers have lacked the time to organise training
3 3 3 4 4 3
Employees are too busy to undertake training
2 2 2 3 4 3
Employees are too busy to give training
1 2 2 3 3 3
External courses are too expensive 2 2 2 3 2 1
Learn by experience/as you go 3 2 2 2 1 1
Business not operating long enough/New business
1 1 1 1 2 1
Small firm/training not needed due to size of establishment
1 1 1 2 1 1
Trained staff will be poached by other employers
1 1 1 1 1 1
Courses interested in not available 1 1 * 1 1 1
No new staff (only train new staff) * 1 1 * * *
No particular reason 5 5 5 4 4 3
Base: establishments that had not funded or arranged training or development in the previous 12 months.
Note: responses are only shown if given by one per cent or more of respondents in 2013.
‘*’ denotes a figure larger than zero but smaller than 0.5

141
Table A.4.4 Whether trainers would have liked to provide more training, and if so the main barriers (prompted)
% w
ou
ld h
av
e lik
ed
to
pro
vid
e
mo
re t
rain
ing
Main barriers among those wanting to provide more training
Row percentages Unwtd Base
Unwtd Base
Lac
k o
f fu
nd
s/ tr
ain
ing
exp
en
siv
e
Ca
n’t
sp
are
tim
e f
or
em
plo
ye
es t
o b
e t
rain
ing
Dif
fic
ult
y f
ind
ing
pro
vid
er
to
deli
ver
wh
ere
an
d w
hen
we
wa
nt
Lac
k a
pp
rop
ria
te t
rain
ing
/
qu
alifi
cati
on
s i
n t
he s
ub
jec
ts
we
ne
ed
No
t a
ma
nag
em
en
t p
rio
rity
UK 2013 69,842 47 34,140 % 60 48 4 4 4
Country
England 57,787 46 27,735 % 60 47 4 4 4
Northern Ireland 2,894 52 1,545 % 64 50 6 5 3
Scotland 4,884 53 2,684 % 61 56 8 4 3
Wales 4,277 50 2,176 % 62 51 6 4 3
Size
2-4 9,580 44 4,154 % 61 45 5 5 5
5-24 40,801 49 19,849 % 59 50 4 4 4
25-49 10,123 50 5,084 % 62 52 3 4 4
50-99 5,315 51 2,771 % 63 51 4 2 3
100-249 2,864 56 1,606 % 66 51 4 3 3
250+ 1,159 59 676 % 69 54 3 2 4
Sector
Agriculture 1,710 35 602 % 45 49 7 7 4
Mining & Quarrying 103 48 44 % 34 58 2 3 1
Manufacturing 5,128 45 2,313 % 63 49 4 6 3
Electricity, Gas & Water 878 42 371 % 66 46 4 4 3
Construction 4,777 43 2,091 % 70 44 3 4 4
Wholesale & Retail 12,425 46 6,039 % 48 52 3 4 6
Hotels & Restaurants 6,761 50 3,619 % 53 44 3 2 6
Transport & Comms. 4,939 48 2,311 % 61 47 4 5 6
Financial Services 1,824 43 780 % 40 55 4 4 6
Business Services 11,127 44 4,944 % 62 51 4 4 3
Public Administration 861 51 436 % 63 46 6 3 3
Education 5,568 54 2,977 % 75 46 4 5 2
Health & Social Work 7,935 55 4,400 % 69 48 6 6 2
Community, Social & Personal Services
5,806 55 3,213 %
71 44 5 4 3
Base: Column 1: Establishments who had funded or arranged any training in the previous 12 months;
Columns 2-6 Establishments that had not funded or arranged training in the previous 12 months.
Note: responses are only shown if given by one per cent or more of respondents in 2013.
Figures in italics denote base size smaller than 50: figures should be treated with caution

142
Table A.4.5 Types of training provided over the last 12 months (prompted)
Row percentages
Unwtd Base
Jo
b s
pec
ific
He
alt
h &
Sa
fety
Ind
ucti
on
Ne
w t
ech
no
log
y
Ma
na
ge
me
nt
Su
pe
rvis
ory
UK 2011 66,439 % 85 75 57 47 35 35
UK 2013 69,842 % 85 74 58 48 35 34
Country
England 57,787 % 85 73 58 48 36 34
Northern Ireland 2,894 % 81 75 54 48 35 34
Scotland 4,884 % 87 74 58 51 33 34
Wales 4,277 % 87 76 58 49 37 38
Size
2-4 9,580 % 80 60 40 46 23 22
5-24 40,801 % 86 79 64 46 36 36
25-49 10,123 % 92 92 83 53 57 53
50-99 5,315 % 94 95 88 61 66 62
100-249 2,864 % 97 97 92 70 76 73
250+ 1,159 % 97 97 93 80 89 85
Sector
Agriculture 1,710 % 79 67 26 46 14 13
Mining & Quarrying 103 % 82 90 60 38 44 46
Manufacturing 5,128 % 82 79 57 46 26 29
Electricity, Gas & Water 878 % 87 87 67 41 40 40
Construction 4,777 % 77 79 50 35 22 28
Wholesale & Retail 12,425 % 84 76 62 52 42 41
Hotels & Restaurants 6,761 % 84 84 69 31 42 49
Transport & Comms. 4,939 % 84 60 46 60 26 23
Financial Services 1,824 % 92 63 59 58 44 38
Business Services 11,127 % 86 59 51 54 29 25
Public Administration 861 % 92 81 67 53 54 49
Education 5,568 % 92 90 73 60 60 43
Health & Social Work 7,935 % 90 86 71 40 45 45
Community, Social & Personal Services
5,806 % 85 74 56 43 31 31
Base: Establishments that had funded or arranged training in the previous 12 months.

143
Table A.4.6 Number employed and trained over the last 12 months by sector, and the proportion of the workforce trained
2011 2013
Base % of staff trained
Number employed
(000s)
Number trained (000s)
% of staff trained
Agriculture 1,710 39 382 158 41
Mining & Quarrying 103 46 56 30 53
Manufacturing 5,128 46 2,308 1,160 50
Electricity, Gas & Water 878 55 282 191 68
Construction 4,777 49 1,251 604 48
Wholesale & Retail 12,425 52 4,424 2,449 55
Hotels & Restaurants 6,761 55 1,800 1,063 59
Transport & Comms. 4,939 44 2,126 1,186 56
Financial Services 1,824 59 1,034 697 67
Business Services 11,127 52 4,468 2,701 60
Public Administration 861 61 1,433 962 67
Education 5,568 65 2,570 1,953 76
Health & Social Work 7,935 66 3,598 2,870 80
Community, Social & Personal Services
5,806 55 1,227 769 63
Base: Establishments that had funded or arranged training in the previous 12 months.
Note: ‘the percentage of staff trained’ refers to the number of staff trained over the last 12 months (whether or
not they still work at the establishment) as a percentage of the number of staff currently employed.
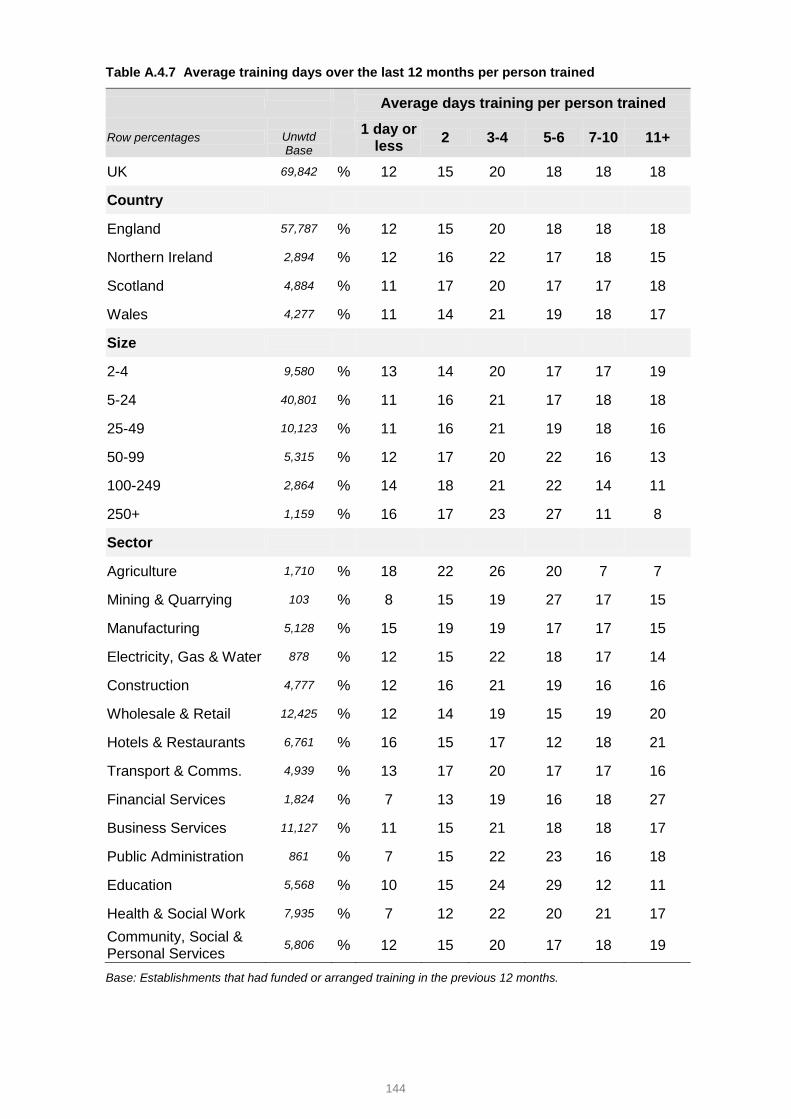
144
Table A.4.7 Average training days over the last 12 months per person trained
Average days training per person trained
Row percentages
Unwtd Base
1 day or less
2 3-4 5-6 7-10 11+
UK 69,842 % 12 15 20 18 18 18
Country
England 57,787 % 12 15 20 18 18 18
Northern Ireland 2,894 % 12 16 22 17 18 15
Scotland 4,884 % 11 17 20 17 17 18
Wales 4,277 % 11 14 21 19 18 17
Size
2-4 9,580 % 13 14 20 17 17 19
5-24 40,801 % 11 16 21 17 18 18
25-49 10,123 % 11 16 21 19 18 16
50-99 5,315 % 12 17 20 22 16 13
100-249 2,864 % 14 18 21 22 14 11
250+ 1,159 % 16 17 23 27 11 8
Sector
Agriculture 1,710 % 18 22 26 20 7 7
Mining & Quarrying 103 % 8 15 19 27 17 15
Manufacturing 5,128 % 15 19 19 17 17 15
Electricity, Gas & Water 878 % 12 15 22 18 17 14
Construction 4,777 % 12 16 21 19 16 16
Wholesale & Retail 12,425 % 12 14 19 15 19 20
Hotels & Restaurants 6,761 % 16 15 17 12 18 21
Transport & Comms. 4,939 % 13 17 20 17 17 16
Financial Services 1,824 % 7 13 19 16 18 27
Business Services 11,127 % 11 15 21 18 18 17
Public Administration 861 % 7 15 22 23 16 18
Education 5,568 % 10 15 24 29 12 11
Health & Social Work 7,935 % 7 12 22 20 21 17
Community, Social & Personal Services
5,806 % 12 15 20 17 18 19
Base: Establishments that had funded or arranged training in the previous 12 months.
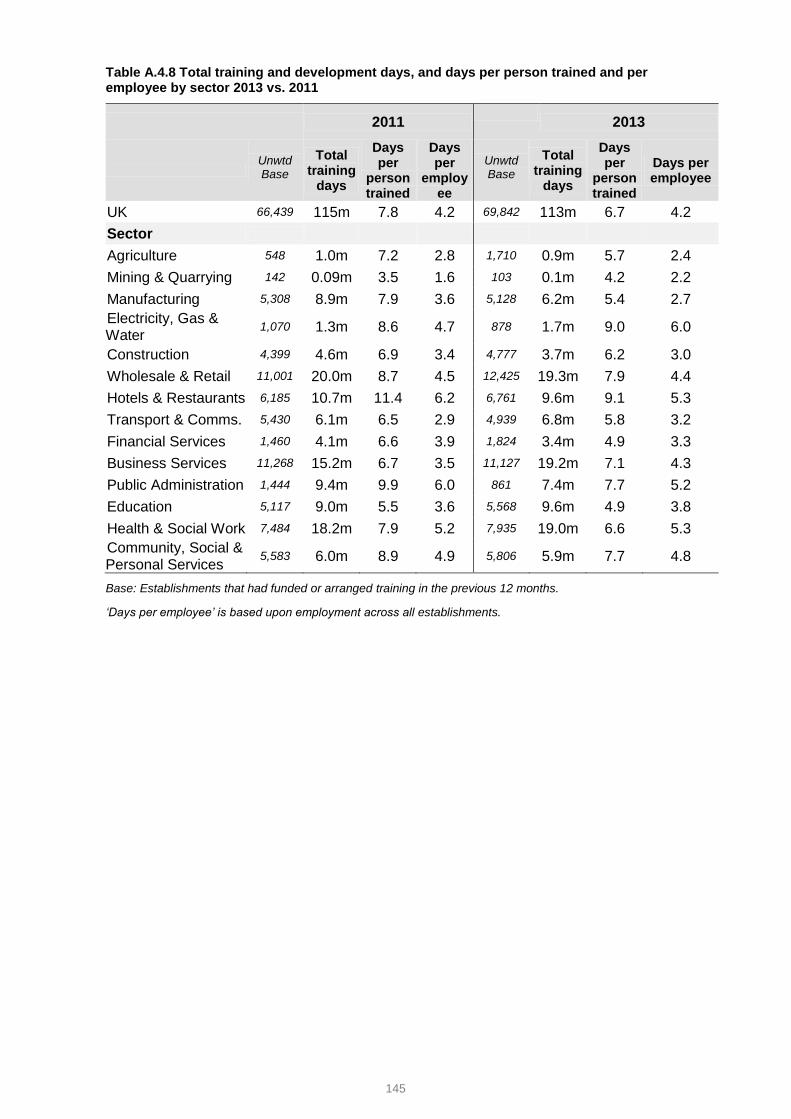
145
Table A.4.8 Total training and development days, and days per person trained and per employee by sector 2013 vs. 2011
2011
2013
Unwtd Base
Total training
days
Days per
person trained
Days per
employee
Unwtd Base
Total training
days
Days per
person trained
Days per employee
UK 66,439 115m 7.8 4.2 69,842 113m 6.7 4.2
Sector
Agriculture 548 1.0m 7.2 2.8 1,710 0.9m 5.7 2.4
Mining & Quarrying 142 0.09m 3.5 1.6 103 0.1m 4.2 2.2
Manufacturing 5,308 8.9m 7.9 3.6 5,128 6.2m 5.4 2.7
Electricity, Gas & Water
1,070 1.3m 8.6 4.7 878 1.7m 9.0 6.0
Construction 4,399 4.6m 6.9 3.4 4,777 3.7m 6.2 3.0
Wholesale & Retail 11,001 20.0m 8.7 4.5 12,425 19.3m 7.9 4.4
Hotels & Restaurants 6,185 10.7m 11.4 6.2 6,761 9.6m 9.1 5.3
Transport & Comms. 5,430 6.1m 6.5 2.9 4,939 6.8m 5.8 3.2
Financial Services 1,460 4.1m 6.6 3.9 1,824 3.4m 4.9 3.3
Business Services 11,268 15.2m 6.7 3.5 11,127 19.2m 7.1 4.3
Public Administration 1,444 9.4m 9.9 6.0 861 7.4m 7.7 5.2
Education 5,117 9.0m 5.5 3.6 5,568 9.6m 4.9 3.8
Health & Social Work 7,484 18.2m 7.9 5.2 7,935 19.0m 6.6 5.3
Community, Social & Personal Services
5,583 6.0m 8.9 4.9 5,806 5.9m 7.7 4.8
Base: Establishments that had funded or arranged training in the previous 12 months.
‘Days per employee’ is based upon employment across all establishments.

146
Table A.4.9 Training to nationally recognised qualifications in the last 12 months among employers that train
Row percentages
Unwtd Base
Any staff trained to a qualification
Number trained to a qualification
% of those trained to a qualification
% of all employees trained to a qualification
UK 69,842 47 3.6m 21 13
Size
2-4 9,580 36 0.3m 27 11
5-24 40,801 50 0.9m 26 14
25-49 10,123 63 0.5m 24 15
50-99 5,315 69 0.5m 23 15
100-249 2,864 75 0.5m 19 13
250+ 1,159 79 0.8m 16 11
Sector
Agriculture 1,710 40 * 26 11
Mining & Quarrying 103 57 * 23 12
Manufacturing 5,128 44 0.2m 18 9
Electricity, Gas & Water
878 54 * 21 14
Construction 4,777 51 0.2m 33 16
Wholesale & Retail 12,425 39 0.4m 15 8
Hotels & Restaurants 6,761 52 0.2m 22 13
Transport & Comms. 4,939 39 0.3m 23 13
Financial Services 1,824 42 0.1m 15 10
Business Services 11,127 40 0.5m 20 12
Public Administration 861 61 0.2m 19 13
Education 5,568 64 0.3m 15 11
Health & Social Work 7,935 65 0.9m 30 24
Community, Social & Personal Services
5,806 52 0.2m 29 18
Base: establishments that had funded or arranged training in the previous 12 months.
Note the final column shows the proportion of all employees in that size band or sector that were trained to a
qualification (not the proportion of employees within establishments that train).
Note: * refers to a figure of less than 50,000

147
Table A.4.10 Total training expenditure and training spend per person trained and per employee by sector (2011 vs. 2013)
2011 2013
Base Total
Spend per
person trained
Spend per
employee
Base Total
Spend per
person trained
Spend per employee
UK 11,027 £45.3bn £3,080 £1,680 12,522 £42.9bn £2,550 £1,590
Sector
Agriculture 87 £1.0bn £7,210 £2,810 297 £0.4bn £2,600 £1,080
Mining & Quarrying
29 £0.07bn £2,570 £1,190 21 ** ** **
Manufacturing 816 £3.2bn £2,850 £1,320 846 £2.5bn £2,190 £1,100
Electricity, Gas & Water
137 £0.3bn £2,000 £1,100 163 £0.3bn £1,530 £1,030
Construction 655 £2.5bn £3,710 £1,840 893 £2.5bn £4,060 £1,960
Wholesale & Retail
1,815 £5.0bn £2,160 £1,120 1,945 £6.4bn £2,600 £1,440
Hotels & Restaurants
1,055 £3.3bn £3,530 £1,930 1,091 £2.7bn £2,500 £1,470
Transport & Comms.
862 £2.9bn £3,140 £1,380 954 £3.3bn £2,750 £1,530
Financial Services
220 £1.4bn £2,330 £1,380 369 £1.3bn £1,880 £1,270
Business Services
2.036 £8.2bn £3,660 £1,890 2,337 £8.6bn £3,170 £1,920
Public Administration
231 £3.8bn £3,980 £2,410 213 £2.2bn £2,280 £1,530
Education 558 £6.2bn £3,780 £2,440 621 £5.3bn £2,730 £2,070
Health & Social Work
1,515 £5.1bn £2,190 £1,450 1,540 £5.1bn £1,790 £1,420
Community, Social & Personal Services
1,011 £2.2bn £3,340 £1,840 1,232 £2.3bn £2,990 £1,880
Base: Establishments completing the Investment in Training study.
Note: The figures for spend per person trained and per employee have been rounded to the nearest £10.
‘**’ denotes figure not shown because of a low base (fewer than 25 respondents); Figures in italics denote
base size smaller than 50: figures should be treated with caution

148
Table A.4.11 Training expenditure by sector, the proportion spent on off-the-job elements, and the breakdown of total training spend (both on-the job and off-the job training) by key elements
Row percentages Base Expenditure on training
% spent on off-the-job
training
Labour costs of trainees
Wages of
trainers
Fees to external
providers
Other
UK 12,522 £42.9bn 50 % 50 18 8 24
Sector
Agriculture 297 £0.4bn 58 % 43 16 10 30
Mining & Quarrying
21 ** 46 % ** ** ** **
Manufacturing 846 £2.5bn 43 % 54 19 9 18
Electricity, Gas & Water
163 £0.3bn 63 % 35 17 11 37
Construction 893 £2.5bn 51 % 47 20 9 24
Wholesale & Retail
1,945 £6.4bn 41 % 49 23 7 21
Hotels & Restaurants
1,091 £2.7bn 36 % 56 23 4 18
Transport & Comms.
954 £3.3bn 45 % 55 15 8 21
Financial Services 369 £1.3bn 43 % 48 26 9 17
Business Services 2,337 £8.6bn 50 % 49 19 10 22
Public Administration
213 £2.2bn 49 % 59 15 6 20
Education 621 £5.3bn 62 % 48 12 6 34
Health & Social Work
1,540 £5.1bn 58 % 51 15 6 28
Community, Social & Personal Services
1,232 £2.3bn 55 % 47 16 8 30
Base: establishments completing the Investment in Training study.
‘**’ denotes figure not shown because of a low base (fewer than 25 respondents).
The column ‘other’ includes such items as expenditure on training centres and on training management.

149
Table A.4.12 Training expenditure spent on Further Education colleges, Universities or other Higher Education institutions, and the proportion of the total fees to external providers that this represents
Row percentages Base Total fees to
external providers
Total fees to FE/HE providers
% of fees to external
providers paid to FE/HE providers
UK 12,522 £3.3bn £440m % 13
Country
England 8,704 £2.8bn £371m % 13
Northern Ireland 1,028 £0.1bn £10m % 13
Scotland 1,429 £0.3bn £44m % 15
Wales 1,361 £0.1bn £15m % 14
Size
2 to 4 2,317 £0.5bn £59m % 12
5 to 24 6,953 £1.0bn £161m % 16
25 to 49 1,722 £0.4bn £38m % 9
50 to 99 928 £0.4bn £49m % 11
100 to 249 452 £0.5bn £83m % 16
250+ 150 £0.4bn £49m % 13
Sector
Agriculture 297 £0.04bn £7m % 16
Mining & Quarrying 21 ** ** % **
Manufacturing 846 £0.2bn £39m % 17
Electricity, Gas & Water
163 £0.03bn £1m % 3
Construction 893 £0.2bn £30m % 14
Wholesale & Retail 1,945 £0.4bn £43m % 10
Hotels & Restaurants 1,091 £0.1bn £13m % 12
Transport & Comms. 954 £0.3bn £16m % 6
Financial Services 369 £0.1bn £10m % 9
Business Services 2,337 £0.9bn £141m % 16
Public Administration 213 £0.1bn £17m % 14
Education 621 £0.3bn £47m % 14
Health & Social Work 1,540 £0.3bn £52m % 16
Community, Social & Personal Services
1,232 £0.2bn £24m % 14
Base: establishments completing the Investment in Training study.
First column rounded to the nearest £0.01bn; second column to the nearest £1m
‘**’ denotes figure not shown because of a low base (fewer than 25 respondents).

150
Chapter 5: Recruitment of Young People
Table A.5.1 Recruitment of education leaver in past 2-3 years – by size and sector in England, Northern Ireland and Wales
Base: All establishments in England, Wales and Northern Ireland
Row percentages
Unwtd Base
Any education
leaver
16 year old school
leaver
17-18 year old school
leaver
17-18 year old FEC leaver
University
/ HE graduate
% % % %
England/NI/Wales 85,265 27 8 10 11 14
Size
2-4 17,949 13 3 3 4 5
5-24 48,387 37 10 14 15 17
25-49 10,078 59 18 27 29 36
50-99 5,102 67 19 32 34 46
100-249 2,674 77 24 43 44 60
250+ 1,075 81 30 51 54 69
Sector
Agriculture 2,888 13 5 3 5 3
Mining &Quarrying 117 18 6 8 6 8
Manufacturing 7,013 25 8 10 10 9
Electricity, Gas & Water
1,062 27 6 11 9 11
Construction 6,706 18 7 6 7 4
Wholesale & Retail 16,296 28 11 14 14 12
Hotels & Restaurants 8,317 35 14 20 20 17
Transport & Comms. 6,444 24 5 7 8 13
Financial Services 2,125 27 3 9 9 18
Business Services 13,227 25 4 7 8 17
Public admin 818 30 5 12 14 21
Education 5,442 50 6 13 16 39
Health & Social Work 7,892 33 5 12 17 17
Community, Social & Personal Services
6,918 31 13 12 14 12

151
Table A.5.2 Recruitment of education leaver in past 2-3 years – by size and sector in Scotland
Base: All establishments in Scotland
‘**’ denotes figure not shown because of a low base (fewer than 25 respondents); Figures in italics denote
base size smaller than 50: figures should be treated with caution
Row percentages
Base
Any Scottish
education leaver
Scottish School Leaver
Scottish FE Leaver
Scottish HE Leaver
% % % %
Scotland 6,014 26 17 11 12
Size
2-4 1,109 13 8 5 5
5-24 3,178 32 21 12 13
25-49 869 57 35 29 34
50-99 482 63 41 35 43
100-249 264 70 40 42 51
250+ 112 79 46 55 66
Sector
Agriculture 519 15 10 5 2
Mining &Quarrying 21 ** ** ** **
Manufacturing 409 29 22 10 9
Electricity, Gas & Water
86 29 19 10 10
Construction 496 24 19 4 5
Wholesale & Retail 991 28 20 12 11
Hotels & Restaurants 571 30 22 17 17
Transport & Comms. 446 17 9 6 7
Financial Services 205 21 10 5 13
Business Services 784 24 11 8 17
Public admin 124 26 9 11 18
Education 354 35 14 16 25
Health & Social Work 568 37 20 18 18
Community, Social & Personal Services
440 30 20 15 11

152
Table A.5.3 Recruitment of young people and education leavers, by nation
Row percentages
Unwtd Base
An
y r
ec
ruit
me
nt
An
y e
du
ca
tio
n l
eav
er
Unwtd Base
An
y y
ou
ng
pe
rso
n
Re
cru
ite
d y
ou
ng
pers
on
fro
m e
du
ca
tio
n o
nly
Re
cru
ite
d y
ou
ng
pers
on
bu
t n
ot
fro
m e
du
ca
tio
n
Re
cru
ite
d y
ou
ng
pe
op
le
bo
th f
rom
ed
uca
tio
n
an
d n
ot
UK 91,279 % 64 27 45,644 44 12 20 13
Country
England 75,255 % 64 27 37,559 45 12 20 13
Northern Ireland 4,014 % 54 22 2,015 35 10 17 9
Scotland 6,014 % 67 29 3,044 46 12 21 13
Wales 5,996 % 61 27 3,026 45 13 19 13
Size
2-4 19,058 % 45 13 9,532 25 8 13 4
5-24 51,565 % 81 36 25,704 60 17 27 16
25-49 10,947 % 95 59 5,545 82 19 28 35
50-99 5,584 % 97 67 2,802 87 18 26 43
100-249 2,938 % 98 77 1,472 93 15 21 57
250+ 1,187 % 99 81 589 94 11 16 67
Sector
Agriculture 3,407 % 34 13 1,725 23 12 20 13
Mining & Quarrying 138 % 58 20 76 41 9 11 3
Manufacturing 7,422 % 62 26 3,763 42 12 21 7
Electricity, Gas & Water 1,148 % 70 27 571 48 12 21 10
Construction 7,202 % 48 18 3,623 30 8 26 14
Wholesale & Retail 17,287 % 66 28 8,731 47 10 15 6
Hotels & Restaurants 8,888 % 69 35 4,359 59 13 21 13
Transport & Comms. 6,890 % 60 24 3,427 39 10 28 21
Financial Services 2,330 % 70 27 1,169 49 11 17 11
Business Services 14,011 % 64 25 6,939 41 11 25 14
Public Administration 942 % 78 30 480 49 12 18 11
Education 5,796 % 84 49 2,907 62 10 23 16
Health & Social Work 8,460 % 81 33 4,221 53 21 20 22
Community, Social & Personal Services
7,358 % 67 32 3,653 48 11 24 18
Base: Columns one and two all establishments; remainder all establishments in Module 2.

153
Table A.5.4 Preparedness of education leavers recruited in past 2-3 years, by type of leaver and size in England, Northern Ireland and Wales
England/Wales/NI All 2 to 4 5 to 24 25 to 49 50 to 99 100 to 249 250+
Unwtd base 10,060 634 5,416 1,864 1,080 700 366
Very well prepared 11 15 10 8 7 7 4
16 year old school leavers
Well prepared 48 41 48 53 53 55 52
Poorly Prepared 29 28 29 28 30 27 30
Very poorly prepared 7 12 7 5 3 2 3
14,471 602 7,477 2,831 1,796 1,179 586
Very well prepared 10 15 10 9 8 7 5
17-18 year old school leavers
Well prepared 56 48 56 60 61 60 60
Poorly Prepared 24 23 25 24 24 22 23
Very poorly prepared 5 11 5 4 2 1 2
15,435 754 7,981 2,994 1,876 1,217 613
Very well prepared 13 16 13 13 11 11 7
17-18 FE College leavers
Well prepared 61 52 61 65 68 65 70
Poorly Prepared 18 21 18 17 14 15 12
Very poorly prepared 4 8 3 2 1 1 1
17,770 782 8,588 3,647 2,368 1,629 756
Very well prepared 24 22 23 27 25 24 21
University/HE leavers
Well prepared 60 53 60 62 63 64 66
Poorly Prepared 11 16 11 7 7 6 5
Very poorly prepared 2 5 2 1 * * -
Base: Establishments in England, Northern Ireland and Wales who had taken on each type of education leaver
‘-‘ denotes zero; ‘*’ denotes a figure larger than zero but smaller than 0.5
Figures in italics denote base size smaller than 50: figures should be treated with caution

154
Table A.5.4(i) Preparedness of education leavers recruited in past 2-3 years, by type of leaver and size in Scotland
Base: Establishments in Scotland who had taken on each type of education leaver
‘-‘ denotes zero; ‘*’ denotes a figure larger than zero but smaller than 0.5
Figures in italics denote base size smaller than 50: figures should be treated with caution
Scotland
All 2 to 4 5 to 24 25 to 49 50 to 99 100 to 249 250+
1,514 90 724 312 214 114 60
Very well prepared 10 12 11 5 5 7 4
Scottish Secondary School leavers
Well prepared 55 53 51 61 63 62 72
Poorly Prepared 25 22 28 23 22 22 16
Very poorly prepared 4 8 4 3 4 1 -
1,095 46 426 257 183 118 65
Very well prepared 12 20 11 10 8 8 10
Scottish FE College Leavers
Well prepared 66 49 65 78 76 73 74
Poorly Prepared 14 19 16 10 10 9 10
Very poorly prepared 3 7 3 1 - 1 -
1,258 37 485 299 226 143 68
Very well prepared 23 28 22 23 21 24 17
Scottish HE Leavers
Well prepared 62 53 62 66 69 65 78
Poorly Prepared 8 10 8 7 9 5 1
Very poorly prepared * - 1 - - - -

155
Table A.5.5 Preparedness of education leavers recruited in past 2-3 years, by type of leaver 2013 v 2011
Base: Establishments who had taken on each type of education leaver
‘*’ denotes a figure larger than zero but smaller than 0.5
England/Wales/NI 2011 2013
Unwtd base 10,962 10,060
16 year old school leavers Very well prepared 11 11
Well prepared 48 48
Poorly Prepared 28 29
Very poorly prepared 9 7
13,871 14,471
17-18 year old school leavers Very well prepared 10 10
Well prepared 56 56
Poorly Prepared 24 24
Very poorly prepared 6 5
13,008 15,435
17-18 FE College leavers Very well prepared 13 13
Well prepared 61 61
Poorly Prepared 18 18
Very poorly prepared 4 4
15,680 17,770
University/HE leavers Very well prepared 24 24
Well prepared 59 60
Poorly Prepared 11 11
Very poorly prepared 2 2
Scotland
743 1,514
Scottish Secondary School leavers
Very well prepared 10 10
Well prepared 59 55
Poorly Prepared 24 25
Very poorly prepared 5 4
552 1,095
Scottish FE College Leavers Very well prepared 16 12
Well prepared 64 66
Poorly Prepared 14 14
Very poorly prepared 2 3
636 1,258
Scottish HE Leavers Very well prepared 28 23
Well prepared 58 62
Poorly Prepared 8 8
Very poorly prepared 1 *

156
Table A.5.5 (i) Preparedness of education leavers recruited in past 2-3 years, by sector (i)
England/Wales/NI
All
Ag
ricu
ltu
re
Min
ing
an
d
Qu
arr
yin
g
Man
ufa
ctu
rin
g
Ele
ctr
icit
y,
Gas a
nd
Wate
r
Co
nstr
ucti
on
Wh
ole
sale
&
Reta
il
Ho
tels
an
d
Resta
ura
nts
Unwtd base 10,060 160 8 754 68 706 2,865 1,925
Very well prepared 11 24 ** 10 14 10 10 9 16 year old school leavers
Well prepared 48 44 ** 44 42 48 53 46 Poorly Prepared 29 22 ** 35 31 26 26 32
Very poorly prepared 7 6 ** 8 10 11 5 6 14,471 107 12 927 109 681 3,869 2,777
Very well prepared 10 9 ** 9 11 10 10 10 17-18 year old school leavers
Well prepared 56 47 ** 50 47 53 61 55 Poorly Prepared 24 32 ** 30 29 23 22 24
Very poorly prepared 5 9 ** 6 5 9 3 5 15,435 153 11 989 97 683 3,707 2,762
Very well prepared 13 20 ** 14 14 15 13 12 17-18 FE College leavers
Well prepared 61 57 ** 60 48 59 65 62 Poorly Prepared 18 16 ** 19 26 17 15 18
Very poorly prepared 4 5 ** 3 8 7 3 3 17,770 100 15 849 116 394 3,092 2,508
Very well prepared 24 25 ** 23 22 24 25 20 University/HE leavers Well prepared 60 50 ** 58 62 60 61 67 Poorly Prepared 11 17 ** 12 10 8 10 8 Very poorly prepared 2 5 ** 3 2 3 1 1 Scotland
1,514 50 4 128 19 124 348 224
Very well prepared 10 13 ** 10 ** 10 7 12 Scottish Secondary School leavers
Well prepared 55 54 ** 55 ** 55 57 50 Poorly Prepared 25 30 ** 26 ** 25 22 30
Very poorly prepared 4 - ** 4 ** 7 8 3 1,095 29 6 77 11 37 220 185
Very well prepared 12 27 ** 6 ** 14 9 8 Scottish FE College Leavers
Well prepared 66 51 ** 73 ** 59 69 71 Poorly Prepared 14 12 ** 15 ** 26 15 12
Very poorly prepared 3 9 ** 1 ** - 4 4 1,258 16 6 71 8 34 214 183
Very well prepared 23 ** ** 24 ** 28 27 21
Scottish HE Leavers Well prepared 62 ** ** 64 ** 66 62 52 Poorly Prepared 8 ** ** 9 ** 3 3 19
Very poorly prepared * ** ** - ** 3 - 2

157
Table A.5.5 (ii) Preparedness of education leavers recruited in past 2-3 years, by sector (ii)
England/ Wales/NI
All
Tra
nsp
ort
an
d C
om
ms
Fin
an
cia
l
Serv
ices
Bu
sin
es
s
Serv
ices
Pu
blic A
dm
in
Ed
ucati
on
Healt
h a
nd
So
cia
l W
ork
Co
mm
un
ity,
So
cia
l an
d
Pers
on
al
Se
r.
Unwtd base 10,060 433 65 869 38 389 571 1,209
Very well prepared 11 13 6 11 5 11 10 11 16 year old school leavers
Well prepared 48 45 47 46 59 49 47 44
Poorly Prepared 29 27 34 30 28 28 29 31
Very poorly prepared
7 12 10 8 - 6 8 10
14,471 606 189 1,546 105 837 1,378 1,328
Very well prepared 10 12 10 10 10 12 10 12 17-18 year old school leavers
Well prepared 56 50 57 54 59 60 54 55
Poorly Prepared 24 25 25 24 20 19 29 25
Very poorly prepared
5 8 5 8 2 4 3 5
15,435 721 204 1,700 126 1,019 1,852 1,411
Very well prepared 13 12 8 13 11 15 14 15 17-18 FE College leavers
Well prepared 61 52 63 57 59 64 61 57
Poorly Prepared 18 25 21 22 18 14 18 19
Very poorly prepared
4 5 3 5 1 3 2 4
17,770 1,106 395 3,385 184 2,555 1,765 1,306
Very well prepared 24 21 19 21 23 36 23 27 University/HE leavers
Well prepared 60 54 65 58 65 55 61 57
Poorly Prepared 11 14 11 15 5 5 10 10
Very poorly prepared
2 4 1 2 * * 2 2
Scotland
1,514 71 23 151 14 72 148 138
Very well prepared 10 19 ** 4 ** 12 6 22 Scottish Secondary School leavers
Well prepared 55 42 ** 58 ** 61 55 47
Poorly Prepared 25 30 ** 29 ** 15 32 20
Very poorly prepared
4 2 ** 1 ** 6 2 5
1,095 41 11 118 16 83 162 99
Very well prepared 12 11 ** 5 ** 18 21 20 Scottish FE College Leavers
Well prepared 66 69 ** 73 ** 73 66 40
Poorly Prepared 14 12 ** 9 ** 9 8 29
Very poorly prepared
3 - ** 1 ** - 1 10
1,258 62 24 229 26 141 144 100
Very well prepared 23 28 ** 22 ** 40 15 20 Scottish HE Leavers
Well prepared 62 60 ** 58 ** 53 75 70 Poorly Prepared 8 8 ** 10 ** 5 5 5
Very poorly prepared
* - ** - ** - 1 -
Base: Establishments who had taken on each type of education leaver‘ -‘ denotes zero; ‘*’ denotes a figure larger than zero but smaller than 0.5 Figures in italics denote base size smaller than 50: figures should be treated with caution

158
Table A.5.7 Recruitment of education leavers in the past 2-3 years – by size and sector in England, Northern Ireland and Wales (2011 vs. 2013)
Base: All establishments in England, Northern Ireland and Wales
2011 2013
Row percentages
Unwtd Base
16 y
ea
r o
ld
sch
oo
l le
av
er
17-1
8 y
ea
r o
ld
sch
oo
l le
av
er
17-1
8 y
ea
r o
ld
FE
C l
eav
er
Un
ive
rsit
y/H
E
gra
du
ate
Unwtd Base
16 y
ear
old
sch
oo
l le
ave
r
17-1
8 y
ea
r o
ld
sch
oo
l le
av
er
17-1
8 y
ea
r o
ld
FE
C l
eav
er
Un
ive
rsit
y H
E
leav
er
Eng/NI/Wal 84,035 9 11 10 12 85,265 8 10 11 14 Size
2-4 17,608 5 5 5 5 17,949 3 3 4 5
5-24 46,875 12 14 13 15 48,387 10 14 15 17
25-49 9,837 17 25 23 29 10,078 18 27 29 36
50-99 5,299 20 29 27 39 5,102 19 32 34 46
100-249 2,947 21 35 31 50 2,674 24 43 44 60
250+ 1,469 33 47 44 60 1,075 30 51 54 69
Sector
Agriculture 836 7 6 6 3 2,888 5 3 5 3
Mining &Quarrying 161 8 11 3 8 117 6 8 6 8
Manufacturing 7,477 9 10 9 8 7,013 8 10 10 9
Electricity, Gas & Water
1,324 7 9 9 10 1,062 6 11 9 11
Construction 6,347 11 8 8 4 6,706 7 6 7 4
Wholesale & Retail 14,846 12 14 12 10 16,296 11 14 14 12
Hotels & Restaurants
8,202 13 18 16 14 8,317 14 20 20 17
Transport & Comms. 7,586 6 7 7 12 6,444 5 7 8 13
Financial Services 1,762 4 10 9 18 2,125 3 9 9 18
Business Services 13,954 4 7 7 15 13,227 4 7 8 17
Public admin 1,448 5 10 10 18 818 5 12 14 21
Education 5,258 7 12 14 38 5,442 6 13 16 39
Health & Social Work
7,860 5 11 13 15 7,892 5 12 17 17
Community, Social & Personal Services
6,974 14 12 13 11 6,918 13 12 14 12

159
Table A.5.8 Recruitment of education leaver in past 2-3 years – by size and sector in Scotland (2011 vs. 2013)
Base: All establishments in Scotland
‘**’ denotes figure not shown because of a low base (fewer than 25 respondents).
2011 2013
Row percentages
Unwtd Base
Sco
ttis
h
Sch
oo
l
Leave
r
Sco
ttis
h F
E
Leave
r
Sco
ttis
h H
E
Leave
r
Unwtd Base
Sco
ttis
h
Sch
oo
l
Leave
r
Sco
ttis
h F
E
Leave
r
Sco
ttis
h H
E
Leave
r
Scotland 2,487 17 10 11 6,014 17 11 12
Size
2-4 297 9 4 3 1,109 8 5 5
5-24 895 21 12 13 3,178 21 12 13
25-49 402 35 26 29 869 35 29 34
50-99 413 36 30 35 482 41 35 43
100-249 323 41 37 53 264 40 42 51
250+ 157 57 56 56 112 46 55 66
Sector
Agriculture 85 15 10 2 519 10 5 2
Mining &Quarrying 24 ** ** ** 21 ** ** **
Manufacturing 176 21 12 11 409 22 10 9
Electricity, Gas & Water
82 15 7 10 86 19 10 10
Construction 229 22 6 4 496 19 4 5
Wholesale & Retail 317 21 11 11 991 20 12 11
Hotels & Restaurants 219 23 17 12 571 22 17 17
Transport & Comms. 224 13 4 11 446 9 6 7
Financial Services 91 20 10 16 205 10 5 13
Business Services 343 10 8 12 784 11 8 17
Public admin 136 8 9 16 124 9 11 18
Education 164 12 20 24 354 14 16 25
Health & Social Work 207 11 12 16 568 20 18 18
Community, Social & Personal Services
190 20 6 6 440 20 15 11

160
Chapter 6: High Performance Working
Table A.6.1 Summary of skills shortages by HPW classification and size
Base: All establishments by HPW classification and size.
‘HtFVs / vacs’ is shown as all hard-to-fill vacancies as a proportion of all private sector vacancies; ‘‘SSVs / vacs’ is shown as all skill-shortage vacancies as a proportion of all private sector vacancies; ‘SSVs / HtFVs’ is shown as all skill-shortage vacancies as a proportion of all hard-to-fill private sector vacancies.
Have vacancies Have HtFVs Have SSVs HtFVs / vacs SSVs / vacs SSVs / HtFVs
Row percentages Unwtd Base % % % % % %
HPW employers
2-4 426 15 6 5 42 36 85
5-24 4,026 23 7 6 28 24 85
25-49 1,537 37 10 8 26 19 73
50-99 1,003 48 14 11 29 24 83
100-249 721 61 19 16 20 15 73
250+ 392 61 21 19 16 14 93
Non-HPW Employers
2-4 9,100 8 3 2 46 32 69
5-24 21,835 15 5 4 35 27 77
25-49 3,865 30 9 7 27 19 69
50-99 1,779 39 10 8 25 18 69
100-249 745 57 18 15 30 25 85
250+ 206 70 18 16 15 14 97

161
Table A.6.2 Incidence, number and density of skills gaps among HPW employers and non-HPW employers, by size band
Row percentages Unwtd Base
% of establishments with any skills
gaps
Number of staff not fully
proficient (skills gaps)
% of staff reported as
having skills gaps
HPW employers
2-4 426 6 3,500 2.6
5-24 4,026 22 53,800 4.8
25-49 1,537 33 50,600 5.3
50-99 1,003 37 71,700 5.9
100-249 721 44 103,900 5.1
250+ 392 48 270,900 5.4
Non-HPW employers
2-4 9,100 7 64,100 2.8
5-24 21,835 21 261,500 4.9
25-49 3,865 32 115,400 5.0
50-99 1,779 35 108,100 4.9
100-249 745 41 106,100 5.3
250+ 206 51 180,300 7.8
Base: Column one all establishments in Module 1 by HPW classification and size; remainder all employment
in Module 1 by HPW classification and size.
Note: The number of employees not fully proficient has been rounded to the nearest 100.

162
Table A.6.3 Training activity among HPW employers and non-HPW employers by size band and sector
Row percentages Unwtd Base
Any training Proportion of staff
trained
% %
Size
HPW employers
2-4 426 95 88
5-24 4,026 98 77
25-49 1,537 98 73
50-99 1,003 99 75
100-249 721 99 74
250+ 392 99 74
Non-HPW employers
2-4 9,100 50 40
5-24 21,835 75 51
25-49 3,865 91 60
50-99 1,779 93 63
100-249 745 97 65
250+ 206 93 63
Sector
HPW employers
Agriculture 31 100 76
Mining and Quarrying 13 ** **
Manufacturing 428 99 67
Electricity, Gas and Water 97 99 64
Construction 239 97 70
Wholesale and Retail 1,797 97 73
Hotels and Restaurants 929 95 78
Transport and Communications 380 93 61
Financial Services 265 96 81
Business Services 1,242 98 76
Public Administration 182 98 68
Education 872 100 80
Health and Social Work 1,008 99 83
Community, Social & Personal Service Activities
622 98 77
Non-HPW employers
Agriculture 1,651 49 42
Mining and Quarrying 49 53 41
Manufacturing 3,231 58 42
Electricity, Gas and Water 480 70 64
Construction 3,340 54 45
Wholesale and Retail 6,759 57 46
Hotels and Restaurants 3,600 58 54
Transport and Communications 3,083 62 49
Financial Services 896 74 65
Business Services 5,830 63 51
Public Administration 280 86 72
Education 2,017 91 73
Health and Social Work 3,231 88 78
Community, Social & Personal Service Activities
3,083 64 59
Base: All establishments in Module 1 by HPW classification.

163
Table A.6.4 Profile of private sector employers in each Product Market Strategy classification by country and sector
Very Low Low Medium High Very High
Base 2,818 9,507 19,333 23,106 12,729
% % % % %
Country
England 80 82 84 86 86
Northern Ireland 4 4 3 3 2
Scotland 9 8 8 7 7
Wales 7 5 5 4 4
Sector
Agriculture 16 10 6 3 2
Mining and Quarrying - - - - -
Manufacturing 5 6 7 7 8
Electricity, Gas and Water 1 1 1 1 1
Construction 15 14 12 9 7
Wholesale and Retail 22 22 23 23 22
Hotels and Restaurants 11 11 10 9 10
Transport and Communications
9 8 7 8 8
Financial Services 2 2 3 3 3
Business Services 14 18 22 25 24
Public Administration - - - 1 1
Education 1 - 1 1 2
Health and Social Work 1 2 3 5 5
Community, Social & Personal Service Activities
3 5 5 6 7
Base: All private sector establishments in each PMS classification by country and sector.
‘-‘ denotes a figure of zero.

164
Table A.6.5 Profile of hard-to-fill vacancies at 1- digit SOC level by Product Market Strategy
% of hard-to-fill vacancies
Very low Low Medium High Very high
Base 204 966 2,657 3,924 2,885
Column % % % % % %
Occupation
Managers 4 4 4 3 3
Professionals 9 10 11 18 17
Associate professionals 4 12 14 17 23
Administrative / clerical staff 4 4 7 8 4
Skilled trades occupations 29 23 14 14 12
Caring, leisure and other services staff
14 11 21 17 18
Sales and customer service staff
17 10 9 7 7
Machine operatives 11 9 8 5 5
Elementary staff 9 18 12 10 7
Base: All private sector hard-to-fill vacancies; up to six occupations followed up
Table A.6.6 Profile of skill-shortage fill vacancies at 1-digit SOC level by Product Market Strategy
% of skill-shortage vacancies
Very low Low Medium High Very high
Base 137 742 2,086 3,056 2,244
Column % % % % % %
Occupation
Managers 1 4 4 3 3
Professionals 11 12 10 20 20
Associate professionals 4 14 15 19 24
Administrative / clerical staff 5 3 7 9 3
Skilled trades occupations 37 25 16 15 13
Caring, leisure and other services staff
15 10 20 15 17
Sales and customer service staff
11 9 10 7 5
Machine operatives 9 9 5 5 6
Elementary staff 7 13 11 7 6
Base: All private sector skill-shortage vacancies; up to six occupations followed up
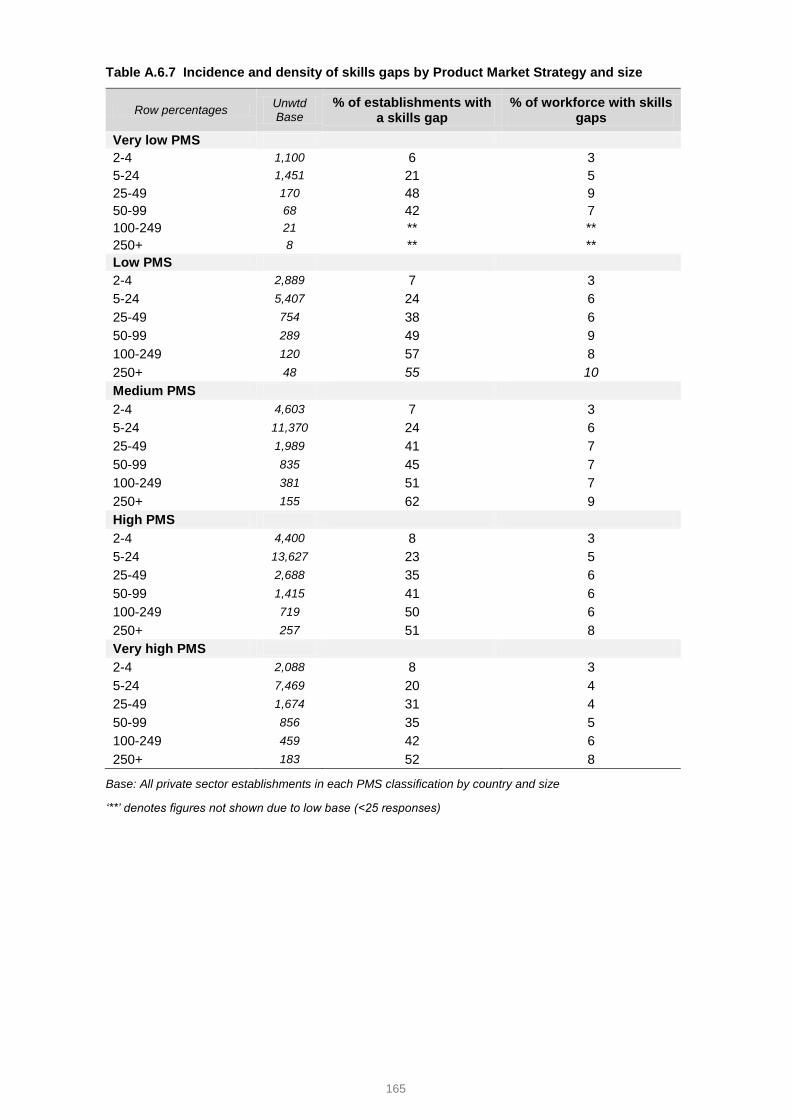
165
Table A.6.7 Incidence and density of skills gaps by Product Market Strategy and size
Row percentages Unwtd Base
% of establishments with a skills gap
% of workforce with skills gaps
Very low PMS
2-4 1,100 6 3
5-24 1,451 21 5
25-49 170 48 9
50-99 68 42 7
100-249 21 ** **
250+ 8 ** **
Low PMS
2-4 2,889 7 3
5-24 5,407 24 6
25-49 754 38 6
50-99 289 49 9
100-249 120 57 8
250+ 48 55 10
Medium PMS
2-4 4,603 7 3
5-24 11,370 24 6
25-49 1,989 41 7
50-99 835 45 7
100-249 381 51 7
250+ 155 62 9
High PMS
2-4 4,400 8 3
5-24 13,627 23 5
25-49 2,688 35 6
50-99 1,415 41 6
100-249 719 50 6
250+ 257 51 8
Very high PMS
2-4 2,088 8 3
5-24 7,469 20 4
25-49 1,674 31 4
50-99 856 35 5
100-249 459 42 6
250+ 183 52 8
Base: All private sector establishments in each PMS classification by country and size
‘**’ denotes figures not shown due to low base (<25 responses)

166
Table A.6.8 Training provision over the last 12 months by Product Market Strategy and size
Row percentages Unwtd Base
Any training Proportion of staff trained
% %
Very low PMS 2-4 1,100 39 29 5-24 1,451 63 39 25-49 170 82 51 50-99 68 80 43 100-249 21 ** ** 250+ 8 ** ** Low PMS 2-4 2,889 44 32 5-24 5,407 70 44 25-49 754 90 52 50-99 289 95 59 100-249 120 93 60 250+ 48 97 68 Medium PMS 2-4 4,603 50 37 5-24 11,370 76 50 25-49 1989 90 56 50-99 835 95 62 100-249 381 97 64 250+ 155 96 62 High PMS 2-4 4,400 55 44 5-24 13,627 79 54 25-49 2,688 93 60 50-99 1,415 94 63 100-249 719 98 66 250+ 257 98 69 Very high PMS 2-4 2,088 56 46 5-24 7,469 80 58 25-49 1,674 93 61 50-99 856 95 63 100-249 459 99 68 250+ 183 99 72
Base: All private sector establishments in each PMS classification by size.
‘Proportion of staff trained’ is shown as a proportion of all private sector employment
‘**’ denotes figure not shown because of a low base (fewer than 25 respondents); Figures in italics denote
base size smaller than 50: figures should be treated with caution

167
Annex B: National Time Series Tables
The UK Commission’s Employer Skills Survey 2011 and 2013 was designed in such a
way as to preserve key time series measures from the previous surveys carried out
previously by the individual nations where possible.
The eligible employer population and weighting strategy 2013 survey was different to that
used in 2011 (see the accompanying Technical Report for details); therefore the 2011
data has been reweighted to give comparable time series data.
For the constituent nations of the UK, the degree to which we can track time series prior
to 2011 depends on the approach the nation took to their predecessor skills survey.
England: England carried out the National Employer Skills Survey (NESS) biennially
from 2005, and annually from 2001 prior to this. The population used in NESS matches
that used in UKCESS 2013 (2+ employment), therefore we can make some comparisons
over a longer time period. It should be noted that the weighting strategy of the NESS
surveys was based on SSC sectors rather than the 14 broad SIC sectors used in 2011
and 2013, therefore some caution needs to be exercised when making comparisons with
data prior to 2011.
Northern Ireland: The Northern Ireland Skills Monitoring Survey (NISMS) was conducted
in 2005 and 2008 on a 1+employee population. This does not match the population used
in UKCESS 2013, therefore no time series comparisons can be drawn prior to 2011.
Scotland: The Scottish Employer Skills Survey (SESS) ran annually from 2006 to 2010.
The surveys were conducted using a 1+employee population which does not match the
population used in UKCESS 2013, therefore no time series comparisons can be drawn
prior to 2011.
Wales: Future Skills Wales (FSW) was conducted in 2005 on a 2+ employment
population. This gives some scope to make comparisons with this point in time, however
it should be noted that the weighting strategy employed in 2005 used different sector and
sizeband definitions to those used in 2011 and 2013, therefore some caution needs to be
exercised when making comparisons with the 2005 data.

168
England Time Series: Key Figures
NE
SS
03
NE
SS
05
NE
SS
07
NE
SS
09
UK
CE
SS
20
11
UK
CE
SS
20
13
Vacancies and skill-shortage vacancies
% of establishments with any vacancies 17% 17% 18% 12% 14% 15%
% of establishments with any hard-to-fill vacancies
8% 7% 7% 3% 5% 5%
% with SSVs n/a 5% 5% 3% 3% 4%
% of all vacancies which are SSVs n/a 25% 21% 16% 15% 22%
Number of vacancies 679,000 573,900 619,700 385,700 501,200 559,600
Number of hard-to-fill vacancies 271,000 203,600 183,500 85,400 107,100 160,000
Number of skill-shortage vacancies 135,000 143,100 130,000 63,100 76,900 124,800
Skills gaps
% of establishments with any staff not fully proficient
22% 16% 15% 19% 17% 15%
Number of skills gaps 2.4m 1.26m 1.36m 1.70m 1.28m 1.17m
Number of staff not fully proficient as a % of employment
11% 6% 6% 7% 6% 5%
Training
% of establishments training staff over the last 12 months
59% 65% 67% 68% 65% 66%
% of establishments providing off-the-job training in the last 12 months
n/a 46% 46% 51% 47% 48%
% of workforce trained 53% 61% 63% 56% 54% 62%
Total number of training days n/a n/a n/a 109m 97m 95m
Total training expenditure ** ** ** ** £38.6bn £36.0bn
**Eurostat data used for calculating total training spend was subject to an adjustment in 2013, therefore no
data is available prior to 2011 that is directly comparable with 2011 and 2013 data.

169
Northern Ireland Time Series: Key Figures
UK
CE
SS
20
11
UK
CE
SS
20
13
Vacancies and skill-shortage vacancies
% of establishments with any vacancies 10% 10%
% of establishments with any hard-to-fill vacancies 3% 3%
% with SSVs 2% 3%
% of all vacancies which are SSVs 21% 19%
Number of vacancies 18,400 15,200
Number of hard-to-fill vacancies 5,000 4,000
Number of skill-shortage vacancies 3,900 2,900
Skills gaps
% of establishments with any staff not fully proficient 13% 14%
Number of skills gaps 34,100 37,700
Number of staff not fully proficient as a % of employment 4% 5%
Training
% of establishments training staff over the last 12 months 65% 63%
% of establishments providing off-the-job training in the last 12 months
48% 49%
% of workforce trained 56% 59%
Total number of training days 2.71m 2.69m
Total training expenditure £1.2bn £1.1bn

170
Scotland Legacy Time Series: Key Figures
UK
CE
SS
20
11
UK
CE
SS
20
13
Vacancies and skill-shortage vacancies
% of establishments with any vacancies 14% 15%
% of establishments with any hard-to-fill vacancies 4% 6%
% with SSVs 3% 4%
% of all vacancies which are SSVs 15% 25%
Number of vacancies 44,500 54,500
Number of hard-to-fill vacancies 9,100 18,200
Number of skill-shortage vacancies 6,700 13,400
Skills gaps
% of establishments with any staff not fully proficient 21% 19%
Number of skills gaps 121,000 135,100
Number of staff not fully proficient as a % of employment 5% 6%
Training
% of establishments training staff over the last 12 months 73% 70%
% of establishments providing off-the-job training in the last 12 months
53% 53%
% of workforce trained 58% 65%
Total number of training days 9.8m 10.0m
Total training expenditure £4bn £4.2bn

171
Wales Legacy Time Series: Key Figures
FS
W 0
5
UK
CE
SS
20
11
UK
CE
SS
20
13
Vacancies and skill-shortage vacancies
% of establishments with any vacancies 21% 12% 14%
% of establishments with any hard-to-fill vacancies 10% 4% 5%
% with SSVs 4% 3% 4%
% of all vacancies which are SSVs 14% 18% 20%
Number of vacancies 37,900 22,500 25,700
Number of hard-to-fill vacancies 13,200 6,600 7,200
Number of skill-shortage vacancies 5,400 4,000 5,100
Skills gaps
% of establishments with any staff not fully proficient 18% 16% 16%
Number of skills gaps 63,800 53,900 67,400
Number of staff not fully proficient as a % of employment 6% 5% 6%
Training
% of establishments training staff over the last 12 months n/a 63% 62%
% of establishments providing off-the-job training in the last 12 months
n/a 47% 47%
% of workforce trained n/a 56% 62%
Total number of training days n/a 4.93m 5.56m
Total training expenditure n/a £1.5bn £1.6bn
n/a: question not asked or not asked in a comparable manner in previous years’ surveys

172
Annex C: Industry Coding
Each establishment was allocated to one of 14 sectors, based on their Standard
Industrial Classification (SIC). SIC 2007 was used to classify establishments using the
following method. Using the four-digit Standard Industrial Classification (SIC) supplied for
each record from the Experian database, a description of business activity was read out
to each respondent. If they agreed that this description matched the main activity
undertaken at the establishment, then the SIC on Experian’s database was assumed to
be correct. If however the respondent felt the description did not correspond to their main
business activity at the site (which about a quarter did), a verbatim response was
collected to find out what they do (see question A7 on the survey; questionnaire shown in
the accompanying Technical Report). At the analysis stage this was coded to a four-digit
SIC which was then used as the basis for allocation into sector.
The table below shows the 14 sectors and their corresponding SIC 2007 definitions.
Sector SIC 2007
1. Agriculture
A - Agriculture, forestry and fishing (01-03)
Including farming, hunting and other related service
activities, forestry and logging, fishing and
aquaculture
2. Mining & Quarrying
B - Mining and quarrying (05-09)
Including mining of coal, metals, sand/stone/clay,
and extraction of crude petroleum and natural gas
3. Manufacturing
C - Manufacturing (10-33)
Including manufacture of food and beverage,
textiles, chemicals and chemical products, basic
pharmaceutical products, other mineral products,
manufacture of metals and metal products,
machinery, computer and electronic products and
equipment, motor vehicles and other transport
equipment, furniture, and repair and installation of
machinery and equipment
4. Electricity, Gas and Water D - Electricity, gas, steam and air conditioning
supply (35)
E - Water supply, sewerage, waste management
and remediation activities (36-39)
Including electric power generation, transmission
and distribution, manufacture of gas and
distribution of gaseous fuels, steam and air
conditioning supply, water collection, treatment and
supply, sewerage and waste collection, treatment
and disposal activities and materials recovery

173
Sector SIC 2007
5. Construction
F - Construction (41-43)
Including the construction of buildings, civil
engineering (constructing roads, railways and other
utility projects), demolition, and specialised
activities such as electrical installation, roofing and
scaffold erection
6. Wholesale and Retail
G - Wholesale and retail trade; repair of motor
vehicles and motor cycles (45-47)
Including sale, maintenance and repair of motor
vehicles, parts and accessories, non-vehicle
wholesale (for example agriculture, food,
household goods), and the retail trade of all
products whether in stores, stalls, markets, mail
order or online
7. Hotels and Restaurants
I - Accommodation and food service activities (55-
56)
Including hotels, campsites, youth hostels, holiday
centres, villages and other short stay
accommodation, restaurants and takeaways, event
catering and licensed clubs, pubs and bars
8. Transport and Communications H - Transport and storage (49-53)
J - Information and communication (58-63)
Including land, water and air transport (passenger
and freight), warehousing and support activities for
transportation, postal and courier activities,
publishing (books, journals, newspapers etc and
software/computer games), television, film and
music production, broadcasting,
telecommunications, computer programming and
consultancy, information service activities (e.g. data
processing and hosting)
9. Financial Services
K - Financial and insurance activities (64-66)
Including banks and building societies, activities of
holding companies, trusts, funds and similar
financial entities, credit granting, pensions,
insurance and reinsurance
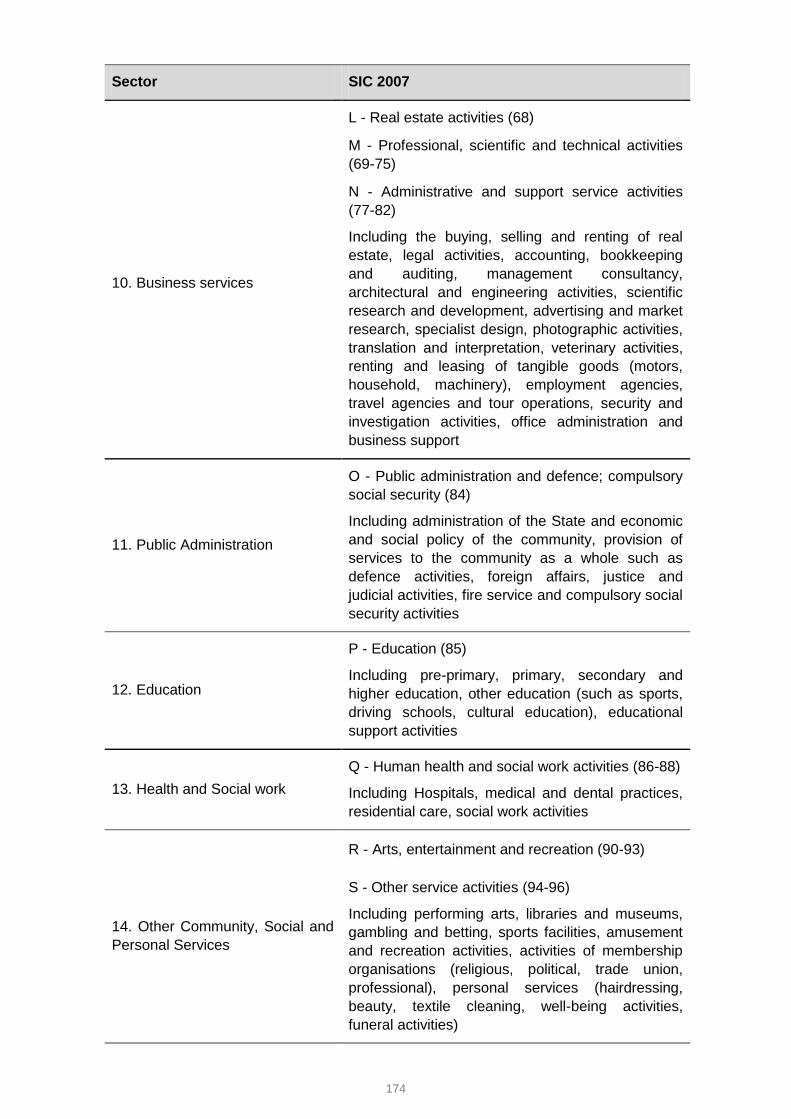
174
Sector SIC 2007
10. Business services
L - Real estate activities (68)
M - Professional, scientific and technical activities
(69-75)
N - Administrative and support service activities
(77-82)
Including the buying, selling and renting of real
estate, legal activities, accounting, bookkeeping
and auditing, management consultancy,
architectural and engineering activities, scientific
research and development, advertising and market
research, specialist design, photographic activities,
translation and interpretation, veterinary activities,
renting and leasing of tangible goods (motors,
household, machinery), employment agencies,
travel agencies and tour operations, security and
investigation activities, office administration and
business support
11. Public Administration
O - Public administration and defence; compulsory
social security (84)
Including administration of the State and economic
and social policy of the community, provision of
services to the community as a whole such as
defence activities, foreign affairs, justice and
judicial activities, fire service and compulsory social
security activities
12. Education
P - Education (85)
Including pre-primary, primary, secondary and
higher education, other education (such as sports,
driving schools, cultural education), educational
support activities
13. Health and Social work
Q - Human health and social work activities (86-88)
Including Hospitals, medical and dental practices,
residential care, social work activities
14. Other Community, Social and
Personal Services
R - Arts, entertainment and recreation (90-93)
S - Other service activities (94-96)
Including performing arts, libraries and museums,
gambling and betting, sports facilities, amusement
and recreation activities, activities of membership
organisations (religious, political, trade union,
professional), personal services (hairdressing,
beauty, textile cleaning, well-being activities,
funeral activities)

175
Sector SIC 2007
NOT COVERED IN SURVEY
T - Activities of households as employers;
undifferentiated goods and services producing
activities of households for own use (97-98)
U - Activities of extraterritorial organisations and
bodies (99)
Including households as employers of domestic
personnel, private households producing goods for
own use
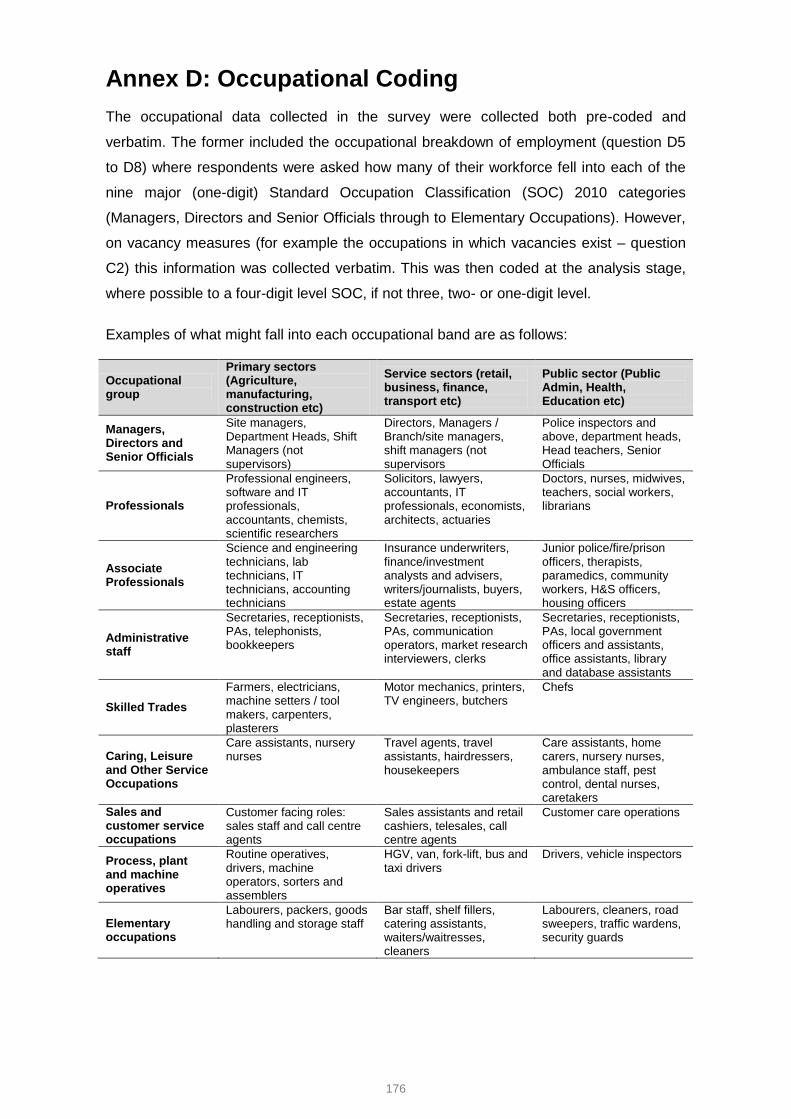
176
Annex D: Occupational Coding
The occupational data collected in the survey were collected both pre-coded and
verbatim. The former included the occupational breakdown of employment (question D5
to D8) where respondents were asked how many of their workforce fell into each of the
nine major (one-digit) Standard Occupation Classification (SOC) 2010 categories
(Managers, Directors and Senior Officials through to Elementary Occupations). However,
on vacancy measures (for example the occupations in which vacancies exist – question
C2) this information was collected verbatim. This was then coded at the analysis stage,
where possible to a four-digit level SOC, if not three, two- or one-digit level.
Examples of what might fall into each occupational band are as follows:
Occupational group
Primary sectors (Agriculture, manufacturing, construction etc)
Service sectors (retail, business, finance, transport etc)
Public sector (Public Admin, Health, Education etc)
Managers, Directors and Senior Officials
Site managers, Department Heads, Shift Managers (not supervisors)
Directors, Managers / Branch/site managers, shift managers (not supervisors
Police inspectors and above, department heads, Head teachers, Senior Officials
Professionals
Professional engineers, software and IT professionals, accountants, chemists, scientific researchers
Solicitors, lawyers, accountants, IT professionals, economists, architects, actuaries
Doctors, nurses, midwives, teachers, social workers, librarians
Associate Professionals
Science and engineering technicians, lab technicians, IT technicians, accounting technicians
Insurance underwriters, finance/investment analysts and advisers, writers/journalists, buyers, estate agents
Junior police/fire/prison officers, therapists, paramedics, community workers, H&S officers, housing officers
Administrative staff
Secretaries, receptionists, PAs, telephonists, bookkeepers
Secretaries, receptionists, PAs, communication operators, market research interviewers, clerks
Secretaries, receptionists, PAs, local government officers and assistants, office assistants, library and database assistants
Skilled Trades
Farmers, electricians, machine setters / tool makers, carpenters, plasterers
Motor mechanics, printers, TV engineers, butchers
Chefs
Caring, Leisure and Other Service Occupations
Care assistants, nursery nurses
Travel agents, travel assistants, hairdressers, housekeepers
Care assistants, home carers, nursery nurses, ambulance staff, pest control, dental nurses, caretakers
Sales and customer service occupations
Customer facing roles: sales staff and call centre agents
Sales assistants and retail cashiers, telesales, call centre agents
Customer care operations
Process, plant and machine operatives
Routine operatives, drivers, machine operators, sorters and assemblers
HGV, van, fork-lift, bus and taxi drivers
Drivers, vehicle inspectors
Elementary occupations
Labourers, packers, goods handling and storage staff
Bar staff, shelf fillers, catering assistants, waiters/waitresses, cleaners
Labourers, cleaners, road sweepers, traffic wardens, security guards

177
Annex E: Sampling Error and Statistical Confidence
Sampling errors for the survey results overall and for key sub-groups are presented in the
table below. Figures have been based on a survey result of 50 per cent (the ‘worst’ case
in terms of statistical reliability), and have used a 95 per cent confidence level. Where the
table indicates that a survey result based on all respondents has a sampling error of +/-
0.32 per cent, this should be interpreted as follows: ‘for a question asked of all
respondents where the survey result is 50 per cent, we are 95 per cent confident that the
true figure lies within the range 49.68 per cent to 50.32 per cent’.
As a note, the calculation of sampling error has taken into account the finite population
correction factor to account for cases where we are measuring a significant portion of the
population universe (i.e. even if two sample sizes are the same, the sampling error will be
lower if in one case a far higher proportion of the population was covered).
These confidence intervals are based on the assumption of a normal distribution of
responses.
Sampling error (at the confidence 95 per cent level) associated with findings of 50 per cent
Population Number of interviews
(Maximum) Sampling
Error
Overall 1,743,847 91,279 +/-0.32
By country
England 1,465,963 75,255 +/-0.36
Northern Ireland 55,603 4,014 +/-1.55
Scotland 140,948 6,014 +/-1.26
Wales 81,333 5,996 +/-1.27
By size of establishment
2-4 907,729 19,058 +/-0.71
5-24 651,910 51,565 +/-0.43
25-99 146,623 16,531 +/-0.76
100-249 26,105 2,938 +/-1.81
250+ 11,480 1,187 +/-2.84

178
Population Number of interviews
(Maximum) Sampling
Error
By sector
Agriculture 94,386 3,407 +/-1.68
Mining & Quarrying 1,712 138 +/-8.34
Manufacturing 99,955 7,422 +/-1.14
Electricity, Gas and Water 9,339 1,148 +/-2.89
Construction 162,801 7,202 +/-1.15
Wholesale and Retail 372,433 17,287 +/-0.75
Hotels & Restaurants 155,283 8,888 +/-1.04
Transport and Communications
121,484 6,890 +/-1.18
Financial Services 40,030 2,330 +/-2.03
Business Services 348,735 14,011 +/-0.83
Public Administration 21,408 942 +/-3.19
Education 57,523 5,796 +/-1.29
Health and Social Work 130,010 8,460 +/-1.07
Community, Social and Personal Services
128,748 7,358 +/-1.14

179
Annex F: Weighted Base Sizes
Number of employers… UK England NI Scotland Wales
Overall 1,743,847 1,465,963 55,603 140,948 81,333
Chapter 2: Employers’ experience of skill shortages
With a vacancy 257,161 218,432 5,749 21,733 11,247
With a hard-to-fill vacancy 89,732 75,908 1,917 7,946 3,961
With a skill-shortage vacancy 70,504 60,073 1,453 5,947 3,032
Chapter 3: The Internal Skills Challenge
With at least one skills gap 268,208 220,359 7,954 26,966 12,929
With at least one employee with more qualifications and skills than job role requires
829,376 687,975 28,145 73,039 40,217
Chapter 4: Employer Investment in Training and Skills
Providing any training 1,147,751 963,751 35,005 98,426 50,569
On-the-job training only 296,972 253,325 7,507 24,030 12,110
Off-the-job training only 240,648 202,275 8742 18,250 11,380
Both on- and off-the-job training
610,132 508,151 18,755 56,146 27,080
Providing no training for staff 596,096 502,212 20,598 42,522 30,764
Providing training towards nationally recognised qualifications
538,226 449,450 15,588 46,332 26,856
Chapter 5: Work-readiness of those leaving education
Taking on leavers from education in the last 2-3 years
435,444 400,847 12,309 37,185 22,288
16-year-olds from school 122,710 113,086 3,290 n/a 6,334
17-18-year-olds from school
168,069 154,100 4,874 n/a 9,095
17-18-year-olds from FE College
183,516 169,650 4,704 n/a 9,162
From university 216,893 199,126 6,943 n/a 10,824
From Scottish secondary school
n/a n/a n/a 23,308 n/a
From Scottish FE College n/a n/a n/a 15,284 n/a
From Scottish university n/a n/a n/a 17,283 n/a
Base: All establishments

180
Annex G: Unweighted Base Sizes
Establishments with…
Overall Vacancies Hard-to-fill vacancies
Skill-shortage
vacancies
Skills gaps
Estab’s that train
UK 91,279 18,959 6,133 4,987 20,228 69,842
Country
England 75,255 15,894 5,073 4,057 16,563 57,787
Northern Ireland 4,014 550 181 144 733 2,894
Scotland 6,014 1,499 538 427 1,713 4,884
Wales 5,996 1,016 341 269 1,219 4,277
Size
2-4 19,058 1,403 536 405 1,348 9,580
5-24 51,565 8,969 3,033 2,439 11,409 40,801
25-99 16,531 6,088 1,812 1,419 5,625 15,438
100-249 2,938 1,737 528 434 1,274 2,864
250+ 1,187 762 224 200 572 1,159
Sector
Agriculture 3,407 167 74 52 303 1,710
Mining and Quarrying 138 22 5 5 21 103
Manufacturing 7,422 1347 530 471 1,750 5,128
Electricity, Gas and Water 1,148 185 65 54 208 878
Construction 7,202 706 249 198 1,122 4,777
Wholesale and Retail 17,287 2,983 802 641 4,392 12,425
Hotels and Restaurants 8,888 2,447 841 643 2,964 6,761
Transport and Communications 6,890 1,232 499 424 1,271 4,939
Financial Services 2,330 398 121 103 437 1,824
Business Services 14,011 3,147 1158 990 2,842 11,127
Public Administration 942 283 83 58 203 861
Education 5,796 2,062 480 374 1,296 5,568
Health and Social Work 8,460 2,375 736 536 1,955 7,935
Community, Social and
Personal Service activities 7,358 1,605 490 348 1,464 5,806
Occupation
Managers 87,946 18,597 6,004 4,802 19,802 67,964
Professionals 17,407 5,796 1,814 1,513 4,430 15,816
Associate Professionals 12,577 4,041 1,349 1,176 3,568 11,070
Administrative/ Clerical staff 53,759 12,944 4,158 3,388 12,831 43,952
Skilled Trades occupations 23,644 5,460 2,084 1,718 6,601 18,732
Caring, Leisure and Other
services 14,017 4,588 1,403 1,024 3,504 13,194
Sales and Customer services 27,417 6,808 2,094 1,750 8,015 21,833
Machine Operatives 14,059 2,962 1,025 845 3,693 11,018
Elementary staff 32,192 8,474 2,678 2,082 9,410 26,420

181
Annex H: A Note on Proficiency and Skills Gaps
To ascertain the number of staff with skills gaps, respondents were asked, for each major
(one-digit SOC 2010) occupation where they employed staff, how many of those they
employed were fully proficient. If respondents asked for clarification, then a proficient
employee was described as ‘someone who is able to do their job to the required level’.
‘Proficient employee’, however, is clearly a subjective and relative term to the extent that:
different managers in an organisation may have different views on whether an
individual member of staff is able to do the job to the required level. Indeed they may
have different views on what the required level is that the organisation is looking for
within an occupational category
an employee could be regarded as fully proficient but if the requirements of the job
change (for example, some new machinery or technology is introduced) then they
could be regarded as not being able to do their job to the required level, despite the
fact that their skills were unchanged
the same is true if a person were to be promoted to a more demanding position – the
company might go from having no skills gaps to saying that this newly promoted
member of staff was not fully proficient in the new job, despite having the same
proficiency as before
different companies may be more demanding and ‘critical’ of their staff than others:
an individual considered fully proficient by one company might be seen as having a
skills gap if performing the same role to the same standard in another company.
A final point to note is that the survey categorises all staff as either fully proficient or not: it
takes no account of the range that can clearly exist between those who are very nearly
proficient and those who significantly lack the skills that employers require. While from a
policy perspective, therefore, there is clearly interest in raising the skill levels of the
workforce, survey data can only identify changes year on year in the proportion of staff
reported as fully proficient, not cases where skills levels have been raised but where staff
still remain below full proficiency.
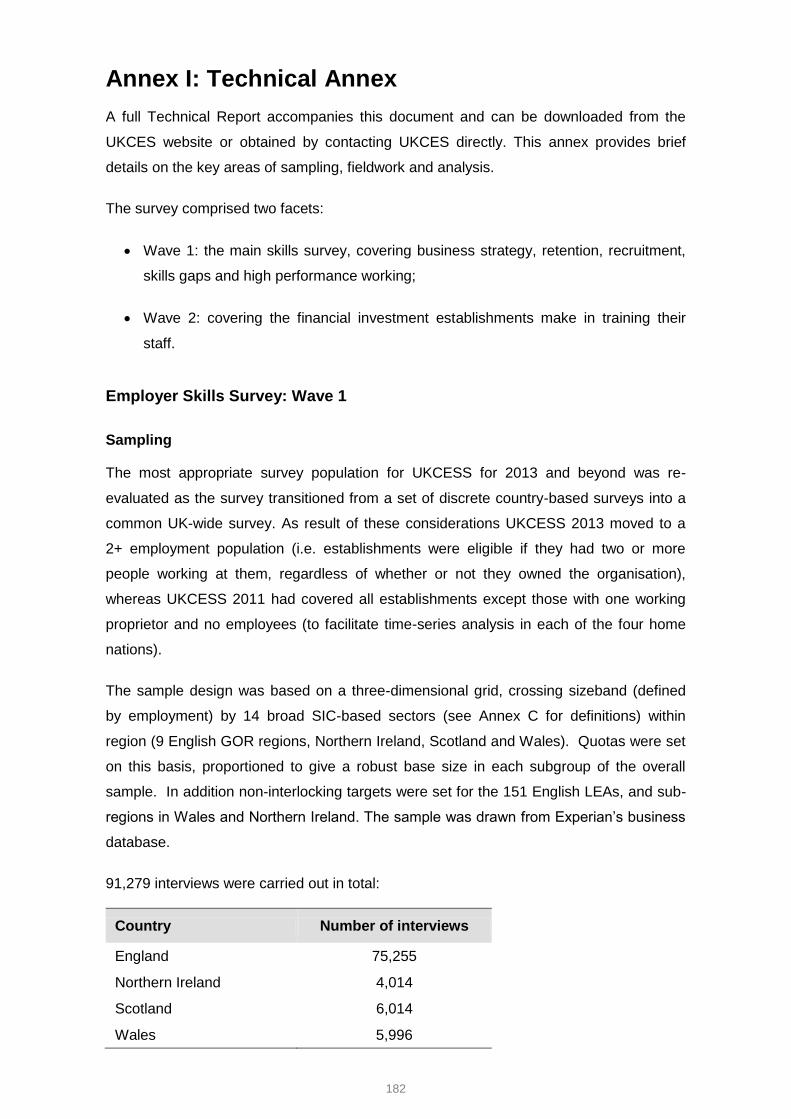
182
Annex I: Technical Annex
A full Technical Report accompanies this document and can be downloaded from the
UKCES website or obtained by contacting UKCES directly. This annex provides brief
details on the key areas of sampling, fieldwork and analysis.
The survey comprised two facets:
Wave 1: the main skills survey, covering business strategy, retention, recruitment,
skills gaps and high performance working;
Wave 2: covering the financial investment establishments make in training their
staff.
Employer Skills Survey: Wave 1
Sampling
The most appropriate survey population for UKCESS for 2013 and beyond was re-
evaluated as the survey transitioned from a set of discrete country-based surveys into a
common UK-wide survey. As result of these considerations UKCESS 2013 moved to a
2+ employment population (i.e. establishments were eligible if they had two or more
people working at them, regardless of whether or not they owned the organisation),
whereas UKCESS 2011 had covered all establishments except those with one working
proprietor and no employees (to facilitate time-series analysis in each of the four home
nations).
The sample design was based on a three-dimensional grid, crossing sizeband (defined
by employment) by 14 broad SIC-based sectors (see Annex C for definitions) within
region (9 English GOR regions, Northern Ireland, Scotland and Wales). Quotas were set
on this basis, proportioned to give a robust base size in each subgroup of the overall
sample. In addition non-interlocking targets were set for the 151 English LEAs, and sub-
regions in Wales and Northern Ireland. The sample was drawn from Experian’s business
database.
91,279 interviews were carried out in total:
Country Number of interviews
England 75,255
Northern Ireland 4,014
Scotland 6,014
Wales 5,996

183
Fieldwork
A total of 91,279 interviews were conducted by telephone using computer-assisted
telephone interviewing (CATI) technology. Fieldwork across the regions was undertaken
by three research agencies, as follows:
Agency Regions
BMG
East Midlands
South West
West Midlands
Yorkshire and Humberside
GfK-NOP South East
IFF Research
London
North West
Northern Ireland
Wales
Large multisites
Ipsos MORI
East of England
North East
Scotland
Interviews were conducted with the most senior person at the site with responsibility for
recruitment, human resources and workplace skills. Fieldwork took place from March to
July 2013.
Response rate
The overall response rate for the survey was 44 per cent, calculated as a proportion of all
completed contacts. A detailed breakdown of survey outcomes in shown below:
Outcome Number of contacts
% of all sample
% of complete contacts
Total sample 687,439 100%
Ineligible 53,914 8%
‘Live’ / not available during fieldwork / out of quota
288,276 42%
Unobtainable number 136,914 20%
Total complete contacts 208,108 30% 100%
Achieved interviews 91,279 13% 44%
Respondent refusal 74,789 11% 36%
Quits during interview 10,923 2% 5%
Company policy refusal 31,117 5% 15%

184
Questionnaire design
The questionnaire design aimed to build on the success of the 2011 UKCESS
questionnaire that had harmonised the legacy surveys. As a result, UKCESS 2013 did
not require extensive redevelopment, with the core questionnaire remaining the same.
However, a considerable period of questionnaire review did take place at the outset of the
survey with a particular emphasis on:
1. Reviewing all questions included in the 2011 survey, identifying questions which
brought less value and/or which were anticipated to have less value to the new
survey.
2. Considering whether other questions should be further developed or take added
prominence.
3. Integrating the skills equilibrium questions which were asked as a separate, online
follow-up survey in 2011.
4. Developing any learnings and or findings from the UK Commission’s Employer
Perspectives Survey 2012.
A task and finish group chaired by the UK Commission and including IFF Research, and
representatives from each of the four nations, was set up to drive this process.
The questionnaire is available in the full Technical Report.
Weighting / Grossing up
Data for the survey was weighted and grossed up to population estimates of
establishments and to the population of employees, as derived from the 2012 Inter-
Departmental Business Register (IDBR).
The grossing-up procedure on which this report has been based was undertaken at a
regional level; within each region grossing up took place on a 14 sector and eight size
band interlocking grid (i.e. 112 cells). In instances where no interviews had been
completed in a cell but the IDBR indicated establishments existed, and in instances
where a low number of interviews were conducted in relation to the population of that cell,
cells were merged primarily within sizeband (i.e. across industries) but where necessary
across sizeband as well.
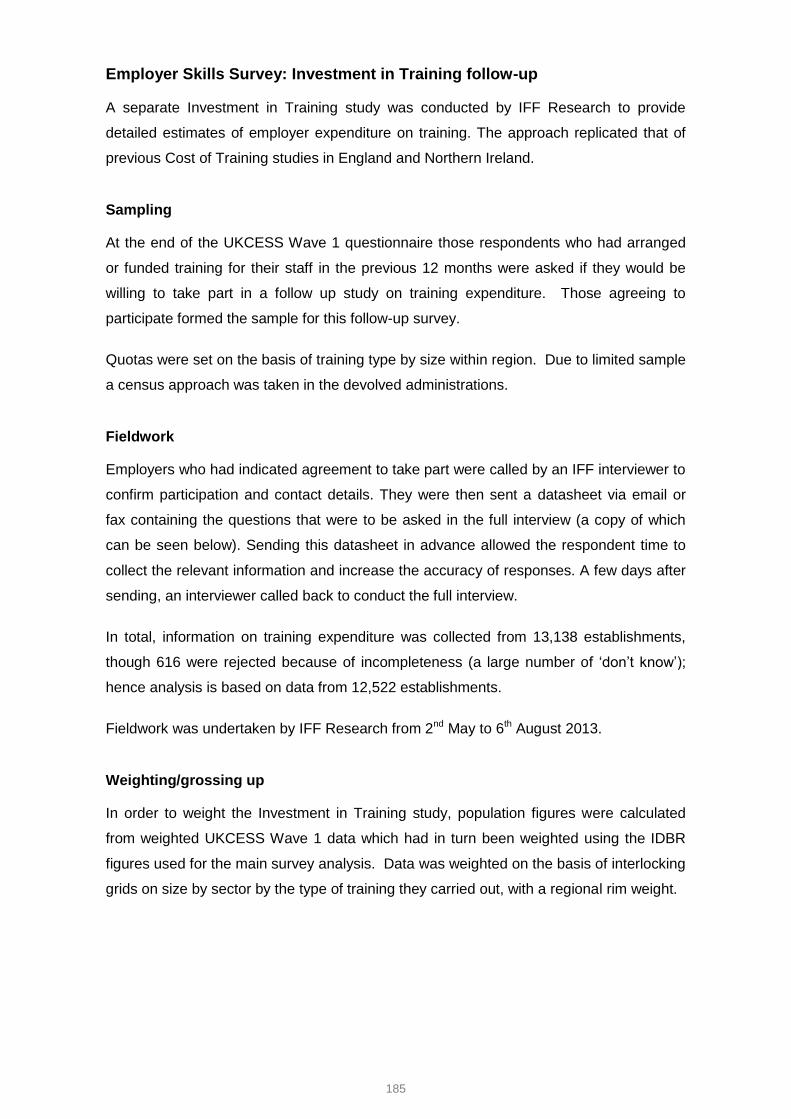
185
Employer Skills Survey: Investment in Training follow-up
A separate Investment in Training study was conducted by IFF Research to provide
detailed estimates of employer expenditure on training. The approach replicated that of
previous Cost of Training studies in England and Northern Ireland.
Sampling
At the end of the UKCESS Wave 1 questionnaire those respondents who had arranged
or funded training for their staff in the previous 12 months were asked if they would be
willing to take part in a follow up study on training expenditure. Those agreeing to
participate formed the sample for this follow-up survey.
Quotas were set on the basis of training type by size within region. Due to limited sample
a census approach was taken in the devolved administrations.
Fieldwork
Employers who had indicated agreement to take part were called by an IFF interviewer to
confirm participation and contact details. They were then sent a datasheet via email or
fax containing the questions that were to be asked in the full interview (a copy of which
can be seen below). Sending this datasheet in advance allowed the respondent time to
collect the relevant information and increase the accuracy of responses. A few days after
sending, an interviewer called back to conduct the full interview.
In total, information on training expenditure was collected from 13,138 establishments,
though 616 were rejected because of incompleteness (a large number of ‘don’t know’);
hence analysis is based on data from 12,522 establishments.
Fieldwork was undertaken by IFF Research from 2nd May to 6th August 2013.
Weighting/grossing up
In order to weight the Investment in Training study, population figures were calculated
from weighted UKCESS Wave 1 data which had in turn been weighted using the IDBR
figures used for the main survey analysis. Data was weighted on the basis of interlocking
grids on size by sector by the type of training they carried out, with a regional rim weight.
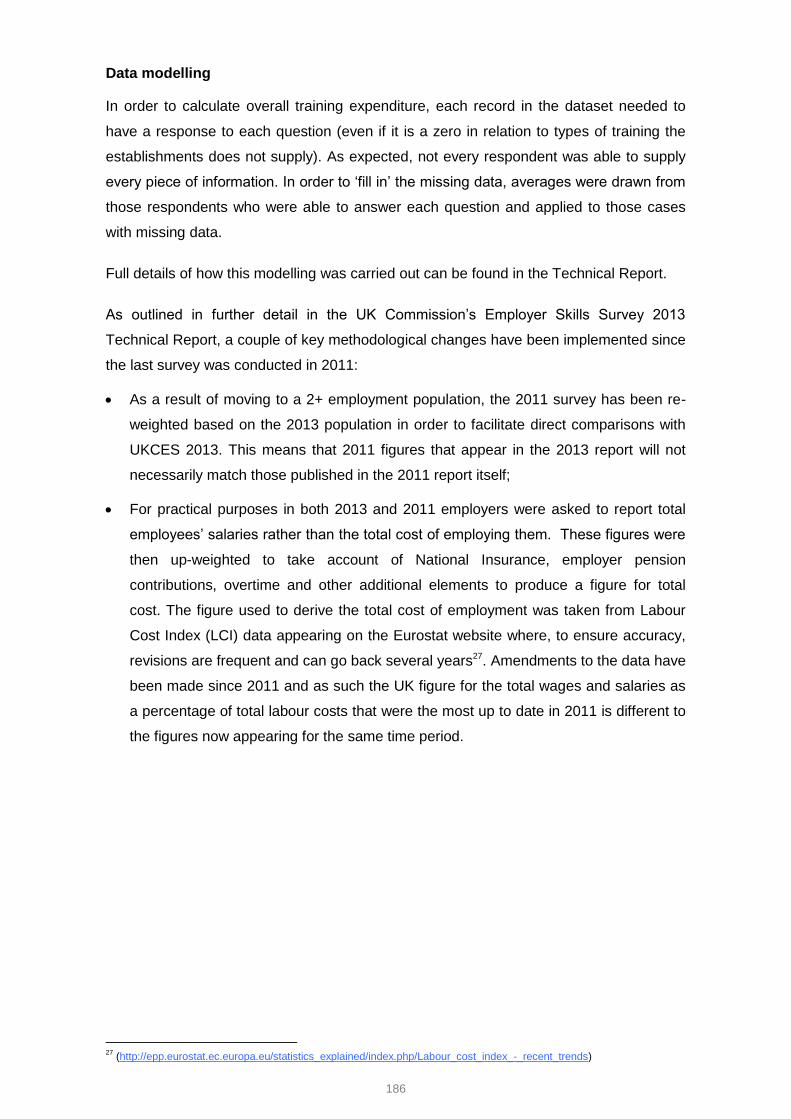
186
Data modelling
In order to calculate overall training expenditure, each record in the dataset needed to
have a response to each question (even if it is a zero in relation to types of training the
establishments does not supply). As expected, not every respondent was able to supply
every piece of information. In order to ‘fill in’ the missing data, averages were drawn from
those respondents who were able to answer each question and applied to those cases
with missing data.
Full details of how this modelling was carried out can be found in the Technical Report.
As outlined in further detail in the UK Commission’s Employer Skills Survey 2013
Technical Report, a couple of key methodological changes have been implemented since
the last survey was conducted in 2011:
As a result of moving to a 2+ employment population, the 2011 survey has been re-
weighted based on the 2013 population in order to facilitate direct comparisons with
UKCES 2013. This means that 2011 figures that appear in the 2013 report will not
necessarily match those published in the 2011 report itself;
For practical purposes in both 2013 and 2011 employers were asked to report total
employees’ salaries rather than the total cost of employing them. These figures were
then up-weighted to take account of National Insurance, employer pension
contributions, overtime and other additional elements to produce a figure for total
cost. The figure used to derive the total cost of employment was taken from Labour
Cost Index (LCI) data appearing on the Eurostat website where, to ensure accuracy,
revisions are frequent and can go back several years27. Amendments to the data have
been made since 2011 and as such the UK figure for the total wages and salaries as
a percentage of total labour costs that were the most up to date in 2011 is different to
the figures now appearing for the same time period.
27
(http://epp.eurostat.ec.europa.eu/statistics_explained/index.php/Labour_cost_index_-_recent_trends)

187
Annex J: Effect of the 2+ Employment Reweight on 2011 Data
The 2013 survey population covers all establishments with two or more people working at
them (whether or not these people are working proprietors). The 2011 survey also
covered this population, and in addition included establishments with one employee who
was not a working proprietor. Therefore in order to compare 2013 data with 2011 data, it
has been necessary to reweight the 2011 data to the 2+ employment population.
Whilst the establishments removed from the data do not differ significantly from other
micro establishments in terms of the amount they recruit or train staff, removing them
from the data has a considerable impact on survey results because of the difference it
makes to the population. In the original data reported from the 2011 survey, the smallest
sizeband (one to four staff) accounted for 64 per cent of the population. If we remove
establishments with just one employee on site this reduces to 52 per cent. It is this
change in the population weighted to that has the largest impact on the data.
The tables in this annex show the key incidence and volume figures reported in the
UKCESS 2011 survey, and how they were affected by the reweight. A full set of
reweighted tables from the 2011 survey accompany the 2013 survey outputs in order to
facilitate the time-series comparison.
2011 reported figure
(including 1 employee group)
2011 reweighted figure (excluding 1 employee group;
comparable to 2013)
Size profile % %
1-4 / 2-4 64 52
5-24 28 37
25-99 6 8
100-249 1 1
250+ 1 1
Vacancy
% of estabs with a vacancy 12 14
Number of vacancies 635,900 586,500
% of estabs with a hard-to-fill vacancy 4 4
% of estabs with a skill-shortage vacancy 3 3
Number of skill-shortage vacancies 103,500 91,400
Internal Skills Mismatch
% of estabs with a skills gap 13 17
Number of skills gaps 1,489,500 1,485,500
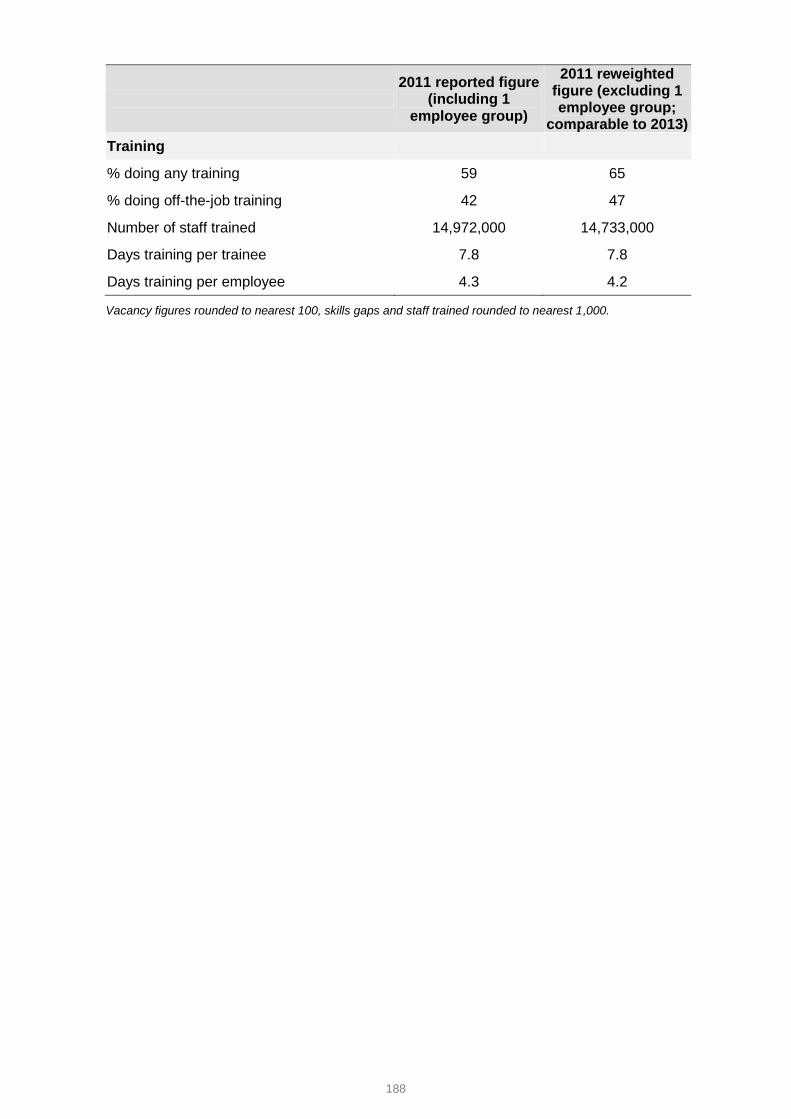
188
2011 reported figure
(including 1 employee group)
2011 reweighted figure (excluding 1 employee group;
comparable to 2013)
Training
% doing any training 59 65
% doing off-the-job training 42 47
Number of staff trained 14,972,000 14,733,000
Days training per trainee 7.8 7.8
Days training per employee 4.3 4.2
Vacancy figures rounded to nearest 100, skills gaps and staff trained rounded to nearest 1,000.
189
Annex K: Bibliography
BIS (2012) Leadership & Management in the UK – The Key to Sustainable Growth.
Department for Business, Innovation and Skills, London.
Inter Departmental Business Register (March 2012). ONS.
Labour Force Survey, UK, October-December 1993 and 2010. ONS.
Stone, I., Braidford, P., Housten, M. and Bolger, F. (2012) Promoting High Performance
Working. Department for Business, Innovation and Skills, London.
UKCES (2009) High Performance Working: A Synthesis of Key Literature. UKCES
Evidence Report 4, UK Commission for Employment and Skills, Wath-upon-
Dearne.
UKCES (2010) National Employer Skills Survey for England 2009: Key findings report.
UKCES Evidence Report 23, UK Commission for Employment and Skills, London.
UKCES (2012a) UK Employer Skills Survey 2011, UKCES Evidence Report 45, UK
Commission for Employment and Skills, London.
UKCES (2012b) The Youth Employment Challenge. UK Commission for Employment
and Skills, Wath-upon-Dearne.
UKCES (2012c) UK Commission’s Employer Perspectives Survey 2012. UKCES
Evidence report 64, UK Commission for Employment and Skills, London.
UKCES (2013) Training in the Recession: The impact of the 2008-2009 recession on
training at work. UKCES Evidence Report 72, UK Commission for Employment and
Skills, London.
Winterbotham, M., Shury, J., Carter, K. and Schäfer, S. (2008) National Employer Skills
Survey 2007: Main Report: Learning and Skills Council, Coventry.
Young, V., and Morrell, J. (2006) Future Skills Wales 2005: Sector Skills Survey Main
Report. Future Skills Wales, Caerphilly.

190
Annex L: List of Previous Publications
Executive summaries and full versions of all these reports are available from www.ukces.org.uk Evidence Report 1 Skills for the Workplace: Employer Perspectives Evidence Report 2 Working Futures 2007-2017 Evidence Report 3 Employee Demand for Skills: A Review of Evidence & Policy Evidence Report 4 High Performance Working: A Synthesis of Key Literature Evidence Report 5 High Performance Working: Developing a Survey Tool Evidence Report 6 Review of Employer Collective Measures: A Conceptual Review from a Public Policy Perspective Evidence Report 7 Review of Employer Collective Measures: Empirical Review Evidence Report 8 Review of Employer Collective Measures: Policy Review Evidence Report 9 Review of Employer Collective Measures: Policy Prioritisation Evidence Report 10 Review of Employer Collective Measures: Final Report Evidence Report 11 The Economic Value of Intermediate Vocational Education and Qualifications Evidence Report 12 UK Employment and Skills Almanac 2009 Evidence Report 13 National Employer Skills Survey 2009: Key Findings Evidence Report 14 Strategic Skills Needs in the Biomedical Sector: A Report for the National Strategic Skills Audit for England, 2010 Evidence Report 15 Strategic Skills Needs in the Financial Services Sector: A Report for the National Strategic Skills Audit for England, 2010 Evidence Report 16 Strategic Skills Needs in the Low carbon Energy generation Sector: A Report for the National Strategic Skills Audit for England, 2010

191
Evidence Report 17 Horizon Scanning and Scenario Building: Scenarios for Skills 2020
Evidence Report 18 High Performance Working: A Policy Review Evidence Report 19 High Performance Working: Employer Case Studies Evidence Report 20 A Theoretical Review of Skill Shortages and Skill Needs Evidence Report 21 High Performance Working: Case Studies Analytical Report Evidence Report 22 The Value of Skills: An Evidence Review Evidence Report 23 National Employer Skills Survey for England 2009: Main Report Evidence Report 24 Perspectives and Performance of Investors in People: A Literature Review Evidence Report 25 UK Employer Perspectives Survey 2010
Evidence Report 26 UK Employment and Skills Almanac 2010 Evidence Report 27 Exploring Employer Behaviour in relation to Investors in People Evidence Report 28 Investors in People - Research on the New Choices Approach Evidence Report 29 Defining and Measuring Training Activity Evidence Report 30 Product strategies, skills shortages and skill updating needs in England: New evidence from the National Employer Skills Survey, 2009 Evidence Report 31 Skills for Self-employment Evidence Report 32 The impact of student and migrant employment on opportunities for low skilled people Evidence Report 33 Rebalancing the Economy Sectorally and Spatially: An Evidence Review Evidence Report 34 Maximising Employment and Skills in the Offshore Wind Supply Chain Evidence Report 35 The Role of Career Adaptability in Skills Supply

192
Evidence Report 36 The Impact of Higher Education for Part-Time Students Evidence Report 37 International approaches to high performance working Evidence Report 38 The Role of Skills from Worklessness to Sustainable Employment with Progression Evidence Report 39 Skills and Economic Performance: The Impact of Intangible Assets on UK Productivity Growth Evidence Report 40 A Review of Occupational Regulation and its Impact Evidence Report 41 Working Futures 2010-2020 Evidence Report 42 International Approaches to the Development of Intermediate Level Skills and Apprenticeships Evidence Report 43 Engaging low skilled employees in workplace learning Evidence Report 44 Developing Occupational Skills Profiles for the UK Evidence Report 45 UK Commission’s Employer Skills Survey 2011: UK Results Evidence Report 46 UK Commission’s Employer Skills Survey 2011: England Results Evidence Report 47 Understanding Training Levies Evidence Report 48 Sector Skills Insights: Advanced Manufacturing Evidence Report 49 Sector Skills Insights: Digital and Creative Evidence Report 50 Sector Skills Insights: Construction Evidence Report 51 Sector Skills Insights: Energy Evidence Report 52 Sector Skills Insights: Health and Social Care Evidence Report 53 Sector Skills Insights: Retail Evidence Report 54 Research to support the evaluation of Investors in People: Employer Survey
193
Evidence Report 55 Sector Skills Insights: Tourism Evidence Report 56 Sector Skills Insights: Professional and Business Services Evidence Report 57 Sector Skills Insights: Education Evidence Report 58 Evaluation of Investors in People: Employer Case Studies Evidence Report 59 An Initial Formative Evaluation of Best Market Solutions Evidence Report 60 UK Commission’s Employer Skills Survey 2011: Northern Ireland National Report Evidence Report 61 UK Skill levels and international competitiveness Evidence Report 62 UK Commission’s Employer Skills Survey 2011: Wales Results Evidence Report 63 UK Commission’s Employer Skills Survey 2011: Technical Report Evidence Report 64 The UK Commission’s Employer Perspectives Survey 2012 Evidence Report 65 UK Commission’s Employer Skills Survey 2011: Scotland Results Evidence Report 66 Understanding Employer Networks Evidence Report 67 Understanding Occupational Regulation Evidence Report 68 Research to support the Evaluation of Investors in People: Employer Survey (Year 2) Evidence Report 69 Qualitative Evaluation of the Employer Investment Fund Phase 1 Evidence Report 70 Research to support the evaluation of Investors in People: employer case studies (Year 2) Evidence Report 71 High Performance Working in the Employer Skills Surveys Evidence Report 72 Training in Recession: The impact of the 2008-2009 recession on training at work Evidence Report 73 Technology and skills in the Digital Industries

194
Evidence Report 74 Technology and skills in the Construction Industry Evidence Report 75 Secondary analysis of employer surveys: Urban/rural differences in access and barriers to jobs and training Evidence Report 76 Technology and Skills in the Aerospace and Automotive Industries Evidence Report 77 Supply of and demand for High-Level STEM skills Evidence Report 78 A Qualitative Evaluation of Demand-led Skills Solutions: Growth and Innovation Fund and Employer Investment Fund Evidence Report 79 A Qualitative Evaluation of Demand-led Skills Solutions: standards and frameworks Evidence Report 80 Forecasting the Benefits of the UK Commission’s Programme of Investments Evidence Report 81 UK Commission’s Employer Skills Survey 2013: UK Results Evidence Report 82 UK Commission’s Employer Skills Survey 2013: Technical Report

Evidence Reports present detailed findings of the research produced by the UK Commission for Employment and Skills. The reports contribute to the accumulation of knowledge and intelligence on skills and employment issues through the review of existing evidence or through primary research.
All of the outputs of the UK Commission can be accessed on our website at www.ukces.org.uk
UKCESRenaissance HouseAdwick ParkWath-upon-DearneRotherhamS63 5NBT +44 (0)1709 774 800F +44 (0)1709 774 801
UKCESSanctuary Buildings Great Smith St.Westminster LondonSW1P 3BTT +44 (0)20 7227 7800
This document is available at www.ukces.org.uk under “Publications”
ISBN 978-1-908418-61 -6© UKCES 1st Ed/12.12