UK Biodiversity Indicators 2017 - JNCCjncc.defra.gov.uk/pdf/UKBI_2017.pdf · 2. Introduction UK...
60
UK Biodiversity Indicators 2017
Transcript of UK Biodiversity Indicators 2017 - JNCCjncc.defra.gov.uk/pdf/UKBI_2017.pdf · 2. Introduction UK...

UK Biodiversity Indicators 2017

Department for Environment, Food and Rural AffairsNobel House17 Smith SquareLondon SW1P 3JRTelephone 020 7238 6000Website: www.gov.uk/defra
© Crown copyright 2017
Copyright in the typographical arrangement and design rests with the Crown.
This publication (excluding logos) may be reproduced free of charge in any format or medium provided that it is reproduced accurately and not used in a misleading context. The material must be acknowledged as Crown copyright with the title and source of the publication specified.
This document, with additional supporting data and text, is available to be downloaded on the Joint Nature Conservation Committee website: jncc.defra.gov.uk/ukbi
Published by the Department for Environment, Food and Rural Affairs.
National Statistics are produced to high professional standards set out in the Code of Practice for Official Statistics. They undergo regular quality assurance reviews to ensure that they meet customer needs. They are produced free from any political interference.
Image credits:
1. JNCC staff taking part in a bioblitz © JNCC
2. Swallow Hirundo rustica © Allan Drewitt/Natural England
3. White Ermine Spilosoma lubricipeda © Kentish Plumber/Creative Commons Licence
4. Honey Bee © Allan Drewitt/Natural England
5. Cold-water coral Lophelia pertusa © JNCC
PB 14468
12
3
4 5

1
Contents
Introduction UK Biodiversity Indicators 2017 2 Assessing indicators 3 Overview of assessment of change for all indicators 4 Assessment of change: all measures 7 Assessment of change: Strategic Goals B and C 9
Mainstreaming A1 Awareness, understanding and support for conservation 11 A2 Taking action for nature: volunteer time spent in conservation 12 A3 Value of biodiversity integrated into decision making 13 A4 Global biodiversity impacts of UK economic activity / sustainable consumption 14 A5 Integration of biodiversity considerations into business activity 14
Pressures B1 Agricultural and forest area under environmental management schemes 16 B2 Sustainable fisheries 19 B3 Climate change adaptation 20 B4 Pressure from climate change 21 B5 Pressure from pollution 22 B6 Pressure from invasive species 25 B7 Surface water status 27
Status C1 Protected areas 29 C2 Habitat connectivity 31 C3 Status of European habitats and species 32 C4 Status of UK priority species 34 C5 Birds of the wider countryside and at sea 37 C6 Insects of the wider countryside (butterflies) 41 C7 Plants of the wider countryside 43 C8 Mammals of the wider countryside (bats) 44 C9 Genetic resources for food and agriculture 45
Benefits D1 Biodiversity and ecosystem services 49
Implementation E1 Biodiversity data for decision making 52 E2 Expenditure on UK and international biodiversity 54
Enquiries about the biodiversity indicators or this publication 56 Annex: National Statistics 57
2
Introduction
UK Biodiversity Indicators 2017
Biodiversity is the variety of all life on Earth. It includes all species of animals and plants, and the natural systems that support them. Biodiversity matters because it supports the vital benefits we get from the natural environment. It contributes to our economy, our health and wellbeing, and it enriches our lives. The UK is a signatory to the Convention on Biological Diversity (CBD) and is committed to the biodiversity goals and targets ‘the Aichi targets’ agreed in 2010 and set out in the Strategic Plan for Biodiversity 2011-2020. We are also committed to developing and using a set of indicators to report on progress towards meeting these international goals and targets. There are related commitments on biodiversity made by the European Union, and the UK indicators may also be used to assess progress with these. The UK indicators were comprehensively reviewed during 2011 and 2012 to ensure they continued to be based on the most robust and reliable available data; and remained relevant to the new international goals and targets1. Since then the indicators have been refined to improve their relevance/quality, and new indicators developed to fill gaps. In this version of the publication as many as possible of the indicators have been updated with new data. In some cases, however, development work is ongoing, and where this is the case, the work to develop them has been described briefly. Indicators are useful tools for summarising and communicating broad trends. They are not intended to incorporate all the relevant information available in the UK. They are best seen, as their name suggests, as indicative of wider changes. The UK biodiversity indicators formed a major part of the UK’s 5th National Report to the CBD in 2014, supplemented with other information relating to UK biodiversity and implementation of the Strategic Plan for Biodiversity 2011-2020. It is expected that the indicators will be amongst the information used to produce the 6th National Report to the CBD (due to be submitted in December 2018) In 2015, JNCC produced an updated mapping of the indicators against both global and European biodiversity targets. Biodiversity policy is a devolved responsibility in the UK; England, Scotland, Wales and Northern Ireland have each developed or are developing their own biodiversity or environment strategies. Indicators are being developed to track progress with the respective commitments in each country. The UK indicators have a specific purpose for international reporting and were selected following consultation and agreement between the administrations. The indicators provide a flexible framework and a common set of methodologies which in some cases can also be used for country reporting. The indicators may be subject to further review as necessary. The UK Biodiversity Indicators are dependent on a wide variety of data, provided by Government, research bodies, and the voluntary sector – in total nearly 100 organisations are involved. As Official Statistics, the presentation and assessment of the indicators has been verified by the data providers, and the production and editing of the indicators has been overseen by Government statisticians. Links to the full detail of each of the previous editions are provided on the Joint Nature Conservation Committee website (stored on The National Archives website). At the 8th Biodiversity Indicators Forum (BIF8), a recommendation was made to publish a transparent statement of the level of confidence that can be ascribed to each individual indicator. Following peer review of a preliminary assessment the Biodiversity Indicators Working Group (Defra and JNCC) are re-visiting the methodology. This is a Defra National Statistics compendium (see Annex for further details). 1 This review involved wide consultation with the UK Biodiversity Indicators Forum, involving key
stakeholders.

3
Assessing indicators
Each indicator is composed of one or more measures that show trends over time. Many indicators have a single measure, but where data cannot be combined logically, the indicator will have more than one measure. Each measure is summarised or assessed separately using a set of ‘traffic lights’. The traffic lights show ‘change over time’. They do not show whether the measure has reached any published or implied targets, or indeed whether the status is ‘good’ or ‘bad’, although where targets have been set, these are identified in the indicator text. The traffic lights are determined by identifying the period over which the change is to be assessed and comparing the value of the measure in the base or start year with the value in the end year.
Improving Deteriorating
Little or no overall change Insufficient or no comparable data
Where possible the assessment has been made by evaluating trends using statistical analysis techniques. The assessment may be made by Defra statisticians in collaboration with the data providers, or undertaken by the data providers themselves. A green or red traffic light is only applied when there is sufficient confidence that the change is statistically significant and not simply a product of random fluctuations. For some indicators, it is not possible to formally determine statistical significance, and in such cases the assessment has been made by comparing the difference between the value of the measure in the base or start year and the value in the end year against a ‘rule of thumb’ threshold. The standard threshold used is 3%, unless noted otherwise. Where the data allow it, a three-year average is used to calculate the base year, to reduce the likelihood of any unusual year(s) unduly influencing the assessment. Where an indicator value has changed by less than the threshold of three per cent, the traffic light has been set at amber. The choice of 3% as the threshold is arbitrary, but is commonly used across other Government indicators; use of this approach is kept under review. The traffic lights only reflect the overall change in the measure from the base to latest year and do not reflect fluctuations during the intervening years. Where data are available, two assessment periods have been used: • Long-term – an assessment of change since the earliest date for which data are available,
although if the data run is for less than ten years a long-term assessment is not made. • Short-term – an assessment of change over the latest five years.2 For both long-term and short-term assessments the years over which the assessment is undertaken is stated in the assessment table. The individual indicators also have a third marker showing the direction of change in the last year. This period is too short for a meaningful assessment. However, when it exceeds a 1% threshold, the direction of change is given simply as an acknowledgement of very recent trends and as a possible early indication of emerging trends.
2 For a very few indicators, the short-term change is over a longer time-period as a result of the frequency of update of the data upon which the indicators are based. Thus indicators C3a and C3b have a six year short-term assessment.

4
Overview of assessment of change for all indicators
The table below summaries traffic light assessments for 24 indicators and their component measures. For each indicator it’s number, title, and measures (where applicable) are shown. Indicators are numbered according to the Strategic Goal with which they most closely link.
Indicator / measure(s) Long-term change3 Short-term change4
A1. Awareness, understanding and support for conservation
A2. Taking action for nature: volunteer time spent in conservation
2000–2015
2010–2015
A3. Value of biodiversity integrated into decision making
Under development
A4. Global biodiversity impacts of UK economic activity / sustainable consumption
Under development
A5. Integration of biodiversity considerations into business activity
A5a. Environmental Management Systems
A5b. Environmental consideration in supply chains
B1. Agricultural and forest area under environmental management schemes
B1a. Area of land in agri-environment schemes
1992–2016
2011–2016
B1b. Area of forestry land certified as sustainably managed
2001–2017
2012-2017
B2. Sustainable fisheries
1990–2013
2008–2013
B3. Climate change adaptation Under development
B4. Pressure from climate change (Spring Index) Not assessed Not assessed
B5. Pressure from pollution
B5a. Air pollution
B5a(i). Area affected by acidity
1996–2014
2009–2014
B5a(ii). Area affected by nitrogen
1996–2014
2009–2014
B5b. Marine pollution
1990–2015
2010–2015
B6. Pressure from invasive species
B6a. Freshwater invasive species
1960–2016
Not assessed
B6b. Marine (coastal) invasive species
1960–2016
Not assessed
B6c. Terrestrial invasive species 1960–2016
Not assessed
B7. Surface water status
2011–2016

5
Indicator / measure(s) Long-term change3 Short-term change4
C1. Protected areas
C1a. Total extent of protected areas: on-land
1950–2017
2012–2017
C1b. Total extent of protected areas: at-sea
1950–2017
2012–2017
C1c. Condition of Areas/Sites of Special Scientific Interest
2005–2017
2012–2017
C2. Habitat connectivity Under development
C3. Status of European habitats and species
C3a. Status of UK habitats of European importance
2007–2013
C3b. Status of UK species of European importance
2007–2013
C4. Status of UK priority species
C4a. Relative abundance
1970–2015
2010–2015
C4b. Distribution
1970–2016
2011–2016
C5. Birds of the wider countryside and at sea
C5a. Farmland birds 1970–2014
2009–2014
C5b. Woodland birds 1970–2014
2009–2014
C5c. Wetland birds 1975–2014
2009–2014
C5d. Seabirds Not Assessed Not Assessed
C5e. Wintering waterbirds 1975/76–2013/14
2008/09–2013/14
C6. Insects of the wider countryside
C6a. Semi-natural habitat specialists
1976–2016
2011–2016
C6b. Species of the wider countryside
1976–2016
2011–2016
C7. Plants of the wider countryside Under development
C8. Mammals of the wider countryside (bats)
1999–2015
2010–2015

6
Indicator / measure(s) Long-term change3 Short-term change4
C9. Genetic resources for food and agriculture
C9a. Animal genetic resources – effective population size of Native Breeds at Risk
C9a(i). Goat breeds
2004–2016
2011–2016
C9a(ii). Pig breeds
2000–2016
2011–2016
C9a(iii). Horse breeds
2000–2016
2011–2016
C9a(iv). Sheep breeds
2000–2016
2011–2016
C9a(v). Cattle breeds
2000–2016
2011–2016
C9b. Plant genetic resources – Enrichment Index
1960–2017
2012–2017
D1. Biodiversity and ecosystem services
D1a. Fish size classes in the North Sea
1983–2014
2009–2014
D1b. Removal of greenhouse gases by UK forests
1990–2015
2010–2015
D1c. Status of pollinating insects
1980–2014
2009–2014
E1. Biodiversity data for decision making
E1a. Cumulative number of records
2004–2017
2012–2017
E1b. Number of publicly accessible records at 1km2 resolution or better
2012–2017
E2. Expenditure on UK and international biodiversity
E2a. Public sector expenditure on UK biodiversity
2000/01–2015/16
2010/11–2015/16
E2b. Non-governmental organisation expenditure on UK biodiversity
E2c. UK expenditure on international biodiversity
2000/01–2015/16
2010/11–2015/16
3 Long-term – an assessment of change since the earliest date for which data are available, although if the data run is for less than ten years a long-term assessment is not made.
4 Short-term – an assessment of change over the latest five years. For a very few indicators the short-term change is over a longer time-period as a result of the frequency of update of the data upon which the indicators are based. Indicators C3a and C3b have a six year short-term assessment.
Improving Deteriorating
Little or no overall change Insufficient or no comparable data
The individual assessments for each measure can be combined to produce an overall picture of progress made. The charts below display the numbers of measures that have shown an

7
improvement (green traffic light), deterioration (red traffic light), little or no overall change (amber traffic light), or that have insufficient data for an assessment to be made (white traffic light). The UK Government is a signatory to the Convention on Biological Diversity (CBD) and is committed to the biodiversity goals and targets agreed in 2010 and set out in the Strategic Plan for Biodiversity 2011–2020. The targets are known as 'Aichi Targets', after the province in Japan where they were agreed. The Strategic Plan has five goals (A–E), each with a number of targets (the focus of each goal is shown by the words in bold type below): A. Address the underlying causes of biodiversity loss by mainstreaming biodiversity across
government and society. B. Reduce the direct pressures on biodiversity and promote sustainable use. C. Improve the status of biodiversity by safeguarding ecosystems, species and genetic diversity. D. Enhance the benefits to all from biodiversity and ecosystems. E. Enhance implementation through planning, knowledge management and capacity building.
As well as an overall summary, based on all measures in the indicator set, separate summaries for Strategic Goals B and C are shown, which are based on the indicators and measures linked to those goals (B1 to B7; C1 to C9). A number of indicators are under development for Strategic Goals A, D, and E, so they currently have very few measures; separate charts are therefore not shown.
Assessment of change: all measures
The UK biodiversity indicators set comprises 24 indicators and 49 measures. Of these, seven measures are not assessed in the long-term, and ten in the short term, as the measures are either under development, or analytical methods for short-term assessment need to be refined. Twenty of the 42 measures assessed over the long term show an improvement, compared to 11 of the 39 measures that are assessed over the short term. Eleven measures show a decline in the long term, and twelve a decline in the short term. Measures that improved or deteriorated in the long term have not necessarily continued to improve or deteriorate respectively in the short term.

8
The 11 measures showing an improvement in the short term are: B2. Sustainable fisheries B5b. Marine pollution (heavy metals) C1b. Total area of protected sites: at sea C3b. Status of UK species of European importance C9a. Animal genetic resources (2 measures) C9b. Plant genetic resources D1a. Fish size classes in the North Sea D1b. Greenhouse gas removals by forests E1. Biodiversity data for decision making (2 measures)
The 20 measures which have improved in the long term are:
A2. Taking action for nature: volunteer time spent in conservation B1a. Area of land in agri-environment schemes B1b. Area of forestry land certified as sustainably managed B2. Sustainable fisheries B5. Pressure from pollution (3 measures) C1. Protected areas (3 measures) C5e. Wintering water birds C8a. Mammals of the wider countryside (Bats) C9a. Animal genetic resources (3 measures) C9b. Plant genetic resources D1b. Greenhouse gas removals by UK forests E1a. Cumulative number of records in the NBN E2. Expenditure on UK and international biodiversity (2 measures)
The 12 measures showing a decline in the short term are:
A2. Taking action for nature: volunteer time spent in conservation B1a. Area of land in agri-environment schemes B7. Surface water status C3a. Status of UK habitats of European importance C4a. Status of UK Priority species: Relative abundance C5. Birds of the wider countryside and at sea (3 measures) C9a. Animal genetic resources (2 measures) E2. Expenditure on UK and international biodiversity (2 measures)
The 11 measures showing long-term deterioration are:
B6. Pressure from invasive species (3 measures) C4a. Status of UK Priority species: Relative abundance C5. Birds of the wider countryside and at sea (3 measures) C6. Insects in the wider countryside (butterflies) (2 measures) C9a. Animal genetic resources - horse breeds D1c. Status of Pollinating insects

9
Key changes to the indicator set since the previous publication are: i. Corrections to the historic data for indicator A2 on conservation volunteering hours. ii. As a result of changes to the way in which agri-environment schemes are implemented in
the UK, the measure of entry-level schemes (indicator B1a) has been moved to the background in the 2017 publication (Environmental Stewardship in England closed to new agreements in 2014 and ELS only agreements have started to expire). This has the effect of decreasing the number of measures in the indicator set by one.
iii. An improved bats indicator (indicator C8) through removal of summer roost count data for common and soprano pipistrelles as investigations have shown that the pipistrelle species’ frequent ‘roost switching’ can cause a negative bias.
iv. The two indicators based on based on Bayesian statistics: distribution of UK priority species (indicator C4b) and status of pollinating insects (indicator D1c) have both benefited from methodological improvements to the underlying modelling techniques, which have allowed many more species to be brought into these measures. As such they are not directly comparable with the indicators previously published.
v. The traffic light assessment for the seabirds measure (indicator C5d) has been removed until a way of assessing variability is devised. This follows recommendations in a quality assurance science panel report, dated January 2016.
Assessment of change: Strategic Goals B and C
Goal B: Reduce the direct pressures on biodiversity and promote sustainable use.
The indicators under Strategic Goal B (seven indicators and 12 measures prefixed 'B' in the summary table) show progress is being made to address the pressures on biodiversity (e.g. in the proportion of fisheries that are sustainable, in the area of land in agri-environment schemes, air and marine pollution). However, there has been a long-term increase in the prevalence of invasive species, reflecting a pattern of continuing or growing threat to biodiversity in the UK. In the short-term there is little or no overall change in the area of forestry land certified as sustainably managed, and in the area of semi-natural habitats affected by acidification and/or eutrophication. There was a short-term decline in the area of land in higher-level / targeted agri-environment schemes, and in surface water status.

10
Goal C: Improve the status of biodiversity by safeguarding ecosystems, species and genetic diversity.
There were long-term declines for seven measures under Strategic Goal C (nine indicators and 23 measures prefixed 'C' in the summary table, covering status of biodiversity), reflecting the declines in many species populations seen in the 1970s and 1980s. There is some evidence that some of the previous declines have slowed, with some measures assessed as deteriorating in the long-term showing little or no overall change in the short-term (e.g. butterflies, woodland birds, and the abundance and distribution of priority species). In total, six measures have shown improvement over the short term, including extent of protected areas at sea, status of UK species of European importance, and plant genetic resources. These conclusions should be viewed with some caution as changes are more difficult to assess reliably over the short term.
11
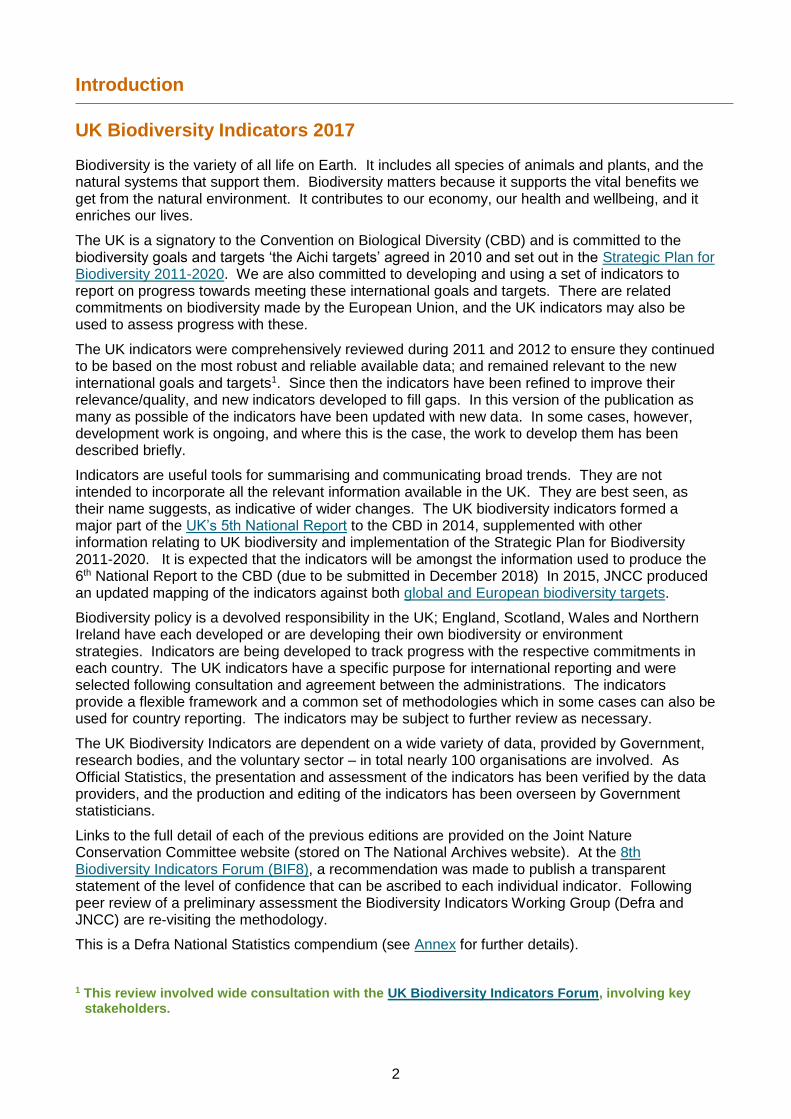
Indicator Description This indicator addresses awareness of biodiversity and understanding of its value, concern about biodiversity loss, as well as support for performing actions that can help to conserve it. It uses a hierarchical system to group people in the UK according to the extent to which they are aware of the threat to biodiversity in the UK, their level of concern about the loss of biodiversity and the number and type of actions they take to support and protect it.
A1. Awareness, understanding and support for conservation
Type: Response indicator
No new data since previous publication. In 2014, 6% of people in the UK were highly engaged with the issue of biodiversity loss. These are people who are aware of the threat to biodiversity in the UK, are concerned about the loss of biodiversity, and take actions to support and protect biodiversity, including requiring some higher effort. In 2014, 25% of people in the UK showed some engagement with the issue of biodiversity loss. These are people who are aware of the threat to biodiversity in the UK, are concerned about the loss of biodiversity and take some ‘day-to-day’ actions to support and protect biodiversity. 16% of people are aware of the threat to biodiversity, but are not concerned about it. 52% of survey respondents stated that they were not aware of the threat to biodiversity in the UK.
Figure A1i. Public engagement with biodiversity loss: awareness, concern and action, 2014.
Notes:
1. Groups are defined as: ‘not aware’; ’not engaged’; ‘some engagement’; and ‘high engagement’, according to responses to survey questions concerning engagement with biodiversity loss, as described in the background section below.
2. Data are weighted based on the relative population size of each country. Source: Department of the Environment Northern Ireland, Natural England, Natural Resources
Wales, Scottish Natural Heritage.
0
20
40
60
80
100
2014
Perc
enta
ge o
f peo
ple
High engagementSome engagementNot engagedNot aware
United Kingdom

12
Indicator Description
The indicator presents an index of the number of hours worked by volunteers for 13 UK conservation charities and public bodies (including National Parks England which represents all National Parks in England – see background section for a full list). Conservation volunteering includes any voluntary activity for an organisation or community undertaken to: further the understanding, protection or enjoyment of the natural environment, including wildlife recording and surveying; practical countryside management; providing education, training and guided walks; and administration or other office support.
Assessment of change in the percentage of people highly engaged with the issue of biodiversity loss
Long term Short term Latest year
Percentage of people highly engaged Not assessed
A2. Taking action for nature: volunteer time spent in conservation
Type: Response Indicator
The amount of time people spend volunteering to assist in conservation in part reflects society’s interest in and commitment to biodiversity. Between 2000 and 2015 the amount of time contributed by volunteers has increased by 18%, but in the five years to 2015 it decreased by 14%. The methodology used by conservation charities can change from year to year. This can cause fluctuations in the data, particularly where there are revised methods used by charities that have previously recorded large amounts for total volunteer hours.
Figure A2i. Index of volunteer time spent in selected UK conservation organisations, 2000 to 2015.

13
Indicator Description
Indicator under development. The integration of biodiversity into mainstream social and economic processes should allow us to continue to enjoy the benefits of biodiversity that we currently achieve. However, this is a difficult concept to be able to measure, and it has not yet been possible to develop an indicator.
Notes: 1. The index is calculated using a non-weighted aggregation across organisations. It is
therefore strongly dependent on the trends reported by the organisations recording large amounts for total volunteer hours.
2. Interpolated estimates (based on trends reported by other organisations) have been used to fill missing years for the Canal & River Trust (formerly British Waterways) (2000–2009), Butterfly Conservation (2000–2002), The Conservation Volunteers (2000–2005), Loch Lomond & The Trossachs National Park Authority (2000–2001, 2003), National Parks England (2000–2008), Natural England (2000, 2002), Plantlife (2000–2006), The Wildlife Trusts (2000–2004 and 2006), and the Woodland Trust (2000–2001).
3. Data provided by the The Conservation Volunteers, Loch Lomond & The Trossachs National Park Authority, Natural England, the Canal & River Trust (formerly British Waterways), National Parks England, and RSPB were for financial years rather than calendar years. Financial year data have been assigned to the first calendar year (e.g. 2011/12 data were allocated to 2011).
4. The data series has been revised since the last publication in 2015, due to some organisations providing updated figures for previous years.
Source: Bat Conservation Trust, Botanical Society of Britain & Ireland, British Trust for Ornithology, Butterfly Conservation, Canal & River Trust (formerly British Waterways), The Conservation Volunteers, Loch Lomond & The Trossachs National Park Authority, Natural England, National Parks England, Plantlife, RSPB, The Wildlife Trusts, Woodland Trust.
Assessment of change in volunteer time spent in conservation
Long term Short term Latest year
Conservation volunteering 2000–2015
2010–2015
Increased (2015)
A3. Value of biodiversity integrated into decision making
Indicator under development – progress to date No change from previous publication. Aichi Target 2 is focussed on mainstreaming biodiversity into national- and local-level decision making processes. Indicator A3 could focus on a number of areas, including the extent of schemes involving payments for ecosystem services, and progress in developing ecosystems accounts within the national accounting framework.

14
Indicator Description
The proportion of large businesses (250+ employees) in a range of sectors that are taking steps to minimise their environmental impact as measured using an Environmental Management System (EMS). The Environmental Protection Expenditure (EPE) survey (on which this indicator is based) has been discontinued. As a result it will not be possible to further update this indicator. Possibilities for a replacement are being considered.
Indicator Description
Indicator under development. Production and consumption in the UK has an impact on the natural environment beyond our shores through the range of imports and exports of goods and services. A range of research work has been undertaken, but it has not at present been possible to develop an indicator.
A4. Global biodiversity impacts of UK economic activity / sustainable consumption
Indicator under development – progress to date No change from previous publication. Research has been undertaken to assess how patterns of UK consumption impact on the key drivers of biodiversity change overseas and identify options for mitigating those impacts. This includes: • Analysis and modelling of trade pathways
and supply chains for goods and services to identify important sources of production; and
• Identification of the potential impact of key production systems and products on biodiversity. An assessment framework has been developed to provide information on the direct and indirect links between consumption in the UK and environmental impacts that occur due to production in other countries. A global trade model that retains product-level production detail and quantitative links to associated environmental impacts has been developed to allow top-down assessment of potential impacts. This model facilitates the selection of priority commodities and regions which can then be investigated in more detail using a case-study approach. Further research was undertaken in 2014 to further develop this approach. In combination, these projects have defined what data are available on biomass flows into the UK economy, and the scope for undertaking the same analysis at country level using Scotland as a model.
A5. Integration of biodiversity considerations into business activity
a. Environmental Management Systems
b. Environmental consideration in supply chains
Type: Response indicator
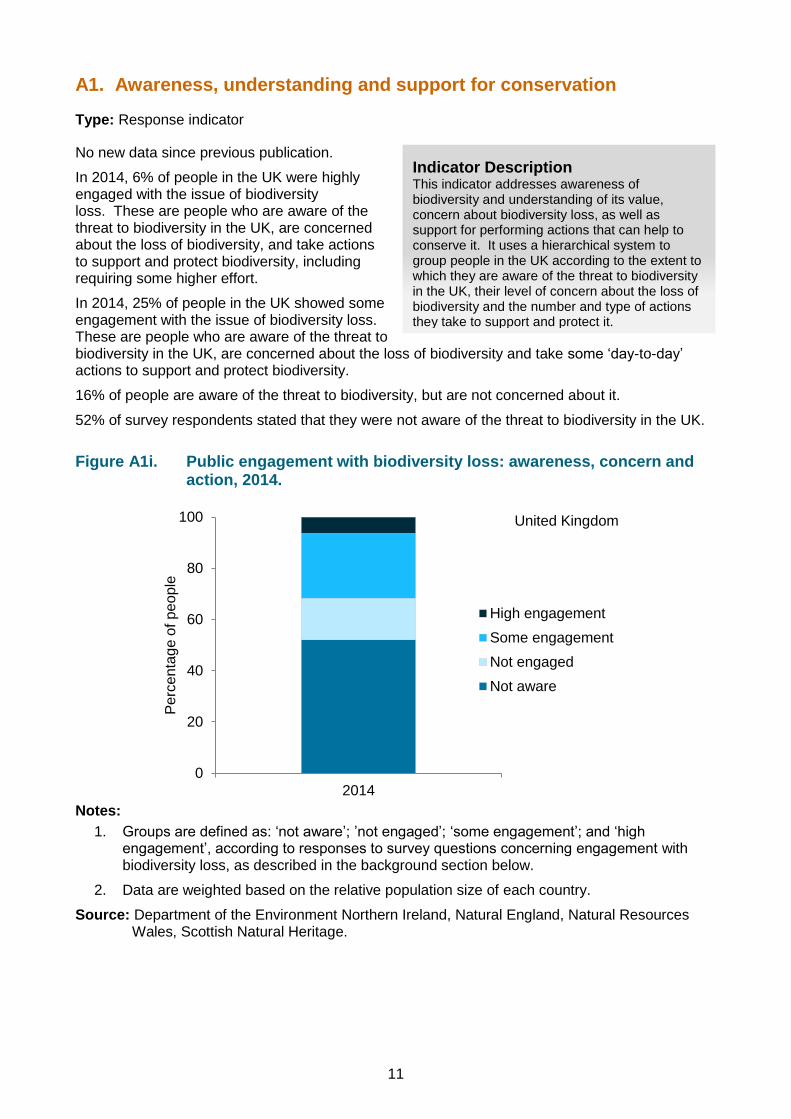
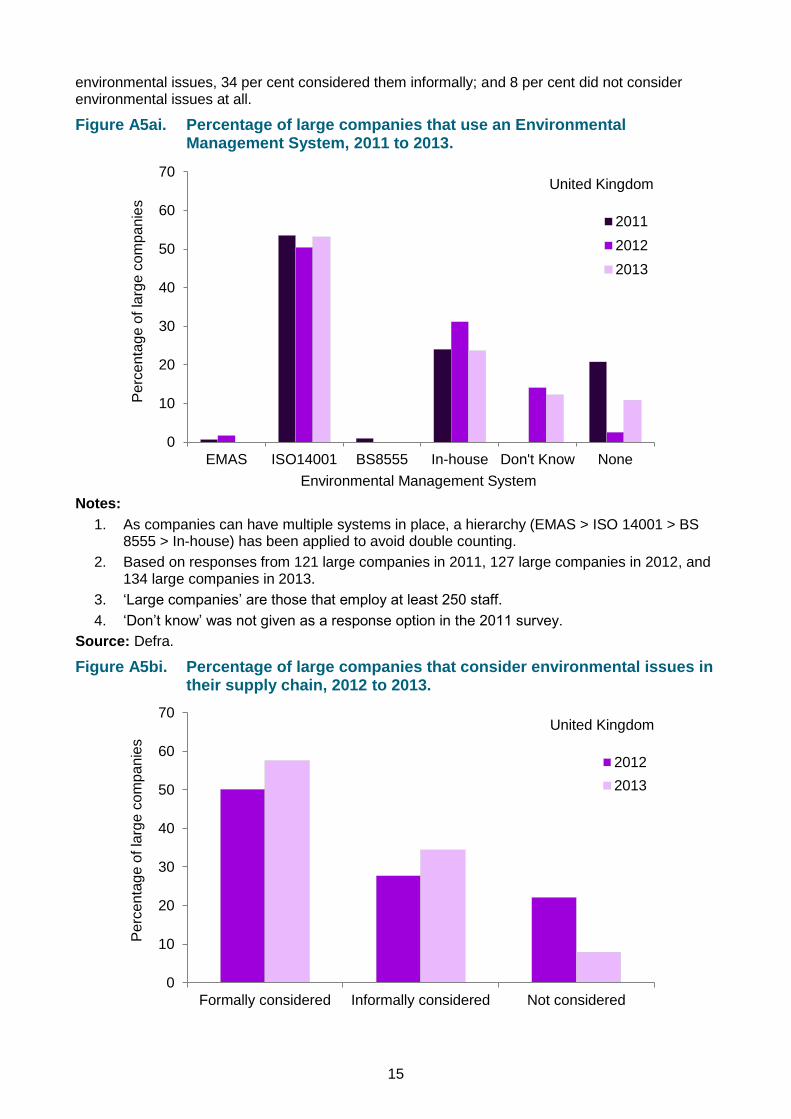
No new data since the previous publication. In 2013, 77% of large companies that responded to the EPE Survey had an Environmental Management System (EMS) in place, compared with 83% of responding companies in 2012 and 79% in 2011. In 2013, 53 per cent of responding large companies had an EMS certified to ISO 14001. Overall, in 2013 24 per cent of respondents had an EMS in place which was not externally certified (i.e. it was developed and implemented to meet “in-house” needs). This compares to 31 per cent of respondents having an “in-house” EMS in 2012. Overall, 92 per cent of large companies considered environmental issues within their supply chain in 2013, up from 78 per cent in 2012. Within the 2013 figure, 58 per cent formally considered
15
environmental issues, 34 per cent considered them informally; and 8 per cent did not consider environmental issues at all.
Figure A5ai. Percentage of large companies that use an Environmental Management System, 2011 to 2013.
Notes:
1. As companies can have multiple systems in place, a hierarchy (EMAS > ISO 14001 > BS 8555 > In-house) has been applied to avoid double counting.
2. Based on responses from 121 large companies in 2011, 127 large companies in 2012, and 134 large companies in 2013.
3. ‘Large companies’ are those that employ at least 250 staff. 4. ‘Don’t know’ was not given as a response option in the 2011 survey.
Source: Defra.
Figure A5bi. Percentage of large companies that consider environmental issues in their supply chain, 2012 to 2013.
0
10
20
30
40
50
60
70
EMAS ISO14001 BS8555 In-house Don't Know None
Perc
enta
ge o
f lar
ge c
ompa
nies
Environmental Management System
United Kingdom
201120122013
0
10
20
30
40
50
60
70
Formally considered Informally considered Not considered
Perc
enta
ge o
f lar
ge c
ompa
nies
United Kingdom
20122013
16
Indicator Description
Agri-environment schemes require land managers, including farmers, to implement environmentally beneficial management and to demonstrate good environmental practice on their land. The higher-level or targeted schemes promote environmental management aimed to: conserve wildlife; maintain and enhance landscape quality and character; protect the historic environment and natural resources; and promote public access and understanding of the countryside. The entry-level type schemes aim to encourage large numbers of land managers, , to implement simple and effective environmental management on their land .
Notes: 1. Based on responses from 120 large companies in 2012, and 133 large companies in 2013. 2. ‘Large companies’ are those that employ at least 250 staff.
Source: Defra.
Assessment of change in biodiversity considerations in business activity
Long term Short term Latest year
Percentage of large companies that use an Environmental Management System (EMS) Decreased (2013)
Percentage of companies where the environment is formally considered in the supply chain
Increased (2013)
B1. Agricultural and forest area under environmental management schemes
a. Area of land in agri-environment schemes
Type: Response Indicator
In 2016, the total area of land in higher-level or targeted agri-environment agreements in the UK was just under 2.4 million hectares: 1.4 million hectares in England; 0.2 million hectares in Wales; 0.7 million hectares in Scotland; and 0.1 million hectares in Northern Ireland. Fluctuations in areas of land under agri-environment agreements over time can occur as a result of the introduction of new schemes and the ending of previous scheme agreements. Existing agreements will continue until they expire.

17
Figure B1ai. Area of land covered by higher-level or targeted agri-environment schemes, 1992 to 2016.
Notes:
1. The following schemes have been included as higher-level or targeted agri-environment schemes: England: Environmentally Sensitive Areas (ESA), Countryside Stewardship,
Higher Level Stewardship (which includes ELS linked to HLS) and from 2016 new Countryside Stewardship (Higher Tier and Mid Tier). England Mid Tier and Higher Tier schemes of the new Countryside Stewardship both contribute to B1ai.
Scotland: ESA, Countryside Premium, and Rural Stewardship, Rural Priorities, and from 2016 Agri-Environment Climate Scheme.
Wales: ESA, Tir Cymen, Tir Gofal, and Glastir Advanced. Northern Ireland: ESA, Countryside Management and NI Countryside Management.
2. Higher-level schemes have stricter criteria for qualification than other agri-environment schemes.
Source: Department for Agriculture and Rural Development Northern Ireland, Defra, Natural England, Scottish Government, Welsh Government.
Assessment of change in area of land covered by agri-environment schemes
Long term Short term Latest year
Higher-level or targeted schemes 1992–2016
2011–2016
Decreased (2016)

18
Indicator Description
This indicator shows the percentage of the woodland area that is certified against agreed environmental standards. Woodland certification schemes promote good forest practice and are used to demonstrate that wood or wood products come from well-managed forests.
b. Area of forestry land certified as sustainably managed
Type: Response Indicator
In March 2017, there were 1.39 million hectares of certified woodland across the UK, representing 44% of the total woodland area. The proportion of woodland certified as sustainably managed has remained stable at either 43% or 44% since 2007.
Figure B1bi. Percentage of woodland area certified as sustainably managed, 2001 to 2017.
Notes: All figures relate to data at 31 March, apart from 2001 (31 December) and 2002 (30
September). Source: Forestry Commission. Certification of woodlands promotes responsible forest management to safeguard forests’ natural heritage and protect threatened species. Since 2001, the percentage of woodland certified as sustainably managed in the UK has increased from 36% to 44%. In 2016 the proportion decreased slightly to 43% following four consecutive years stable at 44%, returning to 44% in 2017. The total area certified can change if new woodlands are certified, if existing certificates are not renewed, or if there is a time lag in renewal of an existing certificate.

19
Indicator Description Sustainable fisheries will help to ensure our marine ecosystems remain diverse and resilient, and provide a long-term and viable fishing industry. This indicator is likely to change in the future to reflect a new indicator being developed to report under the OSPAR Convention.
Assessment of change in area of woodland certified as sustainably managed
Long term Short term Latest year
Percentage of woodland certified 2001–2017
2012–2017
Increased (2017)
Note: Assessment of the individual measures are based on a three-year average from the baseline, using the three earliest consecutive years available.
B2. Sustainable fisheries
Type: Pressure Indicator
No new data since the previous publication.
In 2013, 31% of the indicator stocks around the UK (four of the 13 stocks) were at full reproductive capacity and were being harvested sustainably. This is an increase from the average for 1990–1992 of 24% (three indicator stocks). The sustainability indicator in 2013 has increased from the lowest value of 8% in 1998 and 1999, and from the average value for 2007–2009 (21%)
Figure B2i. Percentage of fish stocks harvested sustainably and at full reproductive capacity, 1990 to 2013.
Notes: Based on 13 stocks for which accurate time series are available, derived from stock
assessment reports. Source: Centre for Environment, Fisheries and Aquaculture Science; International Council for the
Exploration of the Sea.
0
5
10
15
20
25
30
35
40
1990 1993 1996 1999 2002 2005 2008 2011
Perc
enta
ge o
f fis
h st
ocks
United Kingdom

20
Indicator Description This is a difficult concept to be able to measure, and it has not yet been possible to develop an indicator.
Assessment of change in stocks harvested sustainably and at full reproductive capacity
Long term Short term Latest year
Sustainable fisheries 1990–2013
2008–2013
No change (2013)
B3. Climate change adaptation
Indicator under development – progress to date No change from previous publication. According to the UK Meteorological Office, the average temperature over the first decade of the 21st century was significantly warmer than any preceding decade in the series of records stretching back over 160 years. In September 2013, the Intergovernmental Panel on Climate Change (IPCC) concluded that it was 95 per cent certain that humans are the "dominant cause" of global warming since the 1950s, and that warming is projected to continue under all scenarios. Model simulations indicate that global surface temperature change by the end of the 21st century is likely to exceed 1.5 degrees Celsius relative to 1850. The IPCC’s Fourth Assessment Report defines climate change adaptation as 'adjustment in natural or human systems in response to actual or expected climatic stimuli or their effects, which moderates harm or exploits beneficial opportunities’. Actions that are taken to adapt to climate change can reduce the risk of biodiversity loss, and provide opportunities for biodiversity to adapt to changing circumstances. Climate change indicators potentially need to cover a breadth of issues. Previous work highlighted possibilities to develop measures relating to water stress in protected areas, and gains and losses in coastal habitats, but a number of technical issues have meant that it is not possible to collate and present UK-wide data as previously expected.

21
Indicator Description This is a context indicator, and is not assessed; it is shown to highlight a biological response to climate change and a potential pressure on biological systems. It shows the impact of temperature change on the timing of biological events such as flowering or migration in the spring. The UK Spring Index is calculated from the annual mean observation date of the following four biological events: first flowering of hawthorn (Crataegus monogyna), first flowering of horse chestnut (Aesculus hippocastanum), first recorded flight of an orange-tip butterfly (Anthocharis cardamines), and first sighting of a swallow (Hirundo rustica).
B4. Pressure from climate change
Spring Index
Type: Context indicator
Since 1999, the annual mean observation dates have been around 6 days in advance of the average dates in the first part of the 20th century.
The Index shows a strong relationship with mean temperature in March and April, and it advances more rapidly when the mean temperature equals or exceeds 7 degrees Celsius.
Figure B4i. Index of the timing of biological spring events (number of days after
31 December) in the UK, 1891 to 1947, and 1999 to 2016.
Notes: *Number of days after 31 December (e.g. day 121 = 1 May). Source: 1891 to 1947 – Royal Meteorological Society; 1999 to 2015 – UK Phenology Network.
This is a contextual indicator showing how changes in climate, particularly temperature, are associated with changes in the timing of biological events. The Spring Index for the UK has high year-to-year variability, but since 1999 biological events in the spring have occurred around 6 days in advance of the average dates in the period 1891 to 1947 (Figure B4i). The figures published since 2015 are slightly different to those published previously as a result of data correction in the underpinning database.
22
Indicator Description The air pollutants – sulphur dioxide, nitrogen oxides and ammonia – can contribute to acidification, and nitrogen oxides and ammonia can contribute to terrestrial eutrophication. Critical loads are thresholds above which significant harmful effects may occur on sensitive UK habitats. The pollutants arise mainly from burning fossil fuels, industry, road transport, and emissions from livestock waste. Around a third of UK land area is sensitive to acidification, and a third to eutrophication (with some areas sensitive to both). A three-year average of deposition is used to calculate the exceedance of critical loads to give the figures for each year represented.
The advancement of spring events is strongly linked to warmer temperatures in March and April. The mean observation dates in 2011 were the second earliest for which there are records. The warmest April in the Central England Temperature series (1659 onwards) occurred in 2011 and was almost certainly influential.
B5. Pressure from pollution
a. Air pollution
i. Area affected by acidity
ii. Area affected by nitrogen
Type: Pressure Indicator
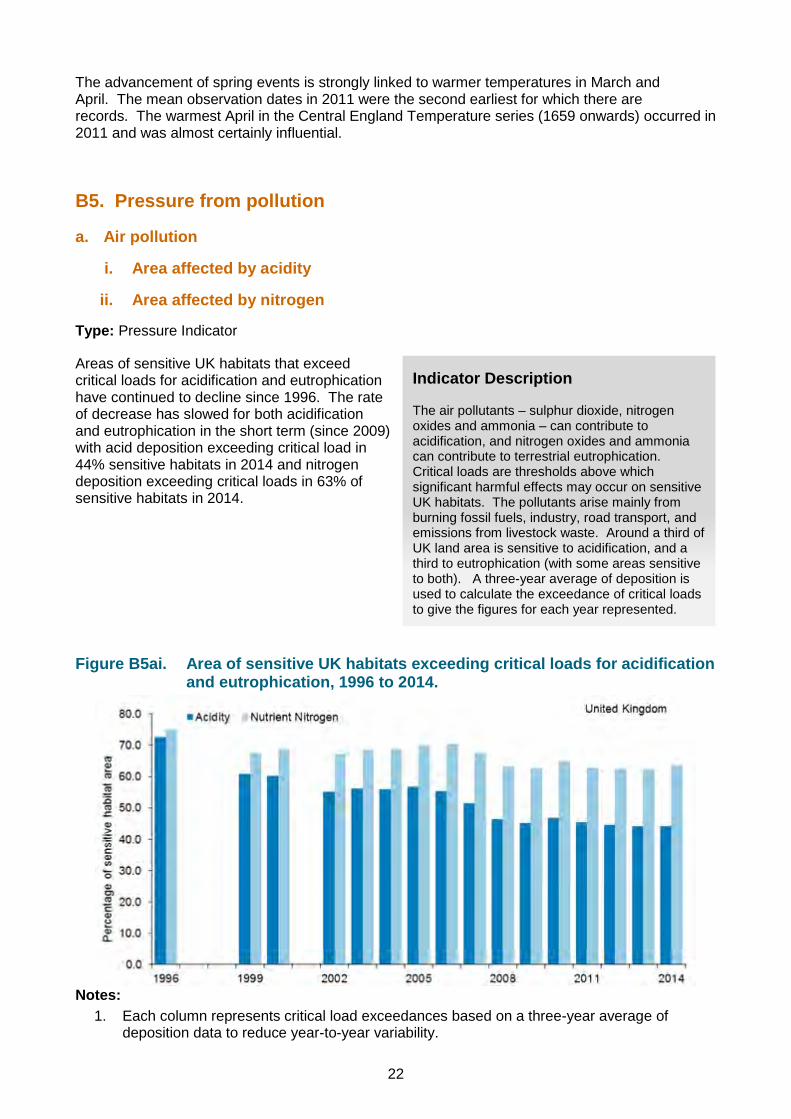
Areas of sensitive UK habitats that exceed critical loads for acidification and eutrophication have continued to decline since 1996. The rate of decrease has slowed for both acidification and eutrophication in the short term (since 2009) with acid deposition exceeding critical load in 44% sensitive habitats in 2014 and nitrogen deposition exceeding critical loads in 63% of sensitive habitats in 2014.
Figure B5ai. Area of sensitive UK habitats exceeding critical loads for acidification
and eutrophication, 1996 to 2014.
Notes:
1. Each column represents critical load exceedances based on a three-year average of deposition data to reduce year-to-year variability.

23
2. Since 2002, nitric acid has been included in the estimates of nitrogen deposition, and since 2003 aerosol deposition of sulphate, nitrate and ammonium have also been included. This additional deposition led to some increases in critical load exceedance compared with earlier periods.
3. There was a revision to the calculation of deposition data for the period 2004 to 2013 in 2015, which means the exceedance results for this period are not directly comparable to those previously published.
Source: Centre for Ecology & Hydrology.
Assessment of change in area of sensitive habitat exceeding critical loads
Long term Short term Latest year
Area affected by acidity 1996–2014
2009–2014
No change (2014)
Area affected by nitrogen 1996–2014
2009–2014
No change (2014)
Critical loads are thresholds for the deposition of pollutants causing acidification and/or eutrophication above which significant harmful effects on sensitive UK habitats may occur. Approximately 78,000km2 of UK terrestrial habitats is sensitive to acid deposition. About 73,000km2 is sensitive to eutrophication; much of this is sensitive to both. In 1996, acid deposition exceeded critical loads in 73% of the area of sensitive habitats. This declined to 44% in 2014. There has been a slight decrease in the area affected over the short term, since 2009, when the figure was 45%. In 2014, nitrogen deposition exceeded critical loads in 63% of sensitive habitats. This was a decrease from a level of 75% in 1996. However there was no change in the short term, since 2009 when the figure was also 63%. Based on these figures the habitat areas at risk from acid and nitrogen deposition has declined over the long term (1996 to 2014), however, reducing deposition below the critical loads does not necessarily mean that ecosystems have recovered, as there can be a time-lag before both chemical and biological recovery occurs.
b. Marine pollution
Type: Pressure indicator
The combined inputs of all six hazardous materials into marine environments have shown a long term decrease of 78% since 1990. Inputs of five of these substances show decreases since 2010, however the input of cadmium has increased by 3% in the short term.
Indicator Description
The indicator shows the combined input of six of the most hazardous substances to the UK marine environment. The indicator is based on levels of five heavy metals (cadmium, mercury, copper, lead and zinc) and one organic compound (lindane). Pollution in the marine environment from these six substances should decrease to levels that are non-detrimental by 2020.
24
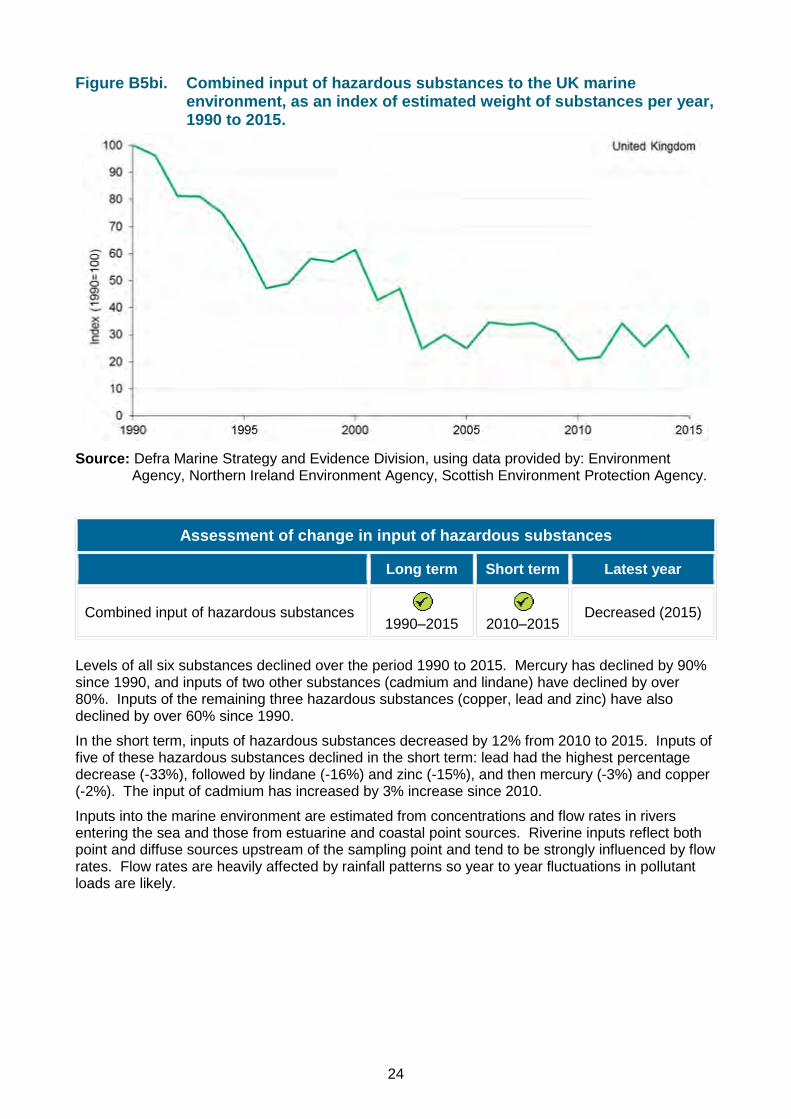
Figure B5bi. Combined input of hazardous substances to the UK marine environment, as an index of estimated weight of substances per year, 1990 to 2015.
Source: Defra Marine Strategy and Evidence Division, using data provided by: Environment
Agency, Northern Ireland Environment Agency, Scottish Environment Protection Agency.
Assessment of change in input of hazardous substances
Long term Short term Latest year
Combined input of hazardous substances 1990–2015
2010–2015
Decreased (2015)
Levels of all six substances declined over the period 1990 to 2015. Mercury has declined by 90% since 1990, and inputs of two other substances (cadmium and lindane) have declined by over 80%. Inputs of the remaining three hazardous substances (copper, lead and zinc) have also declined by over 60% since 1990. In the short term, inputs of hazardous substances decreased by 12% from 2010 to 2015. Inputs of five of these hazardous substances declined in the short term: lead had the highest percentage decrease (-33%), followed by lindane (-16%) and zinc (-15%), and then mercury (-3%) and copper (-2%). The input of cadmium has increased by 3% increase since 2010. Inputs into the marine environment are estimated from concentrations and flow rates in rivers entering the sea and those from estuarine and coastal point sources. Riverine inputs reflect both point and diffuse sources upstream of the sampling point and tend to be strongly influenced by flow rates. Flow rates are heavily affected by rainfall patterns so year to year fluctuations in pollutant loads are likely.
25
Indicator Description
Non-native species are those that have reached Great Britain by accidental human transport, deliberate human introduction, or which arrived by natural dispersal from a non-native population in Europe. Species that arrived since 1500 are included within this indicator. Most non-native species are considered benign or positive but some have a negative impact on native species through the spread of disease, competition for resources, or by direct consumption, parasitism or hybridisation and are termed invasive. Invasive non-native species have one or more of these negative impacts and a high capacity for spread to natural and semi-natural habitats. The indicator shows the change in number of invasive non-native species established across more than 10% of the land area of Great Britain, or more than 10% of the extent of the coastline.
B6. Pressure from invasive species
a. Freshwater invasive species
b. Marine (coastal) invasive species
c. Terrestrial invasive species
Type: Pressure Indicator
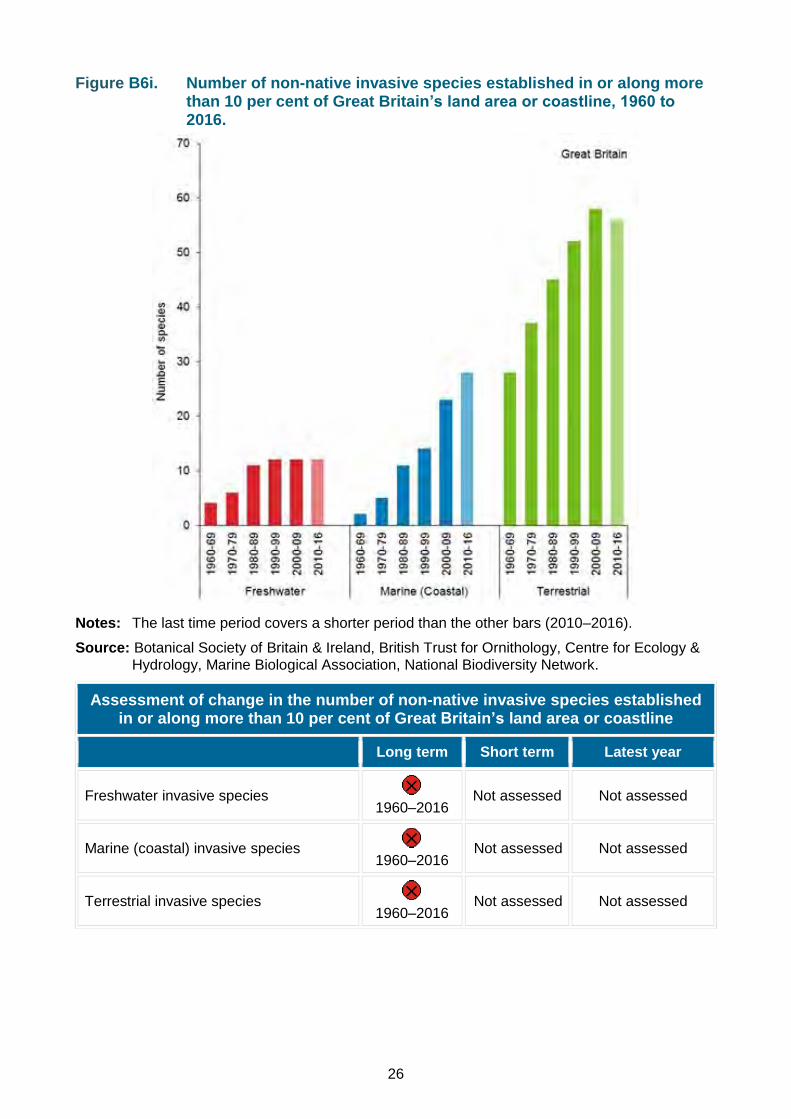
Of the 3,056 non-native species in Great Britain, 1,957 are considered to be established, and of those 183 are considered to be exerting a negative impact on native biodiversity in Great Britain. Over the period 1960–2016, non-native species have become more prevalent in the countryside. The number of these invasive non-native species established in or along more than 10% of Great Britain’s land area or coastline has increased since 1960 in the freshwater, terrestrial and marine (coastal) environments, increasing the likely pressure on native biodiversity. For the latest period 2010–2016, compared with 2000–2009, the number of these established in or along more than 10% of Great Britain’s land area or coastline has remained stable for freshwater species, at 12 species, and has increased for marine species, from 18 to 28. Terrestrial species have decreased from 58 to 56.
26
Figure B6i. Number of non-native invasive species established in or along more than 10 per cent of Great Britain’s land area or coastline, 1960 to 2016.
Notes: The last time period covers a shorter period than the other bars (2010–2016). Source: Botanical Society of Britain & Ireland, British Trust for Ornithology, Centre for Ecology &
Hydrology, Marine Biological Association, National Biodiversity Network.
Assessment of change in the number of non-native invasive species established in or along more than 10 per cent of Great Britain’s land area or coastline
Long term Short term Latest year
Freshwater invasive species 1960–2016
Not assessed Not assessed
Marine (coastal) invasive species 1960–2016
Not assessed Not assessed
Terrestrial invasive species 1960–2016
Not assessed Not assessed

27
Indicator Description
The Water Framework Directive (WFD) is an important mechanism for assessing and managing the water environment in the EU, through a six yearly cycle of planning and implementing measures to protect and improve the water environment. This indicator shows the percentage of surface water bodies in each status class and the change in the percentage of water bodies in the UK awarded a good or high surface water status class under the WFD. Around 10,000 water body assessments are included each year of the indicator; including rivers, canals, lakes, estuaries and coastal waters.
B7. Surface water status
Type: State Indicator
There was a decrease in the overall number of water bodies awarded high or good surface water status between 2011 and 2016. In 2011, 37% of surface water bodies were assessed under the Water Framework Directive (WFD) in the UK as being in high or good status, falling to 35% in 2016; the indicator is therefore assessed as declining in the short term.
Figure B7i. Status classification of UK surface water bodies under the Water Framework Directive, 2009 to 2016.
Notes:
1. Based on numbers of surface water bodies classified under the Water Framework Directive in England, Wales, Scotland and Northern Ireland. Includes rivers, canals (Northern Ireland does not report on canals), lakes, estuaries and coastal water bodies.
2. A water body is a management unit, as defined by the relevant authorities. 3. The results published each year relate to data reported in that year under the Water
Framework Directive, data reported in a given year relates to data collected over the previous year. From 2016, England, Wales and Northern Ireland have moved to a triennial

28
reporting system, Wales and Northern Ireland reported in 2015 and will report next in 2018, England reported in 2016 and will report next in 2019. As classifications are valid until they are next assessed (which could be 1, 3 or 6 years), for years where a country does not report their latest available data is carried forward, as it is still valid.
4. The percentage of water bodies in each status class has been calculated based on the total number of water bodies assessed in each year.
5. Number of water body assessments included varies slightly from year to year: 10,832 water body assessments were included in 2009; 10,761 in 2010; 10,782 in 2011; 10,704 in 2012; 10,763 in 2013; 10,799 in 2014; 10,379 in 2015 and 9,297 in 2016. This reduction in the number assessed in 2016 was primarily due England moving to cycle 2, and the removal of a number of water bodies that were below the 10km2 catchment area in line with guidance.
6. Water bodies that are heavily modified or artificial (HMAWBs) are included in this indicator alongside natural water bodies. HMAWBs are classified as good, moderate, poor or bad ‘ecological potential’. Results have been combined; for example, the number of water bodies with a high status class has been added to the number of HMAWBs with high ecological potential.
Source: Department of the Environment Northern Ireland, Environment Agency, Natural Resources Wales, Scottish Environment Protection Agency.
Assessment of change in status of UK surface water bodies
Long term Short term Latest year
Percentage of UK surface water bodies in ‘High’ or ‘Good Ecological Status’
2011–2016
No change (2016)
The WFD specifies the quality elements that can be used to assess the surface water status of a water body. Quality elements can be biological (e.g. fish, invertebrates, plants), chemical (e.g. heavy metals, pesticides, nutrients) or indicators of the condition of the habitats and water flows and levels (e.g. presence of barriers to fish migration, modelled lake level data). Classifications indicate where the quality of the environment is good, where it may need improvement and what may need to be improved. They can also be used, over the years, to plan improvements, show trends and monitor progress. The ecological status of UK surface water bodies is a measure that looks at both the biological and habitat condition status of a water body. Some small differences exist in the way the administrations and environment agencies implement the methods and tools for assessing water body status. The introduction of new WFD monitoring data and classification standards (including a new baseline adopting all of the new standards, tools, designations and water body boundaries) in 2014 has led to a step change in the number of water bodies assessed as being in each status class in following years. The formal reporting of new standards in cycle 2 of WFD has used the second cycle plans published in 2015. The introduction of reporting the cycle 2 standards has differed amongst the UK countries (see background section for more detail).

29
Indicator Description
The extent measures are a calculation of the net (non-overlapping) extent of protected areas using mean high water as the boundary between the at-sea and on-land measures.
The indicator also shows the condition of terrestrial and coastal features on Areas or Sites of Special Scientific Interest (A/SSSIs). A/SSSIs are designated for their ‘features’ – habitats or species which give them their scientific interest. Each country assesses the condition of features and reports either the area or the number of features in favourable or unfavourable-recovering (“recovering”) condition. These assessments are converted to percentages in this indicator, to allow them to be combined, but the percentage does not equate exactly with the area that is favourable or recovering.
C1. Protected areas
a. Total extent of protected areas: on-land
b. Total extent of protected area: at-sea
c. Condition of Areas / Sites of Special Scientific Interest
Type: Extent – Response Indicator; Condition – State/Response Indicator
The total extent of land and sea protected in the UK through national and international protected areas, and through wider landscape designations, has increased by 12.9 million hectares, from 14.5 million hectares in December 2012 to 27.4 million hectares at the end of March 2017. This 12.9 million hectare increase is almost entirely down to the designation of inshore and offshore marine sites under the European Union (EU) Habitats Directive, the designation of Marine Conservation Zones in English, Welsh, and Northern Irish waters, and designation of Nature Conservation Marine Protected Areas in Scottish waters. The extent of protected areas on land has increased by 11,700 hectares since 2012.
Figure C1i. Extent of UK nationally and internationally important protected areas: (a) on-land; (b) at-sea, 1950 to 2017.

30
Notes: 1. The boundary between protected areas on-land and at-sea is mean high water (mean high
water spring in Scotland). Coastal sites in the indicator are split between ‘on-land’ and ‘at-sea’ if they cross the mean high water mark. At-sea extent includes offshore marine protected areas out to the limit of the UK continental shelf.
2. Based on calendar year of site designation. For 2017, the data cut-off is 31 March. 3. Extent is based on the following site designations: Areas of Special Scientific Interest, Sites
of Special Scientific Interest, National Nature Reserves, Marine Conservation Zones, Nature Conservation Marine Protected Areas, Ramsar Sites, Special Areas of Conservation (including candidate Special Areas of Conservation and Sites of Community Importance), Special Protection Areas, Areas of Outstanding Natural Beauty, National Scenic Areas, National Parks.
Source: Joint Nature Conservation Committee, Natural England, Natural Resources Wales, Northern Ireland Environment Agency, Scottish Natural Heritage.
Figure C1ii. Cumulative proportion of Areas of Special Scientific Interest
(Northern Ireland) and Sites of Special Scientific Interest (England and Scotland) in ‘favourable’ or ‘unfavourable-recovering’ condition, 2005 to 2017.
Notes:
1. England figures based on area. Scotland and Northern Ireland figures based on number of features.
2. Based on data to the end of the calendar month shown. Data were not collated in 2007. 3. Note that there was a change in the weighting used per country (see technical document)
since the last publication in 2015, and that the results are therefore not directly comparable. 4. Imputation has been used to calculate the breakdown between favourable and
unfavourable-recovering for Northern Ireland for the years 2009 to 2011. 5. Figures exclude condition of A/SSSIs notified for geological features only.
Source: Natural England, Northern Ireland Environment Agency, Scottish Natural Heritage. The percentage of features, or area, of A/SSSIs in favourable or recovering condition increased from 67% in 2005, to 86% in 2012, and remained stable at 86% in 2017. The proportion of features or area of land in recovering condition (the light blue part of Figure C1ii) has increased from 14% in 2005 to 35% in 2017. These changes reflect improved management of sites, but may also be affected by a greater number of sites/features having been assessed over time.

31
Indicator Description Until 2013, this indicator was based on an analysis of the change in habitat connectivity for selected broad habitats in the wider countryside. The start point of the data series was 1990, but it has not been possible to update the indicator since 2007. A new indicator based on population synchrony has been suggested, but needs more work before an experimental statistic could be published.
Assessment of change in area and condition of UK protected areas
Long term Short term Latest year
Total extent of protected areas: on-land 1950–2017
2012–2017
No change (2017)
Total extent of protected areas: at-sea 1950–2017
2012–2017
Increased (2017)
Condition of A/SSSIs 2005–2017
2012–2017
No change (2017)
C2. Habitat connectivity
Indicator under development – progress to date No update since previous publication. Connectivity is a measure of the size and distribution of patches of habitat and the relative ease with which typical species can move through the landscape between the patches. Habitat loss and fragmentation can reduce the size of populations and hinder the movement of individuals between increasingly isolated populations, threatening their long-term viability. A measure of connectivity has been published previously within the biodiversity indicators set, based on an analysis of changes in land cover recorded in the Countryside Survey – a detailed periodic audit of a statistically representative sample of land across Great Britain. Expert opinion was used to assess the relative likelihood of movement by species characteristic of each habitat between habitat patches across different intervening land cover types found in the survey. The measure required further analysis to better explain the causes of the changes in connectivity and, as a result, the information available was insufficient for an assessment of change to be made, despite the statistically significant increase seen in connectivity in neutral grassland habitat observed. It has not been possible to undertake the analysis required and, given the latest data available for the indicator is from 2007, it has been decided by the UK Biodiversity Indicator Steering Group that this indicator is now too out-of-date to be retained within the indicator set, and the previous data and analysis has been moved to the background section of this fiche. During 2015, CEH, JNCC and Defra, based on a review of the specialist literature, investigated the possibility of using the level of synchrony in the fluctuations of annual population counts of butterflies as a proxy of connectivity. The exploration used data for four species of butterfly associated with woodland, collected through the UK Butterfly Monitoring Scheme (UKBMS). Population synchrony, measured as the level of correlation in time-series of annual abundance between site comparisons, is known to be influenced by distance, habitat similarity and geographic location. After accounting for these factors, evidence has shown synchrony is positively related to landscape suitability (Powney et al. 2010, 2011) and landscape features that promote dispersal ability (Powney et al. 2012). Furthermore, population synchrony is positively related with the frequency of actual movements of individuals (Oliver et al. 2017). Based on this evidence, population synchrony has been shown to be an effective measure of functional connectivity, with higher levels of synchrony associated with higher functional connectivity. The test has so far only been focussed on connectivity derived from data on four species of woodland

32
butterflies. The next stage is to expand the work, looking to broaden taxonomic coverage to include birds, and more habitats, unfortunately further development was not possible in 2016-17.
C3. Status of European habitats and species
a. Status of UK habitats of European importance
Type: State Indicator
No new data since the previous publication. In 2007, 5% of UK habitats listed on Annex I of the Habitats Directive were in favourable conservation status, decreasing to 3% in 2013. The conservation status of 48% of habitats was unfavourable-improving in 2007, decreasing to 31% in 2013. The conservation status of 30% of the habitats was unfavourable-declining in 2007, decreasing to 25% in 2013.
Figure C3ai. Percentage of UK habitats of European importance in improving or declining conservation status in 2007 and 2013.
Notes:
1. The chart is based on 77 habitats listed on Annex I of the Habitats Directive. 2. The aim of the Habitats Directive is to achieve favourable conservation status for the
species and habitats listed in its Annexes. An assessment of status and trends for each species and habitat is undertaken every six years. Trends in unfavourable conservation status allow identification of whether progress is being made, as it will take many years for some habitats and species to reach favourable conservation status.
Source: UK Habitats Directive (Article 17) reports 2007 and 2013.
0
10
20
30
40
50
Favourable Unfavourableimproving
Unknown Unfavourablestable
Unfavourabledeclining
Perc
enta
ge o
f hab
itats
United Kingdom
20072013

33
Indicator Description Member States of the European Union are required to report every six years on the conservation status of habitats and species listed on the annexes of the Habitats Directive. Each assessment needs to conclude whether the species is in one of the following states: Favourable, Unfavourable-Inadequate, Unfavourable-Bad or Unknown. The indicator is based on an evaluation of whether the results are better or worse in 2013 than in 2007.
Assessment of change in status of UK habitats of European importance
Long term* Short term Latest year
Percentage of UK habitats of European importance in favourable or improving conservation status
2007–2013
Decreased (2013)
Note: *A long term assessment is not made as the data do not go back more than 10 years. b. Status of UK species of European importance
Type: State Indicator
No new data since the previous publication. In 2007, 26% of UK species listed on Annexes II, IV or V of the Habitats Directive were in favourable conservation status, increasing to 39% in 2013. The conservation status of 18% of species was improving in 2007, decreasing to 10% in 2013. The conservation status of 13% of the species was declining in 2007, increasing to 15% in 2013.
Figure C3bi. Percentage of UK species of European importance in improving or declining conservation status in 2007 and 2013.
Notes:
1. The number of species assessed was 89 in 2007, and 93 in 2013. 2. The chart is based on species listed on Annexes II, IV and V of the Habitats Directive, but
excluding vagrants.
0
10
20
30
40
50
Favourable Unfavourableimproving
Unknown Unfavourablestable
Unfavourabledeclining
Perc
enta
ge o
f spe
cies
United Kingdom
20072013

34
Indicator Description
The indicator shows changes in relative abundance of priority species in the UK for which data are available. Priority species are defined as those on one or more of the biodiversity lists of each UK country (Natural Environmental and Rural Communities Act 2006 - Section 41 (England), Environment (Wales) Act 2016 section 7, Northern Ireland Priority Species List, Scottish Biodiversity List). The combined list contains 2,890 species in total. The priority species were highlighted as being of conservation concern for a variety of reasons, including rapid decline in some of their populations. This indicator should be read in conjunction with C4b which provides data on those species for which distribution information is available.
3. The aim of the Habitats Directive is to achieve favourable conservation status for the species and habitats listed in its Annexes. An assessment of status and trends for each species and habitat is undertaken every six years. Trends in unfavourable conservation status allow identification of whether progress is being made, as it will take many years for some habitats and species to reach favourable conservation status.
Source: UK Habitats Directive (Article 17) reports 2007 and 2013.
Assessment of change in status of UK species of European importance
Long term* Short term Latest year
Percentage of UK species of European importance in favourable or improving conservation status
2007–2013
Increased (2013)
Notes: *A long term assessment is not made as the data do not go back more than 10 years.
C4. Status of UK priority species
a. Relative abundance
Type: State Indicator
Official lists of priority species have been published for each UK country; actions to conserve these priority species are included within the respective country biodiversity or environment strategies. By 2015, the index of relative abundance of priority species overall had declined to 32% of the 1970 index value, a statistically significant decrease. Over this long-term period 27% of species showed an increase and 73% showed a decline. Between 2010 and 2015, the index declined by 18% relative to the value in 2010, a statistically significant decrease. Within the index over this short-term period, 42% of species showed an increase and 58% showed a decline.

35
Figure C4ai. Change in the relative abundance of priority species in the UK, 1970 to 2015.
Notes:
1. Based on 215 species. The line graph shows the unsmoothed trend (dotted line) with its 95% confidence interval (shaded).
2. The bar chart shows the percentage of species increasing or declining over the long-term (1970 to 2015) and the short-term (2010 to 2015).
3. All species in the indicator are present on one or more of the country priority species lists (Natural Environmental and Rural Communities Act 2006 – Section 41 (England), Environment (Wales) Act 2016 section 7, Northern Ireland Priority Species List, Scottish Biodiversity List).
Source: Bat Conservation Trust, British Trust for Ornithology, Butterfly Conservation, Centre for Ecology & Hydrology, Defra, Joint Nature Conservation Committee, People’s Trust for Endangered Species, Rothamsted Research, Royal Society for the Protection of Birds.
Assessment of change in the relative abundance of priority species in the UK
Long term Short term Latest year
Priority species – Relative abundance 1970–2015
2010–2015
No change (2015)
Of these 2,890 species in the combined priority species list, the 215 for which robust quantitative time series of relative species abundance are available are included in the indicator. These 215 species include birds (103), butterflies (21), mammals (11) and moths (80). This selection is taxonomically limited at present; it includes no vascular or non-vascular plants, fungi, amphibians, reptiles, or fish. The only invertebrates included are butterflies and moths. The species have not been selected as a representative sample of priority species and they cover only a limited range of taxonomic groups. The measure is therefore not fully representative of species in the wider countryside. The time series that have been combined cover different time periods, were collected using different methods and were analysed using different statistical techniques. In some cases data have come from non-random survey samples. See the technical background document for more detail.

36
Indicator Description
The indicator measures change in the number of 1km grid squares across the UK in which priority species were recorded in any given year – this is referred to as the ‘occupancy index’ and is effectively equivalent to changes in distribution of the species. The indicator will increase when a species becomes more widespread, and will decrease when a species becomes less widespread. This indicator should be read in conjunction with C4a which provides data on those species for which abundance information is available.
b. Distribution
Type: State Indicator
Between 1970 and 2016, the index was relatively stable; with an even balance of species increasing and decreasing. The indicator fell by 10% between 1970 and 1990, this was followed by a steady increase until the early 2000s when the composite trend remained stable up to 2016. The index value in 2016 was 5% higher than the value in 1970, however this increase is not statistically significant. Priority species are defined as those on one or more of the biodiversity lists of each UK country (Natural Environmental and Rural Communities Act 2006 - Section 41 (England); Environment (Wales) Act 2016 section 7, Northern Ireland Priority Species List, Scottish Biodiversity List). The combined list contains 2,890 species in total. The priority species were highlighted as being of conservation concern for a variety of reasons, including rapid decline in some of their populations.
Figure C4bi. Change in distribution of UK priority species, 1970 to 2016.
Notes:
1. Based on 714 species. Graph shows the unsmoothed composite indicator trend (dotted line) with variation around the line (shaded) within which we can be 90% confident that the true value lies (credible interval).
2. Bar chart shows the percentage of species within the indicator that have increased, decreased or shown no change in distribution (measured as the proportion of occupied sites), based on set thresholds of change.
3. All species in the indicator are present on one or more of the country priority species lists (Natural Environmental and Rural Communities Act 2006 – Section 41 (England), Environment (Wales) Act 2016 section 7, Northern Ireland Priority Species list, Scottish Biodiversity List).
4. As a result of methodological improvements in the occupancy model analysis, a greater number of taxonomic groups and species have been able to be included compared to the

37
Indicator Description The indicator shows relative changes in the abundance of common native birds of farmland and woodland and of freshwater and marine habitats in the UK. Bird populations have long been considered to provide a good indication of the broad state of wildlife in the UK. This is because they occupy a wide range of habitats and respond to environmental pressures that also operate on other groups of wildlife. In addition, there are considerable long-term data on trends in bird populations, allowing for comparison between short term and long term changes. Because they are a well-studied taxonomic group, drivers of change for birds are better understood than for some other species groups, which enables interpretation of observed changes.
2015 C4b indicator. Therefore, this chart is not directly comparable to previous versions of this indicator.
Source: Biological records data collated by a range of national schemes and local data centres.
Assessment of change in distribution of priority species in the UK
Long term Short term Latest year
Priority species – Distribution 1970–2016
2011–2016
Increased (2016)
C5. Birds of the wider countryside and at sea
a. Farmland birds
b. Woodland birds
c. Wetland birds
d. Seabirds
e. Wintering waterbirds
Type: State Indicator
In 2015 the farmland bird index was less than half its 1970 value. Short term, between 2009 and 2014, the smoothed index decreased by 8%.
The woodland bird index was 18% less than its 1970 value in 2015. Short term, between 2009 and 2014, the smoothed index showed no significant change.
In 2015 the water and wetland bird index was 7% lower than in 1975 and short term, between 2009 and 2014 the smoothed index declined by 7%.
In 2015 the breeding seabird index was 22% below its 1986 value. Short term, between 2009 and 2014 the index declined by 6%.
In 2014-15, the wintering waterbirds index was 88% higher than in 1975-76. Short term, between 2008-09 and 2013-14, the smoothed index fell by 8%.

38
Figure C5ai. Breeding farmland birds in the UK, 1970 to 2015.
Notes:
1. The figure in brackets shows the number of species. 2. The line graph shows the unsmoothed trend (dashed line) and smoothed trend (solid line)
with its 95% confidence intervals. 3. The bar chart shows the percentage of species within the indicator that have increased,
decreased, or shown no change, based on set thresholds of annual change. Source: British Trust for Ornithology, Defra, Joint Nature Conservation Committee, Royal Society
for the Protection of Birds.
Figure C5bi. Breeding woodland birds in the UK, 1970 to 2015.
Notes:
1. The figure in brackets shows the number of species. 2. The line graph shows the unsmoothed trend (dashed line) and smoothed trend (solid line)
with its 95% confidence intervals. 3. The bar chart shows the percentage of species within the indicator that have increased,
decreased, or shown no change, based on set thresholds of annual change. Source: British Trust for Ornithology, Defra, Joint Nature Conservation Committee, Royal Society
for the Protection of Birds.
0
20
40
60
80
100
120
1970 1975 1980 1985 1990 1995 2000 2005 2010 2015
Inde
x (1
970=
100)
All farmland birds (19)
Rapid changes in farmland management
United Kingdom
0102030405060708090
100
Long term Short term
Per
cent
age
of s
peci
es
Strongdecline
Weakdecline
No change
Weak increase
Strong increase
0
20
40
60
80
100
120
1970 1975 1980 1985 1990 1995 2000 2005 2010 2015
Inde
x (1
970=
100)
All Woodland birds (37)
United Kingdom
0102030405060708090
100
Long term Short term
Per
cent
age
of s
peci
es
Strongdecline
Weakdecline
No change
Weak increase
Strong increase
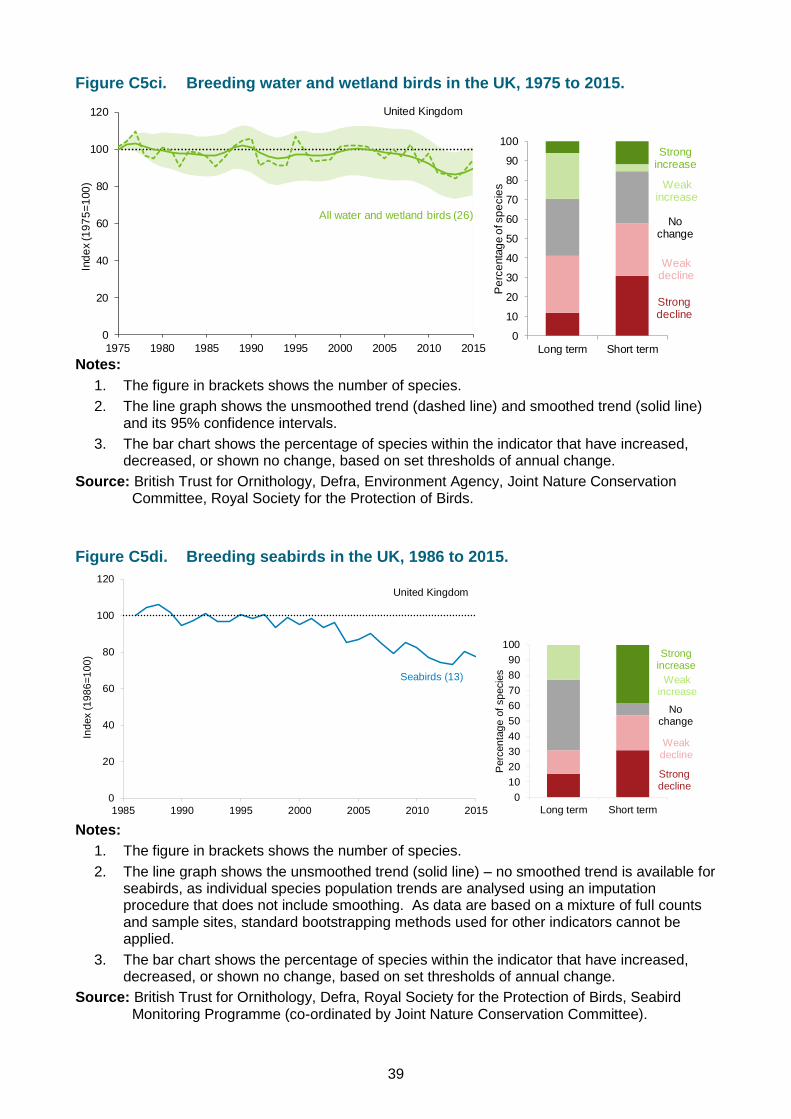
39
Figure C5ci. Breeding water and wetland birds in the UK, 1975 to 2015.
Notes:
1. The figure in brackets shows the number of species. 2. The line graph shows the unsmoothed trend (dashed line) and smoothed trend (solid line)
and its 95% confidence intervals. 3. The bar chart shows the percentage of species within the indicator that have increased,
decreased, or shown no change, based on set thresholds of annual change. Source: British Trust for Ornithology, Defra, Environment Agency, Joint Nature Conservation
Committee, Royal Society for the Protection of Birds.
Figure C5di. Breeding seabirds in the UK, 1986 to 2015.
Notes:
1. The figure in brackets shows the number of species. 2. The line graph shows the unsmoothed trend (solid line) – no smoothed trend is available for
seabirds, as individual species population trends are analysed using an imputation procedure that does not include smoothing. As data are based on a mixture of full counts and sample sites, standard bootstrapping methods used for other indicators cannot be applied.
3. The bar chart shows the percentage of species within the indicator that have increased, decreased, or shown no change, based on set thresholds of annual change.
Source: British Trust for Ornithology, Defra, Royal Society for the Protection of Birds, Seabird Monitoring Programme (co-ordinated by Joint Nature Conservation Committee).
0
20
40
60
80
100
120
1975 1980 1985 1990 1995 2000 2005 2010 2015
Inde
x (1
975=
100)
All water and wetland birds (26)
United Kingdom
0
10
20
30
40
50
60
70
80
90
100
Long term Short term
Per
cent
age
of s
peci
es
Strongdecline
Weakdecline
No change
Weak increase
Strong increase
0102030405060708090
100
Long term Short term
Perc
enta
ge o
f spe
cies
Strongdecline
Weakdecline
No change
Weak increase
Strong increase
0
20
40
60
80
100
120
1985 1990 1995 2000 2005 2010 2015
Inde
x (1
986=
100)
United Kingdom
Seabirds (13)

40
Figure C5ei. Wintering waterbirds in the UK, 1975-76 to 2014-15.
Notes:
1. The figure in brackets shows the number of species. 2. Based on financial years. 3. The line graph shows the unsmoothed trend (dashed line) and smoothed trend (solid line). 4. Data from surveys of wintering waterbirds are based on full counts on wetland and coastal
sites of markedly varying size. This means that standard indicator bootstrapping methods cannot be applied.
5. The bar chart shows the percentage of species within the indicator that have increased, decreased, or shown no change, based on set thresholds of annual change.
Source: British Trust for Ornithology, Defra, Joint Nature Conservation Committee, Royal Society for the Protection of Birds, Wildfowl and Wetlands Trust.
Assessment of change in bird populations
Long term Short term Latest year
Farmland birds 1970–2014
2009–2014
Increased (2015)
Woodland birds 1970–2014
2009–2014
No change (2015)
Wetland birds 1975–2014
2009–2014
Increased (2015)
Wintering waterbirds 1975/76–2013/14
2008/09–2013/14
No change (2014-15)
Notes: 1. Whilst latest year percentage changes in these indices are reported based on the most
recent unsmoothed data point (2015), the formal long-term and short-term assessments of the statistical significance of these changes are made using the smoothed data to 2014. This is because the most recent smoothed data point (2015) is likely to change in next year’s update when additional data are included for 2016.
2. Analysis of the underlying trends is undertaken by the data providers. Smoothed data are available for farmland, woodland, wetland and wintering waterbirds, but not for seabirds.
0102030405060708090
100
Long term Short term
Perc
enta
ge o
f spe
cies
Strongdecline
Weakdecline
No change
Weak increase
Strong increase
0
50
100
150
200
250
300
1975/1976 1988/1989 2001/2002 2014/2015
Inde
x (1
975/
76=1
00)
All wintering waterbirds (46)
United Kingdom

41
Indicator Description The indicator consists of two measures of annual butterfly population abundance: the first for specialist butterflies (species strongly associated with semi-natural habitats such as unimproved grassland) and the second for butterflies found in both semi-natural habitats and the wider countryside.
Butterflies are complementary to birds and bats as an indicator, especially the habitat specialists, because they use resources in the landscape at a much finer spatial scale than either of these groups.
3. The traffic light assessment for the seabirds measure has been removed until a way of assessing variability is devised. This follows recommendations in a quality assurance science panel report, dated January 2016.
C6. Insects of the wider countryside (butterflies)
a. Semi-natural habitat specialists
b. Species of the wider countryside
Type: State Indicator
Since 1976 the habitat specialists butterflies index has fallen by 74%. Over the same period the index for species of the wider countryside has
fallen by 57%. Large fluctuations in numbers between years are typical features of butterfly
populations, principally in response to weather conditions. 2016 was a bad year for butterflies; short term changes in butterfly populations are affected heavily by weather and although the summer of 2016 was mostly warm and dry in many parts of the UK, there was a very cold spell in spring following a mild winter, which may have negatively influenced populations.
The statistical assessment of change is made on an analysis of the underlying smoothed trends due to the large fluctuations from year to year. Since 1976, populations of habitat
specialists and species of the wider countryside have declined significantly but both trends show no significant change since 2011.
Figure C6ai. Trends in butterfly populations in the UK: habitat specialists, 1976 to 2016.

42
Notes: 1. The figure in brackets shows the number of species included in the index. 2. The line graph shows the unsmoothed trend (dashed line) and smoothed trend (solid line)
with it’s 95% confidence interval (shaded). 3. The bar chart shows the percentage of species within the indicator that have shown a
statistically significant increase, statistically significant decrease, or no change. 4. The chart is not directly comparable to previous versions of this publication, improvements
in the modelling technique have allowed the inclusion of more data, resulting in slight alternations in the trends for individual species.
Source: Butterfly Conservation, Centre for Ecology & Hydrology, Defra, Joint Nature Conservation Committee.
Figure C6bi. Trends in butterfly populations in the UK: species of the wider countryside, 1976 to 2016.
Notes:
1. The figure in brackets shows the number of species included in the index. 2. The line graph shows the unsmoothed trend (dashed line) and smoothed trend (solid line)
with it’s 95 per cent confidence interval (shaded). 3. The bar chart shows the percentage of species within the indicator that have shown a
statistically significant increase, statistically significant decrease, or no change. 4. Since 2013, an improved analysis method has been applied to the measure for species of
the wider countryside (see ‘Background’ section for further information). 5. The chart is not directly comparable to previous versions of this publication, improvements
in the modelling technique have allowed the inclusion of more data, resulting in slight alternations in the trends for individual species.
Source: British Trust for Ornithology, Butterfly Conservation, Centre for Ecology & Hydrology, Defra, Joint Nature Conservation Committee.
Assessment of change in butterfly populations
Long term Short term Latest year
Semi-natural habitat specialists 1976–2016
2011–2016
Decreased (2016)

43
Indicator Description
Until 2013, the indicator presented the change in plant species richness in survey plots across Great Britain between 1990 and 2007 for a range of widely occurring habitats. The results from seven habitat types were presented, grouped into three measures for the assessment: arable and horticultural land; woodland and grassland; and boundary habitats. As the data has not been updated since 2007, the data presented previously is considered too out of date to be fit-for-purpose. A new indicator based on the new National Plant Monitoring Scheme is being considered, but needs more work before it could be presented as an experimental statistic.
Assessment of change in butterfly populations
Long term Short term Latest year
Species of the wider countryside 1976–2016
2011–2016
Decreased (2016)
Notes: While percentage changes in these indices are reported based on the most recent unsmoothed data point (2016), the formal long-term and short-term assessments of the statistical significance of these changes are made using the smoothed data to 2016. Analysis of the underlying trends is undertaken by the data providers.
C7. Plants of the wider countryside
Indicator under development – progress to date No update since previous publication. An indicator of plant species richness has been published previously within the biodiversity indicators set, based on analysis of changes in land cover recorded in the Countryside Survey – a detailed periodic audit of a statistically representative sample of land across Great Britain. As the latest Countryside Survey data are from 2007, the data previously presented for this indicator is considered too out of date to be fit-for-purpose and retained within the indicator set as a headline measure: the UK Biodiversity Indicators Steering Group therefore took the decision to move this data and analysis to the background section of this fiche. During 2015, the Centre for Ecology & Hydrology (CEH), Joint Nature Conservation Committee (JNCC) and Defra have investigated the possibility of using Bayesian Occupancy Detection models – see indicators C4b and D1c for details – to identify trends in plant species. Trials have focussed on species that will be monitored with the new National Plant Monitoring Scheme (NPMS; see below). Although initial testing using Botanical Society of Britain & Ireland (BSBI) atlas data is encouraging, the measures under development (for woodlands and for lowland heathland) require further work before they will be fit for publication as experimental statistics. Unfortunately, further development was not possible in 2016-2017; however it is hoped that investigating the use of data on habitat specialist (axiophyte) species, which can complement the species chosen for monitoring under the NPMS, will enable a new experimental) statistic to be developed in the next year or two. In the slightly longer term it is anticipated that the new National Plant Monitoring Scheme designed by the BSBI, CEH, Plantlife and JNCC will provide relative abundance data – which will be more equivalent to the data underpinning the birds, bats and butterfly indicators – allowing a more representative indicator of plants and habitat trends to be developed. Although data will start to be delivered within three years, it will not be possible to produce a trend before 2020, as time is needed to collect enough data to be able to calculate the statistical significance of the trend.

44
Indicator Description Bat species make up a third of the UK’s mammal fauna and occur in most lowland habitats across the UK. The indicator shows changes in the population size of eight widespread bat species, based on summer field surveys and roost counts and winter hibernation counts. Population change between 1999 and 2016 is analysed using a statistical model developed by the Bat Conservation Trust.
C8. Mammals of the wider countryside (bats)
Type: State Indicator
Between 1999, when trends from standardised large-scale monitoring became available through the National Bat Monitoring Programme (NBMP), and 2015, bat populations have increased by 34%. An assessment of the underlying smoothed trend shows this is a statistically significant increase. In the short term, between 2010 and 2015, an assessment of the underlying smoothed trend shows that bat populations have shown no significant change in population size.
Figure C8i. Trends in bat populations, 1999 to 2016.
Notes:
1. The headline measure is a composite index of eight bat species: brown long-eared bat, common pipistrelle, Daubenton's bat, lesser horseshoe bat, Natterer’s bat, noctule, serotine and soprano pipistrelle.
2. The model used to produce the indicator has changed since the previous publication, and these results are therefore not directly comparable (see Background section for more details).
3. The line graph shows the unsmoothed trend (dashed line) and smoothed trend (solid line) with its 95% confidence interval (shaded).
4. The bar chart shows the percentage of species which, over the time periods of the long-term and short-term assessments, have shown a statistically significant increase or decline, or no significant change.
Source: Bat Conservation Trust.
Assessment of change in widespread bat populations
Long term Short term Latest year
Bat populations 1999–2015
2010–2015
Decreased (2016)

45
Indicator Description
Genetic diversity is an important component of biological diversity. Rare and native breeds of farm animals are part of our cultural heritage, are often associated with traditional land management required to conserve important habitats, and may have genetic traits of value to future agriculture.
The genetic diversity in UK breeds can be assessed by the effective population size (Ne), which accounts for the total number of animals in a population and the relative numbers of sires and dams (male and female parents). A low effective population size signifies a greater likelihood of in-breeding and risk of loss of genetic diversity.
This indicator shows the change in the average effective population sizes for breeds of goats, pigs, horses, sheep and cattle classified by the UK Farm Animal Genetic Resources Committee as Native Breeds at Risk (NBAR).
Notes: Long-term and short-term assessments are made on the basis of smoothed trends to the penultimate year (2015) by the Bat Conservation Trust. This is because the most recent smoothed data point (2016) is likely to change in next year’s update when additional data are included for 2017. The latest year assessment is based on unsmoothed data. It is provided for transparency, but the decrease is not statistically significant.
C9. Genetic resources for food and agriculture
a. Animal genetic resources – effective population size of Native Breeds at Risk
i. Goat breeds
ii. Pig breeds
iii. Horse breeds
iv. Sheep breeds
v. Cattle breeds
Type: State / Benefit Indicator
The average effective population size of the native breeds at risk included in this indicator:
for pigs increased from 177 in 2000 to 230 in 2011, but decreased to 145 in 2016;
for horses decreased from 179 in 2000 to 169 in 2011 and to 116 in 2016;
for sheep increased from 228 in 2000 to 359 in 2011 and was little changed at 356 in 2016;
for cattle increased from 91 in 2000 to 196 in 2011 and to 308 in 2016;
for goats the dataset starts in 2004 when it was 63, increasing to 73 in 2011 and to 89 in 2016; prior to 2004, effective population size could only be calculated for one breed. The average effective population sizes calculated between 2000 and 2016 for the native breeds at risk of goats, pigs, horses, sheep and cattle were each above 50, the figure set by the United Nations Food and Agriculture Organisation as a threshold for concern. However, in 2016, of the Native Breeds at Risk, two breeds of goat (Saanan, Toggenburg), three breeds of horse (Cleveland Bay Horse, Eriskay Pony, Suffolk), and one breed of cattle (Vaynol), had a Ne less than 50. No breeds of sheep or pig had effective population sizes below the threshold in 2016. There has been no reported UK extinction of any breeds of goats, pigs, horses, sheep or cattle since 1973.

46
Figure C9ai. Average effective population size (Ne) of Native Breeds at Risk, 2000 to 2016.
Notes:
1. The number of breeds included in the indicator varies year by year as a result of data availability for both sires and dams (data for both are needed to calculate effective population size). The maximum number of breeds included in each measure is shown in brackets after the species name in the legend. The 2016 values are based on four goat breeds, 11 pig breeds, 13 horse breeds, 27 sheep breeds, and 16 cattle breeds. Further details of how many breeds are included in each year can be found in the technical background document and the datasheet.
2. Data for 2015 and 2016 are provisional, hence the last part of the lines are shown as ‘dashed’. It is expected that the provisional data can be confirmed in 2018 (see the technical document for details).
3. Based on data in the UK Farm Animal Genetic Resources Breed Inventory published on 23 May 2017.
4. Historic data for some breeds of sheep and cattle are now available in the inventory published in 2017, affecting the series for these species. As a result, this indicator is not directly comparable with the previous publication.
5. The dotted black line shows effective population size (Ne) equal to 50; the level set by the United Nations Food and Agriculture Organisation as a threshold for concern. The pale grey line is an average of all 88 Native Breeds at Risk for which Ne could be calculated; this is included to provide context, but is not assessed.
Source: British Pig Association, Defra, Grassroots, Rare Breeds Survival Trust, and participating breed societies.

47
Indicator Description Seed banks provide an insurance policy against the extinction of plants in the wild. They complement in situ conservation methods, which conserve plants and animals directly in the wild. The indicator is based on an enrichment Index developed by the United Nations Food and Agriculture Organisation (FAO 2010) to assess the genetic diversity held in gene banks. The method factors in duplication and similarity to existing accessions. An upward trending line indicates diversity is being added to collections – the steeper the line, the greater the diversity being incorporated. An accession is a collection of plant material from a particular location at a point in time. Ex situ conservation of cultivated plants and their wild relatives is one method used to preserve genetic diversity. In the context of this indicator, the term ex situ means off-site conservation of genetic material.
Assessment of change in effective population size of Native Breeds at Risk
Long term Short term Latest year
Goat breeds 2004–2016
2011–2016
Increased (2016)
Pig breeds 2000–2016
2011–2016
Decreased (2016)
Horse breeds 2000–2016
2011–2016
Decreased (2016)
Sheep breeds 2000–2016
2011–2016
Decreased (2016)
Cattle breeds 2000–2016
2011–2016
Increased (2016)
b. Plant genetic resources – Enrichment Index
Type: State / Benefit Indicator
There is considerable annual variability in the number of new accessions into UK germplasm collections. The total number of accessions has risen since 1960; by March 2017 there were 123,603 accessions of relevant taxa, of which 93,075 accessions contribute to the Enrichment Index. There was a 19% increase in the Enrichment Index between 2012 and 2017. A rapid rise in the Enrichment Index since 2000 can be attributed to a concerted collection effort by the Millennium Seed Bank. The genetic diversity of UK plant resources includes domesticated plants and their wild relatives, as well as socio-economically and culturally valuable plant species. These encompass plants grown in a farming or horticultural setting, or both, as well as commercial cultivars, landraces and traditional varieties and their wild relatives.
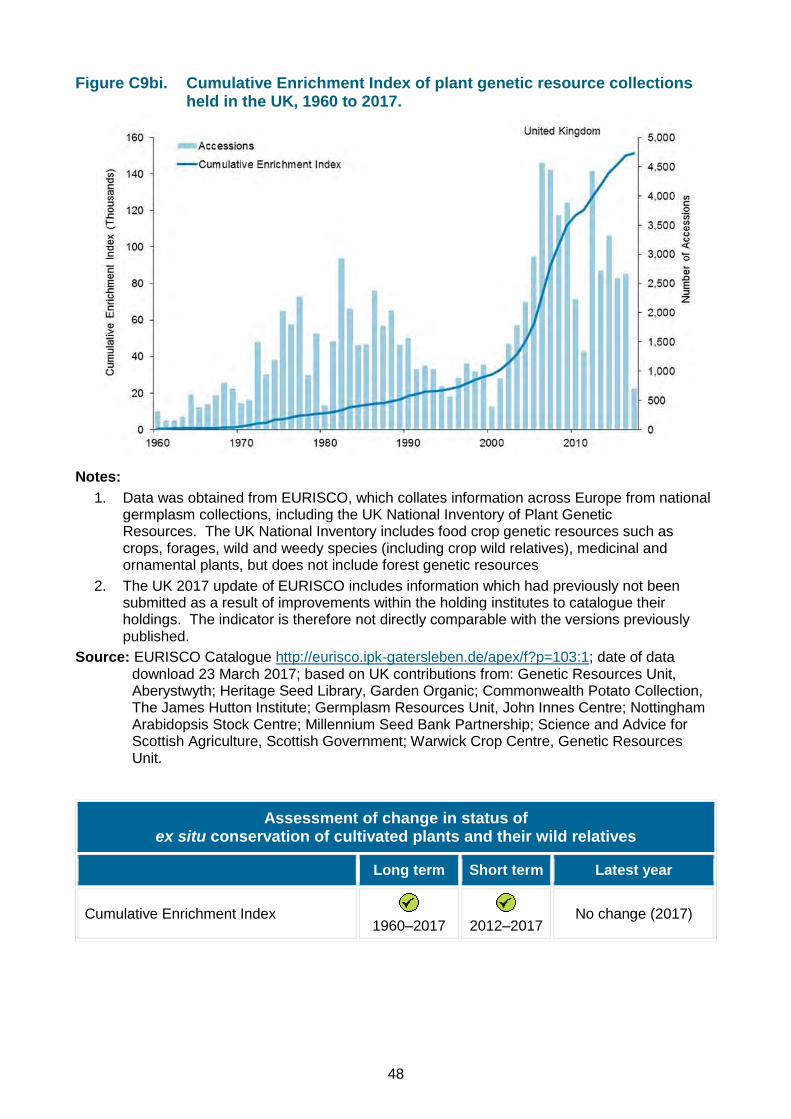
48
Figure C9bi. Cumulative Enrichment Index of plant genetic resource collections held in the UK, 1960 to 2017.
Notes:
1. Data was obtained from EURISCO, which collates information across Europe from national germplasm collections, including the UK National Inventory of Plant Genetic Resources. The UK National Inventory includes food crop genetic resources such as crops, forages, wild and weedy species (including crop wild relatives), medicinal and ornamental plants, but does not include forest genetic resources
2. The UK 2017 update of EURISCO includes information which had previously not been submitted as a result of improvements within the holding institutes to catalogue their holdings. The indicator is therefore not directly comparable with the versions previously published.
Source: EURISCO Catalogue http://eurisco.ipk-gatersleben.de/apex/f?p=103:1; date of data download 23 March 2017; based on UK contributions from: Genetic Resources Unit, Aberystwyth; Heritage Seed Library, Garden Organic; Commonwealth Potato Collection, The James Hutton Institute; Germplasm Resources Unit, John Innes Centre; Nottingham Arabidopsis Stock Centre; Millennium Seed Bank Partnership; Science and Advice for Scottish Agriculture, Scottish Government; Warwick Crop Centre, Genetic Resources Unit.
Assessment of change in status of ex situ conservation of cultivated plants and their wild relatives
Long term Short term Latest year
Cumulative Enrichment Index 1960–2017
2012–2017
No change (2017)

49
Indicator Description The indicator shows changes in the proportion, by weight, of large individuals equal to or over 40cm in length in fish populations in the North-western part of the North Sea. Changes in the size structure of fish populations and communities reflect changes in the state of the fish community. Fluctuations in values between years are expected given inter-annual fluctuations in the distribution and abundance of North Sea fish populations and sampling variation.
This indicator is likely to change in the future to reflect a new indicator being developed to report under the OSPAR Convention.
D1. Biodiversity and ecosystem services
a. Fish size classes in the North Sea
Type: State / Benefit Indicator
No new data since the previous publication. In 2014, large fish in the North-western North Sea made up almost 22% of the weight of the fish community. This was very nearly the same as the 23% in 1983; however it is an increase from a low of 2.2% in 2001. While there was a clear decline in the indicator from 1983 to 1993, there has been rapid recovery since 2003 that accelerated after 2010.
Figure D1ai. Proportion of large fish (equal to or larger than 40cm), by weight, in the North-western North Sea, 1983 to 2014.
Notes: The line graph shows the unsmoothed trend (dashed line) and a LOESS smoothed trend
(solid line) with the shaded area showing the 95 per cent confidence intervals around the smoothed trend.
Source: Centre for Environment, Fisheries and Aquaculture Science; Marine Scotland.

50
Indicator Description
UK forests are a large store of carbon and also act as an active carbon ‘sink’, removing carbon dioxide (CO2), a greenhouse gas, from the atmosphere and storing it as carbon in living biomass, leaf litter and forest soil. This sequestration of CO2 is an essential ecosystem service. This indicator shows the cumulative net removal of greenhouse gases from the atmosphere by UK forests since 1990. It is split between type of woodland (conifer and broadleaf). Showing greenhouse gas removals by type of woodland is interesting from a biodiversity perspective as it allows a clearer presentation of the contribution made to greenhouse gas removals by broadleaf woodland, most of which constitutes priority habitat.
Assessment of change in the proportion of large fish, by weight
Long term Short term Latest year
North-western North Sea 1983–2014
2009–2014
Increased (2014)
Notes: The long-term and short-term assessments have been made by the Centre for Environment, Fisheries and Aquaculture Science (Cefas) by fitting a LOESS smoothed trend to the index. LOESS is a non-parametric regression method; it may be understood as standing for "LOcal regrESSion”.
b Removal of greenhouse gases by UK forests
Type: Benefit Indicator
Cumulatively, since 1990, the equivalent of 372 million tonnes of CO2 has been removed from the atmosphere. In 2015, UK forests are estimated to have removed the equivalent of 15.7 million tonnes of CO2 from the atmosphere. The proportion of removals by broadleaf woodlands has increased since 1990, contributing 8.5 million tonnes of the removals (54%) in 2015 compared to 3.2 million tonnes (32%) removed in 1990. Conversely the proportion of removals by conifer woodland has continued to fall, from 6.9 million tonnes (68%) in 1990 to 7.2 million tonnes (46%) in 2015.
Figure D1bi. Cumulative net removal of greenhouse gases by UK forests, 1990 to 2015.

51
Indicator Description
The indicator illustrates changes in pollinator distribution (bees and hoverflies) in the UK. The indicator is based on 389 species (147 species of bee and 242 species of hoverfly) of pollinator, and measures change in the number of 1km grid squares across the UK in which they were recorded in any given year – this is referred to as the ‘occupancy index’. Many insect species are involved in pollination but bees and hoverflies are known to be important and are presented here as an indicator of overall pollinator trend.
Notes: 1. The bar graph shows the cumulative net removal of greenhouse gases (carbon dioxide
(CO2), methane (CH4) and nitrous oxide (N2O)) from the atmosphere by forests in the UK, expressed as CO2 equivalent.
2. Revised in 2015 to reflect improved modelling of GHG emissions and removals. 3. Revised in 2017 due to improvements made to the forestry sector of LULUCF for the 1990-
2015 inventory and therefore not directly comparable with the previous publication. Source: BEIS Land Use, Land Use Change and Forestry greenhouse gas inventory.
Assessment of change in cumulative net removal of greenhouse gases
Long term Short term Latest year
Cumulative net removal of greenhouse gases
1990–2015
2010–2015
Increased (2015)
c. Status of pollinating insects
Type: State / Benefit indicator
There was an overall decrease in the pollinators indicator from 1987 onwards. In 2014, the indicator had declined by 13% compared to the value in 1980. The long-term trend was assessed as a decline. Between 2009 and 2014 the indicator fell further before recovering slightly, declining by 1% overall, and is assessed as stable. Between 1980 and 2014, 16% of pollinator species became more widespread (8% showed a strong increase), and 32% became less widespread (10% showed a strong decrease). The ratio between increasing and decreasing species was more balanced between 2009 and 2014, with 34% of species increasing and 41% of species decreasing. As individual pollinator species become more or less widespread, the communities in any given area become more or less diverse, and this may have implications for pollination as more diverse communities are, in broad terms, more effective in pollinating a wide range of crops and wild flowers. Despite the inter-annual variation, the overall trend for pollinators remains downward. This indicator is not directly comparable with the previous publication as the Bayesian modelling methods have been improved, which has allowed a further 176 species (42 wild bees and 134 hoverfly species) to be included, thereby increasing the taxonomic scope of the indicator.

52
Indicator Description
Good policy making and evaluation is based on evidence. Millions of biological observations (records) have been recorded in the UK over the past century by a wide variety of organisations and individuals. This indicator provides an evaluation of the number of records added to the National Biodiversity Network (NBN) Gateway in a particular year, and the resolution of those data, as a proxy for the evidence available to underpin conservation decision making.
Figure D1ci. Change in the distribution of UK pollinators, 1980 to 2014.
Notes:
1. Based on a total of 389 pollinators, comprising 147 wild bee species and 242 hoverfly species.
2. Graph shows the unsmoothed composite indicator trend with variation around the line (shaded) within which we can be 90% confident that the true value lies (credible interval).
3. Bar chart shows the percentage of species within the indicator that have increased, decreased or shown no change in occupancy, based on set thresholds of change.
Source: Bees, Wasps & Ants Recording Society; Hoverfly Recording Scheme; Biological Records Centre (supported by Centre for Ecology & Hydrology and Joint Nature Conservation Committee).
Assessment of change in distribution of pollinators in the UK
Long term Short term Latest year
Distribution of UK pollinators 1980–2014
2009–2014
Increased (2014)
E1. Biodiversity data for decision making
a. Cumulative number of records
b. Number of publicly accessible records at 1km2 resolution or better
Type: State Indicator
The number of records within the National Biodiversity Network Gateway has increased from 15 million at the start of 2004 to 68.7 million at the start of 2012, and to 131.3 million at the end of March 2017, at which time the Gateway closed and was replaced by the NBN Atlas. Since the start of 2012 there has been an increase of 62.5 million records. The number of publicly accessible records which are at 1km2 resolution or better increased from 10.5 million at the start of January 2010, to 35.2 million at the end of March 2017.

53
Figure E1i. Records added to the National Biodiversity Network Gateway, 2004 to 2017.
Notes: Data available to 31 March 2017. Source: National Biodiversity Network.
Assessment of change in data for decision making
Long term Short term Latest year
Cumulative number of records 2004–2017
2012–2017
Increased (2017)
Number of publicly accessible records at 1km2 resolution or better
2012–2017
Increased (2017)

54
Indicator Description The first part of this indicator provides public sector spending on biodiversity in real terms alongside spending by Non-Government Organisations (NGOs) with a biodiversity or nature focus. Spending is one way of assessing the priority that is given to biodiversity within the UK public sector. The second part of this indicator gives the UKs spending on global biodiversity. Funding for international biodiversity is essential for the implementation of the Convention on Biological Diversity in developing countries, along with other international biodiversity policy commitments.
E2. Expenditure on UK and international biodiversity
a. Public sector expenditure on UK biodiversity
b. Non-Governmental organisation expenditure on UK biodiversity
c. UK expenditure on international biodiversity
Type: Response Indicator
In 2015/16, £453 million of UK public sector funding was spent on UK biodiversity; this value has decreased 6% since 2014/15. Public sector funding on UK biodiversity relative to GDP has changed very little in the last 5 years, in 2015/16 approximately £2.40 was spent on biodiversity for every £10,000 of GDP. Spending on biodiversity in the UK by non-governmental organisations (NGOs) with a biodiversity or nature focus was £236 million in 2014/15 (net of Government funding). This value is likely to be an underestimate, as the indicator does not include all NGOs with a biodiversity or nature focus. Based on the data gathered by the current indicator, spending has increased 11% since the first year of data collection (2010/11), and has increased 5% in the latest year between 2013/14 and 2014-15. In 2015/16, UK public sector funding for international biodiversity totalled £44 million. International spending by the UK public sector has increased by 35% since 2000-01 in real terms.
Figure E2i. Expenditure on biodiversity in the UK, 2000-01 to 2015-16.
Notes:
1. Deflated using UK Gross Domestic Product Deflator.
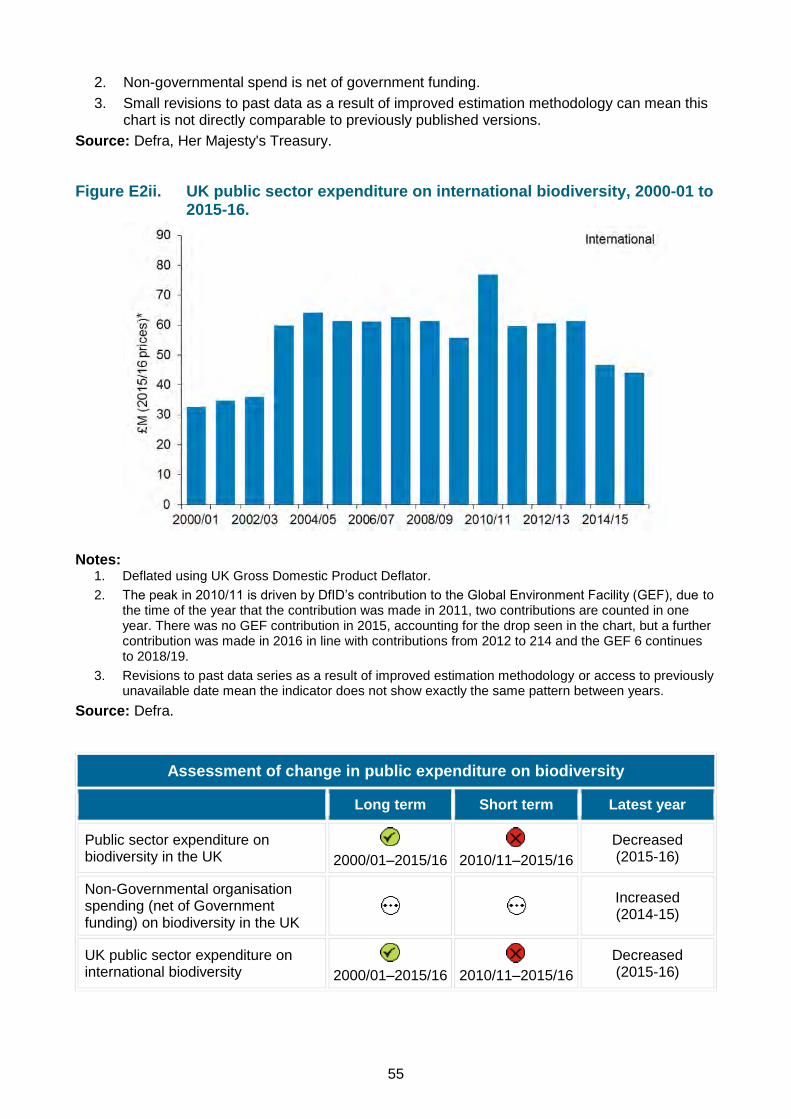
55
2. Non-governmental spend is net of government funding. 3. Small revisions to past data as a result of improved estimation methodology can mean this
chart is not directly comparable to previously published versions. Source: Defra, Her Majesty's Treasury.
Figure E2ii. UK public sector expenditure on international biodiversity, 2000-01 to 2015-16.
Notes: 1. Deflated using UK Gross Domestic Product Deflator. 2. The peak in 2010/11 is driven by DfID’s contribution to the Global Environment Facility (GEF), due to
the time of the year that the contribution was made in 2011, two contributions are counted in one year. There was no GEF contribution in 2015, accounting for the drop seen in the chart, but a further contribution was made in 2016 in line with contributions from 2012 to 214 and the GEF 6 continues to 2018/19.
3. Revisions to past data series as a result of improved estimation methodology or access to previously unavailable date mean the indicator does not show exactly the same pattern between years.
Source: Defra.
Assessment of change in public expenditure on biodiversity
Long term Short term Latest year
Public sector expenditure on biodiversity in the UK
2000/01–2015/16
2010/11–2015/16
Decreased (2015-16)
Non-Governmental organisation spending (net of Government funding) on biodiversity in the UK
Increased (2014-15)
UK public sector expenditure on international biodiversity
2000/01–2015/16
2010/11–2015/16
Decreased (2015-16)

56
Enquiries about the biodiversity indicators or this publication
This publication has been produced by the Biodiversity and Ecosystems Evidence and Analysis team (Defra) working with the Joint Nature Conservation Committee (JNCC). Editorial / Project team: Defra: Katherine Atherton, Nicola George and Christine Holleran. JNCC: Emma Durham, Cathy Gardner, Maddy Long and James Williams. UK Biodiversity Indicators Steering Group members: Humphrey Crick (Natural England), John Farren (Northern Ireland Environment Agency), Nicola George (Defra), Richard Gregory (Wildlife and Countryside Link), Christine Holleran (Defra), Dave Johnston (Natural Resources Wales), Holly Kelley-Weil (Defra), John Landrock (Scottish Government), Chris Lynam (CEFAS), David O’Brien (Scottish Natural Heritage), Deborah Procter (JNCC), Andrew Stott (Defra, Chair), Sally Thomas (Scottish Government), Richard Weyl (Northern Ireland Environment Agency), Angela Watkins (Welsh Government), James Williams (JNCC). Responsible statistician: Christine Holleran (Defra). We would welcome feedback on this publication. If you have any comments or questions about the published biodiversity indicators please contact: • E-mail: [email protected]. • Address: Biodiversity and Ecosystems Evidence and Analysis, Defra, Room 201 Foss
House, Kings Pool, 1-2 Peasholme Green, York YO1 7PX. Information on other environmental statistics is also available on Defra’s webpages at: https://www.gov.uk/government/organisations/department-for-environment-food-rural-affairs/about/statistics. For enquiries about wider aspects of biodiversity conservation please refer to the JNCC website below, or contact Defra’s Nature Improvement Programme: • E-mail: [email protected]. • Address: Nature Improvement Programme, Department for Environment, Food and Rural
Affairs, Zone 1/14, Temple Quay House, 2 The Square, Temple Quay, Bristol BS1 6EB. For enquiries about the future development of the indicators, please contact:
James Williams at [email protected] / 01733 866868, or Christine Holleran at [email protected] / 0208 026 6180.
For further details on all the indicators, including data sources and assessment methods, please visit the Joint Nature Conservation Committee (JNCC) website: http://jncc.defra.gov.uk/ukbi.

57
Annex: National Statistics
Official Statistics The Statistics and Registration Service Act 2007 defines 'official statistics' as all those statistical outputs produced by the UK Statistics Authority's executive office (the Office for National Statistics) by central Government departments and agencies, by the devolved administrations in Northern Ireland, Scotland and Wales, and by other Crown bodies. The Act also allows Ministers to determine, through secondary legislation, which non-Crown bodies produce official statistics so that they, too, can be subject to scrutiny and assessment by the Statistics Authority, and be eligible for assessment as 'National Statistics'. This provision is designed to ensure a broad definition of official statistics, as well as flexibility so that the scope of official statistics can be adapted over time to suit changing circumstances.
National Statistics
'National Statistics' are a subset of official statistics which have been certified by the UK Statistics Authority as compliant with its Code of Practice for Official Statistics -
http://www.statisticsauthority.gov.uk/assessment/code-of-practice/ Accredited 'National Statistics' are identified by the following quality mark:
UK Biodiversity Indicators compendium publication UK Biodiversity Indicators is a Defra National Statistics compendium. The designation does not mean that all the individual statistics presented are National Statistics in their own right. Rather, it means that the compilation and publication has been assessed by the UK Statistics Authority as compliant with the Code of Practice. The following individual statistics presented in the publication are National Statistics: B1. Area of forestry land certified as sustainably managed C5. Birds of the wider countryside and at sea Although all other statistics in this compendium are not individually designated as National Statistics, they are Official Statistics, and as such have been produced in line with the Code of Practice. They are subject to rigorous quality assurance by the data owners and general quality assurance by Defra and the Joint Nature Conservation Committee. The presentation of the statistics, the commentary, and the traffic light assessments have been overseen and quality assured by Defra Statisticians.
www.ni-environment.gov.uk Agency
Northern Ireland Environment
UK Biodiversity Indicators 2017