Uk approach – Matching demand to inflexible generation
23
Task XIX International Meeting Wednesday 21 Oct 2009 Shanti Majithia Energy and Climate Strategy Manager Transmission, National Grid UK Is DSM the answer ?
-
Upload
iea-dsm-energy-technology-initiative -
Category
Presentations & Public Speaking
-
view
108 -
download
1
Transcript of Uk approach – Matching demand to inflexible generation
Task XIX International Meeting Wednesday 21 Oct 2009
Shanti MajithiaEnergy and Climate Strategy ManagerTransmission, National Grid UK
Is DSM the answer ?

2
overview
Introduction to National Grid
The drivers for change
The generation mix – capacity at any time
NG 2020 consultation
Developments in Electricity Generation and Demand
Reserve and Operating Margin Short term reserve, operating margin at peak demands, and operating at minimum demands
Network Operation Physical operation
Balancing Services Development
Transmission technologies & system issues
Demand Side Management and technological links
Demand side balancing opportunities
What is needed in the future of new generation technology?
Conclusions & how could it affect the future?
3
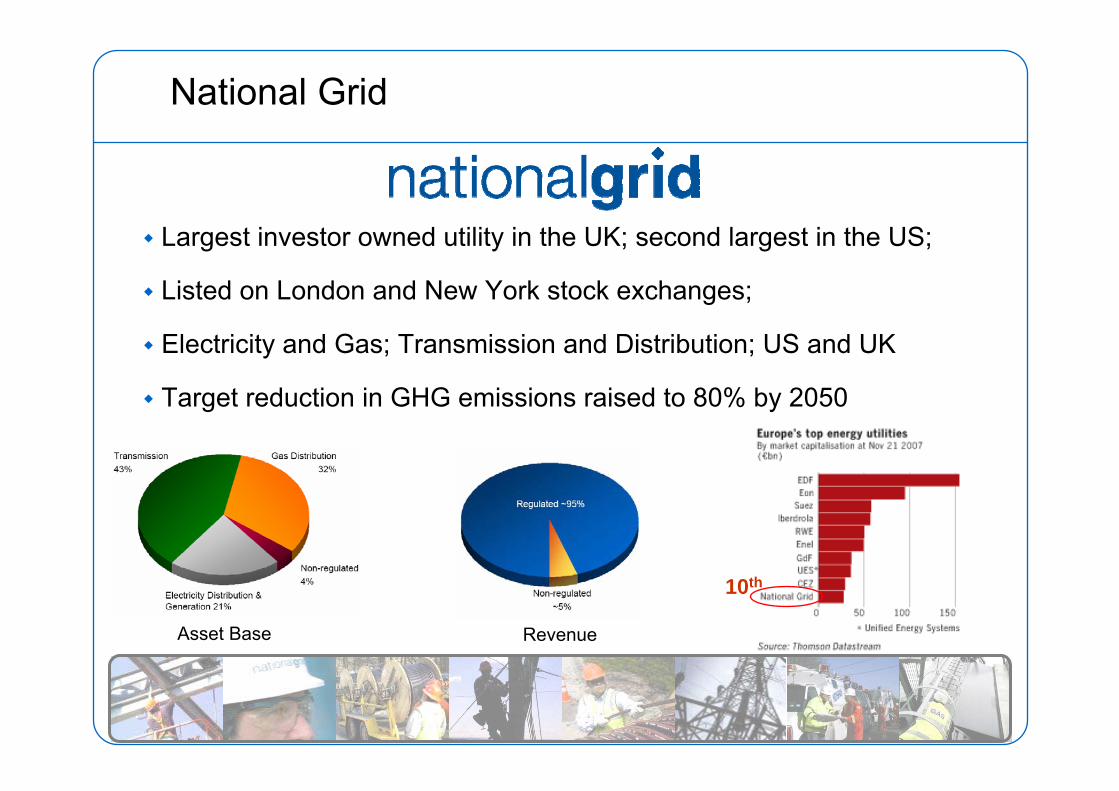
National Grid
Largest investor owned utility in the UK; second largest in the US;
Listed on London and New York stock exchanges;
Electricity and Gas; Transmission and Distribution; US and UK
Target reduction in GHG emissions raised to 80% by 2050
Asset Base Revenue
10th

4
Our Business
50:50
Transmission
UK US
Distribution
Electricity Gas
5
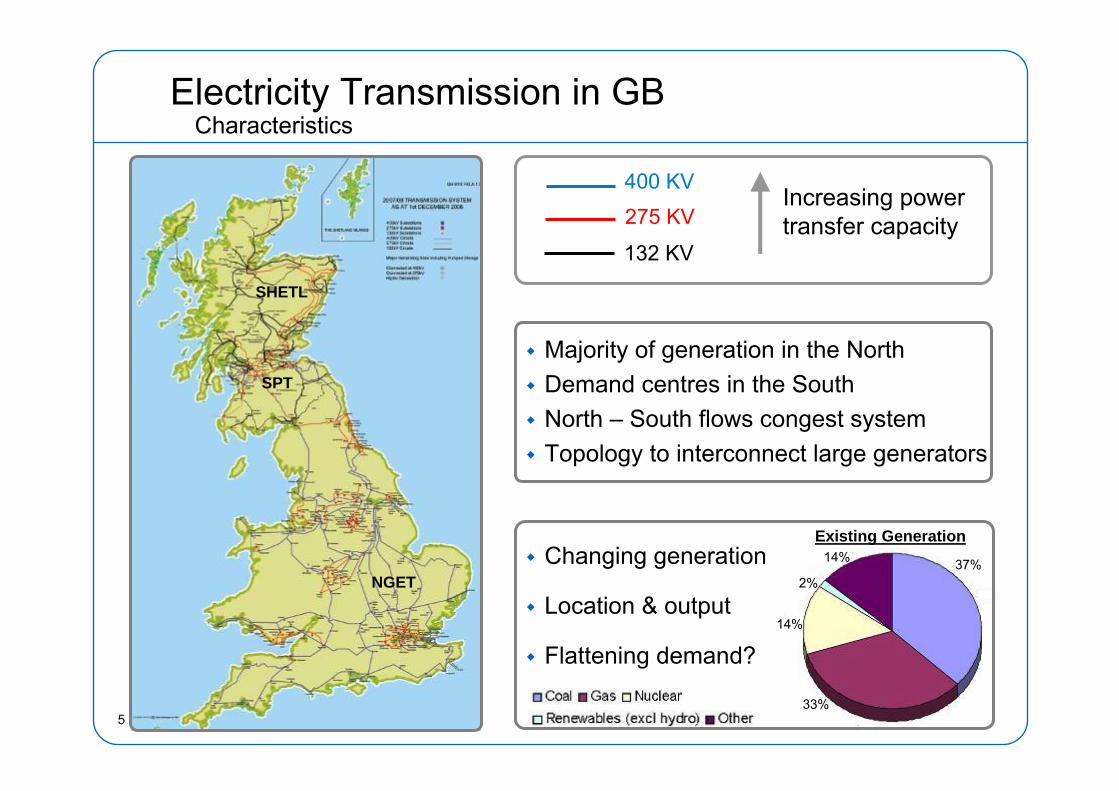
Electricity Transmission in GB
SHETL
SPT
NGET
132 KV
275 KV400 KV
Increasing power transfer capacity
Majority of generation in the NorthDemand centres in the SouthNorth – South flows congest systemTopology to interconnect large generators
Characteristics
14% 37%
14%
2%
33%
Existing GenerationChanging generation
Location & output
Flattening demand?

6
Balancing the Network
This won’t work in 2020/30 because generation is intermittent or inflexible
In 2009…
Demand is a given
Second by second balancing achieved by flexing generation
In 2020/2030…
Dynamic demandSmart metersStorageFlexing generation
Heat and Transport kicks in
29500
30500
31500
32500
33500
34500
35500
15:30 15:45 16:00 16:15 16:30 16:45 17:00 17:15 17:30 17:45 18:00 18:15 18:30 18:45 19:00 19:15 19:30Time
49.8
50
50.2
50.4
50.6
50.8
51
7
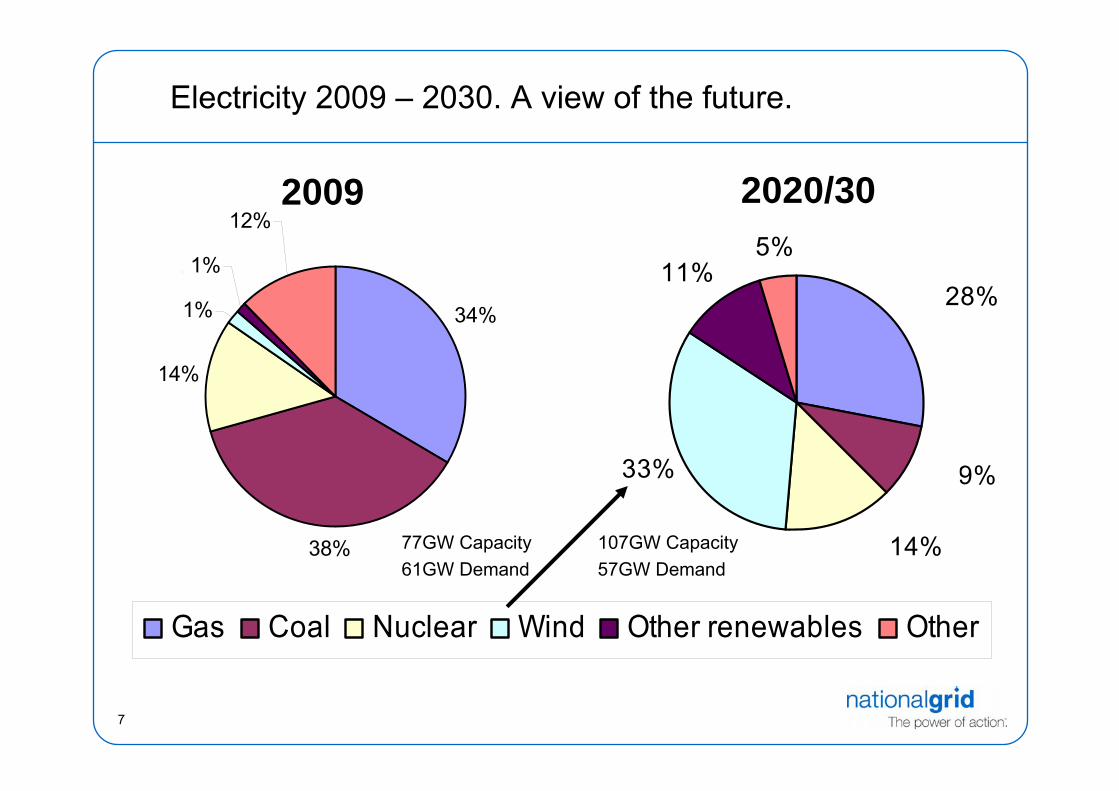
Electricity 2009 – 2030. A view of the future.
25.6, 34%
28.4, 38%
11, 14%
1.1, 1%
1.1, 1%
9.4, 12%
Gas Coal Nuclear Wind Other renewables Other
2009
77GW Capacity61GW Demand
30, 28%
10, 9%
15, 14%
35, 33%
12, 11%5, 5%
2020/30
107GW Capacity57GW Demand
34%
8
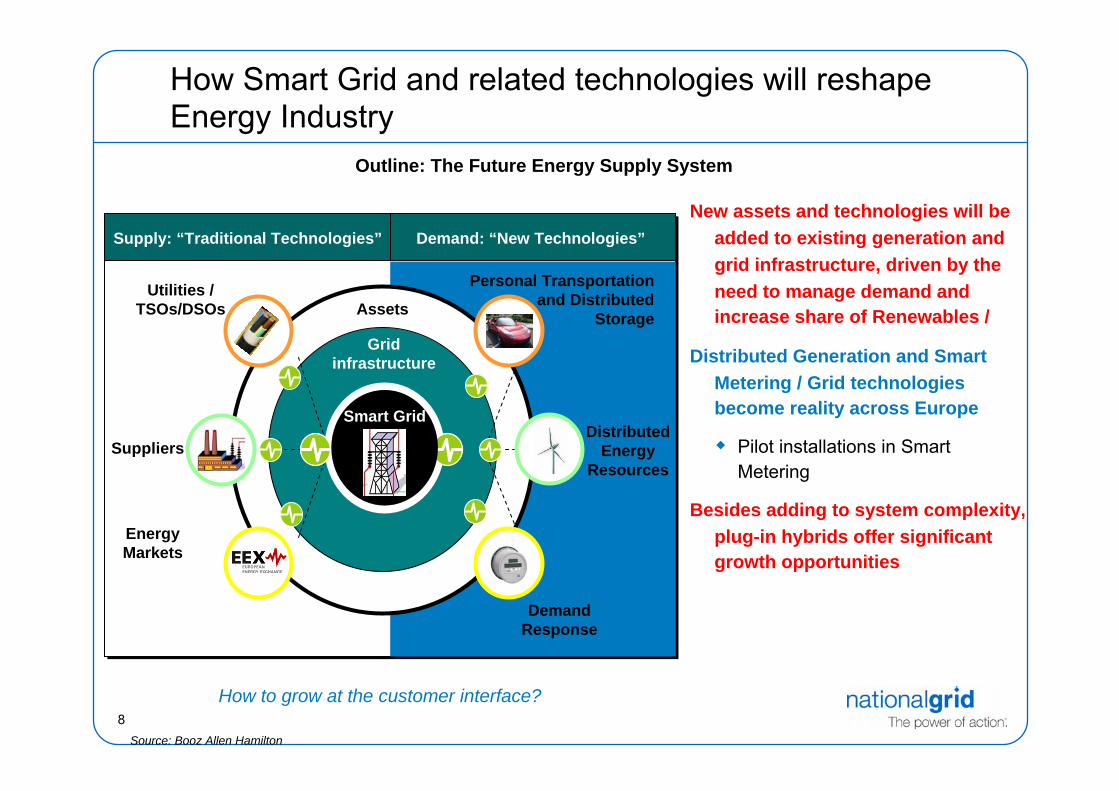
How Smart Grid and related technologies will reshape Energy Industry
How to grow at the customer interface?
Outline: The Future Energy Supply System
Source: Booz Allen Hamilton
Supply: “Traditional Technologies”Supply: “Traditional Technologies” Demand: “New Technologies”Demand: “New Technologies”
Gridinfrastructure
Assets
Personal Transportationand Distributed
Storage
DistributedEnergy
Resources
EnergyMarkets
Suppliers
Utilities /TSOs/DSOs
DemandResponse
Smart Grid
New assets and technologies will be added to existing generation and grid infrastructure, driven by the need to manage demand and increase share of Renewables /
Distributed Generation and Smart Metering / Grid technologies become reality across Europe
Pilot installations in Smart Metering
Besides adding to system complexity, plug-in hybrids offer significant growth opportunities
9
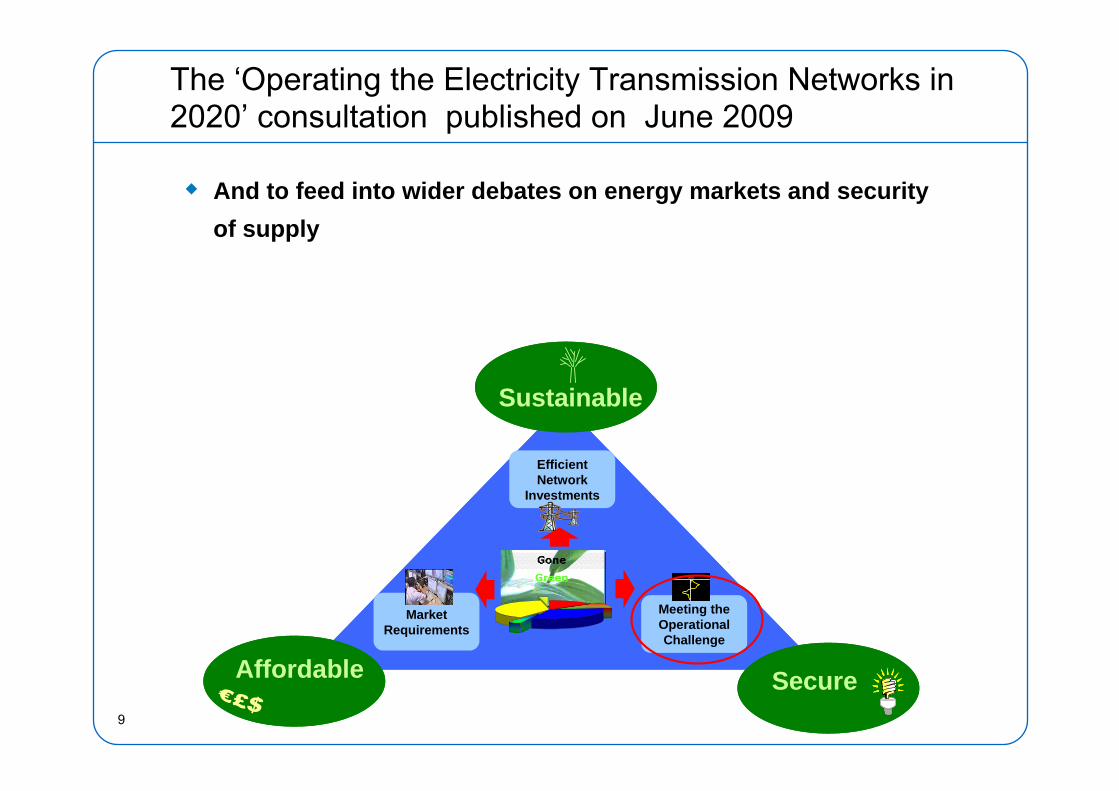
SecureAffordable
Sustainable
Efficient Network
Investments
Market Requirements
Meeting the Operational Challenge
50
50.00
SecureAffordable
Sustainable
Efficient Network
Investments
Market Requirements
Meeting the Operational Challenge
50
50.00
50.00
The ‘Operating the Electricity Transmission Networks in 2020’ consultation published on June 2009
And to feed into wider debates on energy markets and security of supply
10
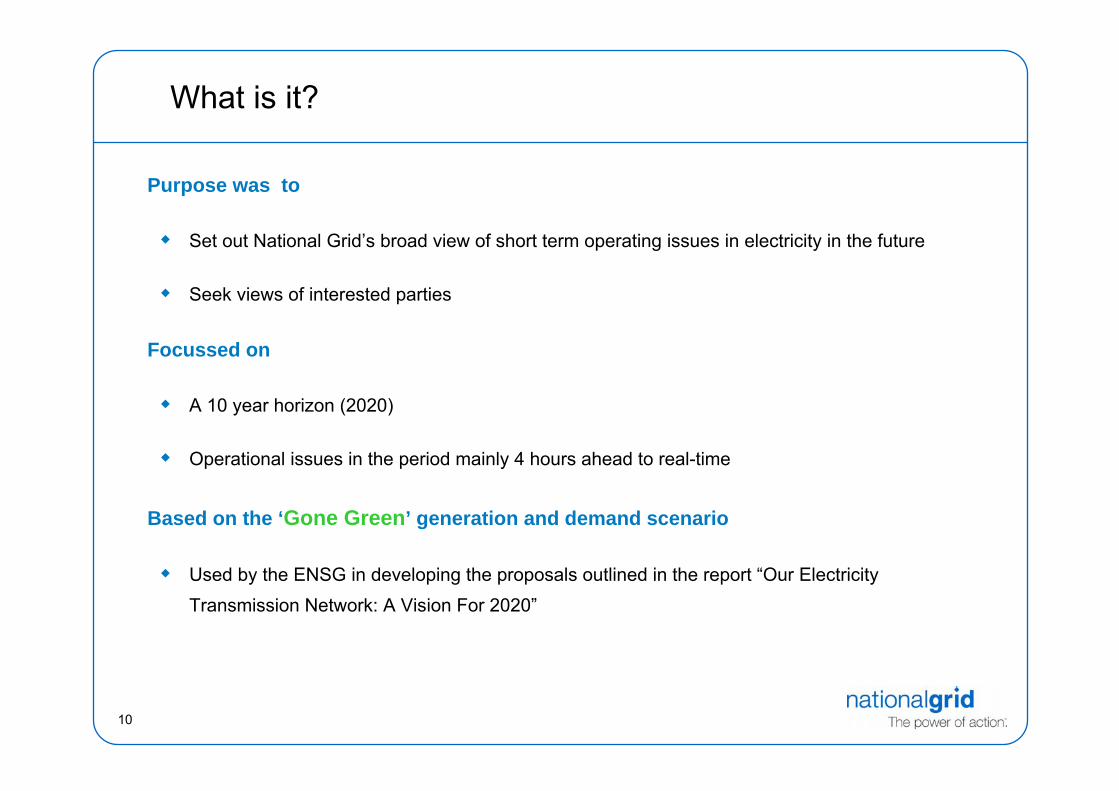
What is it?
Purpose was to
Set out National Grid’s broad view of short term operating issues in electricity in the future
Seek views of interested parties
Focussed on
A 10 year horizon (2020)
Operational issues in the period mainly 4 hours ahead to real-time
Based on the ‘Gone Green’ generation and demand scenario
Used by the ENSG in developing the proposals outlined in the report “Our Electricity Transmission Network: A Vision For 2020”
11
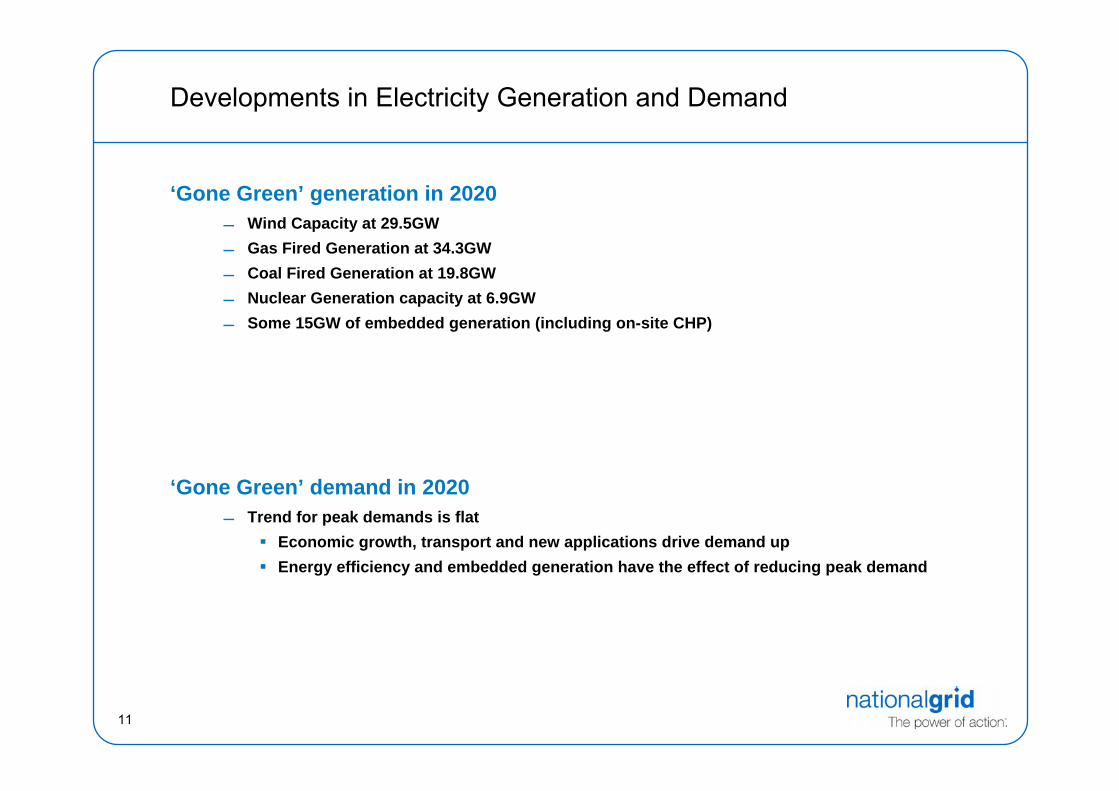
Developments in Electricity Generation and Demand
‘Gone Green’ generation in 2020 Wind Capacity at 29.5GW Gas Fired Generation at 34.3GW Coal Fired Generation at 19.8GW Nuclear Generation capacity at 6.9GW Some 15GW of embedded generation (including on-site CHP)
‘Gone Green’ demand in 2020 Trend for peak demands is flat
Economic growth, transport and new applications drive demand upEnergy efficiency and embedded generation have the effect of reducing peak demand
12
Developments in Electricity Generation and Demand
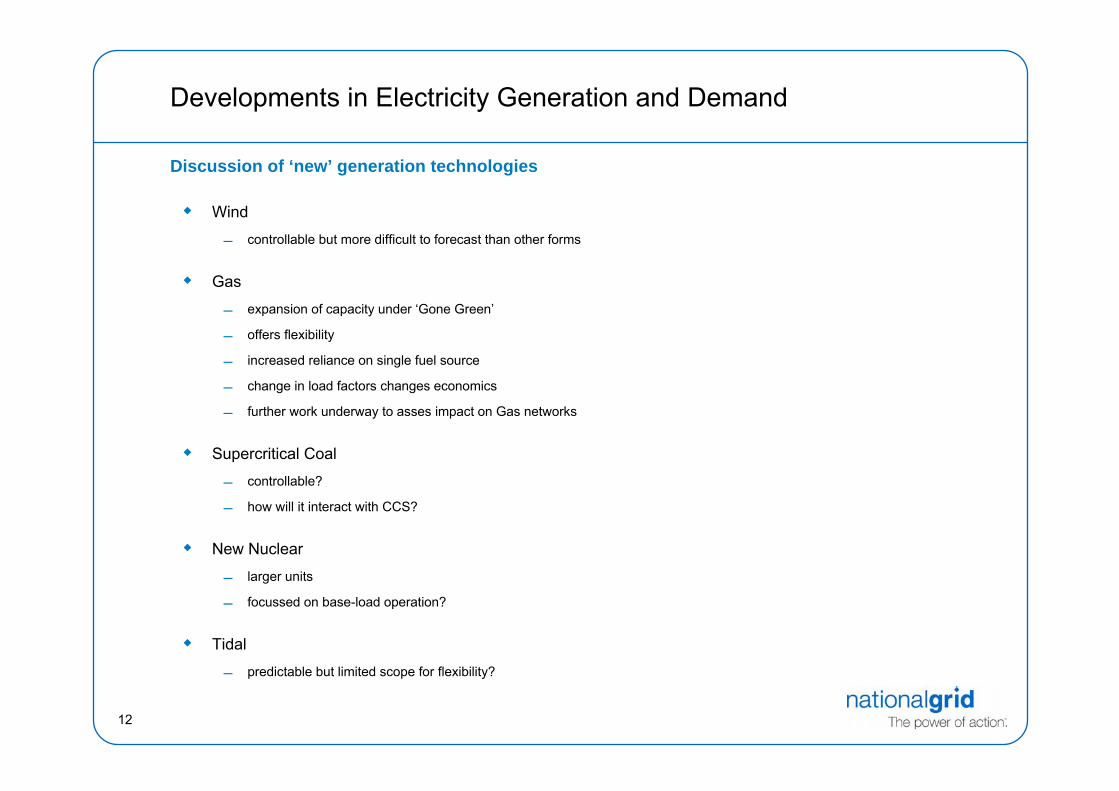
Discussion of ‘new’ generation technologies
Wind
controllable but more difficult to forecast than other forms
Gas
expansion of capacity under ‘Gone Green’
offers flexibility
increased reliance on single fuel source
change in load factors changes economics
further work underway to asses impact on Gas networks
Supercritical Coal
controllable?
how will it interact with CCS?
New Nuclear
larger units
focussed on base-load operation?
Tidal
predictable but limited scope for flexibility?
13
Developments in Electricity Generation and Demand
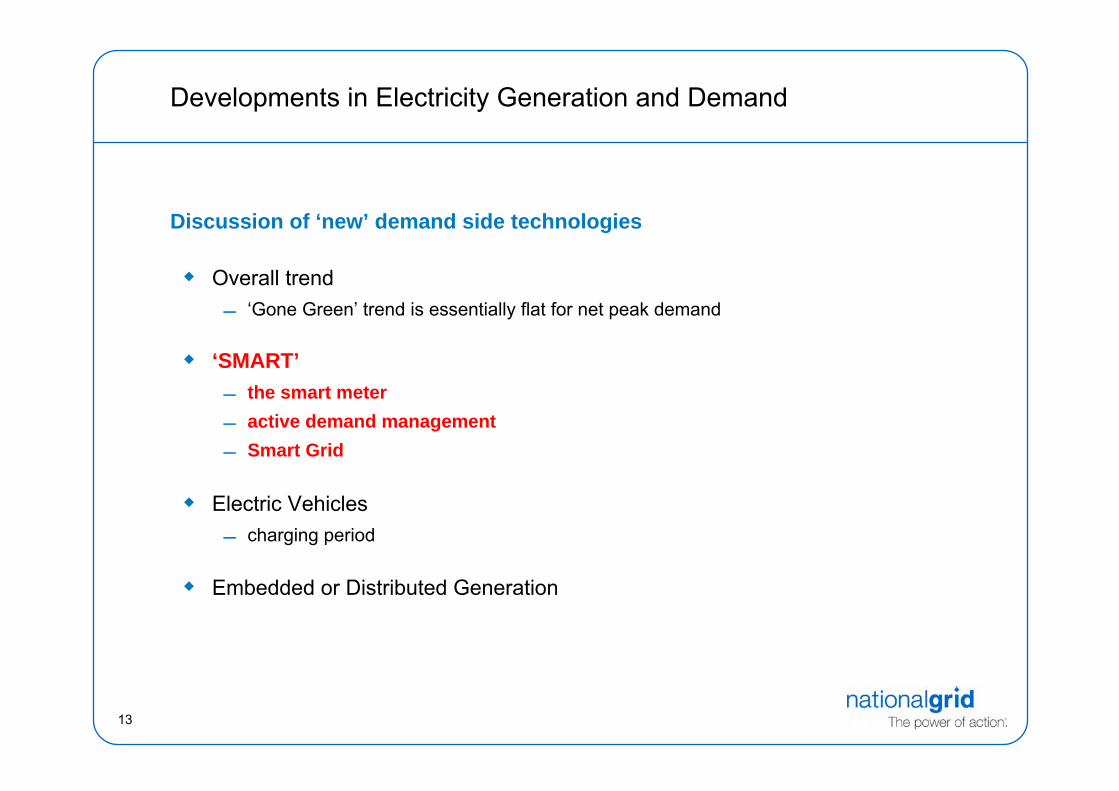
Discussion of ‘new’ demand side technologies
Overall trend ‘Gone Green’ trend is essentially flat for net peak demand
‘SMART’ the smart meter active demand management Smart Grid
Electric Vehicles charging period
Embedded or Distributed Generation
14
Developments in Electricity Generation and Demand
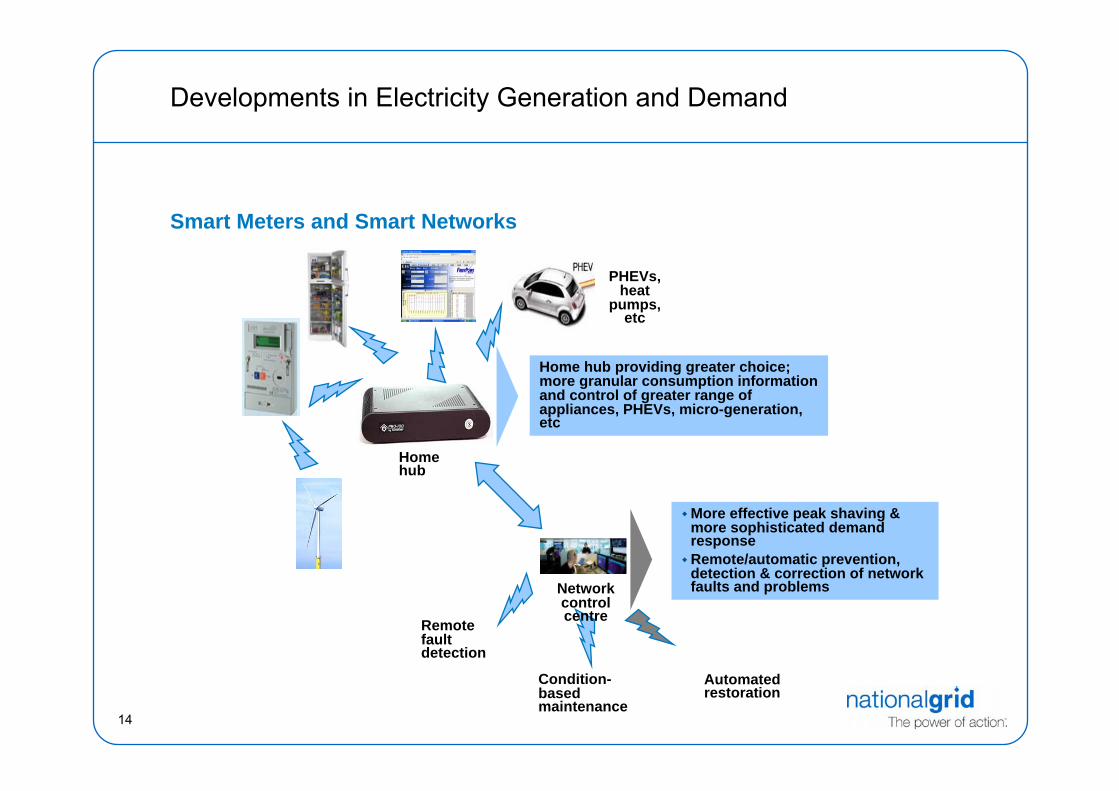
Smart Meters and Smart Networks
Home hub
Condition-based maintenance
Remote fault detection
Automated restoration
Home hub providing greater choice; more granular consumption information and control of greater range of appliances, PHEVs, micro-generation, etc
More effective peak shaving & more sophisticated demand responseRemote/automatic prevention, detection & correction of network faults and problems
PHEVs, heat
pumps, etc
Network control centre
15
Developments in Electricity Generation and Demand
30
35
40
45
50
55
60
00:0
0
01:0
0
02:0
0
03:0
0
04:0
0
05:0
0
06:0
0
07:0
0
08:0
0
09:0
0
10:0
0
11:0
0
12:0
0
13:0
0
14:0
0
15:0
0
16:0
0
17:0
0
18:0
0
19:0
0
20:0
0
21:0
0
22:0
0
23:0
0
Time of Day
Elec
tric
ity D
eman
d (G
W)
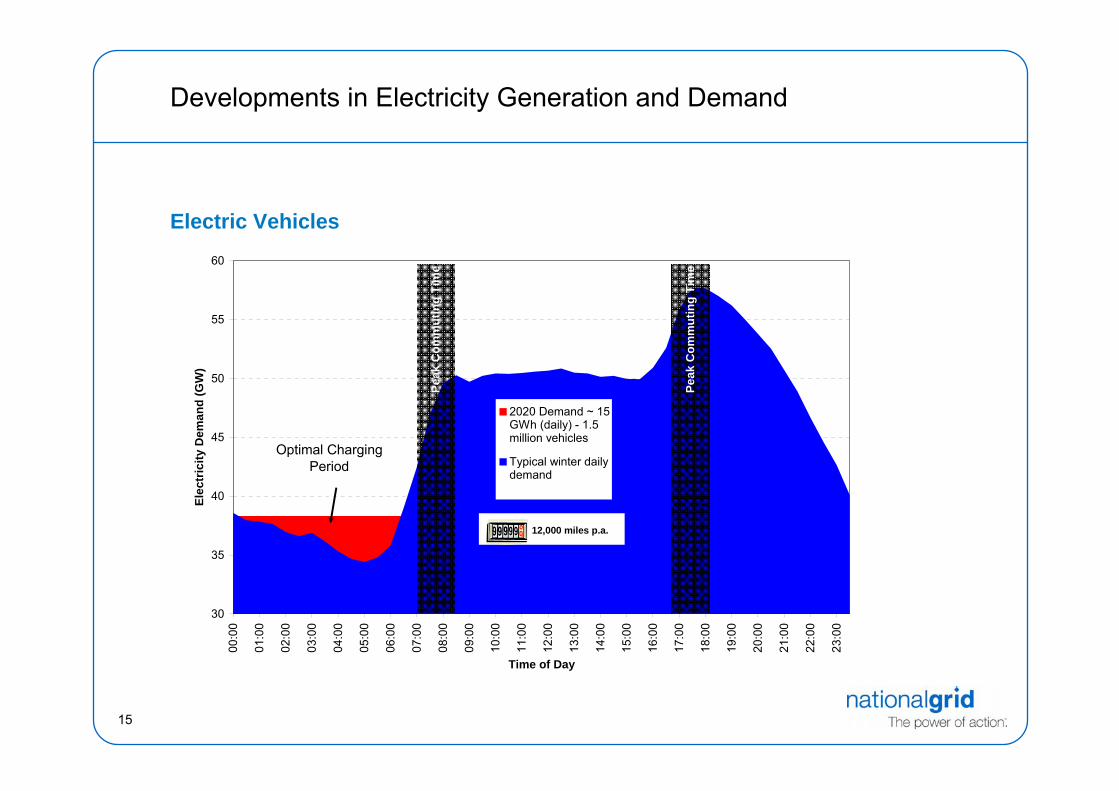
2020 Demand ~ 15GWh (daily) - 1.5million vehicles
Typical winter dailydemand
Peak
Com
mut
ing
Tim
e
12,000 miles p.a.
Peak
Com
mut
ing
Tim
e
Optimal Charging Period
Electric Vehicles
Balancing Services Development

17
Overview of Balancing Services (1)
Frequency Response
Mandatory Frequency Response
Commercial Frequency Response: FFR, FCDM
Reserve Services
BM Start-Up, Fast Reserve, Short Term Operating Reserve
Reactive Power
Obligatory Reactive Power, Enhanced Reactive Power
System Security
Constraints Management, Maximum Generation, Black Start, Intertrips, SO to SO
Trading
18
Reserve Service
BM Start-Up
Short Term Operating Reserve
Fast Reserve
Demand Management
19
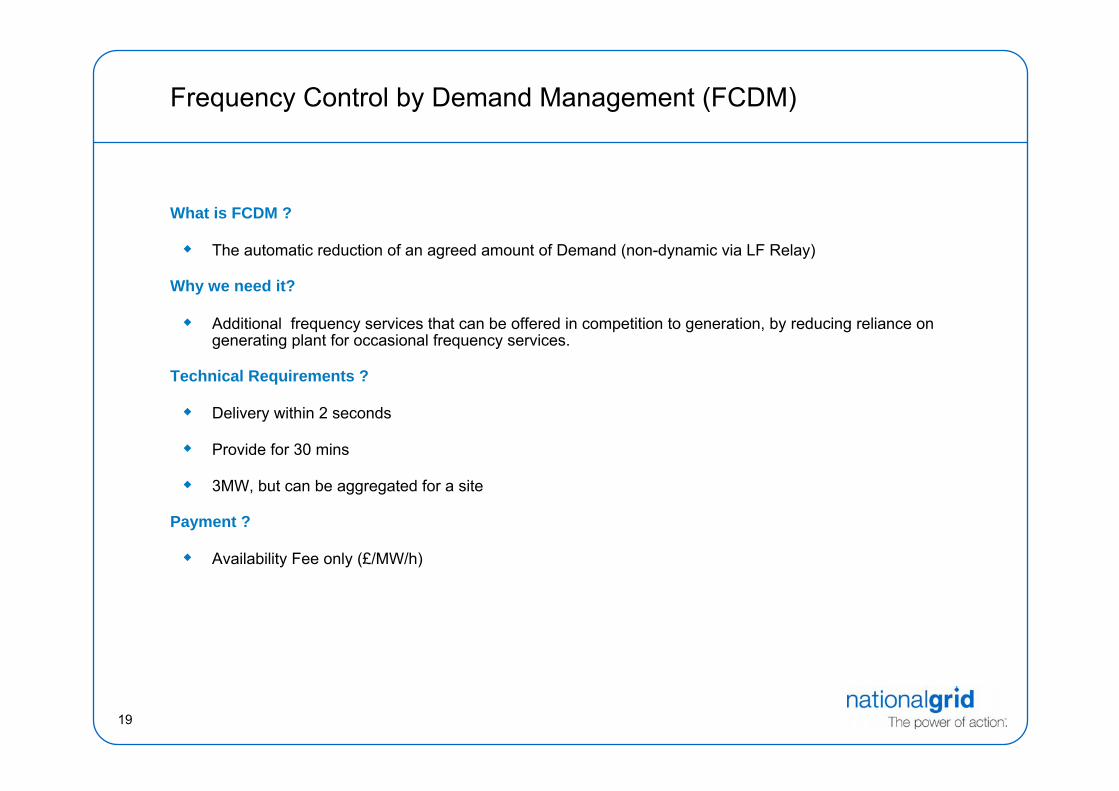
Frequency Control by Demand Management (FCDM)
What is FCDM ?
The automatic reduction of an agreed amount of Demand (non-dynamic via LF Relay)
Why we need it?
Additional frequency services that can be offered in competition to generation, by reducing reliance on generating plant for occasional frequency services.
Technical Requirements ?
Delivery within 2 seconds
Provide for 30 mins
3MW, but can be aggregated for a site
Payment ?
Availability Fee only (£/MW/h)
20
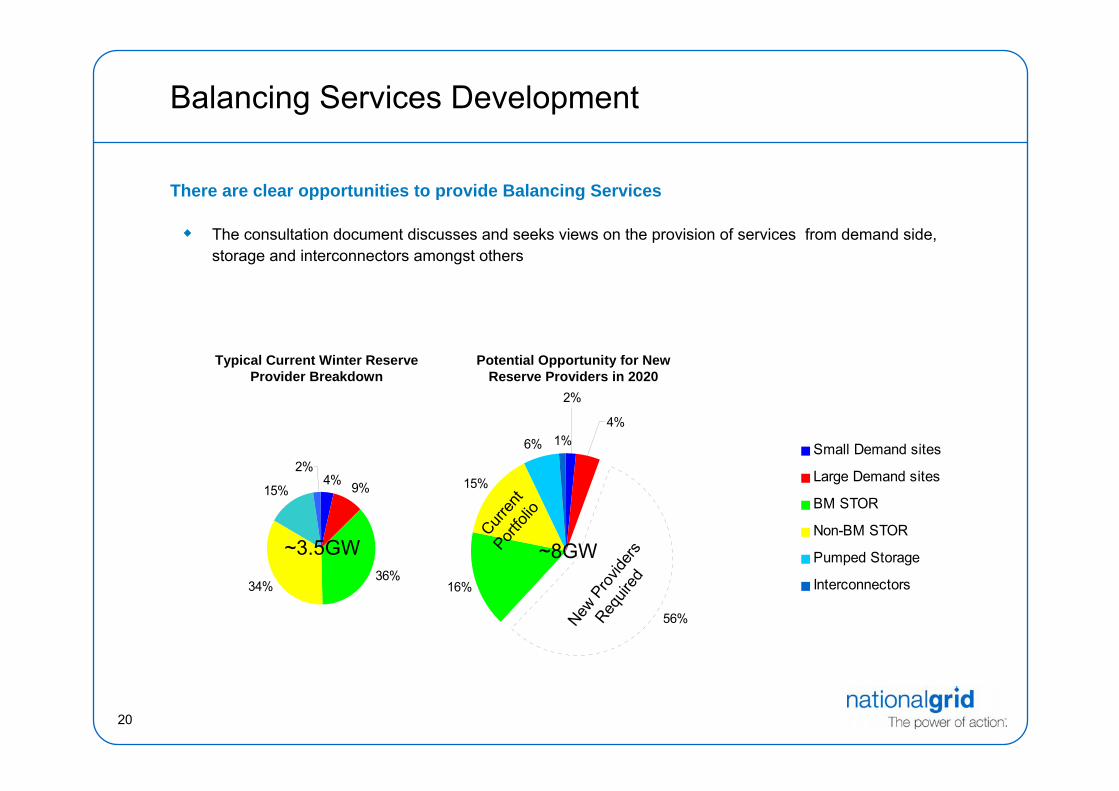
Balancing Services Development
There are clear opportunities to provide Balancing Services
The consultation document discusses and seeks views on the provision of services from demand side, storage and interconnectors amongst others
Small Demand sites
Large Demand sites
BM STOR
Non-BM STOR
Pumped Storage
Interconnectors
56%
16%
15%
6% 1%
2%
4%
Small Demand sites
Typical Current Winter Reserve Provider Breakdown
Potential Opportunity for New Reserve Providers in 2020
4% 9%
36%34%
15%
2%
~3.5GW ~8GW
Curren
t Port
folio
New P
rovid
ers
Requir
ed
21
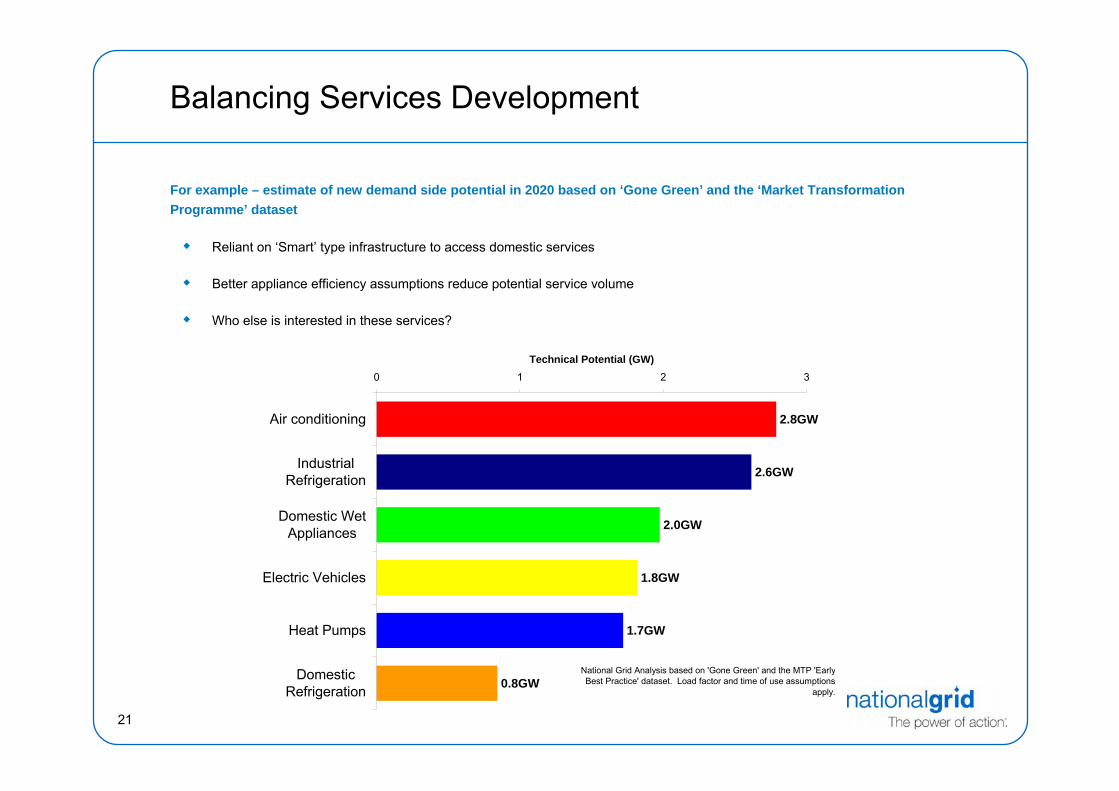
Balancing Services Development
For example – estimate of new demand side potential in 2020 based on ‘Gone Green’ and the ‘Market Transformation Programme’ dataset
Reliant on ‘Smart’ type infrastructure to access domestic services
Better appliance efficiency assumptions reduce potential service volume
Who else is interested in these services?
2.8GW
0.8GW
2.0GW
2.6GW
1.7GW
1.8GW
0 1 2 3
DomesticRefrigeration
Heat Pumps
Electric Vehicles
Domestic WetAppliances
IndustrialRefrigeration
Air conditioning
Technical Potential (GW)
National Grid Analysis based on 'Gone Green' and the MTP 'EarlyBest Practice' dataset. Load factor and time of use assumptions
apply.

22
How will it work -- Demand Response
Freezers & fridges Demand side future balancing opportunities
Defer or advance cooling
Seconds and minutes
Road Transport
Charging millions of batteries or producing H2 on the forecourt when it suits the system
GWs of response from a national battery
Seconds, minutes & hours
Heat pumps
Defer or advance heating (operation of electric pumps)
Seconds, minutes and 10s of minutes
Overseas large hydro (replace their demand)
Minutes, hours, days and months
Access to 50TWH storage
23
In Summary
Massive challenge in a Era of unprecedented change
Great opportunity for technological innovation
Networks will play a key part in delivering solutions
Potential for Demand Side
– but expectations need to be realistic and should perhaps focus more on wholesale market participation;
Recognition of Investment Challenge for new generation; and
Need for strong incentive to balance the system.