UGBC Social Security Forum April 27, 2005 Prof. Bob Murphy Department of Economics Boston College.
33
UGBC Social Security Forum April 27, 2005 Prof. Bob Murphy Department of Economics Boston College
-
Upload
winfred-roberts -
Category
Documents
-
view
220 -
download
0
Transcript of UGBC Social Security Forum April 27, 2005 Prof. Bob Murphy Department of Economics Boston College.

UGBC Social Security Forum
April 27, 2005
Prof. Bob Murphy
Department of Economics
Boston College

The First Social Security Recipient: Ernest Ackerman
Retired as a railroad motorman 1 day after Social Security started.
5 cents withheld from paycheck.
17 cents paid as lump sum on April 27, 1937.
68 years ago today!
Source: Social Security Administration and the History Channel

Three Points:
• Long-term funding problem for Social Security needs to be addressed.
• Introducing Private Investment Accounts won’t solve the funding problem and will worsen the problem in the short-run.
• Private Accounts should be evaluated separately, on their own merits.
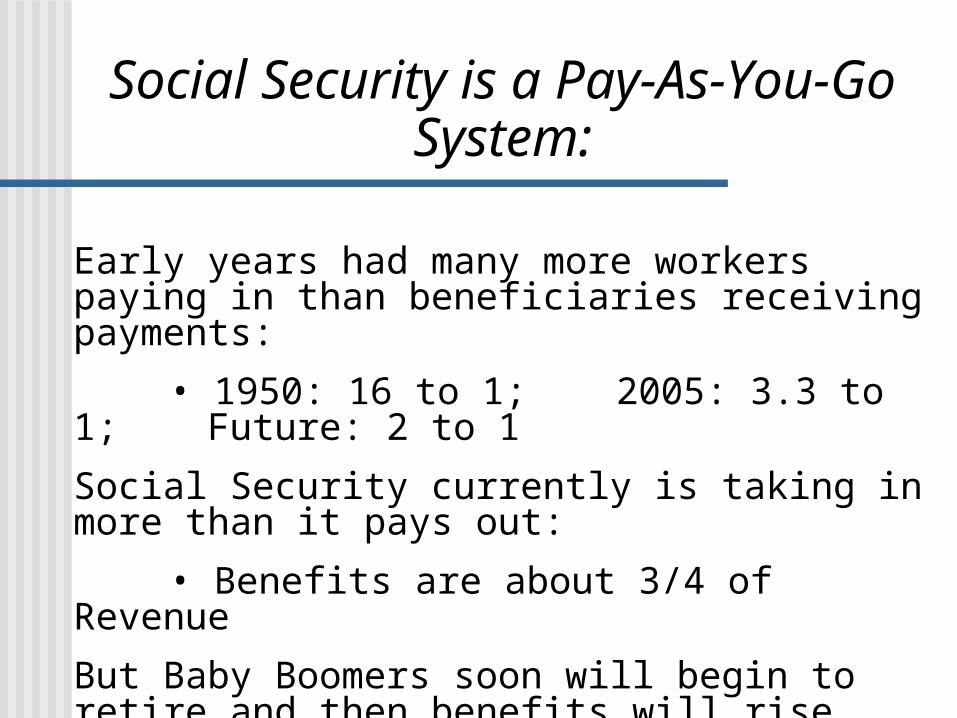
Social Security is a Pay-As-You-Go System:
Early years had many more workers paying in than beneficiaries receiving payments:
• 1950: 16 to 1; 2005: 3.3 to 1; Future: 2 to 1
Social Security currently is taking in more than it pays out:
• Benefits are about 3/4 of Revenue
But Baby Boomers soon will begin to retire and then benefits will rise faster than revenue.

Number of Covered Workers Per Social Security Beneficiary
Source: Social Security Trustees Report, 2005

Estimated Social Security Income and Cost
[Billions of 2005 Dollars]
Source: Social Security Trustees Report, 2005
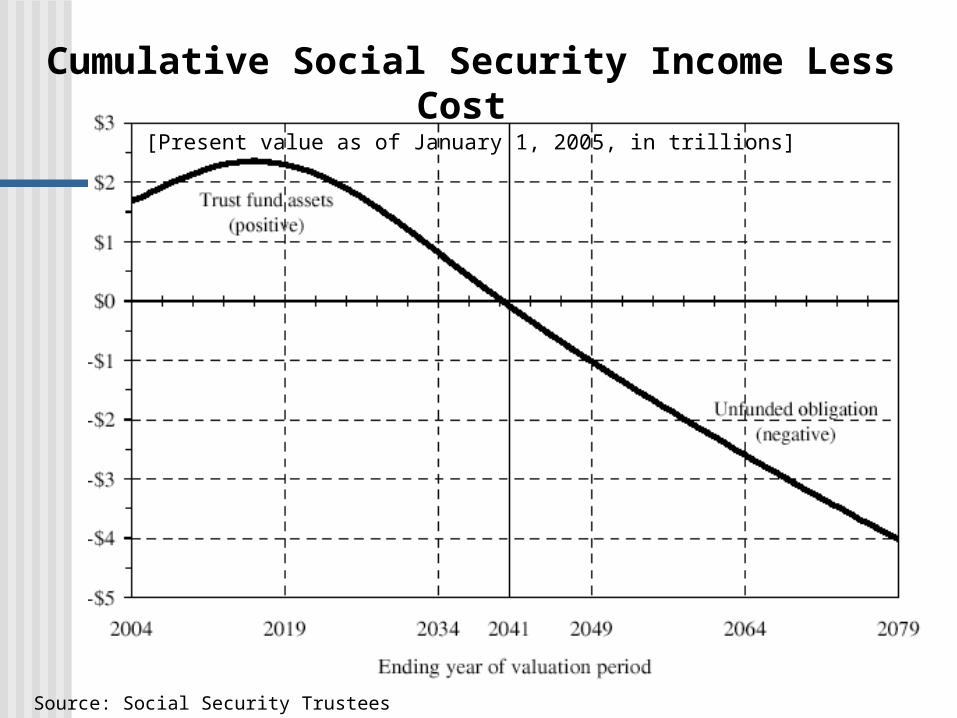
Cumulative Social Security Income Less Cost
[Present value as of January 1, 2005, in trillions]
Source: Social Security Trustees Report, 2005

Didn’t the shortfall worsen from last year by about $300 billion?
Yes, it rose from $3.7 trillion to $4 trillion.
What’s going on?
Main reason: Adding a “bad” year at the end of the 75-year horizon and removing a “good”year.
Fundamentally no real change…

Social Security Annual Balances: 2004 and 2005 Trustees Reports
[As a percentage of taxable payroll under the intermediate assumptions]
Source: Social Security Trustees Report, 2005

So How Large is the Problem?
Cumulative deficit is $4 trillion in present value (2005 dollars).
Represents a shortfall of 1.92% of taxable payroll.
Need to start redeeming Treasury IOUs in 2017.
Trust Fund exhausted in 2041.
But Social Security can continue to pay over 70% of promised benefits after 2041.

Large or Small Relative to What?
Compared to the cost of other government policies or programs.
In terms of the tax increase or benefit cut required to restore balance.

Source: Center for Budget and Policy Priorities and authors calculations
Social Security Shortfall and Cost of Other Policies, Over Next 75 Years
(present values through 2078)
0.0
0.5
1.0
1.5
2.0
2.5
Permanent TaxCuts
Rx DrugBenefit
Social SecurityShortfall
Tax Cuts forTop 1%
Percent of GDP

To Solve the Financing Problem:
Need to close the gap between benefits and revenues.
Gap equals 1.92 percent of the income that is presently taxable for Social Security.
So we could raise the tax rate (employer plus employee) by 1.92 percentage points or cut the benefit rate by a similar amount.

Such changes would represent:
A tax increase of 15 percent (1.92/12.4),
or
A benefit cut of 13 percent (1.92/14.32),
or
Some combination of both.
Sounds small, but…

Ways to Close the Financing Gap
Raise more revenue:
Cover all state and local workers
Increase the base on which tax is levied
Raise the tax rate
Tax a larger share of Social Security benefits
Cut benefits:
Raise retirement age
Adjust cost-of-living indexing for known bias in CPI

Problem seems manageable:
Similar problem was solved in 1983 by raising taxes and cutting benefits -- “Greenspan Commission.”
Changes in economy and demographics altered the outlook by the late 1980s leaving us with the gap today.
But, what happens if you look beyond 75 years?
Problem appears much worse…

Unfunded Social Security Obligations for 1935 Through the Infinite Horizon
Source: Social Security Trustees Report, 2005

On the other hand, could the forecasts be wrong?
Sure could…
Over last decade, projections generally have been too pessimistic (although last year was slightly optimistic).
Date when Trust Fund is exhausted is now 2041 versus 2029 in 1997.
The 75-year shortfall as a percent of taxable payroll is now 1.92 compared with 2.2 in 1997.
Let’s look at assumptions behind the forecasts…

Values of Key Demographic and Economic Assumptions for the Long-
Range (75-year) Projection Period
Also assumes that Total Employment grows at 0.2 percent, so that Real GDP grows at 1.8 percent.
Source: Social Security Trustees Report, 2005

Long-Range Social Security Trust Fund Ratios Under Alternative Assumptions
[Assets as a percentage of annual cost]
Source: Social Security Trustees Report, 2005
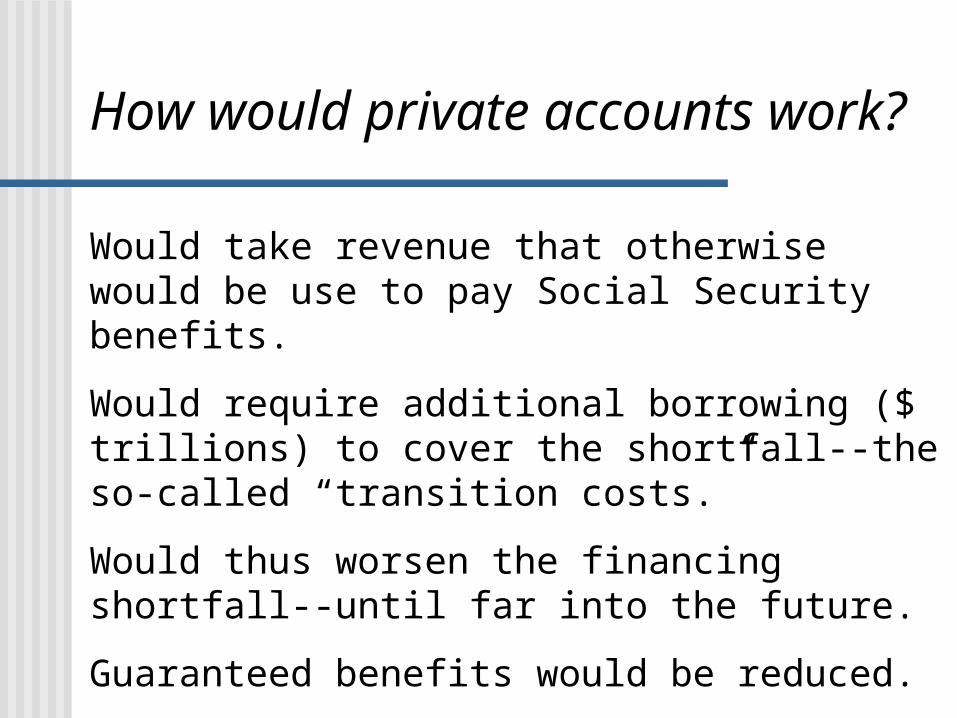
How would private accounts work?
Would take revenue that otherwise would be use to pay Social Security benefits.
Would require additional borrowing ($ trillions) to cover the shortfall--the so-called “transition costs.”
Would thus worsen the financing shortfall--until far into the future.
Guaranteed benefits would be reduced.
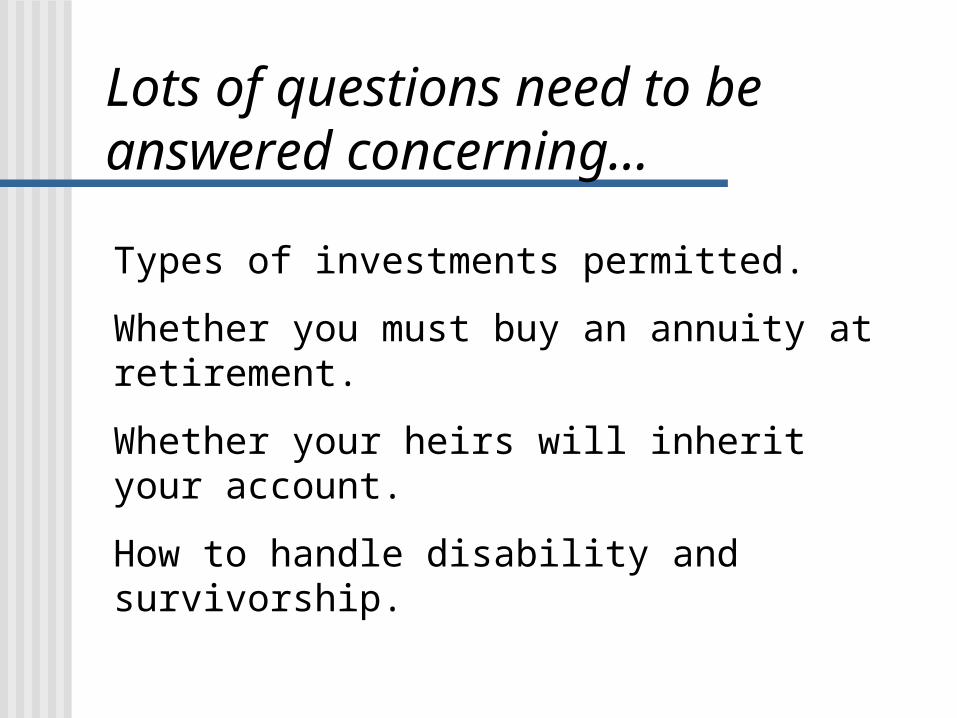
Types of investments permitted.
Whether you must buy an annuity at retirement.
Whether your heirs will inherit your account.
How to handle disability and survivorship.
Lots of questions need to be answered concerning…

Possible Benefits of Private Accounts
Potential to earn a higher “return” than on Social Security--a “sweetener” for fixing solvency problem.
Provide “ownership” to participants.
Give people more choice in managing their retirement.
Would start to move Social Security to a pre-funded program.
Provide investment opportunities to lower income people who now don’t have this option.

Yet, private accounts would represent a very different type of program…
Participants would take on greater risk.
Participants would give up an inflation-adjusted, guaranteed asset.
Unclear how much “choice” people really would have over their investments.

But, doesn’t the stock market average 7% per year after inflation?
Yes, it does. But the future may not be like the past…
Investment disclaimer: “Past performance is no guarantee of future success.”
Economic assumptions leading to insolvency are inconsistent with 7% returns (recent Brookings study by Baker, DeLong, and Krugman).

And, even if the future resembles the past…
Participants wouldn’t be investing a lump sum at the start--which is what the simple long-term average return implies.
Instead, participants would be investing continually--so returns closer to retirement get weighted more heavily than returns early in one’s career.

How risky is investment in the stock and bond markets?One way to assess this is to look at hypothetical investment scenarios using data on historical returns.
The variability of investment performance is significantly greater when participants add continually to their account--as would be the case under nearly all proposed plans.
This continues to be true even when a “mixed” portfolio of stocks, bonds, and cash is chosen.

Average Real Return over 40-Year Horizons Beginning in 1925(For Fixed Sum at Start and Constant Real Contribution;
Investment in a Portfolio of 100% Stocks)
0%
1%
2%
3%
4%
5%
6%
7%
8%
9%
10%
Fixed Constant
1925 1925
1965
1965
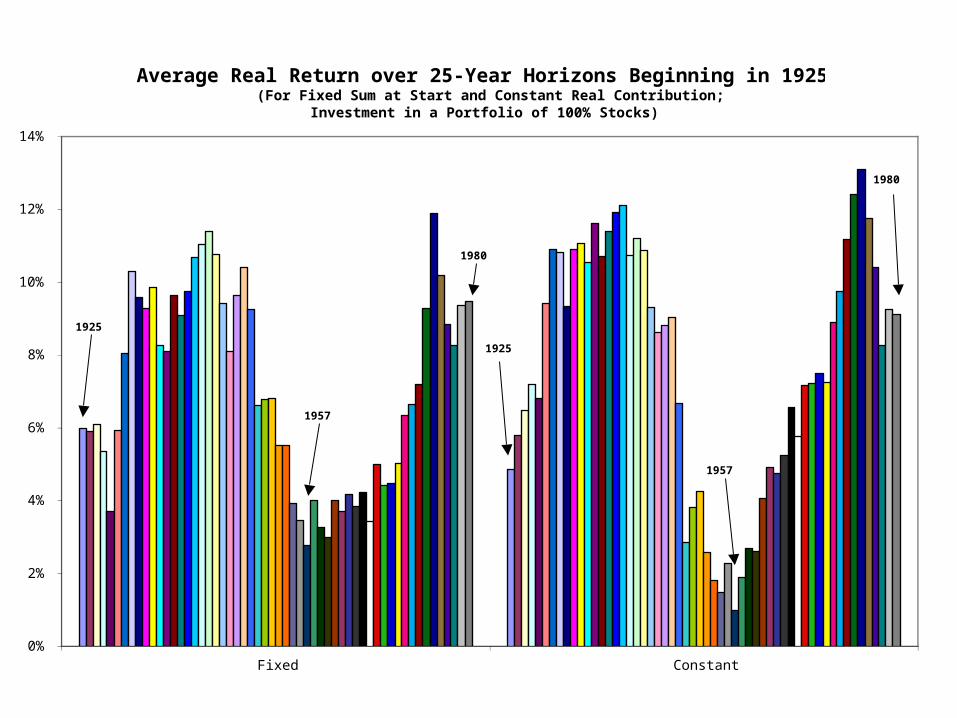
Average Real Return over 25-Year Horizons Beginning in 1925(For Fixed Sum at Start and Constant Real Contribution;
Investment in a Portfolio of 100% Stocks)
0%
2%
4%
6%
8%
10%
12%
14%
Fixed Constant
1980
1957
1925
1980
1957
1925

Average Real Return over 40-Year Horizons Beginning in 1925(For Fixed Sum at Start and Constant Real Contribution;
Investment in a Portfolio of 50% Stocks, 30% Govt. Bonds, 20% T-Bills)
0%
1%
2%
3%
4%
5%
6%
7%
Fixed Constant
1925
1940
1925
1942
1965
1965

Average Real Return over 25-Year Horizons Beginning in 1925(For Fixed Sum at Start and Constant Real Contribution;
Investment in a Portfolio of 50% Stocks, 30% Govt. Bonds, 20% T-Bills)
-1%
0%
1%
2%
3%
4%
5%
6%
7%
8%
9%
10%
Fixed Constant
19251925
1980
1957
1957
1980

Investing each year rather than just at the start makes the average annual return more variable.
Longer-horizons do help make the average annual return less variable.
But, performance still varies substantially across cohorts.
Even for 40-year horizons, the average return on a mixed portfolio was less than 3% over one-fifth of the time.
What is an “acceptable” level of risk?

Summary
Social Security faces a long-term financing problem.
Problem is manageable, but easier to fix sooner than later.
Private Accounts alone would not solve this problem and actually would worsen it.
Private Accounts should be evaluated on merits, weighing costs versus benefits, AND recognizing how very different they would be from Social Security.