UGANDA - ITU · UGANDA 5 1. GENERAL SOCIO-ECONOMIC SITUATION OF UGANDA This section provides a...
46
The Changing International Telecommunications Environment: Country Case Studies UGANDA REVISED FINAL REPORT 15 May, 1998 Consultants: Clifford Chance and Booz, Allen & Hamilton, Inc.
Transcript of UGANDA - ITU · UGANDA 5 1. GENERAL SOCIO-ECONOMIC SITUATION OF UGANDA This section provides a...
The Changing International Telecommunications Environment: Country Case Studies
UGANDA
REVISED FINAL REPORT
15 May, 1998
Consultants: Clifford Chance and Booz, Allen & Hamilton, Inc.

UGANDA
2
AUTHOR’S NOTE............................................................................................................................................................4
1. GENERAL SOCIO-ECONOMIC SITUATION OF UGANDA ...............................................................................5
1.1 BACKGROUND............................................................................................................................................................51.2 SOCIO-ECONOMIC INDICATORS..................................................................................................................................51.3 ECONOMIC DRIVING FORCES .....................................................................................................................................51.4 POLITICAL STABILITY.................................................................................................................................................61.5 TRADING ARRANGEMENTS ........................................................................................................................................71.6 URBANISATION AND MIGRATION ...............................................................................................................................71.7 EDUCATION LEVELS...................................................................................................................................................71.8 PLANS FOR FUTURE DEVELOPMENT...........................................................................................................................71.9 NET SETTLEMENT PAYMENTS TO UPTC....................................................................................................................7
2. TELECOMMUNICATIONS POLICY AND NETWORK DEVELOPMENT .......................................................9
2.1 GENERAL REGULATORY FRAMEWORK........................................................................................................................92.1.1 Current regulatory framework...........................................................................................................................92.1.2 Recent changes and likely future changes to the regulatory environment ......................................................10
2.2 DOMESTIC NETWORK ..............................................................................................................................................112.2.1 Overview..........................................................................................................................................................112.2.2 Switching System .............................................................................................................................................112.2.3 Transmission System........................................................................................................................................122.2.4 Border Pay Phones..........................................................................................................................................122.2.5 UPTC Subscribers ...........................................................................................................................................122.2.6 UPTC Operations ............................................................................................................................................132.2.7 UPTC Challenges and Expansion Plans .........................................................................................................132.2.8 UPTC Financing of Future Expansion............................................................................................................132.2.9 Other Networks in Uganda..............................................................................................................................14
2.3 OVERVIEW OF INTERNATIONAL NETWORK...............................................................................................................142.3.1 International Numbering Plan and its Consequences. ....................................................................................142.3.2 International Network Outside East Africa .....................................................................................................152.3.3 International Network Within East Africa .......................................................................................................15
3. EVOLUTION OF INTERNATIONAL TELECOMMUNICATIONS ENVIRONMENT ...................................16
3.1 REGULATORY STATUS OF INTERNATIONAL SERVICES ...............................................................................................163.2 TRENDS IN INTERNATIONAL TELEPHONE TRAFFIC AND PRICES 1990-1996 ...............................................................16
3.2.1 General Price Trends ......................................................................................................................................163.2.2 Detailed Trends in Settlement Rates................................................................................................................173.2.3 International Traffic Trends ............................................................................................................................183.2.4 Current National and Local Traffic.................................................................................................................183.2.5 Traffic Forecasts..............................................................................................................................................193.2.6 Investment Cost Per Line.................................................................................................................................203.2.7 Pricing of Services...........................................................................................................................................20
3.3 TRENDS IN ACCOUNTING AND SETTLEMENT RATES.................................................................................................213.3.1 Detailed trends in International Accounting Price Rates................................................................................223.3.2 Trends in Non-East African International Traffic ...........................................................................................243.3.3 Price Elasticity of Demand..............................................................................................................................253.3.4 Telecommunications indicators .......................................................................................................................25
4. COST EVALUATION OF INTERNATIONAL TELECOM SERVICES.............................................................26
5. SCENARIOS FOR CHANGES IN THE INTERNATIONAL ACCOUTNING SYSTEM...................................29
5.1 REVENUE PROJECTION MODEL: STRUCTURE ...........................................................................................................295.2 BASE CASE ..............................................................................................................................................................305.3 STAGED REDUCTION IN ACCOUNTING RATES ............................................................................................................315.4 BENCHMARKING OR PRICE CAPS FOR SETTLEMENT RATES .......................................................................................315.5 CALL TERMINATION OR UNBUNDLED INTERCONNECTION PAYMENTS ......................................................................325.6 VERY LOW SETTLEMENT RATES, SENDER KEEPS ALL ETC.........................................................................................335.7 REVENUE STABILISATION MEASURES .......................................................................................................................335.8 UGANDA DROPS COLLECTION RATES FASTER .........................................................................................................345.9 SUMMARY OF REVENUE PROJECTION RESULTS.........................................................................................................35

UGANDA
3
6. CONCLUSIONS..........................................................................................................................................................36
6.1 EVALUATION OF SCENARIOS BASED ON THE REVENUE PROJECTION MODELS............................................................366.1.1 Likely commercial responses ...........................................................................................................................366.1.2 Likely policy response......................................................................................................................................37
LIST OF TABLES
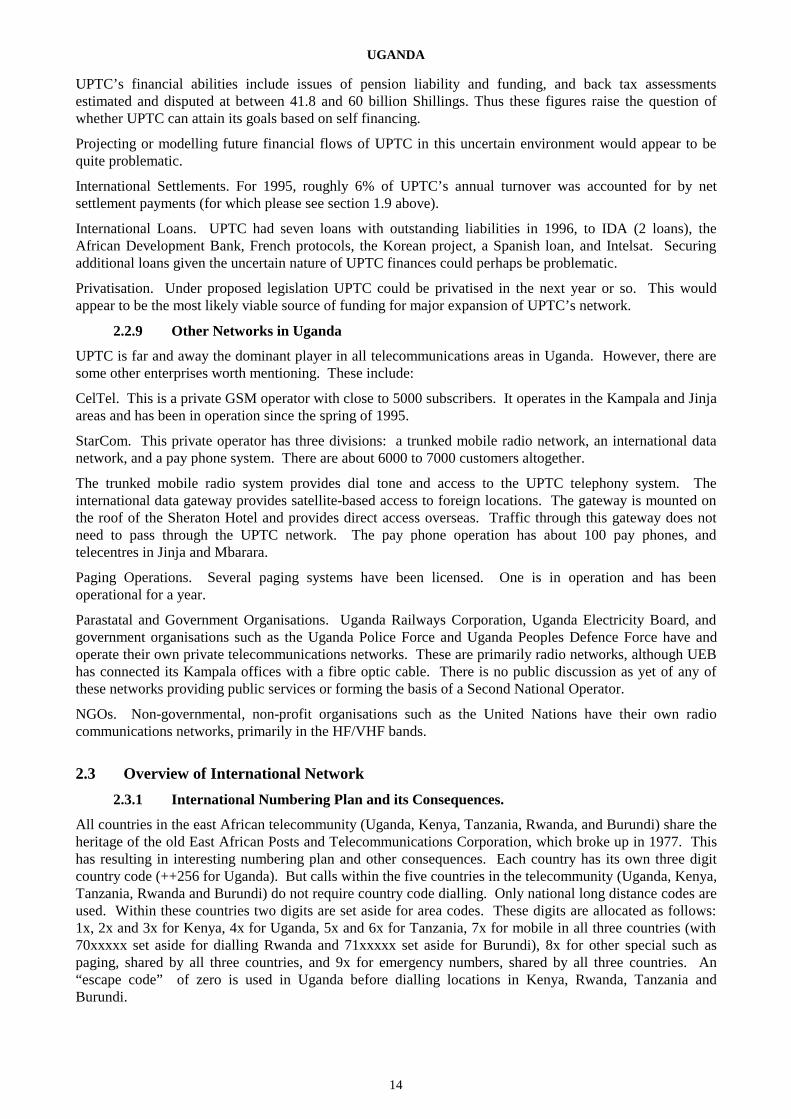
TABLE 1.1: MACRO-ECONOMIC STATISTICS.........................................................................................................................5TABLE 3.1: INCOMING AND OUTGOING CIRCUITS...............................................................................................................18TABLE 3.2: INCOMING AND OUTGOING INTERNATIONAL TRAFFIC ......................................................................................19TABLE 3.3: DOMESTIC AND INTERNATIONAL TARIFF SCHEDULE AND CHNGES ..................................................................21TABLE 3.4: CHANGES IN INTERNATIONAL TARIFFS, 1992, 1994 AND 1997.........................................................................25TABLE 4.1: INDICATIVE ANALYSIS OF SATELLITE LINKS COSTS IN UGANDA ......................................................................27TABLE 4.2: FCC TCP ESTIMATES FOR AFRICAN COUNTRIES..............................................................................................28TABLE 6.1: REVENUE & MINUTES UNDER VARIOUS SCENARIOS .........................................................................................35

UGANDA
4
AUTHOR’S NOTE
This Final Report is presented to the Commonwealth Telecommunications Organisation (“CTO”), theWorld Bank InfoDev, and the International Telecommunication Union by Clifford Chance and Booz.Allen& Hamilton on 4 February 1998.
The information contained in this Final Report has been obtained from meetings with and informationprovided by Uganda Posts and Telecommunications Corporation, the Ministry of Works, Transport andCommunications and the Privatisation Unit of the Ministry of Finance.
Clifford ChanceBooz.Allen & Hamilton4 February 1998

UGANDA
5
1. GENERAL SOCIO-ECONOMIC SITUATION OF UGANDA
This section provides a general overview of the socio-economic situation in Uganda.
1.1 Background
The Republic of Uganda is a landlocked country in East Africa covering an area of 235,885 km2 (94,354miles2). Major metropolitan areas include the capital city of Kampala and the cities of Jinja, Mbale, andMbarara. The country’s terrain consists of 18% inland water and swamp; 12% national parks, forest, andgame reserves; 70% forest, woodland, and grassland. The climate in the northeast is semi-arid, with annualrainfall of less than 50 cm (20 in.), while in the southwest annual rainfall is 130 cm (50 in.) or more.
1.2 Socio-Economic Indicators
The table below gives some of the major economic indicators for Uganda for the years indicated:
Table 1.1: Macro-economic statistics
Factor 1990 1991 1992 1993 1994 1995 1996GDP, real (US$m) 7,677 8,093 8,355 9,053 9,602 10,675 11,683GDP, nominal (US$) 4,304 3,321 2,856 3,220 3,981 5,655 6,005GNP, real per capita (US$) 454 464 465 488 502 545 585GDP growth 6.4% 5.4% 3.2% 8.3% 6.1% 11.2% 9.4%GNP per capita (US$) 350 260 200 190 190 240 290Disposable income per capitaTotal consumption per capita(US$)
262 195 163 177 205 273 285
Inflation (%) 27.7 54.5 5.1 10.0 6.6Population (Mil) 16.92 17.44 17.97 18.56 19.12 19.57 19.98Population growth rate (%) 3.2 3.1 3.0 3.3 3.0 2.4 2.1Balance of trade capital (US$m)Exchange rate Shillings to US$ 428.9 734.0 1,133.8 1,195.0 979.4 968.9 1,046.1CPI (1987=100) 636.4 815.0 1,242.4 1,317.9 1,446.2 1,569.9 1,684.6
Source: Case Study
Costs in the telecommunications sector have been estimated by Uganda Posts and TelecommunicationsCorporation (“UPTC”) to have inflated by only 6% in the period from 1992 to 1996.
1.3 Economic Driving Forces
Uganda's economy has great potential. Endowed with significant natural resources, including amply fertileland, regular rainfall, and mineral deposits, it appeared poised for rapid economic growth and developmentat independence. However, chronic political instability and erratic economic management produced arecord of persistent economic decline that has left Uganda among the world's poorest and least-developedcountries.
Agricultural products supply nearly all of Uganda's foreign exchange earnings, with coffee alone accountingfor over 90% of the country's exports. However, with world coffee prices unreliably fluctuating and coffeewilt disease damaging production, other exports are becoming more important. Exports of hides, skins,vegetables, fruits, flowers, and fish are growing, and cotton, tea, and tobacco continue to be mainstays.
Most industry is related to agriculture. The industrial sector is being rehabilitated to resume production ofbuilding and construction materials, such as cement, reinforcing rods, corrugated roofing sheets, and paint.Domestically produced consumer goods include plastics, soap, beer, and soft drinks.

UGANDA
6
Uganda has about 32,000 kilometres (20,000 mi.) of roads; some 6,400 kilometres (4,000 mi.) are paved.Most radiate from Kampala. The country has about 1,300 kilometres (800 mi.) of rail lines. A railroadoriginating at Mombasa on the Indian Ocean connects with Tororo, where it branches westward to Jinja,Kampala, and Kasese and northward to Mbale, Soroti, Lira, Gulu, and Kapwach. Uganda’s important roadand rail links to Mombasa serve its transport needs and also those of its neighbours-Rwanda, Burundi, andparts of Zaire. An international airport is at Entebbe on the shore of Lake Victoria, some 32 kilometres (20mi.) south of Kampala.
1.4 Political Stability
Since Uganda gained independence from Britain on October 9, 1962, the political situation in the countryhas been characterised by frequent periods of unrest and repression. However, the recent past has been arelatively peaceful time of reconciliation and economic rebuilding.
The first general elections in Uganda were held in 1961, and the British government granted internal self-government to Uganda on March 1, 1962, leading to full independence on October 9. Uganda maintained itsCommonwealth membership. In succeeding years, supporters of a centralised state vied with those in favourof a loose federation and a strong role for tribally based local kingdoms. Political manoeuvring climaxed inFebruary 1966, when Prime Minister Milton Obote suspended the constitution, assumed all governmentpowers, and removed the president and vice president.
In September 1967, a new constitution proclaimed Uganda a republic, gave the president even greaterpowers, and abolished the traditional kingdoms. On January 25, 1971, Obote’s government was ousted in amilitary coup led by armed forces commander Idi Amin Dada. Amin declared himself president, dissolvedthe parliament, and amended the constitution to give himself absolute power.
Idi Amin’s 8-year rule produced economic decline, social disintegration, and massive human rightsviolations. In October 1978, Tanzanian armed forces repulsed an incursion of Amin’s troops into Tanzanianterritory. The Tanzanian force, backed by Ugandan exiles, waged a war of liberation against Amin’s troopsand Libyan soldiers sent to help him. On April 11, 1979, Kampala was captured, and Amin fled with hisremaining forces.
After Amin's removal, the Uganda National Liberation Front (“UNLF”) formed an Final government withYusuf Lule as president. This government adopted a ministerial system of administration and created aquasi-parliamentary organ known as the National Consultative Commission (“NCC”). In June 1979,following a dispute over the extent of presidential powers, the NCC replaced President Lule with GodfreyBinaisa. In a continuing dispute over the powers of the Final presidency, Binaisa was removed in May1980. Thereafter, Uganda was ruled by a military commission chaired by Paulo Muwanga. The December1980 elections returned Milton Obote to power as president, with Muwanga serving as vice president.Under Obote, the security forces had one of the world's worst human rights records. In their efforts to stampout an insurgency led by Yoweri Museveni's National Resistance Army (“NRA”), they lay waste to asubstantial section of the country, especially in the Luwero area north of Kampala.
Obote ruled until July 27, 1985, when an army brigade, composed mostly of Acholi troops and commandedby Lt. Gen. Basilio Olara-Okello, took Kampala and proclaimed a military government. Obote fled to exilein Zambia. The new regime, headed by former defence force commander Gen. Tito Okello (no relation toLt. Gen. Olara-Okello), opened negotiations with the insurgent forces of Yoweri Museveni, and pledged toimprove respect for human rights, end tribal rivalry, and conduct free and fair elections. In the meantime,massive human rights violations continued as the Okello government murdered civilians and ravaged thecountryside in order to destroy the NRA's support.
Negotiations between the Okello government and the NRA were conducted in Nairobi in the fall of 1985,with Kenyan President Daniel Moi seeking a cease-fire and a coalition government in Uganda. Althoughagreeing in late 1985 to a cease-fire, the NRA continued fighting, seized Kampala in late January 1986, andassumed control of the country, forcing Okello to flee north into Sudan. Museveni's forces organised agovernment with Museveni as president.
Since assuming power, the NRA-led government has largely put an end to the human rights abuses of earliergovernments, established a human rights commission to investigate previous abuses, and instituted broad

UGANDA
7
economic reforms after consultation with the International Monetary Fund (“IMF”), World Bank, and donorgovernments. A constitutional commission was named to draft a new constitution, which was adopted onSeptember 22nd, 1995.
Insurgent elements and armed bandits in the north and west harass government forces and create a sense ofinsecurity, but they do not threaten the stability of the regime. Most notable are the Lord’s Resistance Armyheaded by Joseph Kony and supported by the regime in Sudan, the ADF rebels along the border with Congocomprised primarily of remnants of Mobutu’s army, and the Uganda National Resistance Army - Part IIresurrected from the previously defeated West Nile Bank Front.
1.5 Trading Arrangements
Uganda has historically been allied with Kenya and Tanzania in an economic trading group. Although theEast African Community collapsed amid much rancour in 1977, the revival of the East African co-operationhas helped the three countries to co-ordinate development and trade opportunities. It has also led to anincrease in the volume of trade between the countries. Statistics from the Kenya Bureau of Statistics showthat the value of goods imported by Uganda has grown from 2.456 billion Kenya shillings in 1992 to 19.063billion Kenya shillings in 1996. Ugandan exports to Kenya have also shown an increase although thebalance of trade between the two countries greatly favours Kenya.
1.6 Urbanisation and Migration
Population projections made by the Statistics Department, Ministry of Finance and Economic Planning nowput the urban population at 14.41%. An estimated 1,000,000 people now live in the capital of Kampala andits suburbs, compared to 774,241 during the census of 1991.
1.7 Education Levels
Improving the level of education has been a major goal of the government. In 1989, primary schoolenrolment was 60%, and the literacy rate was 52%. In 1996, a programme of Universal Primary EducationThe 1991 Population and Housing Census found that 11.3% of the population lived in urban areas. wasinstituted whereby students at the primary level are enrolled free of charge.
1.8 Plans for Future Development
The government’s plans for future economic development are directed towards three main areas: tourism,hydroelectric power, and agro-processing. While Uganda’s tourist destinations are more difficult to reachbecause of distance from major cities and transport hubs, emphasis is being placed on development of hotelsand lodges within the game preserves. Major international hotel operators have been attracted to invest inthese lodges.
Virtually all of the country’s electric power is provided by the Owens Falls dam on the Nile River. Thecountry is currently experiencing a shortage of electric power, and load shedding schedules have beenimplemented in many locations. In response to the shortages, plans have been developed for a major newdam on the Nile, as well as smaller hydroelectric facilities on several other rivers around the country.
Finally, the government is hoping to increase the value of the country’s export goods by developing adomestic industry to process the country’s agricultural produce into finished products prior to export. Thegoal is to add as much value as possible to export goods in order to increase foreign exchange revenues.Agro-processing is being emphasised for coffee, tea, fisheries, and groundnuts.
1.9 Net Settlement Payments to UPTC
Senior UPTC staff state that international settlements are a major source of funding for the necessarybuildout of the network, which is at a quite low level of penetration. The Auditor-General’s report on UPTCshowed that turnover in 1996 was 49.9 million Shillings and in 1995 was 49.2 million. Of this, internationaltelecommunications inpayments were 9.0 million and 9.1 million respectively in the two years, andinternational telecom outpayments were 5.8 and 5.3 million each year. Thus inpayments exceeded

UGANDA
8
outpayments by a substantial margin in each year, and the net of the two figures constituted roughly 6percent of total turnover.

UGANDA
9
2. TELECOMMUNICATIONS POLICY AND NETWORK DEVELOPMENT
This section examines:
• The statutory basis for, and functions of, UPTC;
• The Uganda Communications Act 1997 and the framework for the liberalisation of telecommunications;
• The likely changes that will result from the implementation of the new Act;
• An outline of Uganda’s domestic network, services and other issues;
• An overview of Uganda’s international facilities.
2.1 General regulatory framework
2.1.1 Current regulatory framework
UPTC was constituted under the Uganda Posts and Telecommunications Corporation Act 1983 (“UPTCAct”) 1 to provide both postal services2 and telecommunications services in Uganda. The East African Postsand Telecommunications Corporation previously provided these services. UPTC, under the auspices of theMinistry of Works, Transport and Communications, took over these services within Uganda in 1977.
UPTC is a parastatal company, which is wholly owned by the government.
Under the UPTC Act, UPTC is authorised to provide both telecommunications and radiocommunicationsservices. UPTC is also able to offer cellular services. UPTC is responsible for regulating thetelecommunications sector and is able to grant licences to other operators for the provision by them oftelecommunications services. Licences have been granted for the provision of GSM cellular services (toCelTel, which is a consortium, including Vodafone), for trunked mobile radio operator services, (to StarlightCommunications Uganda Limited or Starcom) and for the provision of Internet services (to date, fivecompanies have been licensed to provide Internet services.
In January 1996, the government adopted a Telecommunications Sector Policy Statement (the “SectorPolicy Statement”). The Sector Policy Statement sets out the government’s objectives for the sector.These objectives include:
• Increasing teledensity from the current 0.25 lines per 100 people to 2.0 lines;
• Improving facilities and services and introducing new telecommunications services such as electronicmail; and
• Increasing the geographical distribution of telecommunications services.
In order to meet these objectives, specific targets were adopted, although no timeframe is given. Thesetargets include:
• Improving call completion rates from 35% to 65%;
• Improving fault recovery rates to 60% within 24 hours and 95% within 72 hours;
• Upgrading the national network to achieve 75% digitalisation; and
• Increasing subscriber lines to a minimum of 300,000.
The Sector Statement set out the government’s strategy for meeting these objectives. This strategy providesfor:
• The repeal of the UPTC Act by a new telecommunications Act;
1 Act 3 of 1983
2 Postal services are not considered further in this Final Report.

UGANDA
10
• Splitting off the postal and telecommunications functions of UPTC into Uganda Telecommunications Ltd(“UTL”) and Uganda Posts Limited respectively and, subsequently, selling off a proportion of the sharesin UTL;
• Establishing an independent regulator;
• Licensing a second national operator;
• Fostering competition in the telecommunications sector.
A new Act, the Uganda Communications Act 1997 (“UC Act”) 3, received presidential assent on 19September 19974. Although the UC Act provides for the repeal of the UPTC Act, the UPTC Act remains inforce pending the creation of Uganda Communications Commission, the independent regulator, and thetransfer of UPTC’s assets to each of UTL and Uganda Posts Limited. UPTC remains as the Ugandatelecommunications operator and retains its regulatory functions. These functions are exercised through an“Final” Commission (for which, please see section 2.1.2 below).
2.1.2 Recent changes and likely future changes to the regulatory environment
The UC Act provides a framework under which a modern communications sector can be developed. Theobjectives of the UC Act include:
• Enhancing national coverage of communications services;
• Reducing government participation in the sector;
• Encouraging private investment; and
• Encouraging competition.
The UC Act will establish the Uganda Communications Commission (the “Commission”) 5 who will beresponsible for regulating the communications sector. In addition, its functions will include:
• Granting “Minor” licences6 for services such as paging, store and forward messaging, telex and telegraphservices and value-added services;
• Advising the Minister on the grant of “Major” licences7 (the licences to be granted to UTL and to thesecond national operator will be Major licences and will authorise basic national and internationaltelephony services, cellular services, trunk capacity resale services (i.e. leased lines) satellite services andthird party private network services);
• Assigning radio frequencies;
• Establishing a tariff system to protect consumers;
• Developing and monitoring a numbering plan;
• Improving services and promoting competition;
• Representing the government at international fora.
The framework provided by the UC Act enables the government to bring a number of staged liberalisationmeasures into effect in the short to medium term. These measures, such as the licensing of the second
3 Act 8 of 1997
4 The UC Act was commenced on 26 September 1997. The formal creation of the regulator and the creation of UTL have not yetoccurred.
5 The Commission has not been formally constituted. This will occur when the Commissioners are formally appointed, which maybe delayed until late March. An interim staff of four people has been established, which is handling matters on an interim basis.Such matters include frequency assignment and licensing.
6 Minor licences are defined as licences for the provision of private network services by a service provider to non-affiliated privatenetwork users over leased lines.
7 Major licences are defined as licences for the provision of private network services by a service provider to non-affiliated privatenetwork users over lines any portion of which is owned by the service provider.

UGANDA
11
national operator and the grant of licences for value added and data services are included in thegovernment’s draft offer of commitments under the World Trade Organisation (“WTO”) BasicTelecommunications Agreement.
In particular, the government is proposing to adopt the regulatory disciplines set out in the RegulatoryReference Paper (the “Reference Paper”). Primarily, the UC Act will effect the separation of UPTC’soperational and regulatory functions. The creation of the Commission should create a more open regulatoryenvironment.
Much of the detail required by the Reference Paper will be put in place by way of licences and byregulations promulgated by the Commission. In particular, all major suppliers, which would include UPTC,will be required to offer cost-oriented interconnection rates to all service suppliers.
In the context of the international settlements regime, it is interesting to note that Uganda is proposing totake a Most-Favoured-Nation exemption for measures including differential accounting and settlementprocedures entered into between the government and neighbouring countries, including Kenya, Tanzaniaand the Community of Eastern and Southern Africa (“COMESA”) countries.8
The UC Act provides a framework for the incorporation of UTL. As at 8 December 1997, UTL has not beenformally constituted but it is understood that UTL will be incorporated in within the next two weeks. UTLwill have two shareholders. The Ministry of Works, Transport and Communications will hold a nominalshare, with the remainder of the shares held by the Ministry of Finance. There will be 4 million shares of25,000 shillings each, giving a total share capital of 100 billion shillings.
UTL will be privatised by way of sale of a percentage of shares to a strategic partner. The percentage hasnot yet been determined. After privatisation, the strategic partner will manage UTL in accordance with amanagement agreement with the government.
Following an amendment to the UC Act, which was adopted on 5 December 1997, the licensing of theSecond National Operator was uncoupled from the privatisation process. The winning bidder for the SecondNational Operator Licence was the MTN/Telia consortium, which includes MTN, the South African mobiletelecommunications operator, Telia Overseas AB, and two other members, Tristar and Investco, based inUganda and Rwanda respectively.
2.2 Domestic Network
2.2.1 Overview
At the end of 1996 UPTC had 46,207 subscribers, and with a population of 20.4 million, the currentteledensity is 0.23, one of the lowest in the world. Of lines in service, 70.8% are in the Kampala region.Most of the large towns are served by modern digital exchanges with a wide range of modern features.Digital switching and transmission systems have been installed in Kampala and three surrounding towns.Most rural areas are served by manual switchboards or radio call systems. A large part of thetelecommunications facilities in northern Uganda were destroyed in the past (and current) unrest, and muchof the remaining rural system has problems with ageing equipment and lack of spare parts. (Please note thatportions of the following data were obtained from an ITU-sponsored study prepared by Dr. Fritz Ringling ofMiami, Florida, in July 1997.)
2.2.2 Switching System
The existing network is composed of seven Area Switching Centres, of a combined mesh-star system. Allmajor urban exchanges are served by digital switches. Some crossbar exchanges are also in use. The smallerexchanges are all manual and were commissioned in the 1970s, but the proportion of customers served islow.
8 These countries are Angola, Malawi, Mauritius, Mozambique, Namibia, Swaziland, Tanzania, Zambia and Zimbabwe. Lesotho haswithdrawn its membership. Mozambique has indicated that it will also withdraw.

UGANDA
12
Two trunk switching units are installed in Kampala, one digital and one crossbar exchange. About 89% ofUgandan subscribers are connected to automatic switching equipment, while 1.3% are connected to step-by-step switches.
UPTC call completion statistics show that service quality is poor, with the call completion ratio at about30% for local and national call attempts, only occasionally exceeding 70%. The ASR (answer to seizureratio) for outbound international traffic averages 53.8% while the ASR for inbound traffic is about 40.3%.The traffic load measured in Erlangs per access line for Kampala in April 1997 was 0.09, for Jinja in was0.08, for Mbale 0.07, and for Mbarara 0.06. The average holding time for local calls according to UPTCrecords is 3.0 minutes and for IDD calls was 2.9 minutes. The overall telecommunication system isreportedly not optimised, with mismatches between trunking, switching and outside plant capacity.
2.2.3 Transmission System
A new digital microwave system links Mbarara and Kabale, and also links with the Kampala- Masaka-Mbarara digital microwave system carrying traffic to Tanzania, Rwanda and Burundi.
A Kampala-Jinja-Nairobi analogue microwave link carries domestic and cross-border traffic to Kenya.
The transmission network is primarily designed in a star configuration with direct routes emanating from themajor switching centres. Redundancy is provided on major but not all routes. UHF/VHF radio links andoverhead lines with carrier equipment (analogue multiplexing equipment) cover the rest of the country.
The Mpoma earth station is connected to the international gateway switch in Kampala via a 140 Mbps fibreoptic cable facility.
Much of the local cable network in the main switching centre areas was recently upgraded under a WorldBank project. This programme addressed most of the feeder and distribution cable needs in the mainswitching offices. However, outside the main switching centre areas, local line facilities often remain inpoor condition. Paper insulated cable is still used in suburban areas. Hence a substantial portion of thelocal cable plant is in urgent need of replacement.
The exchanges in rural areas are mostly manual and partially analogue and are linked to their transitexchanges with manual or semi-automatic circuits. These exchanges are connected to the transit centres byopen wire lines employing subscriber carrier systems or small capacity radio links. Many regionsexperience power problems, with commercial power not available at all, or only available during limitedhours.
2.2.4 Border Pay Phones
UPTC has installed pay phones in Kenya, close to the border, to allow customers in border communities tocall Uganda for only the price of a local call. The Kenya Post and Telecommunications Corporation hasdone the same in Uganda. Note however that this only works from designated pay phones, and that a call toUganda from a private phone next to the border to a phone in Kenya right next to the border will be routedthrough Kampala and Nairobi. The call will be charged at the national long distance rate (not theinternational rate, since the two countries are in the same telecommunity).
In the Pan-African Telecommunications Union (“PATU”) cost study it is noted that this type of “frontiertraffic” should not be counted as international traffic for accounting rate or other purposes (please seesection 4 for further details of this study).
2.2.5 UPTC Subscribers
At the beginning of 1997 UPTC had installed switching capacity of 78,632 lines, and 46,027 subscribers.Of these, 43,660 capacity and 32,696 subscribers were in the Kampala area.
The waiting list is reported in ITU statistics for 1996 as about 6,280. UPTC notes that the waiting list inKampala is about 900 and the typical waiting time is about 3 months, although this can go higher. Severalyears ago the waiting list was often up to two or more years

UGANDA
13
2.2.6 UPTC Operations
At the end of 1996 UPTC had about 2,600 employees, of which 700 were temporary. Of the 2,600, it isestimated that about 1,240 were directly engaged in telecommunications operations (as opposed to post),with about 70% of common staff doing telecommunications overhead work. This equates to a totaltelecommunications workforce of about 1,800, for an efficiency ratio of about 26 access lines per employee.
2.2.7 UPTC Challenges and Expansion Plans
UPTC sees its major challenges and plans as those set out in the Sector Policy Statement (for which, pleasesee section 2.1.1 above) :
• Improving teledensity in line with the target of 2.0 lines per 100 population. Demand over the next fiveyears is projected to be 300,000 lines by 2002 and that demand should be met. (Please note thatRingling’s ITU report states that if all demand is met by supply, and that if access lines, mobile phones,and pay phones are built out to meet demand, then “our demand forecast for Uganda anticipates thecombines service teledensity to increase from the 1997 level of 0.26 to 1.92 by 2006, very close to thetarget range of 2.0 outlined in the ministerial document.” )
• Improving call completion and fault recovery in line with Sector Policy Statement targets;
• The national network should be at least 75% digital.
• Maximum connection time for new applications should be two weeks in urban areas.
• New services should be added in areas such as electronic mail, paging, voice messaging, low cost datadistribution and cable distribution of image services.
• A new numbering plan should be introduced which promotes growth of new services and is fair tocompetitors.
Dr. Ringling’s study predicates various ambitious assumptions, including: that demand for access lines andmobile wireless service is met by the operators, that all calls are completed, that the economy continues togrow at a rate forecasted by the World Bank, that accounting rate declines are passed through to thesubscribers and that tariffs are rebalanced. If all these assumptions and conditions are met, the requiredinvestment will fund a rise from 49,000 access lines to 380,000 and meet potential demand for 84,300mobile subscribers by 2006. The cost for this will range from $1.1 to $1.4 billion USD for wireline and $89million to $106 million for wireless services. (Ringling employed the ITU regression model used by theNTT Consulting Group for the preparation of the 1993 UPTC Master Plan, updated to include the latestavailable economic data.)
Dr. Ringling also anticipates that demand for pay telephone installations will 33,000 by 2006, thus reducingthe average number of inhabitants per pay phone from the current 20,000 to 776.
A JICA-funded (Japanese International Co-operation Agency) master plan was undertaken by NTT in 1993,with a 15-year time horizon. But according to UPTC this has largely been superseded by informal changesand developments, and hence is not appropriate to use a reference document now. No similar formal masterplan now apparently exists, although particular projects have individual plans. Two major projects currentlyin the planning include a fibre optic ring around Lake Victoria, linking Uganda, Tanzania and Kenya; and adigital microwave transmission system from Kampala westwards to Fort Portal.
2.2.8 UPTC Financing of Future Expansion
Potential sources of funds to finance the ambitious expansion goals include self-financing, internationalsettlements, loans and privatisation.
Self-Financing. According to the Auditor General’s report of August 27, 1997, UPTC had a profit for 1995(July - June fiscal year) of 4.6 billion Shillings on a turnover of 49.2 billion Shillings and assets of 75.1billion Shillings. For 1996 the figure was a loss of 35.8 billion on a turnover of 49.9 billion and assets of98.4 billion. For 1997 it is informally estimated that UPTC made a very small profit of about 5 millionShillings. (For all these figures a conversion rate of 1050 Shillings to $1 USD is usable.) The large loss in1996 was apparently caused by a combination of lack of controls on a large number of cash transactions, andhigh non-payment by Ministries, parastatals and individual customers. Other major concerns with regard to
UGANDA
14
UPTC’s financial abilities include issues of pension liability and funding, and back tax assessmentsestimated and disputed at between 41.8 and 60 billion Shillings. Thus these figures raise the question ofwhether UPTC can attain its goals based on self financing.
Projecting or modelling future financial flows of UPTC in this uncertain environment would appear to bequite problematic.
International Settlements. For 1995, roughly 6% of UPTC’s annual turnover was accounted for by netsettlement payments (for which please see section 1.9 above).
International Loans. UPTC had seven loans with outstanding liabilities in 1996, to IDA (2 loans), theAfrican Development Bank, French protocols, the Korean project, a Spanish loan, and Intelsat. Securingadditional loans given the uncertain nature of UPTC finances could perhaps be problematic.
Privatisation. Under proposed legislation UPTC could be privatised in the next year or so. This wouldappear to be the most likely viable source of funding for major expansion of UPTC’s network.
2.2.9 Other Networks in Uganda
UPTC is far and away the dominant player in all telecommunications areas in Uganda. However, there aresome other enterprises worth mentioning. These include:
CelTel. This is a private GSM operator with close to 5000 subscribers. It operates in the Kampala and Jinjaareas and has been in operation since the spring of 1995.
StarCom. This private operator has three divisions: a trunked mobile radio network, an international datanetwork, and a pay phone system. There are about 6000 to 7000 customers altogether.
The trunked mobile radio system provides dial tone and access to the UPTC telephony system. Theinternational data gateway provides satellite-based access to foreign locations. The gateway is mounted onthe roof of the Sheraton Hotel and provides direct access overseas. Traffic through this gateway does notneed to pass through the UPTC network. The pay phone operation has about 100 pay phones, andtelecentres in Jinja and Mbarara.
Paging Operations. Several paging systems have been licensed. One is in operation and has beenoperational for a year.
Parastatal and Government Organisations. Uganda Railways Corporation, Uganda Electricity Board, andgovernment organisations such as the Uganda Police Force and Uganda Peoples Defence Force have andoperate their own private telecommunications networks. These are primarily radio networks, although UEBhas connected its Kampala offices with a fibre optic cable. There is no public discussion as yet of any ofthese networks providing public services or forming the basis of a Second National Operator.
NGOs. Non-governmental, non-profit organisations such as the United Nations have their own radiocommunications networks, primarily in the HF/VHF bands.
2.3 Overview of International Network
2.3.1 International Numbering Plan and its Consequences.
All countries in the east African telecommunity (Uganda, Kenya, Tanzania, Rwanda, and Burundi) share theheritage of the old East African Posts and Telecommunications Corporation, which broke up in 1977. Thishas resulting in interesting numbering plan and other consequences. Each country has its own three digitcountry code (++256 for Uganda). But calls within the five countries in the telecommunity (Uganda, Kenya,Tanzania, Rwanda and Burundi) do not require country code dialling. Only national long distance codes areused. Within these countries two digits are set aside for area codes. These digits are allocated as follows:1x, 2x and 3x for Kenya, 4x for Uganda, 5x and 6x for Tanzania, 7x for mobile in all three countries (with70xxxxx set aside for dialling Rwanda and 71xxxxx set aside for Burundi), 8x for other special such aspaging, shared by all three countries, and 9x for emergency numbers, shared by all three countries. An“escape code” of zero is used in Uganda before dialling locations in Kenya, Rwanda, Tanzania andBurundi.

UGANDA
15
After the two digit area code, up to six digits in Uganda are utilised for local exchanges and numbers. Mostnumbers in Uganda utilise all six numbers, although some have four or five.
The results of this heritage and numbering plan are interesting. All countries in the telecommunity treatcalls to other countries in the telecommunity as national long distance for purposes of dialling, not asinternational calls. Hence normal international tariffs are not applied. Data on cross-border intra-telecommunity traffic are not generally recorded, since national long distance pulses are lumped in withlocal pulses. So cross-border, intra-telecommunity traffic must be estimated.
All intra-telecommunity traffic is settled on a sender keeps all basis. (The only partial exception would be ifa microwave link from one country to the other in the telecommunity was down, and the backup was asatellite. Then the transiting administration would be paid a transit fee. But even then the terminatingcountry in the telecommunity would not pay a termination fee to the originating country. ) There is no transitcharge if a country in the community carries through traffic to another country in the community.
The lack of number blocks is starting to cause numbering problems in Uganda and Kenya. Uganda, withonly a 4x designation within the major countries in the telecommunity, is especially disadvantaged.(Rwanda and Burundi are also disadvantaged, with quite small numbering blocks.) This is particularly truesince Uganda is in the process of liberalising its sector faster than its large neighbours, and therefore needsmore numbering blocks for the different competitors entering the sector. Uganda, represented by theCommission, is considering various options for revising the numbering plan, including increasing the twodigit area code to three digits, abandoning the east Africa regional plan and use international dialling, andcontinuing the current system with the new second national operator being given unused area codes orsharing these codes with the dominant carrier.
2.3.2 International Network Outside East Africa
The UPTC international network links Uganda directly to several European, North American and Africancountries. Specifically, direct links have been established via satellite with the USA (AT&T, 2 Mbps, 30channels and MCI, 2 Mbps, 60 channels); Canada (30 channels shared by two carriers); the UK (BT, 2Mbps, 60 channels); Italy (1 Mbps, 16 channels); France (FT, 1 Mbps, 16 channels); Germany (DT, 512Kbps, 8 channels); Switzerland (512 Kbps, 8 channels); South Africa (512 Kbps, 14 voice and 1 datacircuit); Belgium (512 Kbps, 8 channels); and Sweden (Tele 2, 512 Kbps, 8 channels).
These links are carried by the Mpoma earth station, near Kampala, which is a Standard A Intelsat earthstation. This station has recently been upgraded and refurbished.
UPTC has been approached by various administrations and potential customers to act as a hub for the eastAfrica region, especially for traffic routing to Kenya and Tanzania. But it has yet to act on this suggestion,and UPTC staff have some doubts that this can or should be accomplished. This is apparently due to thehigh degree of co-operation between the three parastatal operators in the East African community (Uganda,Tanzania and Kenya), and the desire to avoid undercutting community partners.
2.3.3 International Network Within East Africa
UPTC also has direct microwave links (mostly analogue) via the Panaftel (Pan African TelecommunicationsSystem) network to Kenya, Ethiopia, Eritrea, Tanzania, Rwanda and Zambia.
Panaftel is used mainly for backup to satellite, for reaching the more distant countries. Figures for paidminutes for 1996 show that the northbound and southbound Panaftel routes had 106,667 total minutes, asmall 0.5% of the total 19,532,507 incoming and outgoing paid minutes for the country.
Within the east African telecommunity, microwave is used almost exclusively, although a satellite linkmight be used as a backup occasionally if a microwave link is down. Traffic to Kenya is routed over ananalogue microwave link southeast toward Nairobi. Traffic to Tanzania was routed until September 1997through Kenya along the eastern shore of Lake Victoria, but this traffic is now routed west around LakeVictoria via a new digital microwave system. This routing avoids having a third administration (Kenya) aspart of the system, improves reliability, is lower cost, and replaces analogue with digital service.
To reach Rwanda and Burundi, a digital microwave link heads southwest from Kampala, around LakeVictoria first to Rwanda and then to Burundi.

UGANDA
16
3. EVOLUTION OF INTERNATIONAL TELECOMMUNICATIONSENVIRONMENT
This section provides:
• An outline of the regulatory status of international services;
• An overview of trends in international traffic;
• An overview of trends in international accounting and settlement rates.
3.1 Regulatory status of international services
Currently, only UPTC is authorised to provide international voice telephony services. All international voicecalls are meant to be routed through UPTC’s gateway but it is understood that call-back services are beingoffered (please see section 2.2.9 above).
However, the second national operator will be licensed to provide international services, thus providing forcompetition between UTL (i.e. the corporate entity into which UPTC’s operating assets will be transferred)and the second national operator for the conveyance and termination of international calls.
Call-back is prohibited under regulations made by UPTC under the UPTC Act. This would not prevent theCommission from revisiting this prohibition and reversing it in the future.
Starcom (for which please see section 2.2.9 above) is authorised to provide public payphones and to operatean international data gateway. It is alleged that Starcom is using its international gateway and pay phones tooperate a sophisticated call-back voice system which bypasses UPTC. This is allegedly in violation ofStarCom’s licence. Starcom’s prices for this service undercut UPTC by 40%, until the recent September 1UPTC price drop. This matter is being investigated by UPTC.
CelTel may only provide international services through UPTC’s gateway. It is not able to establish andoperate its own international gateway.
It is understood that call-back is offered in the payphones located in certain hotels. In addition, internationaldialling is offered from call centres. UPTC is currently investigating this matter.
No licences authorising the provision of International Simple Resale services in Uganda have been granted.
The provision of voice over the Internet is not an issue in Uganda as yet. The five existing Internet serviceproviders (who were licensed by UPTC) do not currently control sufficient capacity to support the provisionof Internet voice telephony.
The telecommunity of Uganda, Kenya, Tanzania, Rwanda and Burundi is worth mentioning in the context ofinternational services. The telecommunity, which provides for national long distance rates between thesecountries, is not a legal requirement but an example of regional co-operation.
3.2 Trends in international telephone traffic and prices 1990-1996
3.2.1 General Price Trends
Before 1990 outgoing tariffs were quite low. On July 1, 1990 a sharp price increase was instituted, to $7.50per minute for major destinations. On July 1, 1992 this high rate was dropped to $5.00/minute for alldestinations (organised into three bands of destination countries outside east Africa). On July 1, 1994 therate was dropped from $5.00 to $3.00 per minute for all bands. On September 1, 1997 rates were againdropped, from $3.00 to $1.50 per minute. (This latter figure is 1800 Ugandan Shillings for Band 1 countriesincluding the US, Canada and most of Europe; all prices are levied in shillings but the UPTC thinks in dollarterms for comparison purposes and to see if it is in line with world trends.)
The recent 50% price drop was driven by several factors. First was a 1996 study under the auspices of thePan African Telecommunications Union of the cost of call termination. According to UPTC staff, this studyfound that the cost of termination for the six countries in the east Africa region, including Uganda, wasabout 60 cents US per minute, with most countries clustered closely around this figure. This study was doneon a fully distributed historic cost basis. This meant that international rates should be set at a target of about

UGANDA
17
$1.50, since this would yield inpayments to Uganda of about $0.75 per minute, $0.15 above the cost of$0.60. This yields a profit of about 25%, substantial but not outrageous.
The second factor driving the large price drop was world industry trends and international politicalpressures, observed by Uganda.
The third factor was the desire to remain competitive within the east African telecommunity, which do notcharge international rates between each other, but which negotiate external international settlementsseparately. UPTC feels that if its rates remain higher than others in the telecommunity, Uganda may losetraffic to a hub in the region.
The fourth factor was the pressure from call-back. Although call-back is prohibited in Uganda, losses arefairly substantial, and are estimated by UPTC at about $140,000 USD per month or more, prior to the recentSeptember 1997 price drop. After September UPTC estimates it will still lose about $70,000 per month tocall-back, but anticipates that the lower rates will discourage customers from attempting to use call-back.UPTC alleges StarCom was providing call-back via an international data gateway, with price discounts of40% off UPTC’s pre-September 1997 rates. (Internet telephony is not yet active in Uganda.)
3.2.2 Detailed Trends in Settlement Rates
Negotiation Principles Utilised for International Settlement Rates
UPTC is constantly renegotiating agreements with the 220 plus administrations around the world. Innegotiating these agreements UPTC follows these principles:
First, avoid drastic price changes that will shock customers or other administrations.
Second, if the need for a substantial price change is identified, make several smaller phased changes ratherthan one big change.
Third, keep prices for major destinations, such as the US and Japan, roughly in line.
Fourth, in the latest price change, use cost-based analysis (especially the recent PATU study) to set prices.
Fifth, reflect world and east African telecommunity pricing trends.
Sixth, in the latest price change, reduce and try to eliminate cross-subsidies between services. UPTCacknowledges that prior to September 1997 it, like many operators in developing countries, had substantialsubsidies from international to local and to national long distance calls. There were also subsidies fromnational long distance to local calling. The September 1997 price changes attempted to eliminate thesecross-subsidies. There was not a major cost study of all services to determine the true cost of service, butthe PATU study of call termination costs was used, and the impressions of management of the relative costsof service was employed. UPTC feels that it has now approximately aligned prices with costs of service forinternational, national and local service, although senior UPTC management strongly support the concept ofan in-depth cost analysis of Ugandan and other developing country telecommunication network costelements, to elevate the level of debate about collection and accounting rates.
Seventh, negotiate at least three and preferably seven to ten agreements with different routings to reach eachdestination, both incoming and outgoing. This creates price competition and allows for alternate routing if aparticular route goes out.
AT&T USA Direct
Since 1992 UPTC has had two AT&T USA Direct telephones installed, at the main post office and at themain customer service office in Entebbe. These phones are the only location in Uganda from which AT&TUSA Direct, the only country direct service with a foothold in Uganda, can be obtained. These phones weredesigned as an experiment, but the experiment has been prolonged since Kenya next door cancelled itscountry direct services and Uganda is waiting to see what will happen in the region. During 1996 Ugandahad full USA Direct service but this was cancelled shortly after Kenya cancelled its similar service. UPTCfigures show that the two experimental USA Direct phones generated 70,208 outgoing minutes in 1996 and42,355 incoming minutes. This compares to the total 3.0 million incoming and outgoing paid minutes usingthe 30 AT&T satellite channels to and from Uganda.
UPTC plans to introduce full USA Direct and other country direct services into Uganda in 1998.

UGANDA
18
3.2.3 International Traffic Trends
Until 1990 Uganda had no direct international dialling, and all calls were manually connected and set up byoperators. During this manual period Uganda had substantially more outgoing than inbound traffic.Substantial fraud existed during this period, with many customers using the service then avoiding payment,despite the low tariffs. With the introduction of direct dialling in 1990 and the raising of internationalcalling rates, the calling trend has reversed, so than now incoming exceeds outgoing by a 2.4 to 1 ratio (13.7million to 5.8 million minutes for 1996). The figure for 1997 through October is 2.7 to 1, so the trend iscontinuing.
Estimates of Current Traffic within East Africa
As mentioned above, traffic within the five east African countries is not recorded separately and estimatesmust be used. UPTC states that the circuit method used by UPTC and the ITU yields acceptable estimates.This simply takes the number of working circuits which are assumed to be fully utilised (which seemsreasonable given local conditions in Uganda) times 60,000 paid minutes per year. The table below showsthe average number of working circuits incoming and outgoing to the other countries for a six month periodending in December 1997, and the resulting estimate of minutes per year.
Table 3.1: Incoming and outgoing circuits
DestinationCountry
Incoming or OutgoingCircuits
Average Number ofWorking Circuits
Est. of Paid Min/ Yr.(Avg. No. Circuits x 60k
min.)
Kenya Outgoing 68 4,080,000Incoming 65 3,900,000
Tanzania Outgoing 25 1,500,000Incoming 35 2,100,000
Rwanda Outgoing 12 720,000Incoming 13 780,000
Burundi Outgoing 7 420,000Incoming 10 600,000
TOTALOUTGOING
6,720,000
TOTALINCOMING
7,380,000
TOTAL TRAFFIC 14,100,000
Source: UPTC
Note various trends here, from this admittedly crude analysis:
• Kenya is by far the largest traffic partner. It’s incoming and outgoing traffic with Uganda are reasonablybalanced, so the SKA approach is probably little different from a 50-50 settlement rate. Rwanda issimilar.
• Tanzania and Burundi send substantially more traffic incoming to Uganda than Uganda sends to thesetwo countries. Therefore the SKA system harms Uganda, compared to changing to a 50-50 negotiatedsettlement rate.
Data on circuits prior to 1997 were not available at the time of writing, so even this simple analysis couldnot be performed in time series.
A detailed analysis of international traffic patterns is attached at Annex I.
3.2.4 Current National and Local Traffic
Ringling’s study was unable to determine current national and local traffic based on actual data. Instead,UPTC and Ringling estimated that local calls account for about 84% of traffic volume, national calls,

UGANDA
19
including east Africa, account for 14% of all traffic volume, and international outbound traffic reached 2%of all the entire traffic volume.
3.2.5 Traffic Forecasts
Dr. Ringling’s study of traffic includes a forecast which assumes that demand for access lines and mobilewireless service is met by the operators, that all calls are completed, that the economy continues to grow at arate forecasted by the World Bank, that accounting rate declines are passed through to the subscribers, andthat tariffs are rebalanced. Under these possibly ambitious assumptions, the following traffic forecasts aremade, mostly focused on the “potential traffic” that could be realised:
• Potential outbound international traffic could reach 35.5 million minutes in 1997 under Ringling’sbaseline scenario, compared to anticipated actual traffic of about 7.0 million minutes under steady stateconditions. Note that the actual figures for outbound international (non-east Africa) traffic were 5.8million for 1996. For 2001 and 2006 Ringling anticipates outbound traffic to increase to 55.5 and 92.5million minutes respectively.
• Potential inbound international traffic for 1997 could be as high as 80.0 million minutes under Ringling’sassumptions. (Actual 1996 volume was 13.7 million minutes.) By 2001 and 2006 Ringling estimatespotential volume at 111.6 and 175.9 million minutes respectively.
• Ringling estimates actual national call minutes at 49.0 million in 1997 and 40.7 million minutes in 1996;if his assumptions were met he estimates potential minutes for 1997 could be 248.2 million. For 2001and 2006 he estimates potential volume could reach 389.0 and 647.7 million respectively.
• Ringling estimates 1997 actual local traffic at 290.0 million minutes and 1996 at 244.0 million minutes,whereas potential volume under his assumptions could reach 1.5 billion in 1997. By 2001 he anticipatesthat potential traffic could surpass 2.3 billion minutes and for 2006 the figure could be 3.8 billion.
• Ringling notes that even these dramatic increases in volume would not increase actual traffic per accessline unreasonably, with traffic per access line increasing from an actual of 0.07 Erlangs in 1997 to apotential traffic range of 0.07 to 0.08 Erlangs in 1997, and 0.08 to 0.10 Erlangs in 2006. The master planprepared for UPTC in 1993 by NTT anticipated an increase in traffic per line even higher, of 0.7 in 1994rising to 0.14 in 2010.
If all these assumptions and conditions are met, the required investment will fund a rise from 49,000 accesslines to 380,000 and meet potential demand for 84,300 mobile subscribers. The cost for this will range from$1.1 to $1.4 billion for wireline and $89 million to $106 million for wireless services.
A more pessimistic and perhaps realistic forecast of traffic is possible using recent actual figures for trafficvolumes of paid minutes. The table below shows the actual figures for 1991-96 and a straightline projectionfor 2006, assuming a continuing rate of increase of 26.4% growth per year. The resulting figure for 2006under this calculation is 203 million minutes, more than an order of magnitude lower than Ringling’s 3.8billion minutes.
Table 3.2: Incoming and outgoing international traffic
Year Actual O/G Paid Min.(millions)
Actual I/C Paid Min.(millions)
Total Min.(millions)
1991 4.2 4.2 8.41992 3.3 5.3 8.51993 2.7 6.9 9.61994 3.5 10.4 13.91995 4.9 12.3 17.21996 5.8 13.7 19.5
2006 (projectedat 26.4% CAGR)
203.0
Source: UPTC

UGANDA
20
Note the trends in incoming and outgoing calls shown in the table. While incoming and outgoing wereexactly balanced in 1991, incoming has moved to exceed outgoing by a ratio of 2.4 to 1. Possibly with therecent drop in collection charges for outgoing calls, this trend will slow.
3.2.6 Investment Cost Per Line
Dr. Ringling, in his recent ITU report, uses a modified 1994 ITU Sub-Saharan Africa figure of $5,500 perline as being appropriate for Uganda’s typical cost per line for new construction. He modifies the figure to$5,000 per line currently, declining 10% per year. UPTC estimates this figure at about $4000 to $5000 perline.
3.2.7 Pricing of Services
Pricing under the colonial administration was done on a distance basis, with 8 distance bands of prices. Thishas changed over time to the following multipart system (for customer dialled calls, standard time of dayrates):
Note some interesting highlights of this system:
• The East African countries generally operating under the SKA system have call prices about 2.5 timesthe national rate, but less than half the international rest of world Band 1 rate.
• COMESA countries outside East Africa, which settle using the traditional accounting rate system, aregiven a discount of about one-sixth off the international rest of world Band 1 rate.
• The countries of most interest and most vocal about accounting rate problems (such as the US) now(since September 1997) have a relatively low $1.50 collection rate charge. (It is this charge that ties intothe cost based PATU study now used by UPTC in targeting its pricing.)
• UPTC states that Band 3, the high band charge almost twice the Band 1 rate, is targeted especially forcountries which refuse to drop their collection and accounting rates.
• Collection rates for Band 1 countries have dropped by about 50 percent in dollar terms, from $3 to $1.50,effective September 1997.
• Band 2 and 3 countries collection rates have also dropped very substantially, effective September 1997.

UGANDA
21
Table 3.3: Domestic and International tariff schedule and chnges
Call DestinationCategory
Duration(Sec/75 Shilling Unit)(From Sept. 1, 1997)
Charge Per Minute
(Ug. Shillings, excludingVAT)
(From Sept. 1, 1997)
Duration per UnitFee of 50 Sh.; or
Charge PerMinute (Shillings)(1995—9/1/97)
Local (within 1exchange area)
60 Sec. 75 Sh. 30 Sec.
National (betweenexchanges insideUganda)
18 250 Varies by distancefrom 15 to 4.28 sec.
PCN (Cellular) 7 650 --East Africa & KageraBasin Org. (Uganda,Tanzania, Rwanda,Burundi)
7 650 1000 Sh.
COMESA (outside EA& KBO but inc. S.Africa)(Angola, Botswana,Comoros, Djibouti,Eritrea, Lesotho,Madagascar, Malawi,Mauritius,Mozambique, Namibia,Seychelles, Somalia, S.Africa, Sudan,Swaziland, Zaire,Zambia, Zimbabwe)
3 1500 2000 Sh.
International (Rest ofWorld) Band 1 (high traffic,low acting ratecountries) (includes US,UK, Germany, Belgium,Canada, Sweden,France, Switz., Iran,etc.)
2.5 1800 (about $1.50 USD) 4000 Sh. (about $3at then exchangerates)
Band 2 (mod.Traffic countries) (incl.Austria, China, Czech,Israel, India, Russia,Saudi, Niger, Lebanon,Kuwait, Jordan, etc.)
1.8 2000 (about $1.67) 4000 Sh. (about$3.00)
Band 3 (low trafficand/or high acting ratecountries)(including W.Africa Francophonecountries, Pakistan,Liberia, Iceland, ElSalvador, Vietnam, etc)
1.5 2350 (about $1.96) 4000 Sh. (about$3.00)
Inmarsat - 9000 --
Source: UPTC
3.3 Trends in Accounting and Settlement Rates
Recall that Uganda generally uses a Sender Keeps All system with other East African countries. Thereforethis review will cover only agreements with non-East African countries, or agreements used as backups viasatellite to the SKA--East Africa system.

UGANDA
22
This section outlines what the Accounting Rate Exhibit, (the “Exhibit”) at Annex II to this Report,represents.
The attached Exhibit shows key elements of accounting rate agreements with major traffic partners ofUganda, as well as with other countries of interest in the ITU/CTO/EU case study effort.
The data in the Exhibit were obtained from UPTC’s file on accounting agreements, which was a five inchthick compilation of all the typed summaries or printouts of all the 2000 plus accounting agreements thatUPTC maintains with the 220 plus telecom administrations around the world.
The UPTC compilation shows agreements dating back to the early 1980s, with comprehensive listingscompiled in 1992. Hence this Exhibit and analysis focuses on trends from 1992 through 1998. But it isclear from reviewing the compilation and interviewing staff that in the 1980s and early 1990s very littlechanged in accounting rates, and early 1980s agreements were often used well into the 1990s. Hencealthough the Exhibit covers only 1992 through 1998, in a sense this Exhibit shows almost 16 years ofhistory.
The Exhibit shows the year in which the accounting rate agreement was utilised, the country (and carrier ifthe country has more than one), the total accounting rate and the currency used (SDRs are Special DrawingRights, GFC are Gold Francs, USD are US dollars), and the traffic type. This latter is generally “bothways,” meaning that inbound and outbound traffic is covered, but occasionally it is incoming (IC) oroutgoing (OG) only, or the information was not available (NA). The Exhibit also shows the type ofaccounting as “cascade” or “direct” (CA or DA). Cascade accounting means that if, say, Uganda paysAT&T for transiting calls to Albania, then UPTC will pay AT&T for the AT&T transit portion as well aspaying AT&T for the Albanian destination charge, and AT&T will keep its portion and settle the destinationcharge with the Albanians. A direct accounting in this example would mean that UPTC would settledirectly with AT&T for its transit charge, and would settle directly with the Albanians for the destinationcharge. These settlements are done quarterly. Most administrations settle promptly but some do not paytheir accounts for months or years.
The Exhibit also shows how much the originating administration retains of the total accounting rate amount.It then shows for some recent agreements the “confidential transit charge.” In the last several years anumber of major transiting organisations, including MCI, AT&T, STET and others have had “official”transit fees (also shown in the Exhibit) and confidential fees that are not publicised but appear to be attemptsto entice other administrations to use their services.
The Exhibit then shows the transiting administration. Here “direct” generally means that there is notransiting administration and hence no transit fee, although in a few cases a direct provider apparentlycharges a confidential transit fee. Next is shown the destination charge, then when the agreement becameeffective, and whether the agreement was used during the year concerned (the first column) as a vehicle forrouting major traffic (MT), or only as a backup traffic (BT) vehicle.
Note that UPTC tends to keep in force ALL agreements negotiated over the last 20 years, even if the ratesare quite high, and hence has over 2000 agreements in place. This is because UPTC uses these olderagreements as backups, in case the links used for the newer agreements fail and alternate links must be usedtemporarily. In this way traffic is sent through, although UPTC does not make as much money or couldeven lose money on the transaction.
Note also that in the original source documents there are occasionally two transiting administrations and twotransit charges. For example, in sending traffic to Angola, UPTC links first to London via satellite, then toLisbon, then to Angola. This is fairly rare, and none of the selected countries in the Exhibit have such anarrangement.
3.3.1 Detailed trends in International Accounting Price Rates
Moving now to a discussion on the trends in accounting rates with various administrations, we can note thefollowing from the Exhibit:
• With regard to the USA, UPTC has generally used AT&T as its partner, although Sprint got a majorshare of traffic in 1996/7. MCI has been used as a backup provider. For example, in 1996 MCI had anarrangement with UPTC and British Telecom in which UPTC and MCI each received $0.325 and BTretained $0.55 as a transit fee. From 1992 through 1995 the accounting rate with AT&T was $1.50 with

UGANDA
23
the usual 50-50 split. The accounting rate with AT&T dropped at the beginning of 1997 to $1.00. Thusthe arrangements with the US follow the usual 50-50 split of accounting rates, with rates dropping about30% ($1.50 down to $1.00) during the 1992 to 1997 period.
• The agreement with the UK (BT) dates back to 1982 and was still the major traffic agreement in 1992.This agreement was the usual 50-50 split, of 1.20 SDRs. This rate went up to 1.40 SDRs in 1995 anddown to 1.00 SDRs in 1997, for a drop over the period of about 17% from the beginning to the end of theperiod.
• For Canadian traffic, at the beginning of the period, in 1990 through 1993, traffic was transited throughGermany with a total accounting rate of 1.00 SDRs, with 0.29 going to the originating and 0.29 going tothe terminating administrations, and 0.42 SDRs retained by the German administration. In 1995 a directrelationship was negotiated, with the rate dropping to 0.70 SDRs split 50-50, dropping further to 0.40SDRs by 1997. Thus rates dropped a total of 60% during the 1990/2 to 1997 period.
• For Indian traffic, from 1989 through 1992/3, UPTC transited traffic through Nairobi, had a totalaccounting rate of 1.66 SDRs, and paid Kenya 0.42 for this transit fee and split the remainder 50-50 withthe Indian telco. By 1997 rates had dropped about 23%, to 1.28 SDRs, with Startec taking a small 0.18transit fee and the balance still split 50-50.
• For South African traffic, from 1991 through 1993, traffic was transited through Germany at a totalaccounting rate of 1.96 SDRs with the Germans retaining 0.40 and the balance split 50-50 in the usualway. Rates dropped throughout the period, so that by 1997 the total accounting rate was down 49%, in adirect relationship with the South African administration, no transit fee, and the usual 50-50 split.
• Traffic for Japan began the period at a rate of 1.60 SDRs, transited through Nairobi at a charge of 0.42and the usual 50-50 split of the balance. In 1996 a new arrangement with STET was signed lowering theoverall rate officially to 1.30, with the Italians officially retaining 0.390 as a transit charge but actuallyand confidentially charging 0.290. (Note that while the official rate was 1.30, the actual rate was the sumof 0.455 plus 0.290 plus 0.455, or 1.135) In 1997 the Italian administration lowered the confidentialtransit charge to just 0.120, while retaining the official transit charge at 0.390. Thus the total actualaccounting rate at the end of the period was 1.03, a drop of 36% from the 1.60 at the beginning of theperiod. The usual 50-50 origination to termination split continued throughout the period.
• Accounting rates with Germany declined by a dramatic 69% during the period, while rates with Francedropped by 49%.
• Accounting rates with various low traffic volume administrations show interesting and perhaps non-rational patterns. For example, traffic with Lesotho has utilised the same BT arrangement of 0.46 transitfee from 1989 through the present, despite the fact that backup agreements with much lower transit feeshave been in place since 1995 with MCI. This appears to violate one of UPTC’s stated goals ofminimising transit fees. The likely explanation is that the traffic volume is low enough that it is not afocus for UPTC staff. Thus here accounting rates did not fall at all. A similar example is the Bahamas,where throughout the period accounting rates remained officially at $3.55 USD, in an arrangement withAT&T. While AT&T did lower its official transit fee in 1996 to a confidential 0.24 from a previousofficial charge of 0.48, thus lowering the overall real accounting rate to $3.31 (1.535 plus 0.24 plus1.535; a drop of 7%), it is curious that UPTC did not choose MCI, which offered a total rate of $2.534USD ($1.81 times a conversion rate of 1.4). Perhaps here UPTC was minimising the transit fee ($0.24for AT&T vs. $0.308 for MCI (0.22 times 1.4 conversion)).
• With Mauretania a different but similar pattern emerges. Throughout the period a high cost 9.00 GFCarrangement transiting through France with FT retaining 1.30 has been utilised. This is true despite thefact that since 1995 a backup agreement with MCI could have provided slightly lower accounting rates of8.88 GFCs (2.94 SDRs times a conversion rate of 3.061) and (in 1997) a low confidential transit fee toMCI of 0.67 GFCs (0.22 times 3.061). Here UPTC staff stated that they are intentionally keeping rateshigh with Francophone West African countries which refuse to lower their rates. By switching to MCI,however, UPTC could lower its transit fee costs while keeping overall costs about the same.
• For Sri Lanka, Colombia, Switzerland, UAE, Italy, Sweden, Netherlands, Denmark and Egypt the mainstory is similar: official accounting rates dropped substantially during the period, while they dropped

UGANDA
24
even more in some countries when confidential, low transit charges are taken into account. For example,in Sri Lanka accounting rates were 2.70 SDRs at the beginning of the period with BT taking 0.44 for atransit fee; by the end of the period official rates had dropped 39% to 1.66, and real rates had dropped by43%, to 1.53, when a low confidential charge of just 0.22 to MCI is taken into account. In Italy ratesdropped 80%, while in the Netherlands rates dropped 86%.
• For Rwanda, an agreement with Kenya is used as a backup to the main SKA system; this rate hasremained at 5.00 GFC throughout the period. The second backup is a route through Paris where the totalcharge is the same but FT retains 1.30 for the transit charge.
• For Belgium, rates have remained the same at 1.96 SDRs from 1989 to the present.
• For China, rates have officially not dropped perceptibly, but when the confidential transit charge is takeninto account, then rates have dropped from 9.00 GFCs to 8.17 GFCs, a drop of 9%. (1.275 plus 0.12 plus1.275, times 3.061, equals 8.17 GFCs.) The story is similar in Pakistan, where official rates have notdropped at all from 8.57 GFCs (2.80 SDRs times 3.061 conversion rate equals 8.57 GFCs for 1997), butunofficial, confidential rates have dropped to 7.74, a drop of 10% over the period.
Summarising the main trends discernible from this detailed analysis, it appears that the lead stories are asfollows:
• Accounting rates dropped in all high traffic arrangements over the period, sometimes quite substantially(up to 69%).
• Accounting rates dropped in most low traffic arrangements, with some exceptions such as FrancophoneWest Africa and Belgium.
• Transit charges also generally dropped, often substantially, during the period. Confidential transitcharges were used in a number of low volume arrangements to lower accounting rates more than was firstapparent.
• The usual 50-50 split of termination and origination charges was virtually always retained.
If one assumes that current trends will continue into the future, then it appears that accounting rates forUganda will continue to fall of their own accord, even absent additional pressure from other parties.
3.3.2 Trends in Non-East African International Traffic
Annex I provides data on the major traffic partners with Uganda for the period 1990 through 1996. Thenumbers in the exhibit refer to paid minutes. Note that these data do not cover East African partners in thetelecommunity of Tanzania, Kenya, Burundi and Rwanda. The only exception to this is a very small amountof traffic to Burundi routed via a satellite backup link, but this amount was so small as to be insignificantand is not shown separately on the exhibit. (This traffic is lumped in with the “other” countries’ traffic.Traffic partners are listed in the order of their traffic volume, as of 1996.
Reviewing the data contained in Annex I, we can discern the following trends:
• The US and UK constituted about 56% of the traffic at the beginning of the period and retained about54% of the traffic at the end of the period. The US now has somewhat more traffic, while the UK wasthe leading partner at the beginning of the period.
• Incoming traffic substantially exceeds outgoing traffic for most countries in 1996. However, there areexceptions to this rule, including India, Denmark and Egypt.
• Total incoming traffic was less than outgoing for 1990 and was about equally balanced in 1991. Therewere exceptions to this trend, however, including the US, where incoming exceeded outgoing in bothyears. The following countries had greater outgoing than incoming traffic for at least 1990 and 1991:UK, India, Canada, Japan, Italy, France, UAE, Zimbabwe, Austria and Egypt.
• Belgium, which kept accounting rates the same throughout the period, had traffic stay about balanced to1994, then incoming began to exceed outgoing.
Total traffic grew 125% over the period, but incoming represented the large portion of that growth, both intotal and for most traffic partners.

UGANDA
25
3.3.3 Price Elasticity of Demand
Price elasticity of demand is the percentage change in quantity demanded divided by the percentage changein price. For Uganda it is possible to make three (widely) varying estimates of price elasticity, as shown inthe exhibit below. (Note that these prices are in USD and apply to all outgoing calls to non-East Africancountries.)
Table 3.4: Changes in international tariffs, 1992, 1994 and 1997
DATE OF PRICECHANGE
JULY 1, 1992 JULY 1, 1994 SEPT. 1, 1997
Original Price $7.50/min USD $5.00/min $3.00/minNew Price $5.00/min $3.00/min $1.50/min% Price Change -33% -40% -50%Period Measured forVolume
July 1, 1990 to June 30,1992vs. July 1, 1992 to June 30,1994
July 1, 1993 to June 30,1994 vs. July 1, 1994 toJune 30, 1995
July & Aug 1997vs. Sept & Oct 1997
OG Min, Pre PriceChange
8,547,993 2,730,224 1,055,168
OG Min, Post PriceChange
5,511,818 4,410,694 1,143,751
% Min VolumeChange
-36% +61% +8%
%Quantity Change/%Price Change
-36/-33 = 1.09 61%/-40% = -1.53 8/-50 = -0.16
Source: Case Study
Here we see that in July 1992 the price dropped substantially but the volume also dropped, an unexpectedresult. This may be due to prices being still so high that most consumers continued to use an informal callback system, that other countries dropped their prices more and thus the differential encouraged incominginstead of outgoing calls, and/or due to other exogenous factors not identified. (Two years pre and post dataare used here, but the result is about the same if one year of data is used.) One other possible explanation isthe poor economy in 1992, when GDP overall dropped to its lowest point in recent years, GNP per capitadropped from $260 to $200, there was a spike in inflation to 54.5 percent, and total consumption per capitadropped from $195 to $163. All this could have depressed outgoing call volumes.
In July 1994 the price again dropped substantially, but this time volume in the year following the changewent up, showing a price elasticity of -1.53, an elastic result in the expected direction.
In September 1997 the price again dropped substantially, but only two months of data after the price changeare available. These two months compared with the previous two months show a modest volume increase.However, the price change was only moderately advertised and it is thus unreasonable to expect the volumeto change rapidly.
These data are thus rather confusing, showing one major change in the “wrong” direction (in constantdollars, but possibly somewhat in the “right” way in local currency) , one modest change in the “right”direction, and one elastic change in the logical direction. In using these elasticity figures we will assumethat the elasticity curve is downward, normally curved and elastic, and will use the -1.53 figure in anycalculations. (This figure is generally in line with Booz•Allen research in Latin American in 1992-1994,where it was estimated by expert analysis that price elasticities for international long distance ranged from -0.6 for the high income segment of the population to -1.8 for the majority, poorer population.) However, thereader should note that the two other elasticity results for Uganda do cast some doubt on this -1.53 figure.
3.3.4 Telecommunications indicators
Data in relation to the ITU telecommunications indicators is set out in Annex III.

UGANDA
26
4. COST EVALUATION OF INTERNATIONAL TELECOM SERVICES
UPTC has no cost accounting system that would allow ready analysis of the true cost of network elements,services, and call termination and transmission. However, over the course of the last two years UPTC hasparticipated in a working and study group organised by the PATU.
The PATU group commissioned a study of international calling, focusing on the “average annual costs percircuit, per minute, for telephone and also telex traffic.” The cost method looks at investment costs, annualcharges resulting from investment, annual cost of maintenance, annual operating cost, and annual cost ofbuildings. The study does not look at forward looking or marginal costs, but focuses on current operatingcosts and capital historic costs, with capital costs distributed over the useful life of the purchase. The studydoes not distinguish between costs of bringing calls from the border to the international switching centrefrom ISC costs, but lumps these together. The questionnaire provides little guidance on how to calculatenational extension costs, but does require a figure be submitted. Overhead costs are not broken outseparately throughout the questionnaire.
The study utilised a questionnaire distributed to Uganda, Kenya, Zimbabwe, Zambia and Ethiopia. Thestudy itself is not obtainable in Uganda, but the Uganda filled in questionnaire is. UPTC staff used thisquestionnaire and its results in targeting recent international settlement agreements. However, seniormanagement states that much more detailed studies are needed before such data can be usefully employed innegotiating international agreements with other administrations.
Highlights of this questionnaire as completed by UPTC include the following:
• The reference year is 1996; the monetary unit used is the SDR, calculated at GFCs to the SDR and 1SDR to $1.20 USD for 1996 (1 SDR to $1.40 USD for 1997).
• Annual inflation is estimated at 9% since 1992 but telecom sector inflation is estimated at just 6%.
• For the earth station annual amortised costs are estimated at 1.14 million and annual operating costs areestimated at 1.09 million, for a total cost of station of 2.23 million.
• The station has 248 telephony circuits. Remuneration relating to the space segment, annually, per halfcircuit, is 1.078 million.
• Average construction and installation costs (initial investment) of an international switching centre foreach international telephone circuit in use is 25,394. A useful life of 10 years is assumed. Averagenumber of minutes of call traffic handled per year per international telephone circuit in use is 61,258. Nosummary of international switching costs per minute is given.
• Most interestingly, the cost of the national extension for telephony is estimated at 0.5 per minute. (Thiswas equivalent to $0.60 USD at the time of doing the study, and was used by UPTC as a target fornegotiating recent international settlement agreements.) Unfortunately, no details are available on howthis figure was arrived at.
No other cost data appear to be reasonably forthcoming at this time. UPTC senior management desire that adetailed cost study be conducted in the future.
Given the results of this study, UPTC management feel that their international, national and local prices arenow roughly in line with costs, although they are eager to make adjustments based on more detailedanalyses.
As described, very limited data are available from UPTC on costs. However, it may be possible to derivesome indicative costs (in cents, converted from SDRs) per minute for at least the satellite/internationalgateway/external links portion, using data from the PATU Uganda questionnaire, as follows below. Thequestionnaire unfortunately does not state what amortization period is used, only that the costs areannualized to one year. Two different numbers for allocable satellite minutes are used, one estimated fromthe questionnaire and one actual figure from UPTC printouts.
The result is an estimated cost for the satellite links/earth station portion of the costs of about 17 to 21 centsper minute.

UGANDA
27
Table 4.1: Indicative Analysis of Satellite Links Costs in Uganda
Item (From UPTC) Period in Years Cost in USD
Capital Items, AnnualizedAnnualized Land Costs 1 $21,540Annualized Bldg. Costs 1 505,264Annualized EquipmentCinteosts
1 1,068,917
Subtotal $1,595,721
Operating CostsOperating Staff 1 $962,224Power, Water & Fuel 1 125,206Maintenance 1 38,565Bldg. Maintenance 1 31,440Space Segment 1 380,264Subtotal $1,537,699Grand Total Costs $3,132,420 # of Circuits 248Min. per Circuit 61,258Est. Min (Circ.x Min/Circ) 15,191,984Cents Per Min ($Costs/Est.Min) 20.61996 Total OG+ICnon-EA Minutes 18,350,049Cents Per Min($Costs/1996 Min) 17.1
Source: UPTC
For the international switching element of Uganda’s international services components, which was notseparately addressed in the PATU study, an indicatvie cost may be derived by adopting the FCC TariffComponent Price (“TCP”) mechanism. On this basis, a figure of $0.048 could be used, on the basis thatUganda is a low income country.
As described above, the national extension element has been estimated by Uganda, in its response to thePATU study, as $0.60. It is not clear how this figure was derived.
The total component cost (taking the lowest estimate of international links) on the basis set out above wouldyield a figure of $0.80 approximately.
In seeking to verify these indicative costs (other than by way of comparison with the results achieved in ourLesotho study), we note that Uganda was not included in the FCC TCP work undertaken for the purpose ofdetermining benchmark settlement rates. Two other African countries were considered by the FCC, i.e.Kenya and South Africa, the results of which are set out below.
UGANDA
28
Table 4.2: FCC TCP estimates for African countries
COUNTRY International transmission International switching National extension
Kenya $0.255 $0.048 $0.123
South Africa $0.052 $0.034 $0.083
Uganda $10.171 $0.048 $0.60
Source: FCC
On this basis, the total cost of the components of an international call in Kenya would be $0.42approximately. In South Africa, the total would be $0.17 approximately.
A comparison with Kenya may be helpful in practice given that both Uganda and Kenya are part of the EastAfrican telecommunity. The Uganda total international component price is significantly higher than thetotal for Kenya, although it would be interesting for comparison purposes to determine what figures Kenyadisclosed in the context of the PATU study.
The difficulty in arriving at estimates and in comparing those estimates even to equivalent countriesindicates the flaws in both the TCP method and the cost data available to UPTC.

UGANDA
29
5. SCENARIOS FOR CHANGES IN THE INTERNATIONAL ACCOUTNINGSYSTEM
5.1 Revenue Projection Model: Structure
To explore various scenarios involving changes in accounting rates, a revenue projection model was createdfor Uganda international settlements. This model had the form of an equation, as follows:
Σ IRn = [(POC-OGn) (POGMn)] + [(PTCn) (PIM0n] + [(UCCn - UARn) (POGMn)] +[(POGM-EAn) (CR-EAn)]
Where:
Σ IRn = International revenue from all sources in year n, summed across all Eat African andnon-East African countries
POC-OGn = Projected origination charges for outgoing calls from Uganda in year n (where POC-OG is varied by scenario assumption)
POGMn = Projected outgoing minutes from Uganda in year n for non-East African countries(where this is projected by taking volume in the base year (an average of 1995 and1996 data) times a factor for the price elasticity of the assumed collection charge inUganda times a factor for line growth in Uganda times a factor for adjusted GDPgrowth (GDP growth is projected based on recent high averages but adjusteddownward somewhat for two factors: population growth, since some of the recentGDP growth is really due to population increases, not GDP per capita); and telecomintensity, since we assume that new, probably poorer, subscribers will not makernational calls at quite the same rate as old subscribers)
PTCn = Projected incoming termination charges in year n for each non-East African country(projected by scenario assumption)
PIM0n = Projected incoming minutes in year n from each non-East African country toUganda, summed across all countries (projected by taking volume in the base year,an average of 1995 and 1996 data) times an assumed factor for price elasticity of theassumed collection rate in each foreign country times a factor for Uganda linegrowth times a factor for assumed worldwide GDP growth applicable to allcorrespondent countries)
UCCn = Uganda collection charges for year n for each country destination (assumed to dropat the same rate as the accounting rate drops in each scenario)
UARn = The accounting rate in Uganda related to that country in year n (projected byscenario assumption) (this subtraction of collection rate minus accounting rateyields the surplus of the collection rate over the accounting rate that is retained byUPTC on each call over and above the amount retained by UPTC for originating thecall (accounted for above) and the amount paid out to the corresponding country(the terminating charge in the foreign country; generally equal to the originatingcharge); the subtracted terms are then multiplied by POGMn, the projected outgoingminutes described above)
POGM-EAn= Projected outgoing traffic minutes to each East African country (Tanzania, Kenya,Rwanda and Burundi) in year n (projected using estimated current volume inminutes times a factor for line growth in Uganda times a factor for price elasticity inUganda on the assumed collection rate in Uganda times a factor for quality ofservice improvement, i.e. reduction in the current call blocking problem)
CR-EAn = Collection rate in Uganda to each East African country in year n (assumed byscenario; assuming that the Sender Keeps All to East Africa system remains inplace)

UGANDA
30
Note that this revenue model ignores possible international revenues in Uganda from second operators ormobile operators, either separately or as they might generate more revenue for UPTC by putting more trafficthrough UPTC’s international gateway or crossborder microwave links. Note too that since this equation hasalready allowed for outpayments in the UARn term, so that a separate term for outpayments is not needed.
5.2 Base Case
Taking the revenue model described above, we can use it to create scenarios of what might happen to UPTCrevenues under various conditions.
Taking a base case, we make the following assumptions:
• All forecasts will be through the year 2002. (The only exception is for the FCC scenario which requiresactions in 2003. But for all scenarios the year 2002 will be the focus year for comparisons.)
• Line growth in Uganda will be 4 percent per year (this is perhaps rather low given the low number oflines in Uganda, but we wanted a number that would not overwhelm the other effects in the model)
• GDP growth in Uganda will be 9 percent per year, adjusted downward by 2 percent for population and 2percent for telecom intensity, yielding a net of 5 percent per year (where telecom intentity means that asnew, poorer subscribers are added, they will probably not use the telecom services as intentively asexisting subscribers)
• Quality of service to non East African countries will increase 2 percent per year and to East Africancountries will also increase 2 percent per year
• The collection rate and accounting rates in Uganda, other East African countries, and the rest of theworld do not change from the present rates
• Worldwide GDP growth is 3 percent per year
• Price elasticity in Uganda is -1.53 applied to the collection rate in Uganda in each year
• Price elasticity elsewhere in the world is -1.1 in high income countries and -1.2 in low income countries,applied to the collection rates in those countries in each year
• Line growth in East African countries outside Uganda is 5 percent per year.
Thus this base case holds prices constant and any changes are driven by network and economic growth, notprice changes. Under these assumptions we project that all international revenues rise from $18.5 M to$27.8 M in 2002, with East African revenues accounting for $4.6M and $8.3 M respectively. This is basedon minutes increasing from 5M to 8.5M outgoing from non-East African countries and from 12.7M to17.8M incoming from non-East African countries, and from 6.7M to 11.3M minutes outgoing to EastAfrican countries (incoming minutes from EA countries are not estimated). Thus in the base case, as aresult of GDP, line and population growth, all international revenues grow by 50.2% over the 1998-2002period. Scenarios described later will make comparisons with these base case figures.
Note that this base case partially addresses what would happen under a scenario in which it is assumed thatUPTC has justified its current collection charges and accounting rates as cost based (per the PATU study),these charges are accepted by the world community, UPTC keeps its accounting rates where they are, andthe current basic accounting rate system does not change through 2002.
A summary table of the results of all the different scenarios is shown at the end of this section.
We also did a simple projection of UPTC turnover by taking historical data and doing a simple CAGRprojection forward at 10%. This yielded turnover in 1998 of $53.8M and in 2002 of $82.7M. We comparetotal international revenues to this notional turnover figure for each scenario in the summary table below.Comparing international revenues to these projected UPTC revenues, we see that in the base yearinternational revenues constitute 25.6 percent of total revenue.
For ease of discussion as the model gets more complex, we have changed the order of scenario discussionslightly from the terms of reference.

UGANDA
31
5.3 Staged reduction in accounting rates
Taking the revenue model and attempting to answer the question of what will happen if there is a stagedreduction (and for these purposes we have used 10%, the highest percentage reduction in the rangesuggested by the ITU) per year as foreseen in ITU-T recommendation D.140, we keep all the above listedassumptions except the following, which are changed:
• Collection rates in Uganda for non-East African countries decline by 10 percent per year
• Accounting rates in Uganda for non-East African countries decline by 10 percent per year; accountingrates for the rest of the world go down the same percentage
• Collection rates in Uganda for “Sender Keeps All” East African countries goes down 10 percent per year.
Under these new assumptions we see that outgoing non-EA minutes rise to 16.3M in 2002; incomingminutes rise to 29.3M; and outgoing EA minutes rise to 21.6M. All these minutes are substantially higherthan the minutes in 2002 for the base case.
Total revenues rise to $29.4M in 2002, with EA revenues amounting to $9.2M of this total. The totalrevenue figure is 5.7% higher than the comparable $27.8M figure for the base case.
To check the validity of these projections, we compared outgoing volume in minutes in the base and outyears with minutes per line and minutes per inhabitant published in the literature. The projections were inline with these ratios for less developed countries, although the minutes per line were on the high side,probably because we have kept the line growth rate rather low at 4 percent per year.
Although this scenario provides Uganda with a high revenue outcome, it addresses but does not solve one ofthe nagging problems of the current settlement arrangements: inflow vs. outflow of traffic. Becausecollection rates have been higher for some years in Uganda than in many of the developed trading partnercountries, outgoing minutes have been much lower than incoming minutes, leading to an outflow ofsettlement payments to Uganda (and other similar countries) from the US and other developed countries.Under this scenario this situation would change somewhat with incoming as a percent of total (incomingplus outgoing) minutes (for non-EA countries) at 70.1% in 1998 and declining to 64% in 2002. Sometrading partners still retain substantial imbalances, however. For example, the US in 1998 has a 88% of itstraffic with Uganda as outgoing to Uganda, while by 2002 this situation has improved slightly to 85%, animprovement but still a very substantial imbalance.
To determine the effect of a key variable, Ugandan price elasticity, on these forecasts, we redid the 10percent decline forecast with Uganda price elasticity set at -1.1 instead of -1.53. Here we found that totalrevenues were $26.4M in 2002, 10% less than under the D.140 scenario with a -1.53 elasticity. East Africanrevenue is $7.7M instead of $9.2M, driven by outgoing minutes, which declined substantially whileincoming expectedly stayed the same.
Importantly, this $26.4M is less than the base case, thus showing that when prices drop but the elasticity islow, less revenue is generated than if prices are frozen. This highlights the need to have accurate estimatesof elasticities in these situations, in order to make informed policy decisions.
5.4 Benchmarking or price caps for settlement rates
The US Federal Communications Commission (“FCC”) has ordered US carriers to negotiate towardtermination and origination charges of $0.23 by January 1, 2003 for less developed countries. This isexpected to drive down accounting and collection rates worldwide. To test the effect of this proposedchange, we made the following assumptions in the revenue model:
• The termination and origination charge in the base year is $0.50 for the US, declining each year to $0.23in 2003, for a CAGR drop of 12.14 percent.
• For all other countries other than the US, the final year of 2003 is set at a termination and originationcharge of $0.23, and an even CAGR decline from the current charge to the $0.23 is implemented. Thisresults in a range of declines from 3%/year for Canada to 26% for Belgium, with an average of 15.8%CAGR decline.

UGANDA
32
• The worldwide collection rate is also assumed to drop 12.14 percent CAGR, in step with the US-Ugandarelation. (Note that this percentage is rather arbitrary.).
• The price elasticity in Uganda is again assumed to be -1.53.
Here the results are that total international revenue grows to $29.1M, almost as high as the D.140 scenario,and 4.6% higher than the base case. Of this revenue, $9.2M comes from EA, and the 2002 minutes are18.5M outgoing from non-EA, 32.4 incoming from non EA, and 24.5 outgoing from EA.
5.5 Call Termination or unbundled interconnection payments
The FCC has also advocated and researched Tariff Component Pricing, (TCP), in which call terminationcosts are broken into three parts and estimated using different methodologies, then the parts summed into atotal for each of various countries. To model this approach for Uganda, we made the followingassumptions, which vary from the previous FCC scenario:
• Uganda’s system is similar to next door Kenya, for which the FCC estimated a TCP call terminationcost of $ 0.426. (Uganda and Kenya share a similar telecom history, were once part of the samecompany, are still part of the East Africa telecommunity, have similar technologies, switchinghierarchies, pay scales, economies, and competition policies, etc.) Hence this cost is used for Uganda.
• TCP costs for call origination equal costs for call termination for all countries.
• TCP costs for countries which the FCC did not research and estimate can be derived from nearby oradjacent, similar countries with similar economies and levels of development. Thus for example theTCP cost for Norway (unresearched by the FCC) can be derived from the FCC estimate for Sweden of$ 0.10.
• Each country’s settlement rate would decline fairly smoothly from the current rate to the FCC TCP rate.
• The accounting rate system moves immediately to an assymetric system which is based on the TCP, oron prices moving toward TCP. Thus in 2002 a call from Uganda to Belgium would generate $0.14 perminute for Belgium, as Belgium’s cost-based share for terminating the call. But this same call wouldyield $0.43 to Uganda as its cost based share for originating the call. (This call would of course alsoyield Uganda any excess of the collection rate over the $0.57 ($0.43 + $0.14) accounting rate.)Similarly, a call from Belgium to Uganda would yield $0.43 to Uganda for terminating the call, andwould yield only $0.14 to the Belgians for originating the call. (The Belgians would retain any excessof the collection rate over the accounting rate.)
• Collection rates still decline at 12 percent per year. This is higher than the average 8 percent thataccounting rates are declining under this scenario, but we anticipate that in fact collection rates woulddrop faster due to competitive pressures (a new second national operator, call-back, Internet telephony,etc.). And using 12 percent keeps this scenario more easily comparable with the previous FCC scenario.
• The price elasticity in Uganda is again assumed to be -1.53.
• The East African SKA system remains unchanged and in place.
• Any improvements in the efficiency of the Uganda phone system, and thus drops in the TCP, are notidentified and incorporated into the system until after 2003.
Under this approach the following results are obtained: International revenue grows to $30.9 million, 11.2percent higher than the base case and the highest revenue of any scenario. Of this revenue, $9.2 million stillcomes from East Africa, and the minutes remain the same as in scenario 5.4 above.
What is occurring here is that the Kenya (and thus Uganda) FCC TCP is rather high, at about 43 cents. Thisis much higher than the 23 cents FCC benchmark from the previous scenario. And Uganda is reaping thebenefit of this higher rate in originating and terminating calls. Hence this scenario is more lucrative. Ofcourse it would be even more lucrative if the PATU 60 cent estimate of call termination costs was used.
UGANDA
33
5.6 Very low settlement rates, sender keeps all etc.
In this scenario we assume that Uganda and the rest of the world switch to a Sender Keeps All (“SKA”)system in the first and all forecast out years. Thus there is no revenue from termination charges onincoming minutes, and the elements of the equation are reduced to collection charges in Uganda timesprojected outgoing minutes for non-East African countries and times projected outgoing minutes for EastAfrican countries. Here we make the following assumptions (all other assumptions listed earlier stay thesame):
• Price elasticity is -1.53
• Collection charges stay the same in Uganda.
Here we find that outgoing minutes to non EA and EA countries unsurprisingly stays the same in 2002(since in both cases the price remained unchanged). The revenue picture is somewhat different, however,with total revenue in SKA case reaching only $22.6M, 23% lower than the $27.8 figure for the base case.East African revenue is the same, as might be expected.
This scenario thus harms Uganda significantly, compared to other scenarios.
To vary this scenario somewhat, we then assume that collection charges in Uganda decline by 10 percent peryear. This results in the following: total revenue reaches $25.3M in 2002, higher than the SKA case withfrozen prices, but still 9% lower than the $27.8M base case figure for 2002. This is true despite the fact thatoutgoing minutes to non-EA countries is almost double the base case figure, at 16.3M vs. 8.5M for 2002.Similarly, outgoing minutes to EA countries is 21.6M in the SKA (10 percent drop) case and 11.3M in 2002in the base case.
Thus here the situation has improved somewhat by dropping collection rates and driving up minutes, butUganda is still definitely worse off than under the base case, where prices are frozen and the currentaccounting rate system is preserved (at least for non-EA countries).
5.7 Revenue stabilisation measures
The French-speaking regional Tariff Group for Africa (“TAF”) group reached consensus that accountingrates should be cost oriented, that it would take TAF members eight years to be able to institute analyticalcost accounting, and that “the revenues of TAF Group members derived from traffic balances must notdecline from one year to the next.” They also agreed that the principle of “dissymmetric shares” wouldapply, meaning that instead of the traditional 50-50 split, a 60-40 or other uneven split might take place.From the exact wording of the TAF report is not clear if “dissymetric shares” are to take be instituted before2005. It is also unclear if TAF wishes that “tariff balances must not decline” from year to year, as stated, orif the principle of the “possible formula” would apply, which focuses on a “minimum annual acceptablegrowth rate.” This latter would seem to be a quite different thing. The TAF prescription thus is rather hardto test, but our best approximation is to make the following assumptions:
• In each year, the total accounting rate (termination plus origination charge) must decline 10 percent, as inthe D.140 scenario. (Under our base and other scenarios, where revenues grow naturally as a result ofGDP, line and other factors, there would probably be no TAF adjustment needed in any year for anycountry if we took TAF literally at “tariff balances must not decline,” since all revenues go up in eachyear. Hence this would not be a fruitful avenue to explore.)
• The Uganda and all other collection rates are also assumed to decline 10 percent per year.
• It is assumed that the “minimum acceptable growth rate” for Uganda is 10 percent per year, and that thisrate applies to Uganda’s relations with all developed countries.
• It is assumed that this percent is applied to the percentage growth in total (origination plus termination)revenue derived from each relation with each developed country; that if this percentage is less than 10percent, then the termination and origination charges are adjusted until the revenue amount dictated bythe 10 percent growth goal is achieved. The new adjusted revenue amount is then divided by the total(outgoing plus incoming) minutes for each country relation, and a new origination and terminationcharge for each country is calculated which yields the new adjusted revenue amount. The actual

UGANDA
34
accounting rate (under the 10 percent per year decline requirement) is then compared to the newtermination and origination rates, and a new percentage split (non 50-50) is calculated. If the percentagegrowth is more than 10 percent, then no adjustment in the accounting rate split is made. Less developedcountries and “other” countries are ignored and not adjusted from the D.140 scenario. (We expect it isunlikely that any dissymetic subsidies would be forthcoming from other underdeveloped countries toUganda.)
• In the next year, the previous year’s uneven split, if any, is ignored, and the model tries to reset theaccounting rate with a 50-50 split, unless there is another need to reset the split.
• The price elasticity is still assumed to be -1.53.
Under these assumptions the results are the highest total revenue of any scenario, at $30.4M, with $9.2M ofthat coming from EA. This figure of $30.4M is 9.3 percent higher than the base case and is $1M higher thanthe next highest scenario, the D.140, 10 percent decline scenario. This higher figure is not surprising sincebasically a new source of revenue--subsidy from dissymetric shares--has been tapped.
The countries which contribute this subsidy include the US, UK, Canada, Sweden, France, Netherlands,Norway, Japan, Austria and Germany. The highest dissymetric share is 57% in 2002 for the US, followedby Canada at 56%, Sweden at 55%, and the UK at 53%. Note that in years before 2002 the percentages arelower and closer to 50%. Various other developed countries, such as Belgium, Denmark and Italy grew atmore than 10% per year and hence no dissymetric share adjustment was needed.
5.8 Uganda Drops Collection Rates Faster
To explore the question of incoming vs. outgoing flows of accounting payments, we undertook a variation ofthe D.140 scenario described earlier. Here we made the following assumptions:
• The price elasticity is still assumed to be -1.53.
• Uganda drops its collection rate faster than all other countries, with a 15% drop per year (applied to theprevious year’s rate) for Uganda for the first three years followed by a 10% drop for the last twoyears; and a 10% drop per year for all other countries including East African countries.
• Uganda and all other countries drop their accounting rates at a uniform 10% per year.
All other base case assumptions remain the same.
One might desire scenarios with greater drops in the collection rate (such as 15 or 20% each year for allyears) while the accounting rates (termination plus origination charge) dropped 10% per year. We examinedsome of these and found that the collection rate then rapidly dropped below the accounting rate, a situationwhich can exist (as we found in Lesotho) but which is unlikely to happen if the future is carefully plannedfor and the current situation monitored. Hence we scrapped these scenarios. Under this scenario thecollection rate generally ends the period slightly above the accounting rate, such that Uganda does collect asmall surplus beyond what it keeps as an origination fee.
This scenario attempts to achieve what the FCC apparently wants: lower accounting rates, lower collectionrates, and more balanced flows of minutes and revenue. Here we see that the results for Uganda are not bad,with total revenues fairly high at $28.2M.
The goals of equalising revenue and minutes are partly achieved. In this scenario in 1998 the incoming(non-EA) minutes as a percent of all (non-EA) minutes is 69 percent. This is reduced in this scenario to 60percent. There is a similar trend in individual country relations, also. For example, the percent of totalminutes for the US-Uganda drops from 87 percent incoming to Uganda in 1998 to 82 percent in 2002; from69 to 60 percent for the UK; and from 83 to 77 percent for Canada.
In revenue terms, these major trading partners get slightly closer to the equality they desire: for the US,inpayments to UPTC minus outpayments to the US (AT&T+MCI) changes from $2.2M minus $0.3M, for anexcess of $1.9M in 1998, to $2.8M minus $0.6M, for an excess of $2.2M in 2002. Thus the excess went upbut the outpayments to the US did double. The similar figures for the UK are $2.5M minus $1.1M for anexcess of $1.4M in 1998 changing to $3.2M minus $2.1M for an excess of $1.1M in 2002; and for Canada

UGANDA
35
the figures are $173K minus $34K for an excess of $139K in 1998 changing to $220K minus $64K in 2002for an excess of $156K in 2002.
Thus it appears that this scenario achieves higher revenues for Uganda, with modest gains toward improvingthe balance of traffic and inpayments vs. outpayments.
5.9 Summary of revenue projection results
We can summarise the various scenarios described above with the following table. This shows the base caseprojection for 1998 and 2002, and for 2002 other projections for each scenario. The most important row isprobably the top row, which shows that Uganda is best off under the TAF and FCC TCP scenario, with theD.140 and FCC benchmark scenarios in second place (all assuming an elasticity of -1.53) and worst offunder the SKA scenario with no drop in prices.
The last row of the table shows the percentage that all international revenues (incoming and outgoing,including surplus above the accounting rate received from the collection rates) from all countries accountfor, as a percentage of the total estimated UPTC revenues for that year. (This latter estimated by a simple10% CAGR on non-international revenues to arrive at $82.7M in 2002, then adding in estimatedinternational revenues from this table.) Here we see that international revenues start the period in the basecase at 25.6%, and stay in that general range in the year 2002, with a spread from 27.2% in the FCC TCPscenario down to 21.4% in the SKA zero price drop scenario.
Table 5.9: Revenue & minutes under various scenarios
BaseCase1998
BaseCase2002
D140-10%2002
D140-10% &
-1.1Elast.2002
FCC$0.23;2002
FCCTCP$.4262002
SKA-0%2002
SKA-10%2002
TAF2002
D140Ug Coll.Rate-15%-10%2002
All IntRev.M$ 18.5 27.8 29.4 26.4 29.1 30.9 22.6 25.3 30.4 28.2EA Rev.M$
4.6 8.3 9.2 7.7 9.2 9.2 8.3 9.2 9.2 9.2MinOGNonEA 5.6 8.5 16.3 13.7 18.5 18.5 8.5 16.3 16.3 19.4MinICNonEA 13.6 17.8 29.3 29.2 32.4 32.4 29.3 29.2 29.3 29.3MinOGEA 7.5 11.3 21.6 18.2 24.5 24.5 11.3 21.6 21.6 25.8Int.Revas %of est AllRev 25.6 25.1 26.2 24.2 26.0 27.2 21.4 23.4 26.9 25.4
Source: Case Study
UGANDA
36
6. CONCLUSIONS
6.1 Evaluation of scenarios based on the revenue projection models
We do not believe that the TAF scenario of changing the 50-50 split of accounting rates is realistic as, on thebasis of the model outlined above, it indicates that a further source of revenue is effectively derived fromUPT’s correspondents. Given the international climate with regard to international settlement balances,correspondents are unlikely to be swayed by arguments that such a system is necessary on the basis that itrepresents a disproportionate response. We think that this is especially true when the argument revolvesaround “a reasonable increase in revenue” as is the case here, rather than a decrease in actual revenues.However, it may be possible to envisage alternative “commercial” responses such as the provision ofequipment on favourable terms in return for a negotiated reduction in the accounting rate. This wouldrepresent a one-off package rather than on ongoing commitment to subsidise national network development.
If that scenario is omitted, then Uganda is best off with the D140 scenario, in which collection rates andaccounting rates drop at 10 per cent per year for five years. This scenario is also attractive to the US andothers in that it results in lower accounting and collection charges in a reasonably rapid manner. This wouldthen seem to be the best scenario from a political compromise and realism point of view.
This scenario assumes, in our revenue projections, a drop in collection rates of 10% per year, a notunrealistic assumption given UPTC’s sensitivity to the threat of call-back. It is difficult to estimate thelikely decline in this threat. Section 3.2.1 referred to the recent 50% drop in collection rates, in which lossof revenue to call-back was a factor. UPTC anticipates that after this drop in rates, loss of revenue willdecline on a monthly basis by 50%.
6.1.1 Likely commercial responses
UPTC is sensitive to international trends and to factors, such as call-back, which to a large extent governedits decision to drop collection rates significantly in September 1997. In addition, as section 3.3.1 describes,accounting rates have been declining in recent years on relations with major correspondents. However,UPTC derives approximately 6% of its turnover from international settlement revenues. Although UPTCrelies on settlement revenues partially to fund its network build out, it is likely that UPTC will be equallysensitive to changes in the accounting rate regime, seeking to manage change in the manner best calculatedto maximise its settlement revenues for as long a time as possible.
One possible UPTC response would be to lower collection rates sufficiently to warrant reverse call-backoperators operating, at least within the East African telecommunity. It is unlikely that call-back operatorswould be incentivised to offer reverse call-back from countries such as the US and the UK. However, call-back will cease to be the most pressing competitive concern of UPTC/UTL as direct facilities competitionwill become a reality when the MTN/Telia consortium receives its second national operator licence. Otheroptions for international services may become available with the licensing of value added and data services.An instant move to a world served by personal computers and software enabled Internet voice telephony isunlikely but proposals for call centres may address the issue of communications generally, bringing Internetaccess to remote or unserved regions. The provision of alternative international facilities, in the short tomedium term, may free up capacity for alternative services such as throughout Internet telephony and otheroptions, such as least cost routing, may be explored.
Another possible response would be to take up suggestions of acting as an East African hub, thus breakingthe East African telecommunity informal code of conduct. UPTC has set itself against this option but it mayoccur without the active participation by UPTC if accounting rates and conveyance charges fall. It will beinteresting to see whether the MTN/Telia consortium are constrained in any way by the informaltelecommunity arrangements. If not, one interesting effect of competition may be the development of thesecond national network and its gateway as a hub for East Africa. With competition in domestic servicesdeveloping, efficiency gains and improved cost-allocation and accounting may bring costs and collectionrates down, attracting hubbing opportunities.
An alternative source of external financing for UPTC will be derived from the sale of a stake in the newlycorporatised UTL. In addition, the licensing of the second national operator will act as a spur to UPTC tocontinue to lower collection rates in order to avoid losing customers. Both licensees will be subject to build

UGANDA
37
obligations and access requirements, subject to the developing level of network penetration. Competitionitself will act favourably on the incentives to meet these obligations.
UPTC will in any event be facing competition from the second national operator, when the second operatinglicence is granted. The second national operator, the MTN/Telia consortium, will be authorised to provideinternational services. Correspondent agreements must be notified to the Commission, who may require thatits prior approval is required before these arrangements can be concluded. It is understood that the interimstaff at the Commission have just concluded licence negotiations with MTN/Telia.
Looking forward, the operator investing in UTL or a member of the operator’s corporate group may beauthorised to provide international services in their own jurisdictions. Certainty, Telia is authorised toprovide international services in Sweden and in some other jurisdictions. Thus, the concept of end-to-endservice provision may become a reality, although it is likely that the Commission will look to see arms-length transactions for the conveyance and termination of international calls.
6.1.2 Likely policy response
Uganda is at present negotiating its commitments in relation to basic telecommunications under the GATS,part of which will consist in the adoption by Uganda of the Reference Paper.
Much of the “regulation” of international services will derive from regulations promulgated by theCommission. It will be interesting to see how the Commission manages the duopoly of UPT, as it will be,and the second national operator in relation to international services. In some jurisdictions, parallelaccounting requirements were adopted, which required operators authorised to provide international servicesbased on the same accounting rate levels. These requirements were designed to prevent monopoly foreignoperators from playing the duopoly providers off against each other. In practice, parallel accounting had theeffect of maintaining artificially high accounting rates. However, given the importance of settlement raterevenues to the build out of the domestic networks, some form of protection may be envisaged.
This may make a staged reduction in accounting rates the more likely option as it is more easily managed bythe regulatory authority. The Commission will need to balance increased investment capital flowing fromthe strategic investment in UTL and the presumed operating capital of the second national operator in termsof funding network development against a possible decline in settlement revenues.
In seeking to manage the move to a duopoly and an otherwise liberalised market, the Commission will needcarefully to balance the environment for maximising investment in domestic infrastructure against themarket disciplines expected of newly liberalised entities and the increasing competitiveness of internationalservices, both within Uganda and outside.

UGANDA
38
ANNEX I - INTERNATIONAL TRAFFIC PATTERNS
Year 1990 1991 1992 1993 1994 1995 1996 1996 1996
Incoming orOutgoing
IC OG IC OG IC OG IC OG IC OG IC OG IC OG IC & OG Percentof Total
USA (MCI &AT&T)
867,364 565,166 879,426 415,132 1,231,914 461,741 1,707,294 327,857 2,750,391 447,456 3,731,765 539,237 4,612,213 541,639 5,153,852 28.1
UK (BTI &MCL)
1,312,893 1,796,666 1,505,233 1,674,068 1,887,634 1,100,166 2,151,151 851,575 3,287,757 938,216 3,653,430 1,276,434 3,124,369 1,414,027 4,538,396 24.7
India 4,941 180,541 33,093 160,272 101,880 142,354 52,750 132,981 306,787 263,944 354,330 538,159 351,922 684,571 1,036,493 5.6
S. Africa 11,587 21,442 74,540 43,373 99,203 33,728 139,011 45,162 397,765 101,091 525,164 191,243 585,543 313,721 899,264 4.9
Canada 98,587 321,191 127,682 165,368 231,478 131,103 268,643 65,153 331,264 55,922 475,066 81,676 689,841 121,773 811,614 4.4
Japan 31,613 78,196 42,709 62,752 62,310 78,361 107,557 64,878 195,280 85,414 470,934 147,980 576,947 121,597 698,544 3.8
Germany 209,206 172,381 213,376 177,625 209,968 127,680 455,402 110,348 462,200 154,796 456,340 168,666 472,829 206,778 679,607 3.7
Italy 79,935 153,060 96,974 163,012 96,147 118,259 130,326 103,301 189,490 129,631 129,459 148,320 234,985 165,718 400,703 2.2
UAE 91,718 175,686 89,743 124,980 58,085 58,136 71,536 65,069 161,613 95,050 231,982 140,267 263,382 135,941 399,323 2.2
Switzerland 99,654 65,803 116,518 84,894 137,710 74,587 159,595 75,172 233,163 109,171 226,799 113,293 228,644 132,722 361,366 2.0
France 44,573 89,449 77,837 96,685 77,326 56,796 95,898 55,366 151,070 85,493 177,505 119,127 215,514 142,869 358,383 2.0
Netherlands 47,349 38,116 69,937 47,354 67,546 49,387 82,782 43,681 111,315 60,513 150,377 88,263 163,690 101,230 264,920 1.4
Belgium 61,262 61,169 74,017 92,386 69,086 53,327 71,221 53,678 120,692 78,217 115,564 99,190 142,598 118,873 261,571 1.4
Sweden 135,947 94,837 146,413 80,538 176,392 57,292 154,370 49,319 192,630 47,483 210,515 61,030 195,152 56,825 251,977 1.3
Denmark 74,624 55,847 97,825 76,367 118,525 75,984 141,364 63,656 201,171 74,635 73,698 110,588 92,043 137,054 229,097 1.2
Zimbabwe 18,886 21,745 23,096 29,839 14,616 24,063 29,203 19,144 60,719 42,522 88,694 52,360 86,726 57,379 144,105 0.8
Egypt 15,272 16,361 22,885 44,804 23,224 46,549 27,949 22,991 46,893 34,736 60,603 61,446 64,740 74,011 138,751 0.7
Norway 16,930 17,552 23,188 18,165 40,134 23,934 47,577 18,623 57,377 17,617 66,573 22,780 93,975 30,939 124,914 0.7
Algeria 3,348 2,243 3,574 5,663 3,022 1,638 985 404 883 350 2,697 486 102,791 1,278 104,069 0.6
Austria 11,239 12,877 20,215 21,064 25,268 15,506 31,181 16,146 55,617 22,627 65,465 25,799 70,051 28,511 98,562 0.5
Other 471,593 539,356 450,540 609,057 566,800 546,657 774,850 481,692 990,506 682,609 1,055,708 870,306 721,862 672,776 1,394,538 7.8
TOTAL 3,708,521 4,479,684 4,188,821 4,193,398 5,298,268 3,277,248 6,700,645 2,666,196 10,304,583 3,527,493 12,322,668 4,856,650 13,089,817 5,260,232 18,350,049

UGANDA
39
ANNEX II - ACCOUNTING RATE EXHIBIT
Year Country TotalAccount-ing Rate
Currency Traffic Type(Both Ways,Incoming.Outgoing)
Cascade orDirectAccounting
OriginRetains
Confident-ial TransitCharge
OfficialTransitCharge
TransitingAdministrat-ion
DestinationCharge
TariffEffective Date
AgreementUsed forMajor Trafficor as Backup
1992-3 USA (AT&T) 1.50 USD NA NA 0.75 – 0 Direct 0.75 1/6/92 MT
1995 USA (AT&T) 1.50 USD BW CA 0.75 – 0 Direct 0.75 1/1/88 MT
1995 USA (MCI) 1.50 USD BW CA 0.75 – 0 Direct 0.75 1/1/93 MT
1996/7 USA (AT&T) 1.00 USD BW DA 0.50 – 0 Direct 0.50 1/1/97 MT
1996/7 USA (MCI) 1.20 USD BW DA 0.325 0 0.55 BTI 0.325 1/4/96 BU
1996/7 USA (Sprint) 1.00 USD IC CA 0.265 0 0.47 Rome 0.265 1/1/97 MT
1997 USA (AT&T) 1.00 USD BW DA 0.500 0 0 Direct 0.500 1/1/97 MT
1992/3 UK (BT) 1.20 SDR NA NA 0.60 – 0 Direct 0.600 1/1/82 MT
1995 UK (BTI) 1.40 SDR BW DA 0.70 – 0 Direct 0.700 1/1/95 MT
1996 UK (BTI) 1.20 SDR BW DA 0.60 – 0 Direct 0.600 1/4/96 MT
1997 UK (BTI) 1.00 SDR BW DA 0.50 – 0 Direct 0.500 1/7/97 MT
1992/3 Canada 1.00 SDR NA NA 0.29 – 0.42 Germany 0.29 1/4/90 MT
1995 Canada 0.700 SDR BW CA 0.35 – 0 Direct 0.35 NA MT
1996 Canada 0.700 SDR BW DA 0.35 – 0 Direct 0.35 1/9/96 MT
1997 Canada 0.400 SDR BW DA 0.20 – 0 Direct 0.20 1/9/97 MT
1992/3 India 1.66 SDR NA NA 0.62 – 0.42 Kenya 0.62 1/10/89 MT
1995 India 1.66 SDR BW CA 0.65 – 0.36 Germany 0.65 1/6/93 MT
1996/7 India 1.28 SDR BW CA 0.55 – 0.18 Startec 0.55 1/4/96 MT
1992/3 S. Africa 1.96 SDR NA NA 0.78 – 0.40 Germany 0.78 1/7/91 MT
1995 S. Africa 1.96 SDR BW DA 0.80 – 0.36 AT&T 0.80 1/2/93 MT

UGANDA
40
Year Country TotalAccount-ing Rate
Currency Traffic Type(Both Ways,Incoming.Outgoing)
Cascade orDirectAccounting
OriginRetains
Confident-ial TransitCharge
OfficialTransitCharge
TransitingAdministrat-ion
DestinationCharge
TariffEffective Date
AgreementUsed forMajor Trafficor as Backup
1996 S. Africa 1.20 SDR BW DA 0.60 – 0 S. Africa 0.60 1/12/96 MT
1997 S. Africa 1.00 SDR BW DA 0.50 – 0 S. Africa 0.50 1/4/97 MT
1992/3 Japan 1.60 SDR NA NA 0.59 – 0.42 Kenya 0.59 1/1/91 MT
1995 Japan 1.60 SDR BW CA 0.635 – 0.33 Tanzania 0.635 1/9/91 MT
1996 Japan 1.30 SDR BW CA 0.455 0.290 0.390 Rome 0.455 1/4/96 MT
1997 Japan 1.30 SDR BW CA 0.455 0.120 0.390 Rome 0.455 1/1/97 MT
1992/3 Germany 1.96 SDR OG DA 0.62 – 0.36 AT&T 0.98 1/2/93 MT
1995/6 Germany 1.40 SDR BW DA 0.70 – 0 Direct 0.70 1/4/95 MT
1997 Germany 1.00 SDR BW DA 0.50 – 0 Direct 0.50 1/1/97 MT
1998 Germany 0.60 SDR BW DA 0.30 – 0 Direct 0.30 1/1/98 MT
1992/3 France 1.96 SDR NA NA 0.78 – 0.40 AT&T 0.78 1/7/91 MT
1995/6 France 1.96 SDR BW DA 0.98 – 0 Direct 0.98 NA MT
1997 France 1.00 SDR BW DA 0.50 – 0 Direct 0.50 1/4/97 MT
1992-97 Lesotho 1.36 SDR NA NA 0.45 – 0.46 BTI 0.45 1/3/89 MT
1995 Lesotho 1.36 SDR BW CA 0.53 0.29 0.35 MCI 0.505 1/9/95 BU
1996/7 Lesotho 1.36 SDR BW CA 0.505 0.22 0.35 MCI 0.505 1/9/96 BU
1992/31995/7
Mauretania 9.00 GFC BW CA 3.85 – 1.30 France 3.85 1/3/88 MT
1996 Mauretania 2.940 SDR BW CA 1.325 0.29 0.35 MCI 1.295 1/9/95 BU
1997 Mauretania 2.940 SDR BW CA 1.295 0.22 0.35 MCI 1.295 1/9/96 BU
1992/31995
Bahamas 3.55 USD BW CA 1.535 – 0.48 AT&T 1.535 1/1/91 MT
1996/7 Bahamas 3.55 USD BW CA 1.535 0.24 0.48 AT&T 1.535 1/1/91 MT

UGANDA
41
Year Country TotalAccount-ing Rate
Currency Traffic Type(Both Ways,Incoming.Outgoing)
Cascade orDirectAccounting
OriginRetains
Confident-ial TransitCharge
OfficialTransitCharge
TransitingAdministrat-ion
DestinationCharge
TariffEffective Date
AgreementUsed forMajor Trafficor as Backup
1997 Bahamas 1.94 SDR BW CA 0.795 0.22 0.35 MCI 0.795 1/1/96 BU
1992/3 Sri Lanka 2.70 SDR NA NA 1.13 – 0.44 BTI 1.13 1/6/89 MT
1995 Sri Lanka 1.66 SDR BW CA 0.635 – 0.39 Rome 0.635 1/1/92 MT
1996 Sri Lanka 1.66 SDR BW CA 0.685 0.29 0.35 MCI 0.655 1/9/95 MT
1997 Sri Lanka 1.66 SDR BW CA 0.655 0.29 0.35 MCI 0.655 1/9/96 MT
1992/3 Zimbabwe 1.96 SDR NA NA 0.77 – 0.42 BTI 0.77 1/2/92 MT
1995 Zimbabwe 1.97 USD BW CA 0.77 – 0.43 AT&T 0.77 1/7/94 MT
1997 Zimbabwe 1.97 USD BW CA 0.77 0.24 0.43 AT&T 0.77 1/7/94 MT
1992/3 Colombia 4.00 USD NA NA 1.735 – 0.53 AT&T 1.735 1/1/91 MT
1995/6 Colombia 2.28 SDR BW CA 0.930 – 0.42 BTI 0.930 1/8/93 MT
1997 Colombia 2.00 SDR IC CA 0.805 0.120 0.390 Rome 0.805 1/9/97 MT
1992/3 Switz/Liech. 2.60 SDR NA DA 1.30 – 0 Direct 1.30 1/7/90 MT
1995 Switz/Liech. 1.40 SDR BW DA 0.70 – 0 Direct 0.70 1/10/95 MT
1996 Switz/Liech. 1.20 SDR BW DA 0.60 – 0 Direct 0.60 1/1/96 MT
1997 Switz/Liech. 1.00 SDR BW DA 0.50 – 0 Direct 0.50 1/1/96 MT
1992/3 UAE 6.43 GFC NA NA 2.605 – 1.22 AT&T 2.605 1/1/91 MT
1995 UAE 6.43 GFC BW CA 3.215 – 0 BTI 3.215 1/5/93 MT
1996 UAE 2.10 SDR BW CA 0.905 0.290 0.35 MCI 0.875 1/9/95 MT
1997 UAE 3.061 GFC BW CA 1.0306 0.670 1.00 MCI 1.0305 1/1/97 MT
1998 UAE 1.840 GFC BW CA 0.420 0.670 1.00 MCI 0.42 1/7/98 MT
1992/3 Italy 2.48 SDR NA NA 0.82 – 0.42 Direct 1.24 1/9/90 MT
1995 Italy 1.60 SDR BW DA 0.80 – 0 Direct 0.80 1/1/93 MT

UGANDA
42
Year Country TotalAccount-ing Rate
Currency Traffic Type(Both Ways,Incoming.Outgoing)
Cascade orDirectAccounting
OriginRetains
Confident-ial TransitCharge
OfficialTransitCharge
TransitingAdministrat-ion
DestinationCharge
TariffEffective Date
AgreementUsed forMajor Trafficor as Backup
1996 Italy 1.40 SDR BW DA 0.70 – 0 Direct 0.70 1/1/92 MT
1997 Italy 0.50 SDR BW DA 0.25 – 0 Direct 0.25 1/4/97 MT
1992/3 Sweden 6.00 GFC NA NA 3.00 – 0 CPN 3.00 1/1/85 MT
1995 Sweden 4.90 GFC BW DA 2.45 – 0 COPEN 2.45 1/4/93 MT
1996 Sweden 1.60 SDR BW DA 0.98 – 0 TEL2SWD 0.98 1/10/95 MT
1997 Sweden 1.00 SDR BW DA 0.50 – 0 TEL2SWD 0.50 1/1/97 MT
1992/3 Netherlands 2.94 SDR NA DA 1.47 – 0 Direct 1.47 1/4/82 MT
1995 Netherlands 1.40 SDR BW DA 0.70 – 0 Direct 0.70 1/10/95 MT
1996 Netherlands 1.00 SDR BW DA 0.50 – 0 Direct 0.50 1/6/96 MT
1997 Netherlands 0.40 SDR OG DA 0.04 0.22 0.36 AT&T 0.04 1/10/97 MT
1992-95 Denmark 1.96 SDR NA NA 0.98 – 0 Direct 0.98 1/2/89 MT
1996 Denmark 1.60 SDR BW DA 0.70 0.20 0.0 TEL2SWD 0.70 1/1/96 MT
1997 Denmark 1.60 SDR BW DA 0.62 0.20 0.36 AT&T 0.62 1/2/93 MT
1992-97 Rwanda 5.00 GFC NA NA 2.50 – 0 Kenya 2.50 1/5/87 BU
1997 Rwanda 5.00 GFC BW SKA 1.85 – 1.30 Paris 1.85 1/3/87 2nd BA
1992-99 Belgium 1.96 SDR NA NA 0.98 – 0 Direct 0.98 1/5/89 MT
1992/31995
China 9.00 GFC NA NA 3.89 – 1.22 AT&T 3.89 1/1/91 MT
1996 China 9.00 GFC BW CA 3.90 0.90 1.20 Rome 3.90 1/1/96 MT
1997 China 2.94 SDR BA CA 1.275 0.12 0.39 Rome 1.275 1/1/97 MT
1992/31995
Egypt 6.40 GFC NA NA 2.60 – 1.20 Rome 2.60 1/1/93 MT
1996 Egypt 6.40 GFC BW CA 2.60 0.90 1.20 Rome 2.60 1/1/96 MT

UGANDA
43
Year Country TotalAccount-ing Rate
Currency Traffic Type(Both Ways,Incoming.Outgoing)
Cascade orDirectAccounting
OriginRetains
Confident-ial TransitCharge
OfficialTransitCharge
TransitingAdministrat-ion
DestinationCharge
TariffEffective Date
AgreementUsed forMajor Trafficor as Backup
1997 Egypt 4.00 GFC BA CA 1.40 0.36 1.20 Rome 1.40 1/7/97 MT
1992/3 Pakistan 8.57 GFC NA NA 3.635 – 1.30 Germany 3.635 1/4/90 MT
1995 Pakistan 8.57 GFC SW CA 2.685 – 1.20 Rome 3.685 1/1/93 MT
1996 Pakistan 8.57 GFC BW CA 3.685 0.90 1.20 Rome 3.685 1/1/96 MT
1997 Pakistan 2.80 SDR BW CA 1.205 0.12 0.39 Rome 1.205 1/1/97 MT

UGANDA
44
ANNEX III - TELECOMMUNICATIONS INDICATORS
UGANDA UGA
Year Ending 30.06. Local Currency: Shilling
Item Unit 1992 1993 1994 1995 1996 1997
323m Total telex traffic (minutes) 10x3
STAFF
151 Full-time telecommunication staff 10x3 1.25 1.25 1.22 1.32 1.35
QUALITY OF SERVICE
1141 Faults cleared by next day % 14.90 10.60 58.00 36.00
1142 Unsuccessful local calls % 55.20 67.50 49.90
11421 Unsuccessful local calls due to busy no. % 24.80
11422 Unsuccessful calls due to no answer 23.10
11423 Unsuccessful calls due to technical 2.00
1143 Faults per 100 main loss per year % 380.00 100.00 80.00 90.00
1144 Operator assistance calls answered % 64.00
TARRIFS (LOCAL CURRENCY)
1151 Residential tph connection fee 21,250.00 21,250.00 125,000.00 138,000.00 138,000.00 170,000.00
1151b Business tph connection fee 21,250.00 21,250.00 125,000.00 138,000.00 138,000.00 170,000.00
1151c Analog cellular connection charge 0.00 0.00 0.00 0.00
1151d Digital cellular connection charge 0.00 0.00 0.00
1152 Residential monthly subscription 800.00 800.00 1,500.00 6,000.00 6,000.00 19,000.00
1152b Business monthly subscription 800.00 800.00 1,500.00 6,000.00 6,000.00 19,000.00

UGANDA
45
UGANDA UGA
Year Ending 30.06. Local Currency: Shilling1153 Cost of a 3 minute local call (peak rate) 50.00 50.00 50.00 200.00 200.00
1153b Cost of a 3 minute local call (peak rate) US$ 0.04 0.04 0.05 0.21 0.19
1153c Analog call - cost 3-min local call 0.00 0.00 0.00 0.00
1153 Analog call - cost 3-min local call 0.00
1153d Digital call - cost 3-min local call 0.00 0.00 0.00
1153 Digital cellular - cost 3 min local call
1153do Cost of a 3-min local call (off-peak)
REVENUE AND EXPENSE
171 Telephone income 10x5 31,477.79 31,492.44 37,151.99 43,883.00 43,940.06 35,757.03
171331 - Outpayments to foreign administrations 10x5 3,613.88 5,328.28 5,754.35 6,100.75
172 Income from telegraphs 10x5 69.72 393.76 84.47 75.43 57.04 59.75
173 Income from telex 10x5 1,585.96 883.34 2,036.76 1,798.81 1,397.04 616.30
1731 Income from data transmission 10x5
1732 Leased circuit revenue 10x5 592.23 2,403.13
174 Other income 10x5 262.59 2,884.65 3,370.94
1741 Mobile communication revenue 10x5
175 Telecom service revenue 10x5 33,396.06 32,768.54 40,683.19 47,752.16 45,394.00 48,307.90
176 Total expense for telecom services 10x5 13,579.35 19,740.59 13,918.78 55,154.49
1761 Operational expenditure 10x5 7,480.18 14,248.68 11,432.07 7,969.50
17611 Wages and other personnel expenditure 10x5 16,361.43 19,787.05

UGANDA
46
UGANDA UGA
Year Ending 30.06. Local Currency: Shilling1762 Depreciation 10x5 958.67 1,035.40 1,205.83 5,123.03 5,304.44 8,439.71
1763 Net interest paid/received 10x5 1,587.30 1,690.33 1,280.88
17631 Interest paid 10x5 4,583.63 4,998.97
17632 Interest received 10x5 64,340 10.92
1764 Income tax 10x5 3,143.99 1,970.49 7,493.14 2,050.88
177 Profit/loss 10x5 41,936.57 6,105.14 (44,422.26)
CAPITAL EXPENDITURE
181 Annual investment in telecom 10x5 14,239.47 11,825.93 9,243.28 22,429.50 20,432.36
BALANCE SHEET
185 Total fixed assets 10x5 9,776.65 11,942.65 12,671.08 11,875.94
1851 Equity 10x5 3,786.95 7,251.86 49,074.21 7,181.20 9,308.00
1852 Long-term debt 10x5 61,269.96 71,123.84 64,940.42 71,665.35 95,229.51
1853 Other liabilities 10x5 53,583.80 50,689.41 67,842.87 76,603.50
BROADCASTING
1955 Radio receivers 10x3 2,100.00 2,200.00 2,300.00 2,400.00 2,500.00
1965 Television receivers 300,000.00 350,000.00 400,000.00 500,000.00 525,000.00
INFORMATION TECHNOLOGY
14211 Internet host computers 10x3 0.00 0.00 0.00 0.06 0.02
14212 Estimated Internet users 10x3 10.00 10.50
Sections 7, 8 and 9 are in millions of local currency at current prices