Uganda: Selected Issues - International Monetary Fund · Uganda: Selected Issues ... Kenya’s...
33
© 2009 International Monetary Fund January 2009 IMF Country Report No. 09/37 Uganda: Selected Issues This Selected Issues paper for Uganda was prepared by a staff team of the International Monetary Fund as background documentation for the periodic consultation with the member country. It is based on the information available at the time it was completed on December 15, 2008. The views expressed in this document are those of the staff team and do not necessarily reflect the views of the government of Uganda or the Executive Board of the IMF. The policy of publication of staff reports and other documents by the IMF allows for the deletion of market-sensitive information. Copies of this report are available to the public from International Monetary Fund ● Publication Services 700 19th Street, N.W. ● Washington, D.C. 20431 Telephone: (202) 623-7430 ● Telefax: (202) 623-7201 E-mail: [email protected] ● Internet: http://www.imf.org International Monetary Fund Washington, D.C.
Transcript of Uganda: Selected Issues - International Monetary Fund · Uganda: Selected Issues ... Kenya’s...

© 2009 International Monetary Fund January 2009
IMF Country Report No. 09/37
Uganda: Selected Issues This Selected Issues paper for Uganda was prepared by a staff team of the International Monetary Fund as background documentation for the periodic consultation with the member country. It is based on the information available at the time it was completed on December 15, 2008. The views expressed in this document are those of the staff team and do not necessarily reflect the views of the government of Uganda or the Executive Board of the IMF. The policy of publication of staff reports and other documents by the IMF allows for the deletion of market-sensitive information.
Copies of this report are available to the public from
International Monetary Fund ● Publication Services 700 19th Street, N.W. ● Washington, D.C. 20431
Telephone: (202) 623-7430 ● Telefax: (202) 623-7201 E-mail: [email protected] ● Internet: http://www.imf.org
International Monetary Fund Washington, D.C.


INTERNATIONAL MONETARY FUND
UGANDA
Selected Issues
Prepared by Dmitry Gershenson, Iyabo Masha, and David Dunn
Approved by the African Department
December 15, 2008
Progress Toward Harmonization of Capital Account Regulations and Capital Market Integration in the East African Community
I. INTRODUCTION
1. In August 2007, at the 6th Extraordinary Summit of the East African Community (EAC) Heads of State, the leaders of the EAC member countries unanimously agreed to fast track the establishment of a regional common market and monetary union.1 The Summit’s communiqué set 2012 as the new target date for this economic integration, up from the previous target of 2015. The shortened timeline poses substantial challenges to the already complex convergence process, which necessitates compatible fiscal, monetary, and exchange rate policies and harmonized regulatory frameworks among member countries.2 This paper examines an important aspect of these preparations—the creation of a single unified EAC financial market—focusing on the key ingredients: harmonization of capital account regulations and capital market integration (CMI).3
2. A unified EAC financial market would offer several benefits to the regional economy. It would expand the opportunities for savings and investment financing, encourage more competition among banks and financial institutions, and lower transaction costs through
1 The EAC comprises Kenya, Tanzania, Uganda, Burundi, and Rwanda, the latter two of which became full members effective July 1, 2007.
2 See the “Report of the Committee on Fast-Tracking East African Federation”, submitted to the Sixth Summit of Heads of State of the East African Community (2004), and “Fast-Tracking Monetary Union in COMESA” by Musinguzi, et. al. (2006).
3 Data availability has limited the study to Kenya, Tanzania, and Uganda, which have already achieved some integration of trade policies; its conclusions apply a postiori to Burundi and Rwanda.

2
economies of scale. Greater diversification, risk management, and consumption smoothing would also be possible in a broader financial market, while monetary union would eliminate exchange rate risk within the region. Moreover, a larger and unified EAC financial market could lead to more efficient linkages to international financial markets, giving local firms, institutions, and individuals greater access to pools of international savings and further opportunities to diversify portfolios, manage risks, and increase returns. Bolstered by sound macroeconomic policies and strengthened institutional frameworks required for convergence to the monetary union, the enlarged EAC market could become increasingly attractive to foreign investors, thus providing much needed capital to accelerate economic growth.
3. But monetary union would also expose the EAC member countries to some additional risks, which would need to be mitigated. A unified financial market increases the possibility of contagion effects from fiscal or financial shocks in a neighboring country. For example, an excessive fiscal deficit in one country, would tend to create inflationary pressures and crowd out credit to the private sector throughout the union. Also, the failure of a financial institution would almost certainly be felt across borders. In addition, in a highly open capital market, the degrees of freedom of monetary and foreign exchange policies are more limited.
4. This paper proceeds by providing background on the current status of capital market integration and capital account regulations in the EAC, along with an empirical analysis of the extent of CMI. It then discusses implications for monetary and foreign exchange policies in a unified EAC financial market. The paper concludes with some suggestions on appropriate next steps.
Box 1. History of the East African Community
The EAC is a regional organization comprising Kenya, Tanzania, Uganda, Burundi, and Rwanda. Members of the EAC have a long history of economic cooperation, dating back to a customs union between Kenya and Uganda established in 1917, which Tanzania joined in 1922. An East African Currency Board issuing legal tender for the three countries was in existence during 1919–1965. Amidst severe unrest in the region, the precursor to the current EAC, collapsed in 1977. More than two decades later, the current EAC was formally launched in 2001 with the goals of introducing a customs union (by 2010), common market and monetary union with a common currency (by 2012), and ultimately a political union—the East African Federation, with a common President, and a common parliament. Since 2005, members have implemented a common external tariff, but due to overlapping membership of other regional organizations such as COMESA and SADC, exceptions have been made so that tariffs apply only to countries that are not members of these organizations.
3
II. CAPITAL MARKETS TODAY IN KENYA, TANZANIA, AND UGANDA4
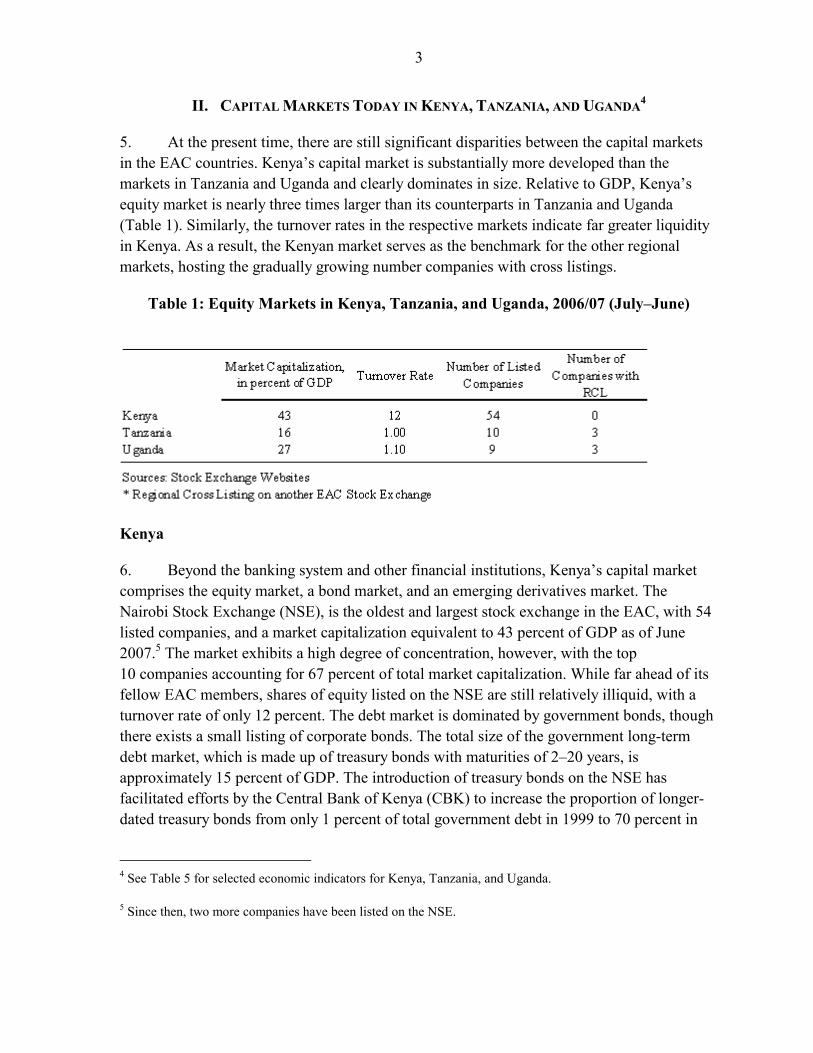
5. At the present time, there are still significant disparities between the capital markets in the EAC countries. Kenya’s capital market is substantially more developed than the markets in Tanzania and Uganda and clearly dominates in size. Relative to GDP, Kenya’s equity market is nearly three times larger than its counterparts in Tanzania and Uganda (Table 1). Similarly, the turnover rates in the respective markets indicate far greater liquidity in Kenya. As a result, the Kenyan market serves as the benchmark for the other regional markets, hosting the gradually growing number companies with cross listings.
Table 1: Equity Markets in Kenya, Tanzania, and Uganda, 2006/07 (July–June)
Kenya
6. Beyond the banking system and other financial institutions, Kenya’s capital market comprises the equity market, a bond market, and an emerging derivatives market. The Nairobi Stock Exchange (NSE), is the oldest and largest stock exchange in the EAC, with 54 listed companies, and a market capitalization equivalent to 43 percent of GDP as of June 2007.5 The market exhibits a high degree of concentration, however, with the top 10 companies accounting for 67 percent of total market capitalization. While far ahead of its fellow EAC members, shares of equity listed on the NSE are still relatively illiquid, with a turnover rate of only 12 percent. The debt market is dominated by government bonds, though there exists a small listing of corporate bonds. The total size of the government long-term debt market, which is made up of treasury bonds with maturities of 2–20 years, is approximately 15 percent of GDP. The introduction of treasury bonds on the NSE has facilitated efforts by the Central Bank of Kenya (CBK) to increase the proportion of longer-dated treasury bonds from only 1 percent of total government debt in 1999 to 70 percent in
4 See Table 5 for selected economic indicators for Kenya, Tanzania, and Uganda.
5 Since then, two more companies have been listed on the NSE.

4
2007.6 Six corporate bonds are also traded on the NSE. For the derivatives market, anecdotal accounts from commercial banks point to well functioning cross border arrangements—mostly with financial organizations in London and Johannesburg—and dealings in equities and short-term treasury instruments, undertaken through “nominee accounts” at commercial banks.7
7. The NSE continues to play an important role in the privatization of state-owned enterprises. In the recent privatization of the government’s stake in a telecom services provider, Safaricom, the issue was more than five times over-subscribed. More than 750,000 Kenyans applied for an allotment and cross-border interest was also high, especially from Uganda. But due to capital controls, the cross-listing of the initial public offering was not allowed in Tanzania, thus preventing a portion of EAC residents, firms, and investment funds from openly participating.
Tanzania
8. Unlike the NSE which started as a private sector initiative, the Dar es Salaam Stock Exchange (DSSE) was established primarily to implement the government’s privatization program. The DSSE was incorporated in 1996, and as of June 2007 had a combined listing of ten companies, three of which were cross-listed companies primarily listed on the NSE. The combined market capitalization was TSh 3,411 billion (16 percent of GDP) at that time. Even more than in Kenya, the degree of concentration was very high, with the two largest listed companies accounting for 95 percent of total market capitalization. The market was also illiquid with a turnover rate of 1.0 percent in 2006/07, while block trades of holdings of institutional investors accounted for a substantial portion of total transactions. In the debt segment of the capital market, four corporate bonds are listed. Treasury bonds (maturities of 2–10 years) are listed as well. As of end-June 2007, the total face value of Treasury bonds listed was TSh 661 billion (3.4 percent of GDP).
Uganda
9. The Uganda Securities Exchange (USE) became operational in 1998 and presently has 9 listings, with a market capitalization of about 27 percent of GDP as of June 2007. As
6 Other factors that contributed to the change in the structure of government debt include: (i) recent changes in the investor base for government debt, including non-bank financial institutions; (ii) the use of government securities with greater than one-year maturities for liquidity management purposes; (iii) rising credibility of macroeconomic policies and strengthening debt management framework; and (iv) improved assessments of sovereign credit risk.
7 The authorities have not begun to systematically collect data on transactions in the derivatives market, so information on activity is still quite limited.

5
indicated by the low turnover rate (1.1 percent of beginning year market capitalization in 2006/07), the market is relatively illiquid. The shares of three Kenyan companies (Kenya Airways, East African Breweries, and Jubilee Insurance) are cross-listed. Four corporate bonds are traded on the USE, as well as government bonds, which range in maturity from 2–10 years.
Investor base of the EAC stock exchanges
10. The investor base in the EAC is not as diverse as in advanced economy capital markets. The three main categories of investors are individual retail investors, institutional investors, and foreign investors.
11. Individual investors. The proportion of capital market assets held by individual investors in the EAC has increased considerably in recent times, largely as a result of broad based participation in privatized public enterprises. At the NSE, where 26 percent of the investor base is retail, the recent Ken Gen IPO was particularly popular among retail investors from around the region. In Uganda, the demand of individuals for securities is relatively insignificant, partly due to the limited choice in the market. However, investors have taken advantage of cross border offerings, such as the recent KenGen IPO. As with Kenya, interest in the equity market in Tanzania was spurred by the privatization exercise. However, enthusiasm is often not sustained, especially when the fortunes of the companies wane.
12. Institutional investors. Institutional investors are the dominant participant on the EAC stock exchanges. In Kenya they hold more than half of the assets of the exchange. The demand for equities from the pension industry in particular, has increased substantially following recent pension reforms, including the creation of the Retirement Benefits Authority (RBA). This also appears to be the case for Tanzania and to a lesser extent, Uganda.
13. Foreign investors. There are generally two classes of foreign investors in the EAC stock exchanges. The first one is of companies that are strategically owned or controlled by foreign companies. Most of the listed companies’ with large capitalization fall within this category. The second categories are foreign holders of assets on the capital market. This class of foreign investors are mainly portfolio investors in search of higher yields. While the former originates as foreign direct investment, the latter is short term portfolio flow. Kenya appears to have a good mix of both, though the short term portfolio flows appear to be more sensitive to market conditions. Foreign participation in the Uganda securities exchange is not substantial, and appears to be limited to the bond market. In the case of Tanzania, foreign participation is mostly in the form of foreign direct investment. Due to capital account restrictions, there is no official foreign investment in Tanzanian government securities, but indirect avenues are available mainly through local branches of multinational commercial banks.

6
Market Structure and Legal and Regulatory Framework
14. All of the three stock exchanges have multiple trading boards, with a segment for large well-capitalized companies and another for smaller companies with lower capitalization. In the NSE and USE, a third segment caters to fixed income securities while in Tanzania, a third segment is an over-the-counter (OTC) list. A capital markets authority (CMA) in each of the three countries provides the regulatory and supervisory framework. The Kenya CMA appears to be taking the lead in formulating corporate governance guidelines for the region. The USE appears better integrated than the DSSE to the NSE, and Ugandan residents’ interest in the regional capital market appears strong.
15. Kenya, Tanzania, and Uganda share a common legal tradition, based on British common law, which has enhanced cooperation among the three countries. Due to Kenya’s advanced status in capital market development, the legal and regulatory frameworks in Tanzania and Uganda were largely designed with the objective of minimizing deviations from the Kenyan securities law so as to facilitate the regional integration agenda. Under the auspices of the Capital Market Development Committee (CMDC), considerable effort has gone into further harmonizing the legal and regulatory frameworks in the three countries. Disclosure rules and financial and accounting standards are also being reformed, and a framework developed by the Kenyan CMA has been recommended for adoption throughout the EAC with appropriate modifications in individual jurisdictions.
16. The NSE and Kenya’s CMA coordinated the drafting of harmonized foreign investor rules for EAC members. Upgraded trading rules were presented to the East African Member States Securities Regulation Authorities (EASRA) for EAC-wide harmonization, and the USE has harmonized its listing rules with those of the NSE. The NSE has also taken the lead in developing common market infrastructure and regulations, and the exchanges have progressed towards common trading and settlement rules and procedures. In November 2006, the Uganda Securities Exchange and Nairobi Stock Exchange went further by signing an agreement to cross list over 35 blue chip companies and merge the exchanges within two years. There are plans to set up the East African Central Depository System, for the dematerialization of securities, and the exchanges are examining different technology systems that would foster cooperation and integration through an electronic trading platform for the subregion. But despite progress in several areas (Table 2), challenges remain, and major obstacles have to be overcome if full regional integration is to be achieved.
Empirical Evidence of Market Integration
17. The EAC has taken some important steps towards fostering an integrated capital market through institutional and structural polices, but how far has actual integration progressed? If capital markets are fully integrated, all economic agents will have identical rules and face equal access to financial instruments or services in the markets. Investors and

7
firms will have the same access to the market, trading, clearing and settlement platforms regardless of country of origin. For these reasons, prices should converge in the different countries.
18. One way to empirically determine the extent of integration in EAC countries is to subject the regional capital market to a test of the law of one price. That is, if assets have identical risks and returns, they should be priced identically, regardless of where they are transacted. Given a homogeneous asset, such as a government bond8, of similar maturity, the extent of dispersion of the yield for different countries could be a measure of the degree of integration. If the law of one price holds, the yield should be equal across countries, assuming that credit risk does not play a major role in the pricing of government debt. Similarly, well integrated equity markets should exhibit similar returns, especially within sectors.
19. In order to investigate the extent of integration in the EAC market, an analysis of the spread between the yield on local bonds and a representative regional benchmark bond is undertaken relying on Adam et al (2002)9. If the markets are perfectly integrated, the yield spread should be equal to zero. For the purpose of this analysis it will be assumed that the Kenyan bond market is the benchmark market, considering its size and level of development, and that it is the market to which other capital markets are converging. Defining ΔRt,i as the change in the yield on a bond in country i (Uganda or Tanzania) at time t, and ΔRb,t as the change in the yield on a comparable asset in Kenya, the benchmark country, the following equation is estimated:
ΔRi,t = α i,t + β i,t ΔR b,t + εi,t
where α i,t is the intercept, β i,t is the coefficient with respect to the benchmark Kenyan asset, and ε i,t is the country specific shock.
8 The analysis is based on the government bond market because the underlying asset is more homogenous than, say, corporate bonds, which in any case have a relatively small market in the EAC.
9 The empirical analysis of integration will focus only on the bond market.

8
Table 2. Status of Capital Market Integration in Kenya, Tanzania, and Uganda Initiative Objective Action Plan Harmonized Not Harmonized Legal and Regulatory framework
Harmonization of market rules and regulations in the three countries
One regulatory regime by June 2009 (structure to be determined)
Common English legal system; Framework for Collective Investment Schemes; Guidelines on the issue of corporate debt; Cross border listing requirements regulations
Trading rules and procedures (Manual Vs Automated) Cross Border Dispute resolutions Central Depository System Legislation Compliance with International Organization of Securities Commissions (IOSCO) principles
Market Infrastructure
General market development, including the development and integration of market infrastructure (trading, settlement, clearing and depository systems)
Common trading platform by December 2008 EAC capital markets law presented by June 2008 Ownership of exchange Demutualization of each exchange by June 2008 Merge by June 2009 A model, fully integrated capital market with one regional stock exchange (by Dec. 2009)
Common market structure Establishment of a regional CDS & Automated Trading Systems Regional certification program Cross border listings
Pension sector reform (ongoing in Uganda and Tanzania)
Disclosure, financial and accounting standards
Developing regional standards on disclosure and financial reporting
Uniform application of disclosure, financial and accounting standards
Disclosure requirements Compliance with International Financial Reporting Standards (IFRS) Corporate governance guidelines
Domestic investor status for all East Africans (adopted only by Kenya) Harmonization of tax rates, incentives and incidences (ongoing)
Credit sharing EAC Central Bankers working group agreement on cross-border sharing of data (i.e. common definition of terms, data formats, etc.) Cross-country analysis of common problems, consensus and status quo Agreements/contracts between Central Banks on information sharing Construction of national database Licensing of credit bureaus
Development of a regional rating system for securities Development of a credit reference bureau to facilitate risk assessment of investors. Improve access to finance and lower costs by enabling borrowers to build reputational collateral across the EAC Unified EAC credit market supported by reliable and cost-effective credit information Develop a sustainable, competitive credit bureau industry across EAC Respect individual privacy and incorporate consumer protections
None.
EAC Banking Supervision Harmonization Working Group EAC Credit Bureau Association
Sources: Websites of the Nairobi Stock Exchange, Dar-es-Salam Stock Exchange, and Uganda Securities Exchange.

9
20. Increasing integration requires (i) the intercept, α, to be close to zero; (ii) the coefficient with respect to the Kenyan asset, β i,t, to converge to 1; and (iii) the proportion of variance explained, ΔRt,i, by the common factor, ΔRb,t to increase towards 1. The above specification should hold for several reasons. If the EAC capital market is fully integrated, (i) follows from the fact that yield changes in Uganda or Tanzania should not be systematically larger or smaller than those in Kenya, the benchmark country. Secondly, (ii) should hold since the β i,t, depends on both the correlation between Tanzania or Uganda yield changes, and the ratio between their changes and Kenya’s yield volatility. As integration of the market progresses, yield changes would increasingly be driven by common factors, and less by idiosyncratic factors, and the correlations will converge to 1. Thirdly, to the extent that assets are relatively homogenous, and comparable across countries, the country specific error term εi,t should shrink as integration increases. This is another measure of integration in the model.
21. The equation was estimated using data on government bond yields of various maturities. For Tanzania and Kenya, the yield on government bond of 5-year maturity was used for the estimation, while for Uganda and Kenya, the yield on a 2-year bond was used.
Country Period covered
Maturity of bond
Uganda - Kenya 2005 - 2008 n=21
5 year 0.2 -0.07
(.208) (0.127)
Tanzania - Kenya 2002 - 2008 n=25
2 year 0.53 0.09
(0.32) (0.17)
T statistic in parenthesis.
Table 3. Estimation Results of Bond Yield Convergence in the EACβα
22. The results of the two estimations show that the integration of the EAC capital markets has been limited over the period of analysis, and prices are not converging towards the prevailing yields in Kenya, the benchmark market. In both estimations, the intercept was large, while the coefficient with respect to Kenyan yields was smaller, implying that the changes in the local yield were driven more by idiosyncratic and country specific factors than by “regional” factors. In addition, none of the coefficients was significantly different from zero. Further examination of the residuals does not show a systematic reduction over time. Though more recent data show some shrinking of the residual, (Figure 1), it is difficult to draw a systematic conclusion from the movement.

10
23. The results of the estimation support the view that the markets are not well integrated. While some of the structural and institutional issues identified could explain why integration is poor, it is also possible that macroeconomic policy divergence is a factor. Low demand for public listing by the private sector is another important factor. A recent World Bank study10 found that most firms still rely substantially on bank financing, and do not make significant use of the equity market for that purpose. Major factors found to limit the supply of equities include: i) the reluctance of many small, family-owned businesses to dilute ownership; ii) the tedious and costly process of making public offerings; and iii) the generally underdeveloped state of the private sector in the region.
24. To address these shortcomings, listing requirements need to be streamlined and relaxed to fit the structure and particular characteristics of business enterprises in the EAC. Procedures for public offerings and disclosure obligations should also be streamlined, while the number of market agents involved in the issuing process should be reduced.
Capital account regulations
25. For the EAC countries, capital account liberalization represents a logical progression from the introduction of financial market reforms, but the approach to liberalization has been more gradual, and the paths followed by the countries have been quite different. Uganda fully liberalized its capital account in the late 1990s and Kenya is nearly fully liberalized (Table 4). But Tanzania has maintained some controls on the capital account. In general, the countries tended to liberalize inflows before outflows, largely reflecting a cautious approach towards the possibility of capital flight.
10 Capital Market Integration in the East African Community (2002), The World Bank, Africa Region Financial Sector Division.

11
Figure 1: Government Bond Yields: Evolution of Country Residuals Relative to Kenya with Comparison to the European Union
Tanzania-Kenya Two Year Bond
-4.00
-3.00
-2.00
-1.00
0.00
1.00
2.00
3.00
4.00
2002
Q1
2002
Q3
2003
Q1
2003
Q3
2004
Q1
2004
Q3
2005
Q1
2005
Q3
2006
Q1
2006
Q3
2007
Q1
2007
Q3
Uganda-Kenya Five Year Bond
-1.50
-1.00
-0.50
0.00
0.50
1.00
1.50
2.0020
05Q
1
2005
Q3
2006
Q1
2006
Q3
2007
Q1
2007
Q3
2008
Q1
2008
Q3

12
Kenya: Gradual Liberalization
26. Kenya was a pioneer among EAC countries in achieving a high degree of liberalization of its capital account. The earliest liberalization of the capital account was the approval of limited foreign equity ownership of companies. For a very long time, at least until the 1980s, this was the only capital account transaction that was not restricted. A process of gradual liberalization commenced in the late 1980s, as part of an overall financial sector reform program. It was during this period that short term portfolio flows were de jure liberalized. However the pegged exchange rate regime of the period made the policy unsustainable partly because the central bank gave an implicit guarantee to speculators about the path of the exchange rate. The economy witnessed two episodes of strong speculative short term capital account inflows, followed by quick reversals, with serious macroeconomic consequences.
27. Beginning around 1993, new rounds of financial market reforms were introduced, which coupled with relatively strong macroeconomic management provided the much needed environment for liberalization to thrive. Most capital transactions were de jure liberalized with the enactment of the new Foreign Exchange Act. An interbank foreign exchange system was started in 1993, and all restrictions on remittances, dividends and expatriate earnings were lifted. Residents were also allowed to borrow abroad up to US$1.0 million. Foreigners were allowed to open foreign currency accounts in domestic banks and the restrictions on domestic borrowing by foreign controlled companies was removed.

13
Transaction Kenya Tanzania Uganda
11.1 Purchase locally by non-residents
(inflow)Permitted, up to 75% of share capital of listed company
Permitted, up to 60% of share capital of listed company Permitted
1.2 Sale or issue locally by non-residents (outflow)
Sales unrestricted, but issuance must be approved by Capital Markets Authority (CMA)
Only EAC companies may issue securities to public and be cross-listed on DSE; subject to approval by Capital Markets and Securities Authority (CMSA)
Permitted
1.3 Purchase abroad by residents (outflow)
Permitted Permitted if shares acquired by externally generated funds; purchases must be reported to BOT
Permitted
1.4 Sale or issue abroad by residents (inflow)
Both sale and issuance requires prior CMA approval
Restricted Permitted
2
2.1 Purchase locally by non-residents (inflow)
Yes Permitted, but purchase and redemption must be done in shillings
Permitted
2.2 Sale or issue locally by non-residents (outflow)
Permitted. CBK preapproval required.
Restricted Permitted
2.3 Purchase abroad by residents (outflow)
Permitted Permitted, but purchase and redemption must be done in shillings
Permitted
2.4 Sale or issue abroad by residents (inflow)
Permitted. CBK preapproval required.
Restricted Permitted
3
3.1 Purchase locally by non-residents (inflow)
Yes Restricted Permitted
3.2 Sale or issue locally by non-residents (outflow)
Sales permitted, but issuance must be pre-approved by Central Bank of Kenya (CBK)
Restricted Permitted
3.3 Purchase abroad by residents (outflow)
Yes Restricted Permitted
3.4 Sale or issue abroad by residents (inflow)
Both sale and issuance requires prior CBK approval
Restricted Permitted
3.4 Derivatives CBK approval required Restricted Permitted3.5 Collective Investment Securities Yes Restricted Info not available3.6 Direct Investment Permitted BOT approval required for outflows; inward
investments >$300K must be registered with Tanzania Investment Centre
Permitted
3.7 Commercial and Financial credits, guarantees, and
Permitted BOT approval required with respect to applications for foreign loans, O/Ds, structured external financing facilities, and deferred payment arrangements less than 1 year; reporting requirements (to BOT) apply to all transactions
Permitted
3.8 Personal Capital Transaction Permitted Restricted, except for gifts, inheritances, legacies and debt service payments (all subject to strict documentary requirements)
Permitted
3.9 Real Estate Transaction Purchases of real estate by non-residents requires government approval
Immovable property may be sold/transferred abroad to non-residents provided property was acquired through externally generated funds. Local sale and purchase of property by non-residents requires approval by Commissioner for Lands. Resident purchases of foreign property require BOT approval.
Purchase and sale of real estate by non-residents restricted; non-residents may be granted leases not exceeding 99 years.
44.1 Reserve requirement Info not available 10% unremunerated requirement (in Shilling) applied to
all deposits (including FX)Unremunerated cash reserves of 10% and 9% against demand and time deposits
4.2 Open FX position limits (percent of core capital; ceiling)
20% of core capital 20% 25%
4.3 Liquid asset requirement (percent of deposit liabilities; floor)
40 percent Not mentioned in the AREAER 20%
4.4 Institutional investors’ investments abroad
Retirement benefit funds may invest up to 15% of their funds abroad
General restriction applies: only externally generated funds may be invested abroad (and reported to BOT)
Info not available
4.5 Commercial banks’ deposits with financial institutions abroad
Permitted, subject to restriction on net open position
Restriction on net open position Should be less than 25 percent of total capital; and the financial institutions should have a good rating
4.6 Lending to non-residents (financial or commercial credits)
Permitted, subject to prudential regulations.
Restricted BOU approval required for any lending (to residents or non-residents) exceeding 25% of core capital
4.7 Lending locally in FX Permitted, subject to open position limits
Permitted, subject to open position limits Only short-term lending permitted; aggregate FX lending subject to ceiling of 80% of bank’s total FX deposits.
4.8 Commercial bank borrowing from abroad
Permitted Subject to reserve requirements (in Shilling) and external debt management regulations
Subject to reserve requirements
Sources: Country authorities; and Fund sources.
PROVISIONS SPECIFIC TO FINANCIAL SECTOR
Table 4. Capital Account Controls in the EAC
EQUITY SECURITIES
DEBT SECURITIES
MONEY MARKET INSTRUMENTS (maturity less than 1 year; T-bill included)

14
28. Further progress was made in liberalizing the capital account in subsequent years. Residents were permitted to invest funds abroad, including retaining funds in overseas accounts, and foreign investors were allowed to participate in the Nairobi Stock Exchange. In 1994, off shore borrowing by residents was allowed without limit provided that interest rates do not exceed LIBOR plus 2 percentage points and such borrowing is not guaranteed by the government. In 1995 exchange controls for locally controlled companies were relaxed subject to an aggregate limit of 20 percent and an individual limit of 2.5 percent. These were doubled to 40 percent and 5 percent respectively in June 1995 to help encourage foreign portfolio investments. A series of incentives are in place to encourage investments in the Nairobi Stock Exchange. A favorable tax regime exempts listed securities from stamp duty, capital gains tax and value added tax. Withholding tax on dividends is low at 5 percent for residents and 10 percent for non-residents. In December 1995, the entire Exchange Control Act was repealed.
Uganda: Full Liberalization
29. Capital account liberalization took place in Uganda in spite of the relatively shallow financial market. The need to attract capital in order to supplement low levels of domestic savings, facilitate privatization, and reduce excessive reliance on foreign aid were important motivating factors. Liberalization began de jure in 1990 with the launching of a new foreign exchange regime, which removed all surrender requirements on exports, as well as other foreign exchange inflows. In addition, residents were allowed to open foreign currency deposits. In order to attract more FDI and portfolio flows, a new Investment Code was enacted, with very generous provisions for repatriation of capital and dividends. In 1997, a comprehensive capital account liberalization was undertaken as part of a privatization reform.
Tanzania: Cautious Liberalization
30. Tanzania has taken a gradual approach toward capital account liberalization and still maintains a number of restrictions. During the 1990s, as part of the larger reforms of the financial sector, capital account liberalization specifically relating to FDI was introduced and, in a two-stage process—first in 1991 and later in 1997—foreign exchange controls largely eliminated. Most restrictions on portfolio investment were maintained to discourage short-term flows and possible capital flight. Notably, nonresidents are not permitted to purchase government securities, capital transfers to all countries remain subject to approval by the authorities, and Tanzanian residents are not permitted to make portfolio investments abroad. In 1997, however, against the background of the plan to commence trading activity on the Dar es Salaam Stock Exchange, foreign investment in listed companies and corporate bonds was allowed with some limitations.
The Structure of Capital Flows
31. The current structure of capital inflows to the countries has changed from the 1990s when it was dominated by FDI. During the same period, while FDI has remained more or less
15
StandardMean Deviation Volatility
Total inflows 3.1 2.1 0.7FDI 2.3 1.8 0.7Portfolio 0.32 0.7 2.2Private debt 0.2 1.0 4.6
Source: IMF African Department database.
Table EAC: Private Capital Flows' Volatility, 2000–07(Capital flows are in percent of GDP)
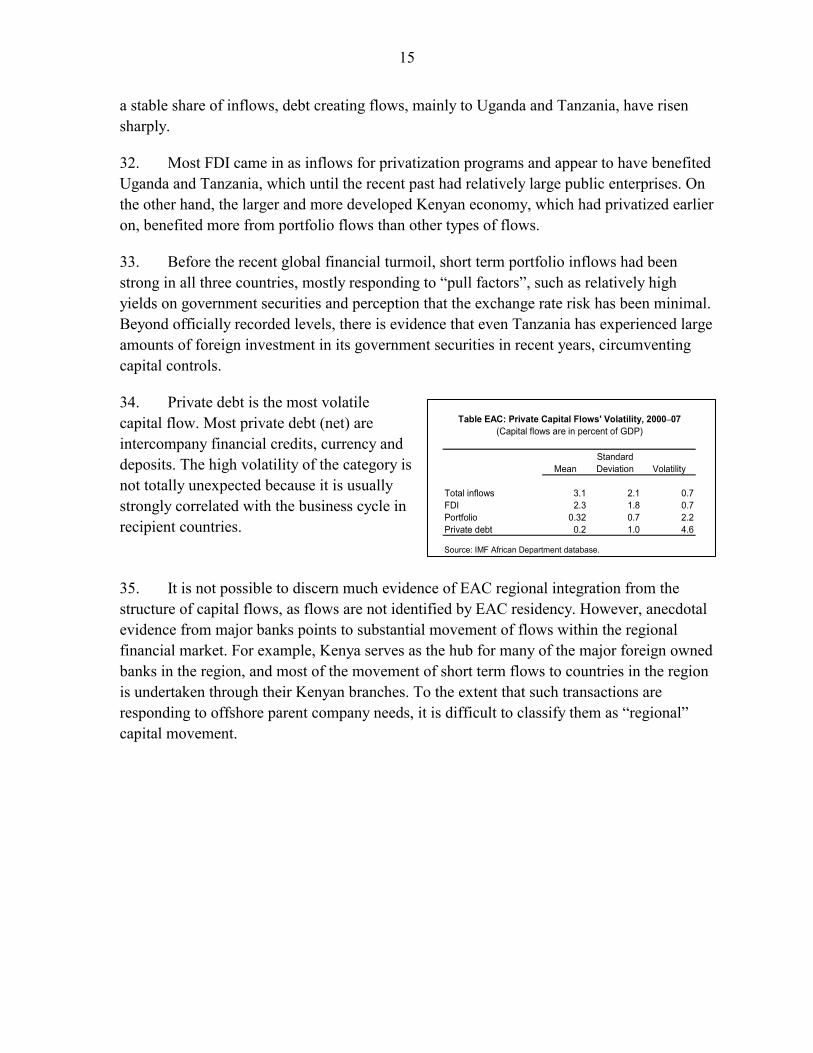
a stable share of inflows, debt creating flows, mainly to Uganda and Tanzania, have risen sharply.
32. Most FDI came in as inflows for privatization programs and appear to have benefited Uganda and Tanzania, which until the recent past had relatively large public enterprises. On the other hand, the larger and more developed Kenyan economy, which had privatized earlier on, benefited more from portfolio flows than other types of flows.
33. Before the recent global financial turmoil, short term portfolio inflows had been strong in all three countries, mostly responding to “pull factors”, such as relatively high yields on government securities and perception that the exchange rate risk has been minimal. Beyond officially recorded levels, there is evidence that even Tanzania has experienced large amounts of foreign investment in its government securities in recent years, circumventing capital controls.
34. Private debt is the most volatile capital flow. Most private debt (net) are intercompany financial credits, currency and deposits. The high volatility of the category is not totally unexpected because it is usually strongly correlated with the business cycle in recipient countries.
35. It is not possible to discern much evidence of EAC regional integration from the structure of capital flows, as flows are not identified by EAC residency. However, anecdotal evidence from major banks points to substantial movement of flows within the regional financial market. For example, Kenya serves as the hub for many of the major foreign owned banks in the region, and most of the movement of short term flows to countries in the region is undertaken through their Kenyan branches. To the extent that such transactions are responding to offshore parent company needs, it is difficult to classify them as “regional” capital movement.

16
Figure 3: Total Private Capital Flows for the Kenya, Tanzania, and Uganda, 2000–07 (In millions of U.S. dollars)
Source: IMF African department REO database.
FDI-Inflows
0
500
1,000
1,500
2,000
2,500
3,000
3,500
4,000
4,500
Kenya Tanzania Uganda
Portfolio_inflows
0
200
400
600
800
1,000
1,200
1,400
1,600
1,800
2,000
Kenya Tanzania Uganda
Private Capital Debt Flows
-600
-400
-200
0
200
400
600
800
Kenya Tanzania Uganda
Total Private Capital Inflows
0
1,000
2,000
3,000
4,000
5,000
6,000
Kenya Tanzania Uganda

17
III. CMI AND MACROECONOMIC MANAGEMENT IN THE EAC
36. Macroeconomic management in the EAC is best understood in the context of the policy trilemma. The trilemma maintains that free cross-border capital mobility is compatible with either a fixed exchange rate or an independent monetary policy, but not with both (Obstfeld and Taylor, 2004). Thus, in countries with an open capital account, policymakers either focus on exchange rate stability at the expense of independent monetary policy (Kenya) or pursue an independent monetary policy while being more sanguine about the level of the exchange rate (Uganda). In contrast, policymakers in countries that restrict capital mobility have more freedom to pursue both exchange rate stability and an independent monetary policy (Tanzania).
37. It is worth noting, however, that the policy outcomes in the EAC have not been rigid “corner solutions.” At times, policymakers in Kenya may tolerate somewhat higher inflation in order to ease pressure on interest rates (IMF, 2007a). Until recently, the open capital account framework in Uganda was compatible with a tightly managed exchange rate and independent monetary policy due to the lack of foreign interest in Uganda’s assets (IMF, 2008c). In Tanzania, despite restrictions on capital flows that would have theoretically created freedom for independent monetary and exchange rate policies, there is evidence that existing restrictions have only limited effectiveness. Thus the Tanzanian authorities have had to allow some flexibility in the exchange rate, as they pursued monetary targets.
38. A simple model helps to visualize the impact of CMI on the set of options available to policymakers. It will demonstrate that, in the process of promoting CMI and the attendant free capital mobility, the policymakers’ room for maneuver will become more circumscribed.
39. Let Π(e, r) be the authorities’ inflation function. Operationally, the authorities in the EAC set a monetary target (base money) consistent with the target inflation rate Π. The monetary target is achieved by sterilizing excess liquidity, either through foreign exchange sales (leading to stronger appreciation pressures on the local currency) or open market operations (leading to higher domestic interest rates). In other words, the authorities select a feasible combination of nominal exchange rate appreciation e and nominal interest rate r consistent with the targeted level of base money and, by extension, with the target inflation rate Π.11 The function Π is decreasing in both e and r: a more appreciated exchange rate and a higher interest rate are consistent with low level of base money and, consequently, low inflation.
11 The exchange rate is expressed in terms of foreign currency per unit of domestic currency, so that e>0 indicates an appreciation.

18
-10
0
10
20
30
40
Jan-
99
Jan-
00
Jan-
01
Jan-
02
Jan-
03
Jan-
04
Jan-
05
Jan-
06
Jan-
07
Jan-
08
Kenya Tanzania Uganda
12 month inflation Core Inflation
-5
0
5
10
15
Jan-
99
Jan-
00
Jan-
01
Jan-
02
Jan-
03
Jan-
04
Jan-
05
Jan-
06
Jan-
07
Jan-
08
Kenya Tanzania Uganda
0
5
10
15
20
25
30
Jan-
98
Jan-
99
Jan-
00
Jan-
01
Jan-
02
Jan-
03
Jan-
04
Jan-
05
Jan-
06
Jan-
07
Jan-
08
Kenya Tanzania Uganda
90 day Tbill rate
60
80
100
120
140
Jan-
02
Jan-
03
Jan-
04
Jan-
05
Jan-
06
Jan-
07
Jan-
08
Kenya Tanzania Uganda
Exchange Rate, US$ per nat'l currency
40. The three-dimensional function Π is best represented on a two-dimensional surface by a set of isoinflation lines, similar to indifference curves from a standard economics textbook (Figure 1). Each isoinflation line represents a combination of exchange rate appreciation e and interest rate r that is consistent with the same inflation rate Π. Isoinflation lines are negatively-sloped: for a given rate of inflation (or a given growth rate of base money), lower interest rates must be balanced by a more appreciated exchange rate. Since, as explained above, Π is decreasing in e and r, higher isoinflation lines represent lower levels of inflation.12
12 The isoinflation lines need not be convex.

19
41. Consider first an economy with a completely closed capital account. In this case, exchange rate appreciation and interest rate can be set independently. There are, of course, policy and common sense constraints on r and e. Generally speaking, the authorities will be reluctant to set an interest rate that is too high or an exchange rate that is too appreciated. These constraints are represented by the vertical line r = R and the horizontal line e = E, respectively. The authorities are free to choose any feasible combination of interest rate r and exchange rate appreciation e that is consistent with the target inflation rate Π. The section AB on the isoinflation line (and the corresponding ranges of r and e) represent the authorities’ room for maneuver: these are the available combinations of r and e that are consisted with a given target for inflation (Figure 2).
42. We can use this representation to discuss the policy choices made by the EAC authorities in recent years. With higher inflation, stronger appreciation, and somewhat lower interest rates, Kenya would be on the lower isoinflation curve, higher, and to the left of both Tanzania and Uganda. Tanzania and Uganda would be on the same isoinflation curve, with Tanzania lower and to the right of Uganda due to lower appreciation and higher interest rates (Figure 3). In the similar vein, policy shifts in Uganda (2004) and Tanzania (2007) from open market operations to foreign exchange sales (and concomitant shifts to lower interest rate and more appreciated exchange rate) can be represented as moves to the left and up along the isoinflation curve (Figure 4).
43. By bringing about fuller capital account liberalization and (likely) additional foreign inflows, CMI will curb the authorities’ ability to set exchange rate and interest rate independently. In case of completely liberalized capital account and substantial capital flows, domestic interest rate r would be a function of world interest rate r* less expected appreciation of the domestic currency:
rt = rt* - Eet+1
This will collapse the range that used to represent the authorities’ room for maneuver under closed capital account to a single point C, with the corresponding point values of e* and r* for exchange rate and interest rate, respectively (Figure 5).

20
Low Inflation
High Inflation
r
e
Fig 1: Iso Inflation Lines
r = R
e = E
R r
Target Inflation Rate
AE
e
Room for maneuver
Room
for
man
euve
r
Fig 2: Closed Capital Account
Ke Ug
Tz
r
e
Fig 3: Macroeconomic Management in the EAC

21
Ug 0
Ug 1
Tz 1
Tz 0
e
r
Fig 4: Policy Shifts
C
r
e rt = r* + E et+1
Target Inflation Rate
r*
e*
No room for maneuver
Fig 5: Fully Liberated Capital Account
(not feasible)

22
44. In the case of a partially liberalized capital account, the domestic interest rate r would still be a function of the world interest rate r* less expected appreciation of the domestic currency. This relationship, however, would be “fuzzy”, due to imperfect information and barriers to the flow of capital:
rt =F( rt* - Eet+1 )
Thus, the function F is represented by a band rather than a line, implying room for maneuver (section DE in Figure 6) that is larger compared with the case of fully liberalized capital account, but still more restricted, compared with the case of a completely closed capital account. It is therefore likely that policy shifts discussed above (paragraph 9 and Figure 4) will become only partly feasible.
Policy Implications
45. CMI will necessarily limit the set of policy options available to national authorities. On a broad policy level, CMI would require a disciplined fiscal stance and good inflation performance. On a technical level, CMI would need to be supported by compatible monetary frameworks, consistent exchange rate policies, and uniformly regulated financial sectors. These themes are often discussed in the literature under the aegis of convergence criteria (see Box 1). In this paper, we abstract from the issue of whether meeting the convergence criteria should be a prerequisite for integration (for a discussion, see Schiavo, 2008) and instead concentrate on the implications of convergence for the conduct of macroeconomic policies on the national level.

23
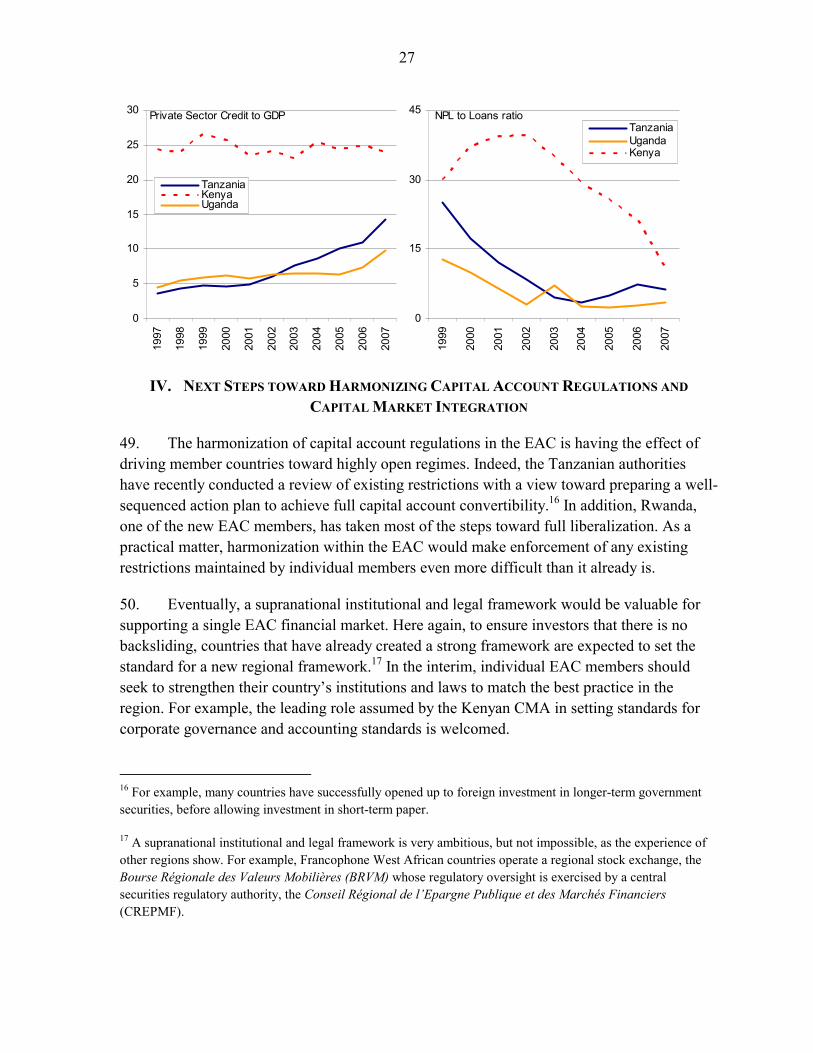
46. The EAC countries achieved considerable success in harmonizing some aspects of their macroeconomic polices, although significant challenges and cross-country variation still remain (text figures).
a. Fiscal deficits, both including and excluding grants, have often exceeded the relevant convergence criteria since the early 2000s, although Kenya has maintained a good track record on the latter. At the same time, there has been substantial variation from country to country, with strong consolidation in Uganda and slight expansion in Kenya and, until 2007/08, Tanzania. Moreover, Tanzania and Uganda are much more dependent than Kenya on (potentially volatile) donor inflows.
b. Reserve coverage (in months of imports) in Uganda was about double that of Kenya, with Tanzania seeing its coverage decline by a half over the past five years.
c. As noted above, inflation performance was generally good, with noticeably higher inflation in Kenya.13
13 Inflation in Kenya might be overstated due to an upward bias in the CPI computation methodology.
Box 2. Convergence criteria in the EAC and other regions
Convergence criteria constitute a set of rules that ensures compatibility of national economic policies with common regional ones. While the exact numerical criteria may vary depending on local circumstances, the underlying idea—that of keeping national policies from undermining the credibility of regional arrangements (IMF, 2005)—remains the same.
EAC 1/ CEMAC/WAEMU Eurozone
Fiscal deficit, excluding grants, % of GDP 6 or lower 3 or lowerFiscal deficit, including grants, % of GDP 3 or lowerBasic fiscal balance 2/ positiveReserves, months of imports 4 or higherExchange rate stable real ER within the "normal fluctuations margins" 3/Inflation, percent 5 or lower 3 or lower 1.5 percentage points or less 4/Interest rate 2 percentage points or less 4/Real GDP growth, percent 7 or higherDomestic savings, excluding grants, % of GDP 20 or higherPublic debt, % of GDP 70 or lower 60 or lowerNet change in gov't arrears no accumulationCurrent account def icit, excluding grants, % of GDP sustainable
Sources: EAC authorities, IMF (2008a, 2008b), and Schadler et. al. (2005).1/ Primary criteria in bold, secondary in italics.2/ Overall balance, excluding grants and foreign-financed investment.3/ Against the euro.4/ Compared with the three best-performing member states in terms of price stability.
Table. Regional convergence criteria

24
Fiscal Deficit (including grants), % of GDP
-10
-8
-6
-4
-2
0
219
97/9
8
1998
/99
1999
/00
2000
/01
2001
/02
2002
/03
2003
/04
2004
/05
2005
/06
2006
/07
2007
/08
Kenya Tanzania Uganda
Fiscal Deficit (excluding grants) % of GDP
-20
-16
-12
-8
-4
0
4
1997
/98
1998
/99
1999
/00
2000
/01
2001
/02
2002
/03
2003
/04
2004
/05
2005
/06
2006
/07
2007
/08
Kenya Tanzania Uganda
Reserve Coverage, months of imports
2
3
4
5
6
7
2000
/01
2001
/02
2002
/03
2003
/04
2004
/05
2005
/06
2006
/07
2007
/08
Kenya Tanzania Uganda
Real GDP Grow th
0
3
6
9
12
1520
00/0
1
2001
/02
2002
/03
2003
/04
2004
/05
2005
/06
2006
/07
2007
/08
Kenya Tanzania Uganda
Savings, % of GDP
0
5
10
15
20
25
2000
/01
2001
/02
2002
/03
2003
/04
2004
/05
2005
/06
2006
/07
2007
/08
Kenya Tanzania Uganda
Debt Service-to-Exports Ratio
-5
5
15
25
35
1997
/98
1999
/00
2001
/02
2003
/04
2005
/06
2007
/08
2009
/10
Kenya Tanzania Uganda

25
d. Real GDP growth in Tanzania and Uganda was high during the past decade, with Kenya more than doubling its growth rates to match those of Tanzania and Uganda.14 Savings rates were rising in Tanzania and Uganda to reach Kenya’s levels.
e. Debt indicators have improved dramatically, due to robust GDP and exports growth, and due to HIPC Initiative and MDRI debt relief provided to Tanzania and Uganda.
47. To summarize the above discussion, while the EAC members are committed to macroeconomic stability, they emphasize different components of the overall macroeconomic package. Thus, (i) policymakers in Kenya have allowed somewhat higher inflation; (ii) the fiscal stance has been more contractionary in Uganda; and (iii) in Tanzania the reserve cover has been shrinking in Tanzania.15 Some policy discrepancy is inevitable, given structural differences among the EAC economies and the asymmetric shocks they are subject to. Addressing other discrepancies will require political decisions on the part of the national authorities.
48. On a technical level, CMI will have to be supported by:
a. Compatible monetary framework. All EAC members now employ base money targeting to reach their monetary policy objectives, and most are considering a move towards inflation targeting (IT), partly because of the inherent difficulties associated with estimating the demand for money. Indeed, based on the Eurozone experience, Christl (2006) recommends adoption of IT as a strategy to foster macroeconomic stability. At the same time, successful IT requires “an effective monetary policy instrument, one that has a relatively stable relationship with inflation” (Blejer and Leone, 2000), such as short-term interest rates. Since the impact of interest rates on inflation in the EAC is tenuous, the choice of an appropriate monetary framework warrants further investigation.
b. Consistent approach to sterilizing foreign inflows. CMI could very well raise the volume of foreign inflows, both from outside and within the EAC. Keeping in mind that the policy responses to recent large capital inflows varied from country to country (see Box 2), coming up with a uniform EAC-wide policy will require substantial compromise. Specifically, an emphasis on foreign exchange sales in one
14 In Kenya, a decline of growth rates in 2008 was due to political unrest earlier in the year. The unrest has since ceased and the economy is recovering.
15 Mainly reflecting particularly strong import growth.

26
country would not be compatible with an emphasis on open market operations in another (and the attendant higher interest rates there).
c. Uniformly regulated financial sectors. Financial sectors are robust but relatively small in Tanzania and Uganda, while somewhat weaker but more sophisticated in Kenya. CMI has the potential of augmenting the depth and reach of financial sectors in the EAC’s less developed member countries, while imposing the highest regulatory standards on the entire membership.
Box 3. Policy response to strong foreign exchange inflows
Foreign exchange inflows into the EAC intensified in 2006 and 2007. To sterilize excess liquidity, the authorities in Tanzania and Uganda relied principally on open market operations, leading to higher interest rates and mounting sterilization costs. In Uganda, the authorities then allowed base money growth to exceed programmed targets to relieve the interest rate and budgetary pressures, while the Tanzanian authorities largely tried to adhere to the reserve money target, exceeding it by only a small margin (IMF, 2007b and 2007c). In contrast, the sterilization effort in Kenya was less aggressive from the outset, leading to somewhat higher inflation but more stable interest rates in recent years (IMF, 2007a).
Tanzania: Base money growth, percent
0
10
20
30
40
Mar
-05
Jun-
05
Sep-
05
Dec
-05
Mar
-06
Jun-
06
Sep-
06
Dec
-06
Mar
-07
Jun-
07
Sep-
07
Dec
-07
Program Actual
Uganda: Base money grow th, percent
5
10
15
20
25
Mar
-05
Jun-
05
Sep-
05
Dec
-05
Mar
-06
Jun-
06
Sep-
06
Dec
-06
Mar
-07
Jun-
07
Sep-
07
Dec
-07
Program Actual
27
0
5
10
15
20
25
30
1997
1998
1999
2000
2001
2002
2003
2004
2005
2006
2007
TanzaniaKenyaUganda
Private Sector Credit to GDP
0
15
30
45
1999
2000
2001
2002
2003
2004
2005
2006
2007
TanzaniaUgandaKenya
NPL to Loans ratio
IV. NEXT STEPS TOWARD HARMONIZING CAPITAL ACCOUNT REGULATIONS AND
CAPITAL MARKET INTEGRATION
49. The harmonization of capital account regulations in the EAC is having the effect of driving member countries toward highly open regimes. Indeed, the Tanzanian authorities have recently conducted a review of existing restrictions with a view toward preparing a well-sequenced action plan to achieve full capital account convertibility.16 In addition, Rwanda, one of the new EAC members, has taken most of the steps toward full liberalization. As a practical matter, harmonization within the EAC would make enforcement of any existing restrictions maintained by individual members even more difficult than it already is.
50. Eventually, a supranational institutional and legal framework would be valuable for supporting a single EAC financial market. Here again, to ensure investors that there is no backsliding, countries that have already created a strong framework are expected to set the standard for a new regional framework.17 In the interim, individual EAC members should seek to strengthen their country’s institutions and laws to match the best practice in the region. For example, the leading role assumed by the Kenyan CMA in setting standards for corporate governance and accounting standards is welcomed.
16 For example, many countries have successfully opened up to foreign investment in longer-term government securities, before allowing investment in short-term paper.
17 A supranational institutional and legal framework is very ambitious, but not impossible, as the experience of other regions show. For example, Francophone West African countries operate a regional stock exchange, the Bourse Régionale des Valeurs Mobilières (BRVM) whose regulatory oversight is exercised by a central securities regulatory authority, the Conseil Régional de l’Epargne Publique et des Marchés Financiers (CREPMF).
28
51. More specifically,
• Weak and inefficient judicial systems in individual countries present a drag on integration. The lack of a supranational court or arbitration mechanism also means that there is no clear forum for the resolution of cross-border disputes.
• The market environment in some countries is not yet fully supportive of integration, and gaps exist in institutional development. For example, Tanzania’s rules on cross listing do not support integration. Access to cross listing is limited by entry barriers, including the high cost of preparing a listing. The clearing and settlement systems that are not yet linked should be.
• Disparities should be narrowed. There are differences between Kenya, Tanzania, and Uganda in the treatment of capital gains, making it more attractive to invest through one market rather than another, creating inefficiencies and distortions.
• Kenya, Tanzania, and Uganda are still in the early stages of developing their credit information systems. To the extent that regional and centralized sources of credit information can only be superimposed on existing national systems, regional credit bureaus would develop only as national credit bureaus evolve.
• Macroeconomic convergence in the region, as well as more consistent policy frameworks, would ensure that idiosyncratic market characteristics that create divergence do not have a dominant impact on capital market prices.
• A common approach to monetary and foreign exchange policies among EAC members will be necessary as they progress toward greater integration, especially as the regional financial market becomes more integrated with global markets. The ongoing shift toward inflation targeting frameworks is a step in the right direction, but coordination among the members’ central banks will be needed going forward.
• To mitigate the risks of contagion, it will be critical to establish strong supervisory institutions and world-class prudential regulations for the financial sector. Adherence to sustainable fiscal balances, as represented by convergence criteria, is also critical. Taking steps now to build capacity in these areas would be welcomed.

29
2006/07 2007/08 2006/07 2007/08 2006/07 2007/08
Real SectorReal GDP growth (annual percent change) 6.7 3.5 6.9 7.3 8.6 9.5GDP in millions of US$ 24,521 30,143 16,359 20,296 11,906 14,529GDP per capita in US$ 720 869 420 521 399 470CPI inflation (annual percent change) 10.4 18.5 6.3 8.4 6.8 7.3
Fiscal SectorGovernment revenue 21.7 22.4 14.1 16.0 12.6 13.0Government spending 24.4 28.5 23.9 24.6 18.2 17.8Overall fiscal balance, excluding grants -2.7 -6.1 -4.9 -1.6 5.6 4.8External financing 1.5 2.6 8.7 10.4 7.0 5.6 Grants 0.9 1.2 4.9 7.0 4.5 2.7 Net lending 0.6 1.3 3.8 3.4 2.5 2.9Net domestic financing 2.0 1.1 1.2 -1.5 -1.0 -0.3
Financial SectorBroad money (M3) 35.3 36.3 24.8 26.1 18.1 20.5 (annual growth in percent) 16.0 18.2 20.7 22.7 17.4 31.8Credit to the private sector 25.5 29.7 10.8 13.4 8.6 11.5 (annual growth in percent) 11.7 33.9 36.4 44.6 22.9 56.1
External SectorExports of goods and services 25.5 25.1 12.6 12.9 16.6 19.8Imports of goods and services -35.2 -36.5 -26.5 -28.0 -27.8 -32.3Current account balance, excluding transfers -2.4 -4.5 -13.2 -14.2 -7.3 -9.1Current account balance, including transfers -2.4 -4.3 -9.9 -10.7 -2.7 -6.1Overall balance of payments 3.4 0.2 1.7 2.4 5.9 3.9Gross international reserves (in millions of U.S. dollars) 2,723 3,443 2,153 2,649 2,091 2,684 (in months of imports of goods and services) 3.0 3.3 3.6 3.8 5.3 6.3
Sources: Country authorities; and Fund staff estimates.
Table 5: Selected Economic Indicators for Kenya, Tanzania, and Uganda
(In percent of GDP, unless otherwise indicated)
Kenya Tanzania Uganda

30
References Adam, K., J. Tullio, A. Menichini, M. Padula, and M. Pagano, 2002, “Analyse, Compare and Apply Alternative Indicators and Monitoring Methodologies to Measure the Evolution of Capital Market Integration in the European Union,” CSEF (January) (Salerno: Centre for Studies in Economics and Finance).
Blejer, Mario I. and Alfredo M. Leone, 2000, “Introduction and Overview,” in Inflation Targeting in Practice, IMF.
Christl, Josef, 2006, “Regional Currency Arrangements: Insights from Europe,” International Economics and Economic Policy, 3, pages 209-219.
De Nicolo, Gianni, and Alexander Tieman, 2006, “Economic Integration and Financial Stability: A European Perspective,” IMF WP/06/296.
East African Community, 2004, “Report of the Committee on Fast Tracking East African Federation”, submitted to the Sixth Summit of Heads of State of the East African Community, Arusha, Tanzania.
IMF, 2005, “Monetary Union Among Members of the East African Community: Preconditions and Policy Directions,” Unpublished.
IMF, 2007a, “Kenya: Third Review Under the PRGF,” IMF Country Report No. 09/18.
IMF, 2007b, “Uganda: Second Review Under the PSI,” IMF Country Report No. 08/4.
IMF, 2007c, “United Republic of Tanzania: Second Review Under the PSI,” IMF Country Report No. 08/9.
IMF, 2008a, “West African Economic and Monetary Union: Staff Report on Common Policies of Member Countries”.
IMF, 2008b, “Central African Economic and Monetary Community—Staff Report on Common Policies of Member Countries”.
IMF, 2008c, “Private Capital Flows to Sub-Saharan Africa: Financial Globalization’s Final Frontier?” in Sub-Saharan Africa: Regional Economic Outlook, pages 45-73.
Irving, Jacqueline, 2005, “Regional Integration of Stock Exchanges in Eastern and Southern Africa: Progress and Prospects”, IMF Working Paper WP/05/122.
Katto, Japheth (2007), “Progress Towards East African Regional Capital Market Integration.” presentation at the Emerging Priorities in EAC Financial Sector Integration Workshop, Nairobi, Kenya
31
Musinguzi, Polycarp, Christopher K. Kiptoo, and Jonathan Chipili, September 2006, “Fast-Tracking Monetary Union in COMESA”, Common Market for Eastern and Southern African States (COMESA).
Obstfeld, Maurice, and Alan Taylor, 2004, Global Capital Markets: Integration, Crisis, and Growth, Cambridge UP.
Schadler, Susan, Paulo Drummond, Louis Kuijs, Zuzana Murgasova, and Rachel van Elkan, 2005, Adopting the Euro in Central Europe: Challenges of the Next Step in European Integration, IMF Occasional Paper 234.
Schiavo, Stefano, 2008, “Financial Integration, GDP Correlation and the Endogeneity of Optimum Currency Area,” Economica, 75, pages 168-189.
Sy, Amadou N. R., 2006, “Financial Integration in the West African Economic and Monetary Union,” IMF WP/06/214.
World Bank, 2002, Capital Market Integration in the East African Community.
World Bank, 2007, Emerging Priorities in East African Community Regional Financial Integration Workshop Proceedings.
World Bank, 2007, Regional Financial Integration in Two Regions of Sub-Saharan Africa. How Creating Scale in Financial Markets Can Support Growth and Development?