Uganda...Platform for Agricultural Risk Management | Managing risks to improve farmers'livelihoods...
122
Platform for Agricultural Risk Management Managing risks to improve farmers’ livelihoods Crop pests and disease management in Uganda: status and investment needs Full Report March 2017 Uganda Tools Assessment In collaboration with Study conducted by
Transcript of Uganda...Platform for Agricultural Risk Management | Managing risks to improve farmers'livelihoods...

International Fund for Agricultural Development (IFAD)
Via Paolo di Dono 44 - 00142 Rome (Italy)
[email protected] www.p4arm.org @parminfo
ContactsPARM Secretariat
Platform for Agricultural Risk ManagementManaging risks to improve farmers’ livelihoods
Crop pests and disease management in Uganda: status and investment needs
Full ReportMarch 2017
Uganda
Tools Assessment
In collaboration with
Study conducted by


Platform for Agricultural Risk Management | Managing risks to improve farmers’livelihoods
3/38Workshop Programme | January 2017
Plaformfor AgriculturalRisk Management
Managing risksto improve farmers’livelihoods

Platform for Agricultural Risk Management | Managing risks to improve farmers'livelihoods
Uganda
Crop pests and disease management in Uganda: status and investment needs
FINAL REPORT March, 2017
Study conducted by
Delivered by:
M. Kansiime, J. Mulema, D. Karanja, D. Romney and R. Day

Platform for Agricultural Risk Management | Crop pests and disease management in Uganda: status and investment needs
Foreword
The Platform for Agricultural Risk Management (PARM), a G8-G20 initiative hosted by the International Fund
for Agricultural Development (IFAD), is a multi-donor partnership co-financed by the European Commission
(EC), Agence Française de Développement (AfD), Italian Government and IFAD, to support Governments and
stakeholders on Agricultural Risk Management (ARM). The Platform works in strategic partnership with
NEPAD / CAADP in African countries to mainstream agricultural risk management into the national
agricultural policy and investment plans (www.p4arm.org). The German cooperation support PARM through
an agreement KfW-NEPAD. Current work supports ARM assessment and policy process in Cabo Verde,
Cameroon, Ethiopia, Liberia, Mozambique, Niger, Senegal, Zambia and Uganda.
In Uganda, the work on ARM started with NEPAD and FAO in 2013, and PARM had its risk assessment
workshop in June 2015, always in partnership with the Ministry of Agriculture, Animal Industry and
Fisheries (MAAIF). This report on Crop Pests and Disease Management in Uganda responds to a major risk
priority that was identified in the risk assessment study (PARM 2016) and discussed with the Governments
and the stakeholders. The study was conducted by the Centre for Agricultural Bioscience International
(CABI) and delivered by M. Kansiime, J. Mulema, D. Karanja, D. Romney and R. Day. It includes an
analysis of the status of the plant heat control system in Uganda and an investment proposal to upgrade it to
reduce significantly the losses associated with plant pests and diseases.
The content of the report was discussed with the Government in several occasions, in particular with the
Department for Crop Protection and the Commissioner Mr. Byantwale T. Stephen that participated in the
specific session during the High level Workshop in Kampala in November 2016. The engagement and
feedback from MAAIF and from other participants in the workshop have contributed to improve this report and
investment plan. We hope that it contributes to enhance and to align the efforts of the Government of Uganda
and its development partners to improve the management of a major risk for Ugandan agriculture and
economy: plant pests and diseases.

Platform for Agricultural Risk Management | Crop pests and disease management in Uganda: status and investment needs
ii Uganda | Tools Assessment | Full Report | March 2017
Contents List of Tables ...................................................................................................................... v List of Figures ................................................................................................................... vi List of Boxes ..................................................................................................................... vi Acronyms and abbreviations .......................................................................................... vii Executive Summary .......................................................................................................... ix Why the need to invest in Uganda’s pest management systems? ........................................................................ ix What are the risks ................................................................................................................................................. ix What is already being done ................................................................................................................................... x Investing in addressing Uganda's pest problems and reducing crop losses ......................................................... x What can be achieved through the investment plan? ............................................................................................ x How will the investment plan be implemented? ................................................................................................... xii Who will finance the investment plan? ................................................................................................................ xiii Government funding ............................................................................................................................................ xiii Donor support ..................................................................................................................................................... xiii Cost recovery/cost sharing .................................................................................................................................. xiii Private sector support ......................................................................................................................................... xiii What are the next steps? .................................................................................................................................... xiii Graphical summary .............................................................................................................................................. xv
1. Introduction and rationale ............................................................................................. 1
1.1 Background to the study and rationale ............................................................................................................ 1
1.1.1 Importance of agriculture ........................................................................................................................ 1 1.1.2 Farming systems and agricultural development ..................................................................................... 1 1.1.3 Pests and disease risk in Uganda (overview) ......................................................................................... 2 1.1.4 Pest and disease risk management – rationale ...................................................................................... 3
1.2 Objective of the study ...................................................................................................................................... 3 1.3 Approach ......................................................................................................................................................... 4
1.3.1 Data sources and collection methods ..................................................................................................... 4 1.3.2 Data analysis and presentation .............................................................................................................. 4 1.3.3 Data validation ........................................................................................................................................ 5
2. Root causes for plant pest and disease risk in Uganda .............................................. 6
2.1 Overview of value chains and geographic distribution .................................................................................... 6
2.1.1 Coffee ..................................................................................................................................................... 6 2.1.2 Banana ................................................................................................................................................... 6 2.1.3 Cotton ..................................................................................................................................................... 7 2.1.4 Cassava.................................................................................................................................................. 7 2.1.5 Maize ...................................................................................................................................................... 7 2.1.6 Rice ........................................................................................................................................................ 8 2.1.7 Beans ..................................................................................................................................................... 8 2.1.8 Potato ..................................................................................................................................................... 8 2.1.9 Fruits and vegetables ............................................................................................................................. 8
2.2 Pests and diseases affecting key value chains ............................................................................................... 8
2.2.1 Coffee ..................................................................................................................................................... 8 2.2.2 Banana ................................................................................................................................................... 9 2.2.3 Cotton ..................................................................................................................................................... 9 2.2.4 Cassava.................................................................................................................................................. 9 2.2.5 Maize .................................................................................................................................................... 10 2.2.6 Rice ...................................................................................................................................................... 10 2.2.7 Beans ................................................................................................................................................... 10 2.2.8 Potato ................................................................................................................................................... 10 2.2.9 Fruits and vegetables ........................................................................................................................... 11
2.3 Root causes for the pests not being effectively controlled ............................................................................ 14
2.3.1 New pests spread ................................................................................................................................. 14 2.3.2 Poor farm level management................................................................................................................ 15

Full Report | October 2016 iii
Uganda | Tools Assessment | Full Report | March 2017 iii
Platform for Agricultural Risk Management | Crop pests and disease management in Uganda: status and investment needs
2.3.3 Counterfeit chemicals ........................................................................................................................... 16 2.3.4 Poor quality seed .................................................................................................................................. 17 2.3.5 Poor farm soil fertility and nutrient management .................................................................................. 18 2.3.6 Other factors ......................................................................................................................................... 18
2.4 Current pest management options ................................................................................................................ 22
3. Legal and institutional framework for pest management .......................................... 25
3.1 Relevant legal documents ............................................................................................................................. 25
3.1.1 National Development Plan .................................................................................................................. 25 3.1.2 National Agricultural Policy (NAP) 2013 ............................................................................................... 26 3.1.3 Agriculture Sector Strategic Plan (ASSP) ............................................................................................. 27 3.1.4 The Plant Protection and Health Act, 2016 ........................................................................................... 29 3.1.5 The Agricultural Chemicals (Control Act) 2006 ..................................................................................... 31 3.1.6 The Seeds and Plant Act 2006 ............................................................................................................. 31 3.1.7 Biosafety and biotechnology bill 2012 .................................................................................................. 31
3.2 Stakeholders ................................................................................................................................................. 32
3.2.1 MAAIF .................................................................................................................................................. 32 3.2.2 Department of Crop Protection (DCP) .................................................................................................. 33 3.2.3 Research .............................................................................................................................................. 33 3.2.4 Education.............................................................................................................................................. 34 3.2.5 Local Government ................................................................................................................................ 34 3.2.6 Private sector actors and value chain actors ........................................................................................ 35 3.2.7 Dissemination/information service providers ........................................................................................ 36 3.2.8 Donors .................................................................................................................................................. 37
3.3 Issues related to the legal and institutional framework .................................................................................. 38
3.3.1 Crop protection and sustainable intensification .................................................................................... 39 3.3.2 Pesticide policy ..................................................................................................................................... 39 3.3.3 Pesticide registration ............................................................................................................................ 40 3.3.4 Integrated Pest Management (IPM) ...................................................................................................... 40 3.3.5 Clarification of MAAIF Departments' responsibilities ............................................................................ 41 3.3.6 Public private partnership ..................................................................................................................... 41 3.3.7 Plant biosecurity planning ..................................................................................................................... 42
3.4 Summary and recommendations for pest management ................................................................................ 42
4. Cost-benefit and sustainability of pest management initiatives ............................... 43
4.1 Introduction ................................................................................................................................................... 43
4.2 Initiatives involved in agro-advisory services and approaches used ............................................................. 43
4.2.1 Intensive interpersonal interactions ...................................................................................................... 44 4.2.2 Moderately intensive interpersonal interactions .................................................................................... 45 4.2.3 Mass media .......................................................................................................................................... 47 4.2.4 Private sector led approaches .............................................................................................................. 48
4.3 Regional initiatives for pest management ..................................................................................................... 49
4.4 Pest management technologies in Uganda ................................................................................................... 51
4.5 Cost efficiency of extension methods ............................................................................................................ 52
4.5.1 Cost ingredients of extension approaches ............................................................................................ 53 4.5.2 Cost per farmer for different extension approaches .............................................................................. 54 4.5.3 Cost efficiency of extension approaches using estimated adoption rates ............................................. 55 4.5.4 Speed of information spread................................................................................................................. 56
4.6 Summary and recommendations for pest management ................................................................................ 57
5. Potential to promote information technologies for pest management .................... 58
5.1 Introduction ................................................................................................................................................... 58
5.2 Potential of mobile in delivery of agricultural services ................................................................................... 58

Platform for Agricultural Risk Management | Crop pests and disease management in Uganda: status and investment needs
iv Uganda | Tools Assessment | Full Report | March 2017
5.3 Potential for information technology in data collection and sharing ............................................................... 59
5.4 Potential for information technology to trach and monitor pests .................................................................... 60
5.4.1 Current pest monitoring systems .......................................................................................................... 60 5.4.2 Current use of ICT for pest monitoring ................................................................................................. 60 5.4.3 Integration of pest monitoring with new online statistics system ........................................................... 61
5.5 Summary and recommendations for ICT ...................................................................................................... 61
6. Sustainable pest management – Investment strategy ............................................... 63
6.1 Introduction ................................................................................................................................................... 63
6.2 Intervention areas ......................................................................................................................................... 64
6.3 Investment plan ............................................................................................................................................. 66
6.3.1 Goal ...................................................................................................................................................... 66 6.3.2 Development Objective ........................................................................................................................ 66 6.3.3 Strategic Outcomes .............................................................................................................................. 66 6.3.4 Priority interventions and cost implications ........................................................................................... 67 6.3.5 Universal e-agriculture service platform ............................................................................................... 79 6.3.6 Logical framework ................................................................................................................................ 80
6.4 Budget summary by result and activity .......................................................................................................... 82
6.5 Work plan ...................................................................................................................................................... 85
6.6 Partnerships for sustainable implementation................................................................................................. 87
6.6.1 Partnerships ......................................................................................................................................... 87 6.6.2 Financing the investment strategy ........................................................................................................ 87 6.6.3 Way forward ......................................................................................................................................... 88
Bibliography ..................................................................................................................... 90
Appendices ...................................................................................................................... 96
Appendix 1 .................................................................................................................................................... 96
Appendix 2 .................................................................................................................................................... 98
Appendix 3 .................................................................................................................................................. 100

Full Report | October 2016 v
Uganda | Tools Assessment | Full Report | March 2017 v
Platform for Agricultural Risk Management | Crop pests and disease management in Uganda: status and investment needs
List of Tables
Table 1: Some estimates of economic losses in Uganda for specific pests ................................................ 3
Table 2: Summary of key pests and diseases of key value chains in Uganda, their distribution and
economic losses ......................................................................................................................... 12
Table 3: Major crop pests and diseases in Uganda and available management options .......................... 22
Table 4: Interventions under the Agriculture Objective in the NDPll ......................................................... 26
Table 5: Extract of ASSP Budget (NDPII constrained version) covering crop and livestock pests and
diseases (figures in UGX billions) ............................................................................................... 28
Table 6: Extract of ASSP Budget (NDPll constrained version) showing additional budgets related to crop
and livestock pests and disease (figures in UGX billions) ........................................................... 28
Table 7: Some definitions from the IPPC Glossary and the Plant Protection and Health Act ................... 30
Table 8: Factors encouraging pesticide use (Waibel, 1991) ..................................................................... 39
Table 9: Some changes envisaged by ASSP that have implications for pest management ..................... 41
Table 10: Typology of pest management practices from a communication’s perspective .......................... 52
Table 11: Cost ingredients associated with selected extension approach .................................................. 53
Table 12: Variable costs associated with administration of extension methods .......................................... 54
Table 13: Cost efficiency estimates for various extension methods ............................................................ 56
Table 14: Literacy and media usage key figures ......................................................................................... 58
Table 15: Roles of key stakeholder groups in implementing actions from prevention to control and costs
incurred by the different groups .................................................................................................. 64
Table 16: Priority crops under the ASSP, their production and market arrangements and key stakeholders
.................................................................................................................................................... 65
Table 17: Recommended time allocation to different interpersonal extension methods ............................. 72
Table 18: Priority skills and areas of knowledge for training DCP staff ....................................................... 78
Table 19: Logical framework ....................................................................................................................... 81
Table 20: Recurring costs following project end ......................................................................................... 88

Platform for Agricultural Risk Management | Crop pests and disease management in Uganda: status and investment needs
vi Uganda | Tools Assessment | Full Report | March 2017
List of Figures
Figure 1: Agricultural production zones in Uganda ...................................................................................... 2
Figure 2: Root causes contributing to the spread of pests and diseases ................................................... 20
Figure 3: Root causes associated with poor farm level management of pests and diseases..................... 21
Figure 4: Structure of the Department of Crop Protection .......................................................................... 33
Figure 5: Possible trajectories of crop intensification under ASSP. A: unsustainable intensification. B:
sustainable intensification ........................................................................................................... 39
Figure 6: Tradeoff of different extension approaches based on desired reach and impact ........................ 44
Figure 7: Pest invasion curve and actions at different stages .................................................................... 63
List of Boxes
Box 1: Promoting seed entrepreneurship in Tanzania, the case of QDS system ................................................. 18
Box 2: Community awareness and collective action key to disease containment ................................................ 18
Box 3: Description of control of crop and livestock pests and diseases from ASSP ............................................. 27
Box 4 Responsibilities of a National Plant Protection Organization (from IPPC Article lV) ................................... 29
Box 5: Members of the Plant Protection and Health Technical Committee .......................................................... 30
Box 6: Functions of MAAIF (from ASSP) .............................................................................................................. 32
Box 7: Successful DCP-Private sector collaboration in pest management ........................................................... 36
Box 8: Parallel data management systems based on farmer profiles ................................................................... 61
Box 9: DCP involvement in management of a pest affecting a gazetted value chain ........................................... 71

Full Report | October 2016 vii
Uganda | Tools Assessment | Full Report | March 2017 vii
Platform for Agricultural Risk Management | Crop pests and disease management in Uganda: status and investment needs
Acronyms and abbreviations
AAPBP Australia-Africa Plant Biosecurity Partnership ACDP ACTED
Agriculture Cluster Development Project Agency for Technical Cooperation and Development
AGINSBA Agricultural Innovation System Brokerage Association AGRA Alliance for a Green Revolution In Africa ASARECA Association for Strengthening Agricultural Research in East and
Central Africa ASDP Agriculture Sector Development Plan ASHC Africa Soil Health Consortium ASIS Agricultural Statistics and Information System ASSP Agricultural Sector Strategic Plan ATI Agricultural Training Institutes API Application program interface BXW Banana Xanthomonas Wilt CAADP Comprehensive African Agricultural Development Program CABI Centre for Agricultural Biosciences International CBSD Cassava Brown Streak Disease CDO Cotton Development Organisation CGIAR Consultative Group on International Agricultural Research CKW Community Knowledge Workers CMD Cassava Mosaic Disease COMESA Common Markets for Eastern And Southern Africa CWD Coffee Wilt Disease DCP Department of Crop Protection EAC East African Community EAHB East African Highland Banana FAO Food and Agriculture Organization of the United Nations FEWSNET Famine Early Warning System Network FFS Farmer Field Schools FIP Framework Implementation Plan FRI Farm Radio International GDP Gross Domestic Product GPC Global Plant Clinic ICT Information Communication and Technology ICT4AG Information Communication and Technology for Agriculture IFAD International Fund for Agricultural Development IPM Integrated Pest Management IPM-CRS Integrated Pest Management - Collaborative Research Support
Program IPPC International Plant Protection Convention ISSD Integrated Seed Sector Development LG Local Government MAAIF Ministry of Agriculture, Animal Industry and Fisheries MADDO Masaka Diocese Development Organisation MLND Maize Lethal Necrosis Disease MNOs Mobile Network Operators NAADS National Agricultural Advisory Services NaCRRI National Crop Resources Research Institute NAP National Agricultural Policy NARI National Agricultural Research Institute NARL National Agricultural Research Laboratories NARO National Agricultural Research Organisation NARS National Agricultural Research System NDA National Drug Authority NDL National Diagnostic Laboratory NDP National Development Plan NGO Non-Government Organization NPPO National Plant Protection Organization PARM Platform for Agricultural Risk Management SHA Self Help Africa SMS Short Message Service SNF Safe Neighborhood Foundation SOCADIDO Soroti Catholic Diocese Integrated Development Organization SPS Sanitary and Phytosanitary
Platform for Agricultural Risk Management | Crop pests and disease management in Uganda: status and investment needs
viii Uganda | Tools Assessment | Full Report | March 2017
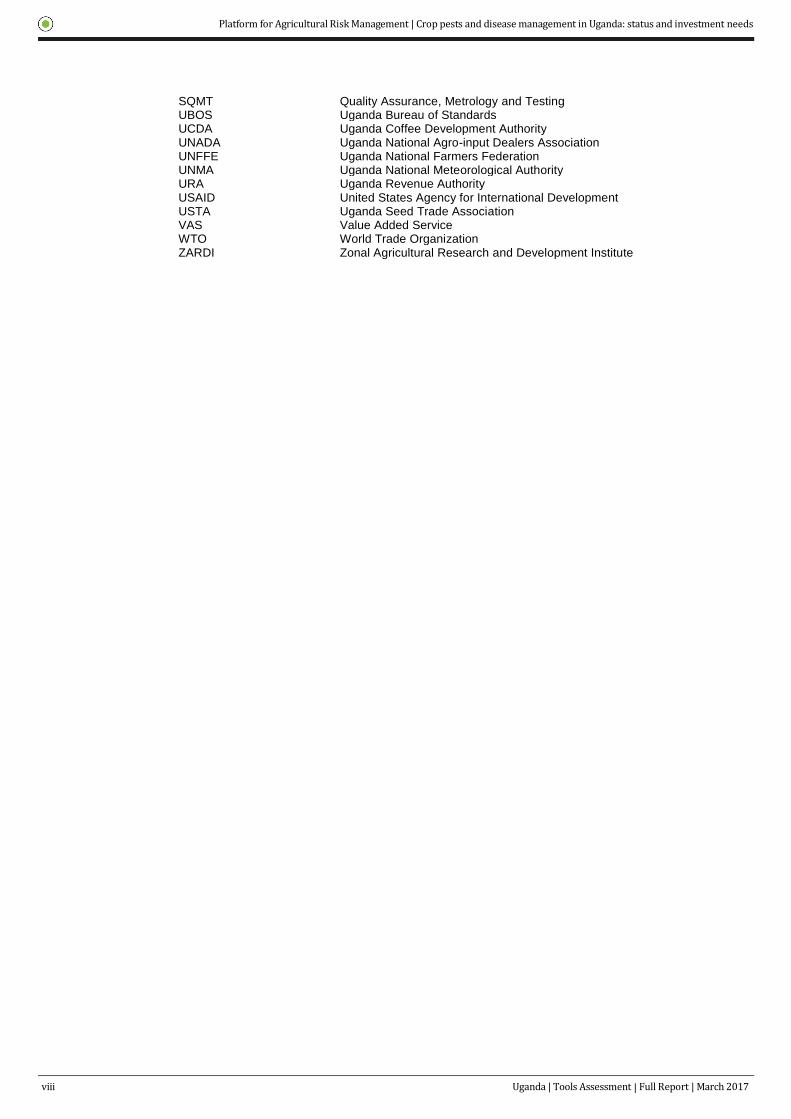
SQMT Quality Assurance, Metrology and Testing UBOS Uganda Bureau of Standards UCDA Uganda Coffee Development Authority UNADA Uganda National Agro-input Dealers Association UNFFE Uganda National Farmers Federation UNMA Uganda National Meteorological Authority URA Uganda Revenue Authority USAID United States Agency for International Development USTA Uganda Seed Trade Association VAS Value Added Service WTO World Trade Organization ZARDI Zonal Agricultural Research and Development Institute

Full Report | October 2016 ix
Uganda | Tools Assessment | Full Report | March 2017 ix
Platform for Agricultural Risk Management | Crop pests and disease management in Uganda: status and investment needs
Executive Summary
This report provides a comprehensive overview of the root causes for pest and disease risk in Uganda; the pests and diseases that affect key value chains and current management options; and the Ugandan legal and institutional framework for pest management and key actors. A review of the cost-effectiveness of different extension and communication approaches is provided, as well as of existing information and communication technology (ICT) approaches, to inform recommendations for an investment plan for future pest management, including the potential to further utilise ICTs.
To reduce crop losses due to pests and diseases, the detailed investment plan for the medium term is proposed to ensure establishment of sustainable pest management systems and to help achieve Uganda’s national targets for improving agricultural productivity and exports by 2020.
Why the need to invest in Uganda’s pest management systems?
Agriculture in Uganda provides approximately 24% of gross domestic product (GDP), generates nearly 48% of export earnings, and provides direct and indirect livelihood support to 80% of all households. Agriculture is thus fundamental to the country’s economic growth and to attaining middle income status by 2020.
The agriculture sector is one of three priority areas in the 2nd
National Development Plan (NDPII), which covers the period 2015/2016 to 2019/2020. The plan includes four strategic objectives to increase production and productivity in the agriculture sector and stimulate export. The NDPII’s more detailed Agriculture Sector Strategic Plan (ASSP) has a vision for ‘a competitive, profitable and sustainable sector’, and its mission is ‘transforming the sector from subsistence farming to commercial agriculture’.
From the current US$1.3bn in agricultural exports, the ASSP has a target of US$4bn by 2019/20; 73% of this projected growth is expected from crops. Under the ASSP, the government has taken a commodity-based value chain approach as a cost-effective way to spur agricultural production and realise productivity. Selected priority value chains include bananas, beans, cassava, citrus, coffee, cotton, maize, rice, and tea.
Actual economic losses from plant diseases are hard to find in Uganda and in many other African countries (PARM 2017). However the Agricultural Risk Assessment Study by PARM/IFAD (PARM 2016) concluded that crop pest and diseases have very high frequency and very high average and maximum severity. Crop pest and diseases have the highest risk score in that report and deserve to be a priority.
What are the risks?
Crop pests, diseases and weeds are identified as the greatest risk to Ugandan agriculture and, unless addressed, the ASSP objectives are at risk. Losses due to pests and diseases are estimated at: 10-20% (pre-harvest); 20-30% (post-harvest); and up to 100% for perishable crops and export crops. Annual losses in the priority crops suffering the highest monetary loss due to pests are estimated at: US$ 35-200 million (bananas), US$60-80 million (cassava), US$10 million (cotton) and US$8 million (coffee).
Examples of key pests that are seriously constraining any increases in agricultural productivity in priority crops, include: coffee wilt disease, banana xanthomonas wilt (BXW), cassava brown streak virus, fruit flies and citrus canker.
Pest spread and potential economic impact depends on various factors including: the value chain affected; geographical location; management practices available at farm level and; whether the pest is categorised as well-established or new:
1. Well-established pests: Two broad categories are identified that reflect the level of risk:
a) Likely to cause losses each season unless managed.
b) May occasionally occur in larger outbreaks.
The impact of such pests can be high where there is limited farmer awareness of solutions, limited extension support, lack of practical solutions, and counterfeit or poor quality inputs (chemicals and seed).
2. New pests: New and emerging pests and diseases can be serious impediments to production and the ability
to respond effectively to such pests will be necessary to achieve ASSP targets. Actions will be different for the following categories:
a) Those not yet in the country.
b) Those that are newly present in the country but not yet occupying all ecologically suitable areas.

Platform for Agricultural Risk Management | Crop pests and disease management in Uganda: status and investment needs
x Uganda | Tools Assessment | Full Report | March 2017
Key factors contributing to the introduction and spread of new pests and diseases include inadequate border and internal controls and limited enforcement of material movement regulations, particularly planting materials. Outbreaks may also go unnoticed due to lack of information on these pests/diseases to inform decision-making.
Of the priority pests identified for Uganda, most are already widespread and action is required to manage them. However, in recent years several major new pests have arrived in Uganda, including Tuta absoluta (moth), Maize
Lethal Necrosis Disease (MLND) and certain species of fruit fly. Actions are therefore needed to address both categories of established and new pests.
What is already being done?
The policy and legal framework for pest management in Uganda has recently been strengthened with the 2015 Plant Protection and Health Act. However, an institutional framework is only fully adequate if it can be implemented. The Department of Crop Protection (DCP) and other stakeholders currently do not have sufficient capacity for implementing, monitoring and, where necessary, enforcing regulations. In addition, the proportion of the ASSP budget allocated to crop protection is relatively small and not adequate for the substantial increase in capacity required for DCP to fulfil all of its responsibilities to achieve an effective national pest management system.
Several donor-funded projects related to pest and disease management, or including relevant components, are also being implemented in Uganda, including World Bank and IFAD support to Agricultural Technology and Agribusiness Advisory Services (ATAAS). ATAAS aims to transform and improve the performance of ATAAS systems in Uganda and will end in December 2017. The World Bank supported program Agricultural Cluster Development Project (ACDP, US$150 million) started in January 2017 and will end in March 2022. Although pest risk management is not an ACDP priority, there are various areas where planned actions intersect with the proposed investment strategy in pest management.
Investing in addressing Uganda’s pest problems and reducing crop losses
To significantly reduce risk and incidence of pests and disease, three main areas are of central importance:
1) availability of and response to information on pest/disease occurrence; 2) access to pest management support services needed by farmers and other value chain actors; and 3) capacity of the Ministry of Agriculture, Animal Industry and Fisheries (MAIFF), including the DCP, to lead and
co-ordinate crop pest risk management across the country.
Interventions in the above areas provide the three key components of the proposed investment plan, which details a 5-year program with an overall budget of US$23.88 million. The plan is expected to reduce crop losses, as a result of reduced risk from pests and diseases, leading to increased production and productivity of key crops, and increased household level incomes for smallholder farmers.
The proposed investment plan takes into consideration MAAIF’s existing plans and efforts and, in the medium term, aims to strengthen capacity of agricultural institutions (particularly DCP and extension) and to establish systems and structures for effective pest management. Complementarity with other large investments such as ACDP is also considered.
What can be achieved through the investment plan?
To establish sustainable pest management systems and structures for effective pest management in Uganda, the proposed investment plan aims to achieve a number of key outcomes under three main components:
Component 1 (US$ 11 million): Establish cost-efficient information and response systems to detect and monitor plant pests and diseases, providing timely information to MAAIF (and other relevant stakeholders) to effectively respond to pest situations.
Effective response to pest risks requires knowledge of the location and abundance of pests. Currently, in Uganda, little information is gathered to support short or long-term pest management decision-making, which means that responses are often ‘too little, too late’. The government has access to some contingency funds for emergency response, and the private sector is likely to contribute where commercial Value Chains are affected. However, response depends on monitoring systems to collect data on outbreaks or new pests from various sources.

Full Report | October 2016 xi
Uganda | Tools Assessment | Full Report | March 2017 xi
Platform for Agricultural Risk Management | Crop pests and disease management in Uganda: status and investment needs
To help address this situation and the root causes contributing to the introduction and spread of new pests, we propose that cost-effective mechanisms are established for collecting the information, and to put in place the procedures to ensure a timely and effective response. Proposed interventions include:
i) Operationalisation of emergency pest response plans (US$0.32 million).
The 2015 Plant Protection and Health Act provides for a Plant Protection and Health Technical Committee (PPHTC) lead by the Commissioner for Crop Protection, with broad stakeholder representation from public and private sector. A key role of the PPHTC would be to develop and oversee implementation and regular review of overall, and sector/value chain specific, emergency pest response plans. PPHTC should co-opt additional private sector and civil society participants to prepare the plans, which will specify roles and responsibilities of different actors, including financing mechanisms for emergency operations.
ii) Effective pest monitoring at border points decreasing risk of new pest incursions (US$0.30 million).
Preventing the entry and establishment of new pests is a cost-effective strategy. Although some pests spread naturally, cross border movement and trade is a key factor in spread of pests. Currently, only 5 of the 30 gazetted border posts are manned by DCP. Analysis to determine and monitor the risks is required, with deployment of additional trained and equipped inspectors focusing initially on borders where risks are greatest e.g. Entebbe airport and other major import routes.
iii) Pest surveillance system established to provide early warning (US$10.33 million) Note: system also provides advisory services Pest information will be collected from various sources, and integrated into database systems to provide early warning and the opportunity for effective tactical and strategic responses. This will be overseen by a joint working group established under the Agricultural Risk Management National Steering Committee (ARM-NSC), who will also ensure that the integrated data meets the needs of various users. The ARM-NSC is, according to the MAAIF Framework implementation plan for statistics and risk management, a unit to streamline collection and use of agricultural data. Plant clinics are a key source of surveillance data as they collect valuable data on pest problems, it is therefore proposed to scale up the current network of clinics from 100 to 1200. Regular updates of appropriate samples of households will allow tracking of pest problems and costs for strategic decision-making. 1,500 local government extension staff and supervisors will be trained and equipped with tablet computers (or smart phones). Data will also be provided by specific surveillance undertaken by DCP or others as necessary, and through crowd sourcing tools (e.g. youth chat group U-report, which has been used to track cases of BXW), to verify pest occurrences and extend of spread.
Note: Although plant clinics have been budgeted under surveillance, a large part of their value is that they also provide pest management advisory services. Whilst the majority of the investment for this component is for establishing a pest surveillance/advisory system, once the system is in place and capacity strengthened, operational costs will be approximately US$1.2 million/yr. Of this, US$0.9 million is estimated cost of staff allowances that would be needed whatever tasks staff undertake.
Component 2 (US$4.41 million): Improved access to pest management services by smallholder farmers and
other value chain actors to effectively manage plant pests and diseases.
The root cause analysis found that farm level management of pests is inadequate for a number of reasons. Two major factors are: 1) farmers are not aware of management options and how to implement them; 2) farmers are unable to access quality inputs required for risk management. To address these problems, activities are proposed under two key outputs:
i) Improving farmer awareness of pest and disease management, including through mass media (US$2.39 million).
Although MAAIF is investing in more extension staff, they need regular training to keep up-to-date with new approaches, including using ICTs. Training of extension staff to deliver advice at plant clinics which also contributes to a pest early warning system, is budgeted under component 1. However, not all farmers can be reached directly so a number of media awareness campaigns are proposed, based on pest information system data identifying outbreaks, or indicating common problems occurring at particular times of year/climatic conditions. Campaigns will also focus on the importance of using good quality seed and clean planting material (see below). Opportunities for expanding the use of other national and international databases on pest management information to strengthen advice will be identified, and appropriate Application Program Interfaces (APIs) developed.
ii) Improving access to high quality inputs (crop protection products and seed) (US$2.01 million).
Adulterated and counterfeit products currently discourage farmers from investing in input use. However, whilst input use by Ugandan farmers is generally low, agricultural commercialisation is expected to lead to increased use, particularly as higher incomes result from improved market opportunities. A key component
Platform for Agricultural Risk Management | Crop pests and disease management in Uganda: status and investment needs
xii Uganda | Tools Assessment | Full Report | March 2017
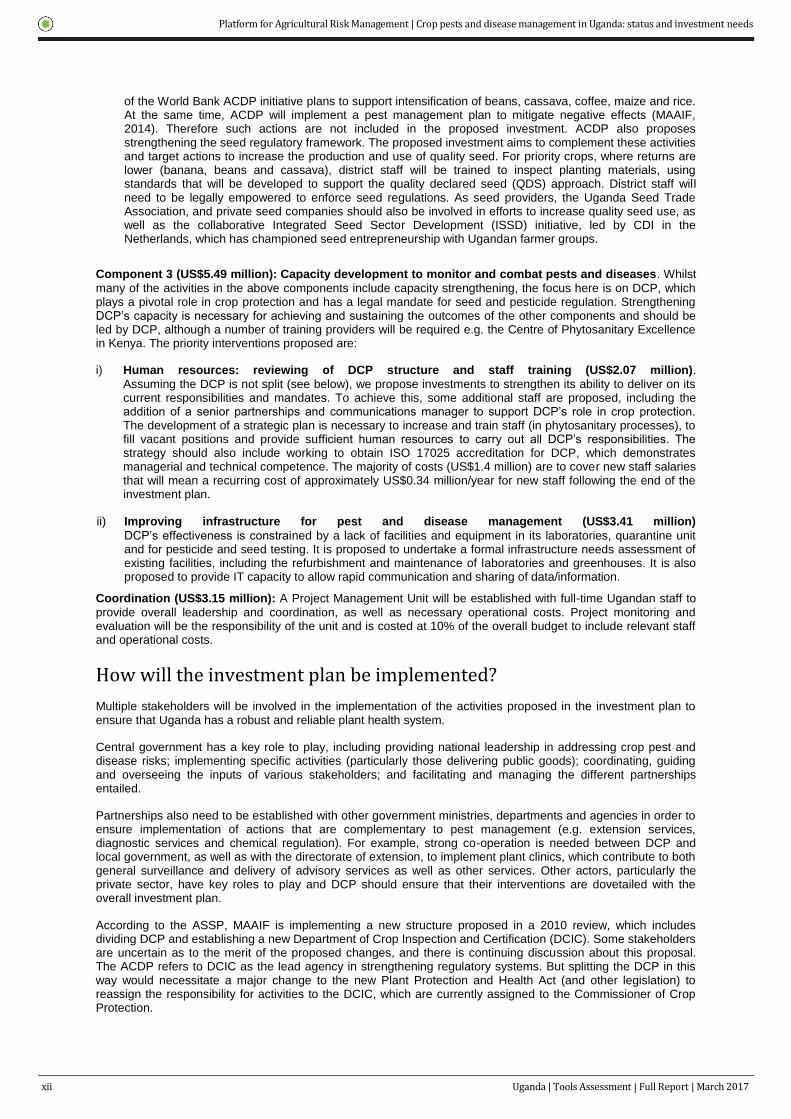
of the World Bank ACDP initiative plans to support intensification of beans, cassava, coffee, maize and rice. At the same time, ACDP will implement a pest management plan to mitigate negative effects (MAAIF, 2014). Therefore such actions are not included in the proposed investment. ACDP also proposes strengthening the seed regulatory framework. The proposed investment aims to complement these activities and target actions to increase the production and use of quality seed. For priority crops, where returns are lower (banana, beans and cassava), district staff will be trained to inspect planting materials, using standards that will be developed to support the quality declared seed (QDS) approach. District staff will need to be legally empowered to enforce seed regulations. As seed providers, the Uganda Seed Trade Association, and private seed companies should also be involved in efforts to increase quality seed use, as well as the collaborative Integrated Seed Sector Development (ISSD) initiative, led by CDI in the Netherlands, which has championed seed entrepreneurship with Ugandan farmer groups.
Component 3 (US$5.49 million): Capacity development to monitor and combat pests and diseases. Whilst
many of the activities in the above components include capacity strengthening, the focus here is on DCP, which plays a pivotal role in crop protection and has a legal mandate for seed and pesticide regulation. Strengthening DCP’s capacity is necessary for achieving and sustaining the outcomes of the other components and should be led by DCP, although a number of training providers will be required e.g. the Centre of Phytosanitary Excellence in Kenya. The priority interventions proposed are:
i) Human resources: reviewing of DCP structure and staff training (US$2.07 million).
Assuming the DCP is not split (see below), we propose investments to strengthen its ability to deliver on its current responsibilities and mandates. To achieve this, some additional staff are proposed, including the addition of a senior partnerships and communications manager to support DCP’s role in crop protection. The development of a strategic plan is necessary to increase and train staff (in phytosanitary processes), to fill vacant positions and provide sufficient human resources to carry out all DCP’s responsibilities. The strategy should also include working to obtain ISO 17025 accreditation for DCP, which demonstrates managerial and technical competence. The majority of costs (US$1.4 million) are to cover new staff salaries that will mean a recurring cost of approximately US$0.34 million/year for new staff following the end of the investment plan.
ii) Improving infrastructure for pest and disease management (US$3.41 million)
DCP’s effectiveness is constrained by a lack of facilities and equipment in its laboratories, quarantine unit and for pesticide and seed testing. It is proposed to undertake a formal infrastructure needs assessment of existing facilities, including the refurbishment and maintenance of laboratories and greenhouses. It is also proposed to provide IT capacity to allow rapid communication and sharing of data/information.
Coordination (US$3.15 million): A Project Management Unit will be established with full-time Ugandan staff to
provide overall leadership and coordination, as well as necessary operational costs. Project monitoring and evaluation will be the responsibility of the unit and is costed at 10% of the overall budget to include relevant staff and operational costs.
How will the investment plan be implemented?
Multiple stakeholders will be involved in the implementation of the activities proposed in the investment plan to ensure that Uganda has a robust and reliable plant health system.
Central government has a key role to play, including providing national leadership in addressing crop pest and disease risks; implementing specific activities (particularly those delivering public goods); coordinating, guiding and overseeing the inputs of various stakeholders; and facilitating and managing the different partnerships entailed.
Partnerships also need to be established with other government ministries, departments and agencies in order to ensure implementation of actions that are complementary to pest management (e.g. extension services, diagnostic services and chemical regulation). For example, strong co-operation is needed between DCP and local government, as well as with the directorate of extension, to implement plant clinics, which contribute to both general surveillance and delivery of advisory services as well as other services. Other actors, particularly the private sector, have key roles to play and DCP should ensure that their interventions are dovetailed with the overall investment plan.
According to the ASSP, MAAIF is implementing a new structure proposed in a 2010 review, which includes dividing DCP and establishing a new Department of Crop Inspection and Certification (DCIC). Some stakeholders are uncertain as to the merit of the proposed changes, and there is continuing discussion about this proposal. The ACDP refers to DCIC as the lead agency in strengthening regulatory systems. But splitting the DCP in this way would necessitate a major change to the new Plant Protection and Health Act (and other legislation) to reassign the responsibility for activities to the DCIC, which are currently assigned to the Commissioner of Crop Protection.
Full Report | October 2016 xiii
Uganda | Tools Assessment | Full Report | March 2017 xiii
Platform for Agricultural Risk Management | Crop pests and disease management in Uganda: status and investment needs
Who will finance the investment plan?
Finance for the investment plan is likely to come from a variety of sources. The overall budget has been estimated at US$23.88 for a 5 year program of interventions. Some elements of the plan may be implemented as externally funded independent projects or private sector activities. Efforts should be made to embed such projects within the overall investment plan.
Government funding
With many of the ‘public good’ activities (e.g. supporting value chains and farmers that are not highly commercial, where there is limited involvement of the private sector), the government is expected to be the primary financier. Recurring costs will be required, as part of organizations’ mandates, and these should be funded through regular budget lines as soon as possible, if not immediately. These include the costs of additional staff to be recruited to fill existing vacancies, as well as to staff the additional posts recommended. However, it should be noted that the financial requirements to build capacity and establish effective systems are considerably in excess of what the government is likely to be able to provide in the short term and additional donor support will be needed.
Donor support
Some of the donors that have, and still continue to support projects related to pest and disease management include the World Bank, USAID Feed the Future, IFAD, European Commission, FAO, Bill and Melinda Gates Foundation, and Embassy of the Kingdom of the Netherlands. A good example of an IFAD-funded project on pest and disease monitoring and management is the CABI-led Plantwise project1. Investment in scaling-up the
Plantwise approach is a significant proportion of the proposed investment.
While this donor list is not exhaustive, it is important that any efforts for future investment to manage pests and diseases recognise existing initiatives, to ensure effective coordination and avoid duplication of efforts, as promoted through the Paris Declaration on Aid Effectiveness (2005) and Accra Agenda for Action (2008). Such coordination from the government side would occur through DCP, which is currently inadequately resourced to fulfil that role.
The purpose of this proposal is to align all the initiatives around a single priority plan on crop pest and diseases agreed and led by MAAIF, and to bring around it additional resources that are needed.
Cost recovery/cost sharing
Regulatory agencies can recover some of their costs through fees for services to businesses such as import risk analyses, input (pesticide and seeds) registration procedures, phytosanitary export certification, and inspections at farms or pack-houses. Where such fees are levied, it is desirable for the income to be retained by the agency, rather than the government treasury. Several international agreements specify that fee rates should not exceed the cost of providing the services.
Private sector support
Private sector actors can also be expected to support the plan, especially as it relates to commodity value chains that are well organised and generating substantial foreign export earnings.
Another specific area in which private sector funding could be expected is in the implementation of emergency responses. Emergency response plans should detail, as far as possible, not only ‘who does what’ in the event of an emergency, but how it will be financed by the various stakeholders. Different value chain stakeholders could be involved in the development of the plan and coordinated by DCP.
What are the next steps?
The immediate priority in the 5-year work plan would be to operationalise the plant protection and plant health technical committee to drive and oversee the implementation of the investment plan through:
preparation of an implementation plan, including a detailed inception phase for year 1;
1 Plantwise is funded by a consortium of donors including DFID, SDC, EU, Ministry of Foreign Affairs of
Netherlands, ACIAR, Ministry of Agriculture of the People’s Republic of China, Irish Aid and IFAD.

Platform for Agricultural Risk Management | Crop pests and disease management in Uganda: status and investment needs
xiv Uganda | Tools Assessment | Full Report | March 2017
preparation of detailed budgets for specific activities, within the overall framework of the investment strategy;
engagement of stakeholders and promoting the investment plan;
mobilisation of resources; and
ensuring coordination and dovetailing of different crop protection initiatives to strengthen the plant health system.
Implementation of the investment plan is urgently needed in order to safeguard targets in the ASSP that details delivery against a major priority area in NDPII, including an increase in agricultural exports from US$1.3bn to US$4bn by 2019/20.

Platform for Agricultural Risk Management | Crop pests and disease management in Uganda: status and investment needs
Uganda | Tools Assessment | Full Report | March2017 xv
Gra
ph
ica
l su
mm
ary

Platform for Agricultural Risk Management | Crop pests and disease management in Uganda: status and investment needs
1 Uganda | Tools Assessment | Full Report | March 2017
1. Introduction and rationale
1.1 Background to the study and rationale
1.1.1 Importance of agriculture
Uganda has an estimated total population of 34.6 million (51% female) and an annual population growth rate of 3.2%, making it one of the fastest growing populations in the world (UBOS, 2016; ICEIDA, 2014). There are approximately 7.3 million households countrywide with the majority of the households (75%) living in rural areas (UBOS, 2016). The country has a very young population, with 55% of the population being below the age of 18 years and youths (persons 18 – 30 years) constituting 23% of the total population (UBOS, 2016). Administratively, Uganda consists of 116 districts including Kampala City following the creation of 4 additional districts on 1
st July 2016. The districts are further sub-divided into Counties, Sub-counties and Parishes. The role
of these administrative units is to implement and monitor government programs at the respective levels. Over time, there has been subdivision of the administrative units with the aim of easing administration and improving the delivery of services (UBOS, 2016).
The agricultural sector, the mainstay of the economy of Uganda, provides approximately 24 % of the Gross Domestic Product (GDP), generates nearly 48% of export earnings, provides direct and indirect livelihood support for over 80% of the total households, and supply he bulk of the raw materials used by the domestic industry (UBOS, 2016). The 2014 Ugandan household and population census revealed that approximately two-thirds (69%) of the working population are engaged in subsistence agriculture. The government of Uganda identifies agriculture as a vital growth sector capable of reducing poverty and stimulating economic growth. The key focus is on increasing production and productivity, improving household food security, increasing farmers’ income and increasing the value of exports.
1.1.2 Farming systems and agricultural development
Farming systems in Uganda cover a wide range of activities including the production of cash and food crops and keeping livestock (cattle, sheep, goats, pigs and poultry). Major crops grown include; bananas and coffee, often intercropped with a wide range of annual crops (maize, cassava, sweet potatoes, cocoyam and beans). Farming systems are mainly determined by the rainfall pattern i.e. the total amount per year and the distribution, which determines the production potential of the area and crops grown (Osiru, 2006). There is a distinct spatial specialization in the production of perennial and annual crops. Perennial crops are associated with areas of high annual rainfall (1000-2100mm) and a less pronounced dry season. In areas of lower annual rainfall (500-1000mm) and prolonged dry season (especially the north, north east and west Nile), the main farming activities involve the production of annual crops such as finger millet, sorghum, maize, cassava, sweet potatoes, simsim, pigeon peas, groundnuts, beans and cowpeas.
Ministry of Agriculture, Animal Industry and Fisheries, through the agricultural zoning strategy 2004 divided the country into 10 production zones (Figure 1). The zoning is aimed at increasing household incomes through sustainable and profitable zonal agricultural products for export. An “agricultural production zone” is defined as an area with similar socio-economic characteristics and where ecological conditions, farming systems and practices are fairly homogeneous. It is assumed that a unique agricultural production zone has common crops and livestock types. Zones may cut across districts. Subsequently government of Uganda and MAAIF planning for agricultural development has largely been based on these production zones. In each of the zones, there is a Zonal Agricultural Research Institute (ZARDI), under the National Agricultural Research Organisation (NARO), supporting research and development of zone specific or relevant technologies.

Platfo
rm fo
r Agricu
ltural R
isk M
anagem
ent | C
rop
pests an
d d
isease man
agemen
t in U
gand
a: status an
d in
vestmen
t need
s
2 Uganda | Tools Assessment | Full Report | March 2017
Platform for Agricultural Risk Management | Crop pests and disease management in Uganda: status and investment needs
Uganda | Tools Assessment | Full Report | March 2017 2
Figure 1: Agricultural production zones in Uganda Source: Adapted from MAAIF, 2010
1.1.3 Pests and disease risk in Uganda (overview)
Danielsen et al. (2014) notes: “Like most African countries, Uganda is ill equipped to safeguard crops against existing and emerging pest and disease risks associated with climate change, increasing globalisation and human mobility. Diagnostic services, for example, are scarce and poorly coordinated.” Also that “Public crop protection measures are mainly restricted to border control and sporadic field inspections with hardly any services to deal with farmers’ day-to-day crop health problems. There is a pervasive feeling among Ugandan extension organizations and line ministry officials that farmers have been abandoned in their struggle against an escalating plant pest and disease burden”. Meanwhile, Kroschel et al. (2014) noted “Major pest and disease outbreaks create shocks at local and larger scales and erode resilience of farming systems, perpetuating and deepening poverty. Such events are characterised by weak phytosanitary capacity in pest and disease risk analysis, diagnostics, surveillance and control and policy interventions. This predisposition is projected to become more acute under scenarios of climate change, increased trade, human movement and due to intensified agriculture to meet demand for food and feed from an increasing population.”
Various stakeholders in Uganda, including researchers, argue that changes in weather patterns including drought, unpredictable and varied rains and temperature changes are causing alterations in the appearance and severity of newer pests e.g. black twig borer (Xylosandrus compactus (Eichhoff)). In addition, existing diseases are migrating to ecological zones where previously they did not exist. For example, coffee leaf rust (Hemileia vastatrix), traditionally limited to higher elevations, is now appearing at all elevations, whereas stem and bean borers are moving up to higher altitudes. Although credible data on the levels and spread of these diseases and pests is not available, the potential risk cannot be underestimated. The outbreak of Coffee Wilt Disease (CWD) (Gibberella xylarioides) in 1990s, for example, destroyed more than 10 million Robusta coffee trees countrywide, in a period of less than 20 years, making the country lose billions of shillings.
The pests and disease problem is exacerbated by limited resources for research and extension in Uganda. The inability to identify and monitor infestations in a timely manner, insufficient research capacity to evaluate and respond to problems, insufficient extension services to promote good agricultural control practices, and limited

Platform for Agricultural Risk Management | Crop pests and disease management in Uganda: status and investment needs
3 Uganda | Tools Assessment | Full Report | March 2017
access to inputs suggest that the sector is presently not sufficiently prepared to address pest and disease risks in an effective manner that would adequately mitigate potential losses.
1.1.4 Pest and disease risk management - rationale
Development of an appropriate risk management strategy for pest and disease requires proper identification, assessment and prioritisation of risks. Depending on the nature or severity of the risk, a single or combination of different management strategies is required to mitigate the economic, social and environmental impacts of the pest and of the management methods. This approach is termed integrated pest management (IPM). FAO (2014) defines IPM as “Careful consideration of all available pest control techniques and subsequent integration of appropriate measures that discourage the development of pest populations and keep plant protection products and other interventions to levels that are economically justified and reduce or minimise risks to human health and the environment”. Farmers also require early warning on likelihood of pest and disease outbreaks, as well as advice (extension service) that would enable them select the most effective and economical risk management option. The specific IPM methods used in the management of major pest and disease risk on key value chains in Uganda is presented in Section 2.1.2.
As laid out in the recent agricultural risk assessment study (RAS) in Uganda (PARM, 2015), risk is defined as a probability multiplied by the consequences. The RAS concluded that crop pests and diseases have very high average severity, very high frequency, with very high losses in the worst case scenario. However, in devising appropriate strategies for managing this risk, we recognise that there is a range of pest risk scenarios. Some pests are already permanently present in Uganda, and it is known that they will cause losses every season unless managed. Some pests may be usually present at low levels, but occasionally become serious. And other pests are new to the country e.g. Maize lethal necrosis disease (MLND), but on arrival have the potential to suddenly cause very high losses. Improved access to pest management services, improved pest information systems and improved capacity to monitor and combat pests and diseases are all relevant for managing all these risk scenarios, but details of the approaches may be different.
Actual economic losses are hard to find – PARM (2015) report per annum losses from MAAIF as 35-200; 60-80; 8 and; 10 million USD/per annum for banana, cassava, coffee and cotton respectively. Some pest specific estimates for important crops are given in Table 1 below – details on per-cent losses can be found in table 2.
Table 1: Some estimates of economic losses in Uganda for specific pests
Major Pest/Disease Economic loss
Banana (Musa spp.) Bacterial Xanthomonas wilt [BXW] US$360 million per annum (World Bank, 2008)
2006 - US$75 million (Uganda government estimates)
Projected overall economic loss of $2-$8 billion in the next 10 years"
Cassava Cassava brown streak disease [CBSD] In 2003, 87,000 acres affected, causing approx. US$9.6 million loss (Settumba, 2012) Cassava mosaic disease [CMD] Losses estimated at 600 000 tonnes worth US$60 million per year (Legg & Thresh, 2000)
Coffee Coffee wilt disease [CWD]) Losses of US$580 million from 1997 to 2007 (Phiri & Baker, 2009)
1993 to 2003: Destroyed approx. 80,000ha of Robusta - causing loss of US$ 100 million (Phiri & Baker, 2009)
Now largely controlled with new cultivars Black Coffee twig borer [BCTB] Losses approx. US$ 40.1 million p.a. (Kagezi et al., 2014)
Maize Maize streak virus Approx. US$16.1 million. (Pratt et al., 2016)
Fruit and veg Tuta Absolute (tomato) US$800,000 (Pratt et al., 2016) False codling moth (capsicum) Shs4b (approx. US$1.2 million in export earning lost between 2013 and 2014.
1.2 Objective of the study
The objective of this study is to provide a detailed analysis of the current crop pest and disease management status in Uganda to inform development of a sustainable investment plan for pest management. Proposed investment needs focus on three key areas: 1. Promotion of sustainable models to reach out to farmers with pest management services (knowledge and
information, analysis of infected plants, linkages to reliable agro-dealers, etc.); 2. Introduction of cost-efficient information systems to detect and monitor plant pests and diseases; and 3. Strengthening of capacities at MAAIF (and other relevant stakeholders) to analyze and combat the threat of
plant pests and diseases.

Platfo
rm fo
r Agricu
ltural R
isk M
anagem
ent | C
rop
pests an
d d
isease man
agemen
t in U
gand
a: status an
d in
vestmen
t need
s
4 Uganda | Tools Assessment | Full Report | March 2017
Platform for Agricultural Risk Management | Crop pests and disease management in Uganda: status and investment needs
Uganda | Tools Assessment | Full Report | March 2017 4
1.3 Approach
1.3.1 Data sources and collection methods
The assessment drew on both secondary and primary data sources. Secondary data was obtained from policy documents, reports and papers, both published and unpublished. The identified documents included: Platform for Agricultural Risk Management (PARM) situation analysis; Government policy/strategy documents (National Development Plan II (NDP II), Agricultural Sector Development Plan (ASDP), National Agricultural Plan (NAP), 2015 Plant Protection and Health Act and MAAIF working papers); Research reports; National statistics, and Agricultural survey reports and; Strategy documents from donors/investors/agencies. Project documentation from projects/programs in Uganda including International Fund for Agricultural Development (IFAD), Food and Agricultural Organization (FAO), Common Markets for Eastern and Southern African (COMESA) and Plantwise, were also reviewed.
Primary data were gathered from a range of stakeholders in agriculture, particularly those involved in initiatives on pest management. Interviewed stakeholders included representatives of: MAAIF (Department of Crop Protection [DCP], Directorate of Extension Services [DES], Directorate of Planning [DP]); Extension implementing/regulating agencies (Local governments, Non-government organizations [NGOs], National Agricultural Advisory Services [NAADS], Private sector); Information delivery systems (FIT Uganda, Farm Gain, Agrinet, FEWSNET, Mercy Corps, Farm Radio International); Input supply (UNADA, USTA); Farmers associations (UNFFE, District Farmers Associations); Academia (Makerere University, Uganda Christian University) and Research (NARO). We also interacted with PARM focal persons and national ARM focal persons to further understand the rationale for the analysis and strategy (see Appendix 1 for list of KII).
1.3.2 Data analysis and presentation
During the study, we gathered information to address the following key areas: (a) root causes for plant pest and disease risk in Uganda, (b) the legal and institutional framework for pest management in Uganda and its key actors, (c) cost-benefit and sustainability analysis of existing and planned initiatives related to pest management, and (d) potential for further promoting information technologies/applications for pest management. Results are presented as follows:
Root causes for plant pest and disease risk in Uganda: Examination of pest and disease risk for farmers
during the entire production cycle (from planting to marketing) was done for key value chains, and root causes for the spread of plant pests and diseases. The analysis also attempted to segment the disease exposure by geography, gender and type of farmers affected; economic losses; and management options available or that have been used in Uganda (Chapter 2).
Legal and institutional framework for pest management in Uganda: Analysis of existing legal and
institutional arrangements for tackling the pest and disease risk; and main stakeholders in Uganda (public or private) engaged in pest management, their roles and the type of support or services offered by each actor. Relevant legal documents such NDP II, the NAP, ASDP, Plant Health and Protection Act, Draft Extension Policy and Implementation Strategy and the Framework Implementation Plan (FIP) Statistics, ICT and Risk management were reviewed to assess their relevance for pest management (Chapter 3).
Cost effectiveness and sustainability of extension approaches: Existing extension approaches used in
Uganda by various actors – public sector, private sector and donor-led, were assessed to understand the services offered, costs involved and benefits for each so as to assess the cost effectiveness of each. We also reviewed initiatives on the regional level, such as FAO's strategy for improved IPM in the region, COMESA SPS strategy and regional IPM Collaborative Research initiatives (Chapter 4).
The potential for promoting information communication technologies (ICTs): Analysis of the potential
for further promoting information technologies/applications for pest management; including identification of information technology and systems currently used by the government to track and monitor pest and diseases and planned improvements for these systems; how different initiatives linked to farmers share the information on detected plant pests and diseases with MAAIF; the current use of mobile technology/applications and the potential to further increase usage (Chapter 5).
Pest management investment plan: Based on the analysis, an investment plan for sustainable pest
management is proposed. The plan focuses on three key areas; 1) access to pest management services; 2) access to pest information systems; and 3) institutional capacity to monitor and combat pests and disease risks. Along each of these investment areas, activities are proposed as well as possible timelines, institutional setup, human resources and budget requirements for effective implementation (Chapter 6).

Platform for Agricultural Risk Management | Crop pests and disease management in Uganda: status and investment needs
5 Uganda | Tools Assessment | Full Report | March 2017
1.3.3 Data validation
A validation and feedback exercise was conducted following the preparation of the first draft of the report. This was done through a one day meeting involving key stakeholders. Results were presented and feedback from relevant stakeholders collected. Feedback from the workshop was incorporated in the final report.

Platfo
rm fo
r Agricu
ltural R
isk M
anagem
ent | C
rop
pests an
d d
isease man
agemen
t in U
gand
a: status an
d in
vestmen
t need
s
6 Uganda | Tools Assessment | Full Report | March 2017
Platform for Agricultural Risk Management | Crop pests and disease management in Uganda: status and investment needs
Uganda | Tools Assessment | Full Report | March 2017 6
2. Root causes for plant pest and disease risk in Uganda
2.1 Overview of value chains and geographic distribution
Crop production in Uganda is diverse with bananas, maize, cassava, beans and rice as the main food crops, and coffee, cotton, tobacco, tea as the main cash crops. High value crops such as citrus, mangoes, capsicum and tomatoes are also increasingly gaining prominence as cash crops in specific regions of the country. The importance of these crops also varies by geography - determined by the production potential, biophysical characteristics of the area and market access. The MAAIF zoning strategy is based on this and aims to further develop key value chains based on comparative advantage of respective crops in particular zones. The Agricultural Sector Development Plan (ASDP 2015/16-2019/20) prioritises 12 commodities, nine of which are crops i.e. Coffee, Bananas, Cotton, Cassava, Maize, Rice, Beans, Citrus and Tea. This section reviews these key value chains and other important value chains in Uganda in the context of production systems, geographical distribution and economic importance, to further understand the needed efforts to enhance agricultural development in general and pest management in particular.
2.1.1 Coffee
Coffee is Uganda’s main cash crop contributing 20-30% foreign exchange earnings. The sector supports livelihoods for an estimated 1.5 million households most of whom depend on coffee as the only source of income (Parizat et al. 2001). The crop is mainly produced by smallholder farmers owning average farm sizes of less than one acre (Jassogne et al., 2012). The crop is intercropped with food crops such as banana, beans and peanuts which are important for household food security; however banana is the most intercropped crop. Banana also provides shade and in-situ mulch while beans rejuvenate soil fertility due to nitrogen fixation (Jassogne et al., 2012). Crops that deliver a large amount of cash are usually male dominated and coffee is no exception. The coffee/banana intercrop is mostly managed by men while beans are normally managed by the women (Jassogne et al. 2012). Coffee is largely grown under shade trees to ensure sustainable coffee production (Parizat et al. 2001). The leaves that fall from the shade trees provide manure for the coffee plants.
In Uganda, two types of coffee are grown, Robusta and Arabica (Ahmed, 2012). Robusta coffee is indigenous to the country and contributes 85% of total annual production and export volume (Ahmed, 2012). It is mainly grown in low altitude areas of up to 1,200 metres above sea level (masl.) mainly in the Central region, parts of Western and South-eastern regions and recently Northern region (Ahmed, 2012). The Central region produces the highest amounts of Robusta followed by the Western and the northern region. Robusta coffee is more tolerant to higher temperatures, pests and diseases. Arabica coffee on the contrary, is an introduction from Ethiopia and Malawi. It accounts for around 15% of total annual production (Ahmed, 2012). It is mainly grown on the slopes of Mountain Elgon (Bududa, Bulambuli, Bukwo Sironko, Kapchorwa, Manafwa and Mbale) in the east, Mountain Muhabura (Kisoro district) in South-western and Mountain Rwenzori (Bundibugyo, Kasese and Ntoroko) in North-western at altitudes ranging from 1500 to 2,300 masl (Ahmed, 2012).
2.1.2 Banana
Uganda is the second largest producer of banana in sub-Saharan Africa (IITA, 2016). It is one of the major crops that support livelihoods of smallholder poor rural farming communities in Uganda (Tushemereirwe et al., 2004). Four types of banana are grown, the East African highland banana (EAHB), dessert banana, plantain and beer banana (Kiiza et al., 2004; Byabachwezi et al., 2012). EAHB includes the cooking type (Matooke) and is the most predominantly grown in the country (Byabachwezi et al., 2012). According to the 2008/2009 agricultural census, this type of banana is mostly grown by the Western region (Isingiro, Mbarara and Bushenyi districts), followed by the Central region (Masaka) and the Eastern region (Mbale) with the northern region mostly Arua district, producing the least (UBOS, 2010). The dessert banana includes Sukali Ndizi (apple banana) and Bogoya (Gros Michel). The 2008/2009 census indicated that this type is produced in large quantities by the Western region (Rukungiri district), followed by the Central region (Mpigi district) and the Eastern region (Mbale and Budaka districts) (UBOS, 2010). The brewing type which includes Kisubi (Ney Poovan) and Kayinja (Pisang Awak) (Tushemereirwe et al., 2004) is mostly produced in the west (Kibaale and Kanungu districts) and the Central (Mpigi and Mubende districts) regions. The Plantain type is mainly for roasting and Gonja, which is under this category, is not widely grown but Kasese district in Eastern Uganda is the leading source. Another cultivar, Kivuvu is used for making beer but can also be cooked. Therefore besides food, the crop has multiple uses such as feed, beverage, snacks and also crafts.
The cooking banana is a staple in many parts of the country especially in Central, Eastern and Western parts (Haggblade and Dewina, 2010). Most farming communities find the cooking type ideal for food, nutrition and income security than other crops because it is the only crop that can be harvested all year round. Banana is

Platform for Agricultural Risk Management | Crop pests and disease management in Uganda: status and investment needs
7 Uganda | Tools Assessment | Full Report | March 2017
mostly grown under mixed cropping arrangements mostly with maize and beans although it is also intercropped with both Arabica and Robusta coffee (Okech et al., 2004; Jassogne et al., 2012). Where it is intercropped with coffee, banana provides food, while coffee provides the cash, a system that provides efficient utilization of labour and land (Jassogne et al., 2012). Although banana is key for food and income in the household that produce it, the crop is under threat orchestrated by constraints such as declining soil fertility, drought and mostly pests and diseases (Gold et al., 1999). The different types of banana also demonstrate differences in severity following infestation and infection by different pests and diseases respectively (Tushemereirwe et. al., 2004).
2.1.3 Cotton
Cotton is the third largest tradition cash and export crop after coffee and tea. According to the Cotton Development Organization, which regulates the production and marketing of cotton, the crop is the main source of livelihood, for close to quarter of a million households in Uganda (PMA, 2009; Ahmed and Ojangole, 2012). On average, the majority of farmers grow the crop on approximately one acre, under rain-fed conditions, with minimal use of inputs especially fertilizers and agro-chemicals (Ahmed and Ojangole, 2012). Whereas the crop can be produced in most parts of Uganda, it prefers altitudes less than 1,500 masl and requires a rainfall region of over 800 mm per annum. The ecological zones for growing cotton are the northern and eastern dry areas which grow the variety Serere Albar Type Uganda (SATU) (Hillocks, 2013) and the Southern and Western wet areas which grow the variety Bukalasa Pedigree Albar (BPA) (Hillocks, 2013) however, BPA is the variety grown by most farmers because it fetches better prices (Ahmed and Ojangole, 2012). Under appropriate management practices, cotton yield can vary from 2,500 to 3,000 kg/ha. About 90% of total cotton production is conventional, with the rest being organic. Organic cotton is produced mainly in the north in the districts of Lira, Apac, Kitgum and Pader. Compared to conventional cotton, organic cotton value chain faces challenges like low yields attributed to pests and diseases; inadequate training and farmer sensitization on principles of organic production and requirements; lack of effective organic pesticides and seed dressing products. Cotton farming in general faces challenges such low soil fertility and pests and diseases which decimate total yields (Horna et al. 2009; Chell, 2013).
2.1.4 Cassava
Cassava is a very important staple food crop in Uganda especially in West Nile, Northern and Eastern Uganda especially in the districts of Mbale, Iganga, Apac, Kamuli, Lira, Tororo and Kumi (Haggblade and Dewina, 2010). Production has been increasing in the Central region because of declining soil fertility that has affected cultivation of the major staple, banana. It is an easy crop to grow with a high yielding capability. Mainly referred to as a “poor man’s crop” and mostly considered a famine reserve crop, cassava is grown on plots averaging 1 to 3 acres mostly in mixtures involving either of the cereals; maize, sorghum, finger millet or legumes; beans, groundnuts, cowpeas, soya beans (Bekunda and Woomer, 1996; Bekunda and Woomer, 1999; Soniia, 2003). Cassava is also grown in banana and coffee establishments (Soniia, 2003). When mixtures are considered, cereals or legumes are planted two to three weeks before or after planting cassava, the spacing of cassava being wider than that used for the normal sole crop. Most planting is done in the first and not the second rains.
Cassava contributes a substantial proportion of caloric requirements. When the sweet cassava roots are peeled, they can be eaten raw, boiled, fried, roasted, or after drying and pounding, they are turned into a paste. There is a preference for these sweet varieties because of the high demand and higher prices they fetch unlike the bitter varieties. When peeled, the butter varieties are turned into flour after a solid-state fermentation process or after soaking in water (wet fermentation) and subsequent boiling of whole pieces immediately or after sun-drying. The bitter varieties are preferred for brewing local beer and distilling a spirit called waragi. Studies conducted by Otim-
Nape and Zziwa (1990) demonstrated that boiled fresh cassava was regarded as the most important product, followed by flour and lastly fermented drinks. They also found that flour was more important in places where cassava was second or third most important crop.
2.1.5 Maize
Maize is the most important cereal and second most cultivated crop after banana and beans (FAOSTAT). Moreover, it is one of the only two cereals among the 9 priority crops that the government will support and promote under its new strategic policy (ASDP 2015/16-2019/20). It is cultivated on about 1.5 million hectares of land mainly by smallholder farmers. The crop is grown in all parts of the country but most intensely in Eastern (Kapchorwa, Mbale, Kamuli, Jinja and Iganga), Central (Masaka and Mubende) and Western (Masindi, Kamwenge, Kyenjojo, Kasese, and Kabarole) with the Eastern region accounting for over 50% of total annual production (UBOS, 2010). In most parts of the country, maize is grown twice a year, utilizing the bimodal rainfall opportunity and as an intercrop of beans, soybeans or groundnuts. Shortage of land has resulted into continuous cropping which has led to decline in soil fertility. It provides income to close to two million households. Primarily grown for income generation, until recently maize did not constitute the major part of the diet like in the neighbouring countries. However, the increasing cost of banana (the main staple crop), has had an impact of increasing the consumption of maize. Therefore, the crop has become a major staple replacing crops like sorghum, millet, cassava and banana providing over 40% of the calories in both rural and urban areas. In

Platfo
rm fo
r Agricu
ltural R
isk M
anagem
ent | C
rop
pests an
d d
isease man
agemen
t in U
gand
a: status an
d in
vestmen
t need
s
8 Uganda | Tools Assessment | Full Report | March 2017
Platform for Agricultural Risk Management | Crop pests and disease management in Uganda: status and investment needs
Uganda | Tools Assessment | Full Report | March 2017 8
addition to food, maize has had a wide range of other uses including processing of livestock and poultry feeds and making of local brew (Okoboi, 2010). It is the most traded food crop. In a study by Nabbumba and Bahiigwa (2003) on agricultural productivity constraints in Uganda, farmers ranked pests and disease as the main constraint to maize production followed by inadequate capital to invest in production with low and fluctuating prices.
2.1.6 Rice
Rice is among the emerging staples and commercial crops in Uganda. It is the third most important cereal after maize and wheat. The crop is not only increasingly replacing some staple foods in the country but also becoming the preferred cash crop in some regions. Area under rice cultivation has increased from 1,500 hectares in the early 2000s to 220,000 hectares in 2011. Consequently, production has increased from 154,000 tonnes in 2006 to 237,000 tonnes in 2016 (FAOSTAT). The increase in production is partly attributed to the introduction of upland rice especially the NERICA varieties especially NERICA 4 although NERICA 1 and 10 have also been widely adopted in the country. The NERICA 4 variety is preferred for its hardiness, high yields, and shorter maturation time compared to traditional rice varieties. This has reduced rice imports to the country by one third saving the country very important foreign exchange revenue. Rice was important in supporting food security during the times when cassava mosaic and banana xanthomonas wilt ravaged Eastern and Central Uganda respectively.
2.1.7 Beans
Beans provide 25% of the total dietary calorie intake and 45% of the protein intake. It also provides essential micronutrients and vitamin B. It is one of the most widely grown food crops together with banana, cassava and maize (FAOSTAT). Beans are mainly produced by women for food security at household level however; it has become also a major source of income for farmers and traders. This is partly because beans have a short growing cycle and adaptability to a wide range of conditions but also because there is increasing demand from both the domestic and export markets especially Kenya. Production is dominant in the Central, Eastern and Western regions and dominated by smallholder farmers with average plot sizes of one acre per household. In Uganda, varieties from two types of beans are grown, bush and climbing beans (CIAT, 2008; Sonia et al., 1997). Bush beans are the most widely grown mostly in intercrops of maize, cassava, banana, cotton, or groundnuts. Climbers, which constitute about 20% of total bean acreage, are mostly grown in the highlands of southwest, Western (on slopes of Mountain Rwenzori) and Eastern (Mountain Elgon) Uganda. They can be intercropped with maize although farmers mainly grow them in pure stands due to higher yield potential. Decreasing soil fertility, pests and diseases are the major production constraints (Wortmann et al. 1998).
2.1.8 Potato
Potato also referred to as Irish potato is a source of both income and food security in areas where it is produced. The crop is mainly produced in the highland regions at altitudes between 1,500-3,000 masl (Bonabana-Wabbi et al., 2013). Most of the crop is grown in South-western Uganda in the districts of Kabale and Kisoro which produce over 60% of the national crop on plots approximately one acre with Kapchorwa and Mbale in Eastern districts producing the rest (Kaguongo et al., 2008; Bonabana-Wabbi et al., 2013). However, due to increased urban demand, production is spreading to Central Uganda especially in the districts of Lwengo and Masaka (Ferris et al., 2002; Bonabana-Wabbi et al., 2013)
2.1.9 Fruits and vegetables
The demand for fruits especially citrus, passion fruits and mangoes by the urban population has tremendously increased in the past decade. This is partly because of the increased awareness of the health benefits of fruits and vegetables. Citrus and mangoes are mainly grown in Eastern part of the country while passion fruits a mainly under production in the Western districts of Kabale, Rubanda and areas around the slope of Mt Elgon.
2.2 Pests and diseases affecting key value chains
2.2.1 Coffee
There have been declining in volumes in coffee in the last decade which has largely been attributed to pest and diseases although there are other factors that have also been suggested (Jassogne et al., 2012). It has also been suggested that changes in climatic conditions that have resulted in rampant droughts, unpredictable and varied rain patterns, temperature changes could have resulted in the appearance of new pests and severity of new and existing pest problems (Jassogne et al., 2012). In addition the results of climate could have resulted in migration of pests to ecological zones where they never existed. Diseases causing losses of economic importance include

Platform for Agricultural Risk Management | Crop pests and disease management in Uganda: status and investment needs
9 Uganda | Tools Assessment | Full Report | March 2017
coffee wilt disease, coffee leaf rust, coffee berry disease. Coffee wilt diseases caused by Gibberella xylariodes (Telomorph: Fusarium xylariodes) was first reported on Robusta coffee in the early 1990s in the western district of Bundibugyo. The disease claimed 44.6% of coffee trees between 1993 and 2002 (Flood and Brayford, 1997, 1998). Although recognised in this section, the disease is not a major threat to the coffee industry as it was decades ago. Coffee leaf rust is caused by the rust fungus Hemileia vastatrix which causes major loses on Arabica coffee, although the disease has also been known to affect Robusta coffee but with less severe consequences, some clones in Uganda demonstrate high susceptibility which results in high yield losses (Jassogne et al., 2012). It is more significant in the high altitude districts of Bududa, Kapchorwa, Bulambuli, Mbale and Manafwa found in the Elgon ranges. Coffee berry disease is caused by the fungal pathogen Colletotrichum kahawae and mainly affects Arabica coffee (Birikunzira, 2000). The disease infests flower buds, leaves, fruits and the maturing bark. Like coffee leaf rust, the disease is predominant in the Eastern and Western districts growing Arabica coffee. There are reports that suggest a shift from 1,600 masl where it was previously recorded to attack crop cultivated to higher altitudes such as 1,800 masl. Recently, the insect pest, the black twig borer (Xylosandrus compactus) was reported in Bundibugyo (Kagezi et al., 2013). The insect thrives on over 225 plant and forest species. It causes extensive damage on coffee mainly Robusta. Affected twigs do not bear berries. More than 40 host species have been recorded and reported in Uganda.
2.2.2 Banana
Banana is affected by a number of pests and diseases which result in significant decline in yield. The banana weevil also referred to as the banana root borer (Cosmopolites sordidus) is the most damaging pest in Uganda especially in neglected plots (Gold et. al., 2004). It lives, feeds and breeds in pseudostems for periods of up to two years. It lays eggs against the sides of the stems. After hatching, the larva bores into the stem, weakening them and making them liable to wind damage. Black sigatoka, which is also referred to as black leaf streak is caused by the fungus Mycosphaerella fijiensis, a pathogen that has a wide host, range and considered the most important folia disease of banana (Tushemereirwe et. al., 2004). Infestation results in significant reductions in leaf area through premature drying of leaves and yield loss. Early leaf drying results in incomplete filling of banana fingers as well as premature ripening both of which are detrimental in exported fruit. Yield loses have been estimated to more than 50% under heavy infestation. Studies done at Kawanda, revealed a bunch weight reduction of 37% due to black sigatoka. The disease is more damaging and difficult to control than yellow sigatoka (Mycosphaerella musicola). Fusarium wilt is caused by the soil borne fungus Fusarium oxysporum f.sp. cubense (Tushemereirwe et. al., 2004). The disease has remained one of the most important diseases of bananas in the country having wiped out entire plots of susceptible cultivars. It has been recorded all around the country especially where susceptible cultivars such as Bogoya, Kayinja, Sukali Ndizi and Kisubi are grown (Tushemereirwe et. al., 2004). Banana xanthomonas wilt is caused by the bacterium Xanthomonas campestris pv. musacearum (Tushemereirwe et. al., 2004). The disease first reported in Kayunga and Mukono districts in 2003 spread uncontrollably to major banana-growing areas in Uganda spanning over 30 districts. It is locally referred to as Kiwotoka (Kagezi et. al., 2006) and causes wilting of banana plants of all age causing the affected plants to die prematurely. Majorly transmitted through male flower bud by pollinating insects, bats and sunbirds, spread has however, been intensified by farmer exchange of planting materials and banana trade between neighbouring districts and sub-counties. Nematode species important in Uganda include Radopholus similis, Pratylenchus goodeyi, Helicotylenchus multicinctus and Meloidogyne spp (Kashaija et al., 1993). They infect root tissues and impair absorption and transportation of water and nutrients in addition to weakening plant anchorage in soil. Damage to banana is associated with a reduction in bunch weight, loss of bunches due to plant toppling, increase in crop cycle duration and decrease in plantation longevity with yield losses ranging from 30% to 50%.
2.2.3 Cotton
Insect pests alone have been estimated to reduce cotton yields by 40%. Annually this may translate into losses of 50,000 barrels or US$ 10 million equivalent in value. The African bollworm (Helicoverpa armigera) (Berocan et. al., 2014) is the most important cotton pest in Uganda. It is a difficult pest to manage because it has a wide range of hosts especially vegetables like tomatoes, okra, pepper and peas. Most of these are grown within the proximity of cotton fields. The lygus bug (Lygus simonyi) has also been reported to cause serious damage through sucking the young leaves and apical buds causing retarded growth (Berocan et. al., 2014). Jassids feed on cotton leaves causing them to curl at the edges, turn yellow or reddish and in severe cases, they may even dry (Sabune 2005). This pest has been reported by farmers in Lango and Acholi regions in northern Uganda and Kasese in the west. The diseases include cotton bacterial blight, a bacterial disease caused by Xanthomonas citri pv. Malvacearum (Akello and Hillocks, 2002), the wilts caused by the soil-borne fungi, Fusarium (Fusarium oxysporum f.sp vasinfectum) and Verticlium (Verticillium dahliae) and the leaf spots caused by Alternaria (Alternaria macrospora) and Cercospora (Cercospora gossypina).
2.2.4 Cassava
Cassava mosaic disease (CMD) is a viral disease spread by the white flies. The disease is common in all major cassava growing regions in the country. Symptoms of CMD infected plants include mosaic, mottled, deformed

Platfo
rm fo
r Agricu
ltural R
isk M
anagem
ent | C
rop
pests an
d d
isease man
agemen
t in U
gand
a: status an
d in
vestmen
t need
s
10 Uganda | Tools Assessment | Full Report | March 2017
Platform for Agricultural Risk Management | Crop pests and disease management in Uganda: status and investment needs
Uganda | Tools Assessment | Full Report | March 2017 10
and twisted leaflets. There is observed overall reduction in size of leaves and plants and such plants normally produce few or no tuber although this is dependent on the severity of the disease and the age of the plant at which it was infected. Cassava brown streak disease (CBSD) is another viral disease transmitted by the white fly and causes serious economic losses in the yield and quality of the roots (Alicai et al., 2007). Especially in susceptible varieties, infestation renders the roots unusable particularly when left in the ground for longer periods. CBSD symptoms are observable on the leaves, stems and roots however; on the leaves, the symptoms are more prominent on older leaves than young ones. Unlike CMD, infected leaves do not become distorted. The characteristic symptom on the leaves appear as patches of yellow areas mixed with normal green colour which may enlarge and join to form comparatively large yellow or necrotic patches. These yellow patches are more pronounced in mature than young leaves. On the stems, the disease appears as dark brown streaks and spots and is more prominent on the upper green portions of the stem. On the roots, the disease causes cracks, discoloration, root constriction and malformation. The harvested roots are corky with yellow-brown necrotic spots. The cassava green mite (Mononychellus tanajoa) is a spider mite, which causes serious infection on cassava. It feeds on young leaves and green stems and can easily be confused with effects cassava mosaic disease.
2.2.5 Maize
Major pests include stalk borers especially Busseola fusca and Chilo partellus (Matama-Kauma et. al., 2007; Calatayud et al., 2014) whose management is very difficult once in the field; maize weevil (Sitophilus zeamais) and larger grain borer (Prostephasnus truncates) which are key storage pests (Gafishi et al., 2012). The diseases include those caused by viruses, maize streak virus and maize lethal necrosis (MLN). MLN has been reported in the Eastern districts of Busia, Bulambuli, Tororo, Iganga, Mbale and Sironko. The disease first reported in 2013, has become the most important destructive disease in Uganda causing massive reductions in yield (0.25 to 1.0 tonne per hectare). The major fungal diseases include turcicum leaf blight caused by Exserohilim turcicum; gray leaf sport caused by Cercospora zeaemaydis and Cercospora sorghai var. maydis; and ear rots caused by two species Sternocarpella maydis and Fusarium species (F. graminearum and F. verticillioides) (Adipala et. al., 1993; Asea et. al., 2002; Okori et. al., 2003; Bigirwa et al., 2007). Ear rots are associated with production of aflatoxins and in Uganda, studies identified F. verticillioides as the most common mould species (Bigirwa et. al., 2006). Aflatoxins are toxic metabolites with significant social-economic impacts - including on food security, trade and human health. They cause direct economic losses by spoiling produce. Animals fed on contaminated grain have lower productivity and slower growth while commodities have lower market value and often consumed locally. Aflatoxins have been reported in a number of value chains especially maize, sorghum, millet, rice, wheat, groundnut, soybean, sunflower, cassava and cotton. Aflatoxins are largely as a result of poor post-harvest handling of produce, though pre-harvest management practices have been suggested to reduce the risk of aflatoxins (see Table 3). The notorious weed, Striga is also a major problem causing heavy cereal crop loses especially in the Eastern districts especially in Busoga and Teso region and Kasese in Western Uganda (Olupot et. al. 1999). There are two species Striga hermonthica which is the most important in infesting most cereals in Uganda although the second species Striga asiatica has also been reported.
2.2.6 Rice
Rice yields are decimated by Striga especially in Eastern Uganda, and three key diseases; rice yellow mottle virus, a Sobemovirus vectored by the Chrysomelids, bacterial blight caused by Xanthomonas oryzae pv. oryzae and rice blast caused by Magnaporthe oryzae (Anamorph: Pyricularia oryzae) significantly affect yields
(Habarurema et. al. 2013; Ochola et. al. 2015; Onaga and Asea, 2016). These diseases have been recorded where ever rice countrywide.
2.2.7 Beans
Diseases of beans include those caused by fungi such as: angular leaf spot caused by Phaeoisariopsis griseola; anthracnose caused by Colletotrichum lindemuthianum, and bean rust caused by Uromyces appendiculatus. Diseases caused by bacteria include: common bacterial blight caused by Xanthomonas axonopodis pv. phaseoli
and halo blight caused by Pseudomonas syringae pv. Phaseolicola. Viruses, especially the bean common mosaic
virus, continue to limit production levels (Nkalubo et. al. 2007; Pamela et al., 2014).
2.2.8 Potato
Potato is affected by a number of diseases, the most important include late blight caused by Phytophthora infestans and bacterial wilt caused by Ralstonia solanacearum (Lamega et. al. 2001; Ochwo et al., 2002; Mulema et. al. 2005).

Platform for Agricultural Risk Management | Crop pests and disease management in Uganda: status and investment needs
11 Uganda | Tools Assessment | Full Report | March 2017
2.2.9 Fruits and vegetables
The horticultural industry has been ravaged by the fruit fly scourge with Bactrocera invadens being the most widespread although other species such as Ceratitis cosyra, Ceratitis rosa and Ceratitis capitata have also been reported. Bactrocera invadens has been reported to reduce mango yields by 73% (Nankinga et al., 2014; Isabirye et al., 2016). The false codling moth (Thaumatotibia leucotreta) is another key pest that has been reported by MAAIF mostly affecting the hot pepper value chain. The prevalence of this pest has resulted in the European Union restricting hot pepper exports destined for the European Union.

Uganda | Tools Assessment | Full Report | March 2017 12
Platform for Agricultural Risk Management | Crop pests and disease management in Uganda: status and investment needs
Ta
ble
2:
Su
mm
ary
of ke
y p
ests
and
dis
eases o
f ke
y v
alu
e c
ha
ins in
Uga
nda
, th
eir
dis
trib
utio
n a
nd
eco
nom
ic lo
sse
s
Maj
or
Pes
t/D
isea
se
Pes
t / d
isea
se d
istr
ibu
tio
n
Eco
no
mic
loss
Co
ffee
Cof
fee
wilt
dis
ease
[CW
D])
Rob
usta
(C
offe
a ca
neph
ora
Pie
rre)
onl
y –
grow
n at
war
mer
and
low
er e
leva
tions
800
-15
00 m
asl i
n ce
ntra
l & s
outh
ern
Uga
nda
(app
roxi
mat
ely
240,
000
ha)
mea
n an
nual
ra
infa
ll 10
00-2
000
mm
Firs
t det
ecte
d in
199
3 bu
t had
spr
ead
to a
ll R
obus
ta c
offe
e gr
owin
g ar
eas
by 2
000
(Phi
ri &
Bak
er, 2
009)
Cau
sed
loss
es o
f US
$580
mill
ion
from
199
7 to
200
7 (P
hiri
& B
aker
, 200
9)
Cof
fee
leaf
rus
t [C
LR)
(H. v
asta
trix
B
erk.
and
Br.
)
Mai
nly
affe
cts
Ara
bica
cof
fee
(Cof
fea
Ara
bica
L.)
. Pro
duct
ion
of A
rabi
ca c
offe
e is
lim
ited
to a
reas
150
0-23
00 m
asl i
n ea
st, w
este
rn &
nor
th-w
este
rn U
gand
a (3
7,00
0 ha
) w
ith
rain
fall
1500
– 2
000m
m a
nnua
lly
CLR
is m
ore
seve
re in
sus
cept
ible
farm
s at
low
alti
tude
(M
atov
u et
al.,
201
3)
CLR
was
kno
wn
to b
e fo
und
belo
w 1
,500
mas
l but
is n
ow a
ttack
ing
coffe
e gr
own
at
high
er a
ltitu
de o
f 1,8
00 m
asl w
hich
is a
ttrib
uted
to c
limat
e ch
ange
(ris
ing
tem
pera
ture
)
Cau
ses
appr
ox. 1
0 -
50%
yie
ld lo
ss o
n su
scep
tible
cof
fee
varie
ties
(Silv
a et
al.,
200
6)
Sev
ere
on A
rabi
ca c
offe
e at
mid
and
low
alti
tude
(15
00 m
asl a
nd b
elow
) w
here
cro
p lo
sses
can
rea
ch 5
0% (
Luzi
nda
et a
l., 2
015)
Bla
ck C
offe
e tw
ig b
orer
[BC
TB
] (X
ylos
andr
us c
ompa
ctus
(E
ichh
off )
)
Mai
nly
affe
cts
Rob
usta
cof
fee
Cau
se lo
sses
app
roxi
mat
ely
US
$40.
1 m
illio
n of
cof
fee
fore
ign
exch
ange
ear
ning
an
nual
ly (
Kag
ezi e
t al.,
201
4)
Ban
ana
(Mu
sa s
pp
.)
Bac
teria
l Xan
thom
onas
Wilt
[BX
W]
(Xan
thom
onas
cam
pest
ris p
v m
usea
rum
)
BX
W is
end
emic
in m
ost o
f Uga
nda
i.e. i
n th
e ce
ntra
l, w
este
rn a
nd s
outh
ern
regi
ons
of
Uga
nda
BX
W r
epor
tedl
y ha
s an
inci
denc
e of
70
to 8
0% o
n su
scep
tible
cul
tivar
s, w
ith y
ield
loss
es
of 9
0% o
n so
me
farm
s. P
oten
tial n
atio
nal l
oss
is e
stim
ated
at U
S$
360
mill
ion
per
annu
m
(Wor
ld B
ank,
200
8 as
cite
d in
MA
AIF
, 201
0)
"Bas
ed o
n es
timat
es o
f the
Uga
ndan
gov
ernm
ent,
BX
W c
ause
d yi
eld
loss
es o
f up
to
US
$75
mill
ion
in 2
006
with
a p
roje
cted
ove
rall
econ
omic
loss
of $
2-$
8 bi
llion
in th
e ne
xt
10 y
ears
"
Pan
ama
dise
ase
or F
usar
ium
wilt
(F
usar
ium
oxy
spor
um f.
sp c
uben
se)
Initi
ally
rep
orte
d in
Wes
tern
hig
hlan
ds o
f Uga
nda
at a
ltitu
des
abov
e 13
00 m
asl,
mai
nly
on h
ighl
and
bana
nas
as o
ppos
ed t
o in
trod
uced
typ
es
Als
o re
port
ed i
n C
entr
al a
nd E
aste
rn U
gand
a in
are
as c
hara
cter
ised
by
hig
her
min
imum
tem
pera
ture
s
The
dis
orde
r te
nds
to b
e re
stric
ted
to a
reas
of
refu
se d
epos
ition
(us
ually
adj
acen
t to
ho
mes
tead
s), t
o ar
eas
whe
re a
nim
al w
aste
acc
umul
ates
(i.e
. ani
mal
kra
als)
or
whe
re
such
site
s h
ave
pre
viou
sly
bee
n lo
cate
d
Cur
rent
ly fo
und
all o
ver
the
coun
try
whe
re s
usce
ptib
le b
anan
a cl
ones
are
cul
tivat
ed
It ca
uses
rot
ting
of tu
bers
, red
ucin
g bo
th th
e qu
ality
and
qua
ntity
of t
uber
s
Ent
ire p
lots
of s
usce
ptib
le v
arie
ties
can
be c
ompl
etel
y w
iped
out
(T
ushe
mer
eirw
e et
al.,
20
00)
Bla
ck s
igat
oka
or b
lack
leaf
str
eak
(Myc
osph
aere
lla fi
jiens
is)
End
emic
and
occ
urs
in a
ll ba
nana
gro
win
g re
gion
s an
d ha
s w
ide
host
ran
ge
Mor
e pr
omin
ent i
s ea
ster
n an
d ce
ntra
l dis
tric
ts
Dis
trib
utio
n re
stric
ted
to a
reas
with
mea
n m
inim
um a
nnua
l tem
pera
ture
abo
ve 1
5o C
Less
pre
vale
nt in
hig
hla
nd c
ool a
reas
; abs
ent a
bove
145
0 m
asl
The
dis
ease
doe
s no
t nor
mal
ly k
ill th
e pl
ant b
ut c
ause
s he
avy
defo
liatio
n w
hich
sev
erel
y su
ppre
sses
fing
er fi
lling
, lea
ding
to r
educ
ed b
unch
wei
ght
A tr
ial c
ondu
cted
in th
e m
id-e
leva
tion
bana
na s
yste
ms
of e
aste
rn A
fric
a (U
gand
a)
reve
aled
a lo
ss o
f 37%
in b
unch
wei
ght i
n th
e fir
st r
atoo
n (T
ushe
mer
eirw
e 19
96)
Ban
ana
wee
vil (
Cos
mop
olite
s so
rdid
us)
Ban
ana
wee
vil t
unne
lling
of p
lant
rhi
zom
es is
sev
ere
up to
140
0 m
asl;
dam
age
is
negl
igib
le a
bove
this
ele
vatio
n an
d th
e w
eevi
l not
pre
sent
abo
ve 1
700
mas
l
Hig
h le
vels
of w
eevi
l atta
ck r
esul
ted
in r
educ
ed b
unch
wei
ghts
, pla
nt lo
sses
, mat
di
sapp
eara
nce
and
few
er h
arve
sted
bun
ches
, with
est
imat
ed y
ield
loss
es a
vera
ging
42%
ov
er 4
yea
r of
the
tria
l (G
old
et a
l., 2
004)
.
Cau
ses
yiel
d lo
sses
of u
p 40
%. E
ffect
mor
e ob
serv
able
on
bunc
h w
eigh
t tha
n on
pla
nt
grow
th a
nd r
ate
of d
evel
opm
ent (
Ruk
azam
buga
et a
l., 1
998;
Gol
d, C
.S. e
t al.
2004
)
Co
tto
n
Afr
ican
bol
lwor
m (
Hel
icov
erpa
ar
mig
era)
Cot
ton
grow
ing
dist
ricts
in L
ango
and
Ach
oli i
n no
rth
ern
Uga
nda
and
Kas
ese
in th
e w
est
Dat
a no
t ava
ilabl
e
Cas
sava
(M
anih
ot
escu
len
ta)
Cas
sava
bro
wn
stre
ak d
isea
se [C
BS
D]
CB
SD
is c
onfin
ed to
alti
tude
s be
low
1,0
00 m
asl i
n en
dem
ic a
reas
but
has
bee
n re
port
ed
at m
id a
ltitu
de le
vels
(12
00–1
500
mas
l) (A
licai
et a
l., 2
007)
Cau
se u
p to
100
% y
ield
loss
in s
usce
ptib
le v
arie
ties
(Kaw
eesi
et a
l., 2
014)
. In
Muk
ono
dist
rict,
for
exam
ple,
30%
of t
he 8
7,00
0 ac
res
unde
r ca
ssav
a cu
ltiva
tion
was
affe
cted
by
CB
SD
in 2
003,
cau
sing
app
roxi
mat
ely
US
D 7
.5 m
illio
n lo
ss in
rev
enue
(S
ettu
mba
, 201
2)

Platform for Agricultural Risk Management | Crop pests and disease management in Uganda: status and investment needs
13 Uganda | Tools Assessment | Full Report | March 2017
Maj
or
Pes
t/D
isea
se
Pes
t / d
isea
se d
istr
ibu
tio
n
Eco
no
mic
loss
Cas
sava
mos
aic
dise
ase
[CM
D]
Wid
e sp
read
in c
assa
va g
row
ing
area
s in
the
coun
try
Loss
es e
stim
ated
at 6
00 0
00 to
nnes
wor
th U
SD
60
mill
ion
per
year
(Le
gg &
Thr
esh,
20
00)
Cas
sava
bac
teria
l blig
ht [C
BB
], (X
anth
omon
as a
xono
podi
s pv
. m
anih
otis
)
Wid
espr
ead
in th
e co
untr
y an
d ca
used
sev
ere
loss
es in
the
sava
nnah
are
as p
artic
ular
ly
on s
usce
ptib
le v
arie
ties
grow
n on
poo
r so
ils
Up
to 7
0 %
red
uctio
n in
yie
lds
of c
assa
va tu
bers
and
pla
ntin
g m
ater
ials
(O
tim-N
ape
and
Sen
goob
a, 1
980)
. On
poor
san
dy s
oils
in th
e N
ile, a
nd p
art;
of th
e N
orth
ern
and
Eas
tern
pr
ovin
ces,
90-
100%
cro
p lo
sses
was
rec
orde
d on
sus
cept
ible
var
ietie
s (O
tim-N
ape,
19
80)
Mai
ze
Mai
ze L
etha
l Nec
rosi
s (M
LND
)
Eig
ht d
istr
icts
bor
derin
g w
ith K
enya
Loss
es n
ot q
uant
ified
in U
gand
a bu
t in
Ken
ya, b
y 20
12, t
he d
isea
se h
ad a
ffect
ed 2
6,00
0 ha
of m
aize
, cau
sing
loss
es a
mou
ntin
g to
US
$ 52
m (
MD
RA
T, 2
012)
.
Mai
ze s
trea
k vi
rus
Mai
nly
in th
e ea
ster
n di
stric
ts o
n th
e bo
rder
with
Ken
ya
App
rox.
US
D 1
6.1
mill
ion.
(P
ratt
et a
l., 2
016)
Larg
er G
rain
Bor
er (
LGB
)
Ser
ious
pes
t of s
tore
d m
aize
and
drie
d ca
ssav
a ro
ots,
but
will
als
o at
tack
mai
ze in
the
field
just
bef
ore
harv
est.
Min
or h
osts
incl
ude
yam
, sor
ghum
, trit
ical
e an
d w
heat
.
LGB
is a
lso
pres
ent o
n a
num
ber
of w
ild h
osts
and
can
infe
st w
oode
n gr
ain
stor
age
stru
ctur
es
Dis
trib
uted
acr
oss
the
coun
try
Dat
a on
yie
ld lo
ss d
ue to
LG
B n
ot q
uant
ified
but
stu
dies
est
imat
e th
at a
bout
40%
of p
ost-
harv
est g
rain
loss
es a
re d
ue to
sto
rage
inse
ct p
ests
.
Str
iga
Eas
tern
dis
tric
ts e
spec
ially
in B
usog
a an
d T
eso
regi
on a
nd K
ases
e in
Wes
tern
Uga
nda
Yie
ld lo
ss d
ue to
Str
iga
not q
uant
ified
in U
gand
a
Stu
dies
in S
SA
est
imat
e th
at p
aras
ite in
fest
s 40
% o
f the
cer
eal-p
rodu
cing
are
as r
esul
ting
to c
rop
loss
es e
stim
ated
at U
S$7
bill
ion
annu
ally
(E
jeta
, 200
7).
Mos
t affe
cted
are
sub
sist
ence
farm
ers
losi
ng a
bout
20–
80%
of t
heir
yiel
d (G
ethi
et a
l.,
2005
).
Bea
ns
Ant
hrac
nose
Ant
hrac
nose
is e
ndem
ic in
Uga
nda
and
as lo
ng a
s co
nditi
ons
are
right
, it w
ill a
ffect
any
be
an c
rop
acro
ss th
e co
untr
y al
thou
gh m
ore
prev
alen
t in
high
alti
tude
are
as (
Pas
tor-
Cor
rale
s, 1
995)
Red
uces
yie
ld p
oten
tial i
n su
scep
tible
var
ietie
s by
30
-45%
(N
kalu
bo e
t al.,
200
7)
Ang
ular
leaf
spo
t
All
over
the
coun
try
whe
re b
eans
are
gro
wn
Yie
ld lo
sses
of u
p to
50%
hav
e be
en r
epor
ted
amon
g co
mm
erci
al v
arie
ties
(Opi
o et
al.
2001
).
Po
tato
Ral
ston
ia (
pota
to, e
ggpl
ant,
nigh
tsha
de
etc.
)
Alth
ough
less
info
rmat
ion
is a
vaila
ble,
has
bee
n re
port
ed in
key
maj
or p
otat
o an
d to
mat
o gr
owin
g re
gion
s
Pot
ato
yiel
d lo
sses
est
imat
ed a
t 30%
, with
mor
e se
vere
loss
es b
eing
100
% (
Ala
cho
and
Aki
man
zi, 1
993)
Fru
it a
nd
veg
Tut
a A
bsol
uta
(tom
ato)
Rep
orte
d bu
t dis
trib
utio
n no
t yet
kno
wn
(Tum
uhai
se e
t al.,
201
6).
Ann
ual l
oss
of U
S$8
00,0
00 e
stim
ated
by
Pra
tt et
al.,
201
6
Fru
it fly
(m
ango
)
Bac
troc
era
inva
dens
is v
ery
prev
alen
t whi
le C
erat
itis
capi
tata
is th
e po
pulo
us (
Nan
king
a et
al.,
201
4).
Dis
trib
uted
cou
ntry
wid
e in
all
man
go g
row
ing
area
s
Lose
s ca
n ra
nge
from
73%
to 8
3 %
dep
endi
ng o
n ag
ro-e
colo
gica
l zon
e (N
anki
nga
et a
l. 20
14)
Fal
se c
odlin
g m
oth
(cap
sicu
m)
Affe
cts
a ra
nge
of h
osts
hen
ce m
ight
hav
e w
ide
dist
ribut
ion
As
a re
sult
of th
e pe
st, e
arni
ngs
from
pep
pers
dec
lined
from
$1.
74m
(S
hs6.
3b)
in 2
013
to
$573
,000
(S
hs2b
) in
201
4. In
effe
ct, U
gand
a lo
st m
ore
than
Shs
4b (
204
per
cent
).

Platfo
rm fo
r Agricu
ltural R
isk M
anagem
ent | C
rop
pests an
d d
isease man
agemen
t in U
gand
a: status an
d in
vestmen
t need
s
Platform for Agricultural Risk Management | Crop pests and disease management in Uganda: status and investment needs
Uganda | Tools Assessment | Full Report | March 2017 14
2.3. Root causes for the pests not being effectively controlled
Based on review of the literature, interviews with key informants and personal experiences of the consultants a problem tree approach was taken to consider the key causes behind ineffective pest control. During development of a problem tree, it appeared to make most sense to identify causes around two main causes: 1) New pests spread and 2) Poor farm level management. The root causes were then tracked back as presented in Figures 2.1 and 2.2.
2.3.1 New pests spread
The spread of new pests was considered to take place primarily due to a set of under-lying causes related to a) Spread through marketing and material movement; and b) outbreaks going unnoticed due to limited information and surveillance measures. a) Marketing and material movement
Marketing affects movement of plants and plant materials both internally and across borders. This can be either through grain, seed / planting material or fresh produce such as fruits taken to the market. Traders move diseased plant materials either knowingly (to avoid income loss) or unknowingly. For example, pests like fruit fly can easily be moved from one place to another through marketing. It’s not easy to identify a fruit carrying the larvae of the fruit fly at harvest, thus such fruits can easily find their way to the market. Similarly, marketing of coffee was responsible for the spread of coffee wilt as dried coffee husks were taken to uninfected gardens as manure spreading the disease from infected to non-infected fields. Cross border trade and transport of food aid across borders have also been blamed for the entry of the larger grain borer – Prostephanus truncatus which has become an endemic pest in the entire East African region, as well as the Maize Lethal Necrosis. It is projected that pests and diseases may become a bigger problem as more trade and aid flourish in the region.
Movement of viable plant material, whether for sale or just exchange, has been responsible for pest spread. For example, movement of cassava and banana planting materials country wide has been partly responsible for the spread of cassava brown streak and banana bacterial wilt diseases respectively. Similarly, indiscriminate exchange of planting materials by farmers across borders without following proper plant quarantine regimes is considered a big threat to ensuring crop health within Uganda. For example, cassava mealy bug entered Uganda in 1992 via the Democratic Republic of Congo. Likewise cassava brown streak disease occurred in Uganda when infected materials were taken from Tanzania in 1934. Though the disease was effectively controlled at the time due to destruction of all infected plant material, CBSD reemerged in Uganda in 2005 (Alicai et al., 2007).
Movement of materials per se is not the key problem, but rather the inadequate monitoring and enforcement in the way materials are transferred. Two key issues then emerge; limited enforcement of internal controls and limited border in relation to internal and cross border materials movement respectively. The structure for DCP provides for 70 staff and usually just a fraction are hired, with the department currently having 39 staff only. There are also conflicting pressures at the district level not to restrict movement of produce or plant materials when a problem is identified. The technical staff at district level have no mandate/authority to either arrest perpetrators or confiscate suspected goods to prevent movements. In terms of cross border management, it was noted that out of 30 gazetted border posts, only 5 are currently manned i.e. Busia, Malaba, Katuna, Mutukula and Entebbe International Airport. Inadequate monitoring at key entry points leads to free movement of materials that may potentially contain exotic or invasive pests that can easily spread into the country. Related to this, there is limited consultations and coordination between Uganda Revenue Authority and MAAIF. Most times, traders move their goods after clearing their import taxes, without such materials being checked and verified by MAAIF technical teams. This further depicts limited awareness of standard materials movement guidelines.
b) Outbreaks go unnoticed
Pest introductions may occur in a country due to various reasons; marketing mentioned earlier being just one of them. Other biotic and abiotic factors can contribute to resurgence of pests and diseases that were considered to be under control, e.g. climate change, change in pest mating types, spread through vectors across borders. Sometimes, new pest epidemics and outbreaks may occur due to pest migration across borders. Mechanisms to anticipate and respond to pest problems before they become serious are needed – but are currently insufficient as a result of:
- Inadequate personnel and budget in DCP to undertake pest and disease monitoring and response. DCP mentioned a general lack of human capacity (inadequate staffing) as the key factor affecting the ability of the department to effectively manage pests particularly introduced ones. There are limited financial resources to effectively undertake surveys and general surveillance / early warning on pest incidences. In some instances, once the pest problem is identified, financial resources to implement agreed prevention or control measures are not available or not released in time to arrest the situation. In
Platform for Agricultural Risk Management | Crop pests and disease management in Uganda: status and investment needs
Platfo
rm fo
r Agricu
ltural R
isk M
anagem
ent | C
rop
pests an
d d
isease man
agemen
t in U
gand
a: status an
d in
vestmen
t need
s
15 Uganda | Tools Assessment | Full Report | March 2017
particular, the DCP lacks a contingency budget to quickly address pest and disease outbreaks. This in part may be related to absence of pest-specific plans that can guide what resources are likely to be required for response. Though largely, this is attributed to limited funds allocated to the department and limited capacity and funds at the district level.
- Inadequate and non-coherent monitoring and reporting of pest situations - In theory extension workers are the front line staff that provide reports with regard to emerging pest to MAAIF (DCP). The gap in the current extension system is partly to blame for the inadequate reporting of pests, but also non-coherence due to several reporting lines. With the single spine extension system (detailed description in section 3.2.7) under implementation, there will be a direct link between extension staff and MAAIF, but adequate collaboration between Directorate of Extension Services, DCP and District Agricultural Officers is still critical for ensuring adequate information flow. Plant clinics (distributed in over 90 districts) are to some extent providing pest data as a result of providing a crop advisory service. This could be a possible solution to pest monitoring systems, although systems require investment and clear lines of authority and mandate. Several private sector players (e.g. agrodealers, aggregators, village based intermediaries etc.), NGOs and donor organizations may observe or hear of outbreaks and generate information on pests and diseases which can be utilized by DCP if there was a coordinated approach. Collaboration with the Department of Planning and statistics will be needed to integrate and capitalize on new infrastructure and work processes being planned to integrate collection of pest data. Although it is not clear whether there are existing plans to incorporate processes on regular pest monitoring rather than annual statistics.
- Inadequate diagnostics services - At district level, interviewees mentioned lack of proper diagnostic equipment and also capacity to diagnose pest problems. In cases where problems were referred to the national systems either at MAAIF or NARO level, there was a slow response on how they could be managed. A follow up on the status of the National Agricultural Research Laboratories (NARL) Kawanda and the DCP run National Diagnostic Laboratory (NDL) Namalele showed that basic equipment for routine diagnosis are available, however there was a lack of adequate personnel, inadequate skills in diagnosing some pest/disease problems especially viruses, and limited supply of reagents. NARL also hosts the seed testing lab.
2.3.2 Poor farm level management
The principle causes of poor pest management at farm level were identified as; a) limited awareness of pest management solutions, b) sometimes farmers don’t follow advice, c) Lack of practical solutions, d) counterfeit chemicals e) poor quality seed, and f) poor soil fertility and nutrient management.
a) Limited awareness of pest management solutions
Farmers have limited capacity to identify, differentiate and diagnose disease problems and effectively respond to them. In situations where they can identify the problems, they fall short on management practices both pre- and post-harvest. Kumakech et al. (2013) report that lack of knowledge on disease recognition and management contributed significantly to rapid spread of CBSD in northern Uganda. This lack of knowledge is partly blamed on inadequate supporting extension system. There is not enough extension staff to support farmers. In one of the meetings, the District Production and Marketing Officer mentioned that although they are reinstating the extension staff; services are not yet operational. It was also acknowledged that extension staff, more often than not lack knowledge and technical packages to manage emerging pests and diseases, underscoring the need for frequent re-training of extension personnel to effectively offer extension advice. Better access to sources of information on technical packages is needed. A number of national and international databases are available – but are not all easily accessible. b) Farmers don’t follow advice
There are many reasons why farmers do not follow advice; lack of economic incentives to invest in pest management, recommended inputs not accessible and usually of questionable quality, farmers tired of conflicting advice, and land fragmentation. - Lack of incentives: Output markets are generally poor and farmers do not achieve adequate returns to their
investment, implying that additional input into pest management options would further decrease expected returns. The coffee industry gives a premium price for quality coffee encouraging farmers to invest in managing their crop well, including in pest management.
- Poor access to quality inputs: Farmers lack access to recommended inputs either because they are very expensive or they cannot be purchased near to farmers homes. Further, the quality of inputs remains questionable as majority of farmers would testify that the inputs are often fake or adulterated and control measure to combat adulteration are not strong or adhered to. This demotivates farmers to further invest in inputs if they cannot achieve the intended pest/disease management objectives.
- Farmers tired of receiving conflicting advice: Key informants also noted that farmers were “tired” of receiving
conflicting advice from different sources, and often complained that the promoted recommendations do not yield positive results. Smallholder farmers are risk averse and need to be very confident of a positive return in order to invest in pest management.

Platfo
rm fo
r Agricu
ltural R
isk M
anagem
ent | C
rop
pests an
d d
isease man
agemen
t in U
gand
a: status an
d in
vestmen
t need
s
Platform for Agricultural Risk Management | Crop pests and disease management in Uganda: status and investment needs
Uganda | Tools Assessment | Full Report | March 2017 16
- Land fragmentation: Failure to invest in pest management is further aggravated by decreasing land sizes. Increased pressure on land in the recent decades due to population explosion frequently came out as a key cause. This has resulted in both excessive land fragmentation and continuous cropping of the small land pieces with no fallow periods. Continuous cropping implies that there is no break in seasons which can create persistence of pest problems. Continuous cropping especially of bananas was mentioned as key in the persistence of banana weevils and nematodes as well as for bacterial wilt caused by Ralstonia solanacearum in tomato and other solanaceous crops such as potato and egg plants. Small land sizes also
means that there is no economy of scale and even less incentive for farmers to invest – as the land size is unable to support families. Often farmers are forced to seek off-farm opportunities to earn money – so that lack of labour also becomes a constraint.
- Labour constraints: Some pest management options are labour consuming and tedious which makes their
application and sustainability problematic. For example, in the management of the fruit fly, recommended practices have proved tedious and not practical for a regular farmer. One of the options in the management of fruit fly is the collection of fallen fruits and burying them at a depth of not less than 2 metres. Similarly, bagging to lower insect and disease damage in fruits is effective but requires a lot of labour hence may not be practical to ordinary farmers. Given these challenges, farmers either leave the fruit trees to nature or apply local knowledge that is not validated e.g. use of cow dung or brewers waste.
c) Lack of practical solutions
Interactions with scientists and researchers revealed a general lack of practical solutions for management of key pests and diseases. Weak linkages between the National Agricultural Research Organisation (NARO) and international capacity further contribute to the challenge of lack of practical solutions. Researchers interviewed indicated that solutions to some of the pest problems may exist elsewhere especially for management of introduced pests. However, due to lack of effective linkages, such solutions are not always brought to the table. Similarly, the lack of adequate research staff and infrastructure hinders investigations into emerging problems to develop appropriate solutions in a timely manner. Successful linkages have been recorded in the management of cassava green mite and cassava mealy bug employing classical biological control using natural enemies already developed by the International Institute for Tropical Agriculture (IITA) in West Africa.
2.3.3 Counterfeit chemicals
The looming challenges in the management of pests and diseases, particularly the lack of harmonized pest and disease control programs, limited feasible pest management options, and inadequate extension services, have led to the reactive use of pesticides for pest control. This has provided fertile ground for increasing illegal imports of pesticides, proliferation of unlicensed dealers, and high incidence of counterfeit inputs. It has been reported that the probability of buying fake seed or fake pesticides in Uganda is high. Counterfeits and fake agro chemicals account for 10% to 15% of the national agrochemicals in the market valued at U$ 6 million per year (ASARECA, 2010). Counterfeit pesticides coupled with poor application methods by farmers (either poor equipment, poor dosage, non-selective application of pesticides) have led to pesticide resistance in some instances. This means that certain pests cannot easily be managed by existing pesticides in the market. For example, studies in Uganda have demonstrated the development of resistances by some strains of Phytophthora infestans (late blight of potato) to Metalaxyl fungicide (Mukalazi et al., 2001).
Inadequate registration and limited enforcement of pesticide regulation have largely contributed to this situation. Respondents indicated that MAAIF has limited capacity and vigilance to enforce compliance of chemical standards. Much as MAAIF is expected to register agro-input dealers, just a fraction is registered. The number of agro-dealers in Uganda has increased rapidly since 2002, rising from 100 to around 2500 by 2012 (ASHC profile of Uganda, pers comm.). A total of 800 were registered with MAAIF. The other unregistered agro-dealers operate in different capacities and sometimes they may also deal with a variety of commodities other than agro-inputs. These unlicensed dealers are also unlikely to have the requisite knowledge to correctly inform farmers what the appropriate pesticides to use are and how to use them safely, besides having knowledge of chemicals themselves (including ability to check for authenticity of inputs from suppliers). It was also noted that penalties given to unscrupulous traders are too minimal and not biting. For example, the current penalty if caught dealing in fake chemicals is UGX 50,000 (approx. USD15), which is too small given the value of chemicals, and losses fake chemicals create. Further, conflicting mandates between various government agencies - National Environment Management Authority (NEMA), Uganda National Bureau of Standards (UNBS), National Drug Authority (NDA), and MAAIF as regards pesticides monitoring and management, has caused ineffective monitoring due to unclear responsibilities (MAAIF, 2014).
Limited knowledge on the side of farmers on quality pesticides and effective application is also an increasing challenge. Farmers easily pay for the fake/adulated inputs because they are not aware of quality and also because they are more affordable. The cost of genuine inputs is prohibitively high. This was attributed to the high tax regimes but also the government policy of liberalization in which government withdrew from pest and disease control. In terms of effective application, the proportion of farmers using recommended personal protective equipment while handling pesticides is very low and exposure to hazards is amplified given that some farmers

Platform for Agricultural Risk Management | Crop pests and disease management in Uganda: status and investment needs
Platfo
rm fo
r Agricu
ltural R
isk M
anagem
ent | C
rop
pests an
d d
isease man
agemen
t in U
gand
a: status an
d in
vestmen
t need
s
17 Uganda | Tools Assessment | Full Report | March 2017
allow their children to do the spraying. In some cases farmers use inappropriate spray equipment and wrong dosage. This chemical misuse leads to pesticide resistance.
2.3.4 Poor quality seed
The seed industry in Uganda is increasingly under scrutiny for selling and distributing poor quality seed and planting material. It is important that seed put on the market is free of pests, diseases and obnoxious weeds. Ideally, under the MAAIF structure, all commercial seed should be inspected and certified. Seed producers are expected to submit planting returns at the onset of the season and MAAIF schedules inspections, at least three times during the season (in field and post-harvest). MAAIF then issues seed labels corresponding to the amount of seed each company has produced that meet quality standards. Seed testing and post control checks are also supposed to be undertaken to ensure seed on the market meets the quality standards. However, seed inspection and certification has not adequately been done by MAAIF due in part to inadequate inspection staff to cover the entire country, inadequate logistics for inspection and seed testing, and limited enforcement of by-laws related to seed counterfeiting. This gap in inspection and certification contributes to the proliferation of fake seed and unscrupulous seed dealers on the market.
Again the quest for quality seed by farmers that is by far not met by formal seed enterprises has partly contributed to increasing fake seed trade. Unscrupulous seed merchants just colour any grain to look like certified seed and sell it to unsuspecting farmers who are not able to tell the difference between good quality and fake seed, except by the colour. Part of the solutions to address the unmet seed demand has been the focus on community seed multiplication by some of government efforts and some NGOs. Integrated Seed Sector Development (ISSD), (an initiative led by Centre for Development Innovation (CDI) part of Wageningen University and the Royal Tropical Institute in Netherlands) has championed seed entrepreneurship in Uganda where groups of small-scale market-oriented farmers are organised and employed in seed production and marketing, having access to research, extension, quality assurance, finance and a market. Seed entrepreneurs produce quality seed of various crops that are locally demanded, adaptable to local conditions and have market potential. These approaches provide farmers with alternative sources of good quality seed. The seeds and plant act 2006 recognises different types of seed, including standard seed – “any seed which is not grown under a certification program but which may enter the market in case of certified seed shortage and which meets the same laboratory seed testing standards as certified seed”. In other instances, this type of seed has been labelled Quality Declared Seed whose promotion has yielded positive results in increasing farmers’ access to quality seed (see box 2 for QDS example in Tanzania). In Uganda, HE the President launched the QDS label in July 2016, implying that it can now be officially used. However, the QDS systems still needs further development, including training a cadre of QDS inspectors – work has been initiated under the ISSD program – though still limited to a few districts.
Besides, there is lack of standards relating to planting material for vegetatively propagated crops such as cassava, sweet potato and Irish potato. With the current shortage of planting materials in key production zones for these crops, there has been massive movement of planting materials, even under government programs – NAADS and operation wealth creation (OWC), and NGOs within country. It is indicated that such materials have been produced following guidelines for quality seed production and ideally have to be inspected by the DPO or ZARDI officials before they are distributed as seed. But the fact that there are no written standards on quality of such materials, this largely remains a claim. Also from interviews with key informants at district level, planting materials are not well inspected, if at all it’s done, before distribution.
Two issues then emerge here - the existence and implementation of certification measures, and effective enforcement of regulation. Better regulations undoubtedly would lead to cleaner planting material, contributing to pest management. Given the current capacity gaps in MAAIF, strengthening capacity of district agricultural personnel and delegating to them some of the inspection activities could go a long way in ensuring routine inspections. Approval and implementation of quality declared seed (QDS) system or standard seed, along with standards, is also a viable strategy for ensuring farmers have access to quality seed at local level, particularly of crops that are of less interest to formal enterprises e.g. beans, ground nuts, millet etc.

Platfo
rm fo
r Agricu
ltural R
isk M
anagem
ent | C
rop
pests an
d d
isease man
agemen
t in U
gand
a: status an
d in
vestmen
t need
s
Platform for Agricultural Risk Management | Crop pests and disease management in Uganda: status and investment needs
Uganda | Tools Assessment | Full Report | March 2017 18
2.3.5 Poor farm level soil fertility and nutrient management
Soil nutrient depletion is wide spread in Uganda. This affects susceptibility of plants to insect pests by altering plant tissue nutrient levels. Research shows that the ability of a crop plant to resist or tolerate insect pests and diseases is tied to optimal physical, chemical and mainly biological properties of soils (Altieri and Nicholls, 2003). On the other hand, farming practices, such as excessive use of inorganic fertilizers, can cause nutrient imbalances and lower pest resistance. Farmers’ inability to adequately manage soil fertility is in part due to limited resources but also due to limited awareness on fertility management. This ties in again with limited extension to adequately address farmer production constraints.
2.3.6 Other factors
Other factors contributing the pest problem include; climate change and lack of collective action. a) Climate change
Climate change was also considered a key problem, but was mentioned as a phenomenon that was taken for granted and hence took long to institute mitigation measures. Most respondents agreed that there a number of pest problems that they observe today which have become more prevalent than they were in the past. However, some attributed this to the open borders and lack of proper regulation of movement crop products within the country rather than climate change. b) Lack of collective action
Effective management of some pests requires concerted efforts and collective action. Collective action ensures community wide management of pests, because if only a few farmers implement pest management, their crops may still be infected as a result of poor practices their neighbours fields. For example, banana xanthamonas wilt (see box 2) and coffee wilt diseases were to a large extent managed due to community participation and vigilance. The current increasing spread of coffee twig borer could also be attributed to lack of collective action, where some farmers manage their fields but get re-infestation from neighbouring unmanaged fields.
Box 2: Community awareness and collective action key to disease containment
Banana is a key strategic crop for Uganda both for food and income security. Emergence of and spread of Banana Xanthomonas wilt (BXW) resulted in huge financial loses because the banana value chains supports millions both directly and indirectly. Among the mitigation practices put in place by government was to mobilise human and financial resources and conduct comprehensive campaigns for disease awareness among key value chain actors and service providers. However, there was also investment to: raise public awareness; provide community-level facilitation and; ensure information exchange and well-defined reporting mechanisms were put in place. Robust diagnostic tools were developed including field diagnosis to ensure that farmers even in absence of extension officers could diagnose the disease. All diagnostic tools developed were tested for field detection of BXW and fine-tuned for gender responsible cultural control. Investments were also made in research to develop resistant varieties and/or selected wilt-escaping genotypes through genetic transformation. At the local government level, effective coordination mechanisms were put in place through stakeholder meetings, creation of platforms for BXW control such as the Ankole Stakeholders Platform, and development of
Box 1: Promoting seed entrepreneurship in Tanzania, the case of QDS system
In Tanzania, existing quality assurance mechanisms include; quality declared seed (QDS), certified seed and specialized (non-certified) seed. Certified and specialized seed are generally applied to commercial seed especially of high value crops and hybrids. A QDS production system was introduced by the government in Tanzania, with support from the Danish Government in 2000, a modification of the FAO QDS. QDS was incorporated into the formal seed system in the national Seeds Act of 2003, along with its seed rules, regulations & procedures (2007) and Guidelines for control (2007) for the QDS production. The type of seed produced is usually for crops/varieties that have not gained accessibility to the area as certified grades, and/or open pollinated varieties. QDS helps to address the gap between the formal and informal seed systems. Review of QDS in Tanzania shows that it has played a key role is providing quality seed for crops that are not well integrated into the commercial / certified seed system, and farmers in remote areas not well served by the formal sector are able to access quality seed. QDS is produced by a registered, trained small scale farmer or a group of small-scale farmers producing seed for their own use or for sale to the neighboring farmers within the ward where the QDS is produced. Field inspections are done by the official seed certification agency (10%) and Authorized District Seed Inspectors (90%), who are normally extension workers from the Ministry of Agriculture, Food Security and Cooperatives (MAFSC). Discussions with seed inspectors showed that QDS seed has generally been good and meets minimum quality standards. They indicated that rejection rate has been less than 20% across the region. Rejected seed is usually sold by farmers as saved seed at lower price than QDS. Source: Kansiime et al. (2015).

Platform for Agricultural Risk Management | Crop pests and disease management in Uganda: status and investment needs
Platfo
rm fo
r Agricu
ltural R
isk M
anagem
ent | C
rop
pests an
d d
isease man
agemen
t in U
gand
a: status an
d in
vestmen
t need
s
19 Uganda | Tools Assessment | Full Report | March 2017
regional strategies for containment. Farmers’ knowledge and skills for BXW management and other banana pests and diseases were enhanced through field days and information campaigns. Local government capacities to prevent and respond to banana pest and disease epidemics were developed particularly through enforcement of bylaws. Similar strategies especially community awareness about disease identification and management by cultural means were employed in the early 2000s for the effective management of coffee wilt disease. Source: Kubiriba et al. (2012) and Nankinga and Okasaai (2005)

Uganda | Tools Assessment | Full Report | March 2017 20
Platform for Agricultural Risk Management | Crop pests and disease management in Uganda: status and investment needs
Fig
ure
2:
Roo
t ca
uses c
on
trib
utin
g t
o th
e s
pre
ad
of p
ests
and
dis
ease
s
Sp
rea
d th
rou
gh
ma
rke
tin
g
of in
fecte
d s
eed a
nd
pro
du
ce
Lim
ite
d g
en
era
l
su
rve
illa
nce
/
ea
rly w
arn
ing
Info
rma
tion to
in
form
de
cis
ion
s n
ot a
de
qu
ate
Lim
ite
d a
wa
ren
ess
of p
rod
uct
sta
nd
ard
s
Lim
ited
en
forc
em
ent
of m
ate
ria
l
mo
ve
me
nts
No
t e
no
ugh
co
un
ty-s
taff
Co
un
ty s
taff
ha
ve
no
arr
est
au
tho
rity
Ina
de
qua
te
dia
gn
osis
Ina
de
qua
te
dia
gn
ostic s
taff
Ina
de
qua
te la
b
equ
ipm
ent
Po
or
inte
rna
l co
ntr
ol
Ina
de
qua
te
bo
rde
r co
ntr
ol
On
ly 5
/30
Bo
rde
r p
osts
ma
nn
ed
Weak lin
ks
be
twe
en
D
CP
exte
nsio
n
Clin
ics n
ot
inte
gra
ted
= H
um
an
re
so
urc
es c
on
str
ain
t
= O
the
r
Fe
w p
lan
t
do
cs
Ne
w p
ests
sp
rea
d;
Pe
sts
no
t e
ffe
ctive
ly
co
ntr
olle
d
Ph
yto
sa
nita
ry r
eg
ula
tio
ns
Lim
ite
d
sta
ff
Ou
tbre
aks g
o
un
no
ticed
Fe
w s
pe
cific
surv
eys
Info
rma
tio
n s
yste
m

Platform for Agricultural Risk Management | Crop pests and disease management in Uganda: status and investment needs
21 Uganda | Tools Assessment | Full Report | March 2017
Fig
ure
3:
Roo
t ca
uses a
ssocia
ted
with
po
or
farm
le
ve
l m
ana
ge
me
nt o
f p
ests
and
dis
eases
La
ck o
f
aw
are
ne
ss o
f
so
lution
s
Po
or
farm
level
man
ag
em
en
t
Cou
nte
rfeit
ch
em
icals
Farm
ers
do
n’t s
ee
k
ad
vic
e
Ina
de
qua
te
testin
g f
acili
ties
at D
CP
Lim
ite
d
en
forc
em
ent o
f
regu
lations
Lim
ite
d b
ord
er
co
ntr
ol
Few
exte
nsio
n
sta
ff
No s
olu
tion
s /
no
pra
ctical
so
lution
s
Exte
nsio
n s
taff
no
t aw
are
of
so
lution
s
Farm
ers
no
t re
ach
ed
Ine
ffic
ient
ap
pro
ach
es
Farm
ers
do
n’t
follo
w a
dvic
e
Tire
d o
f
co
nflic
ting/p
oor
ad
vic
e
Ad
vic
e n
ot
eco
no
mic
ally
via
ble
Con
tracte
d
testin
g p
ron
e to
ma
nip
ula
tion
La
nd
to
o
sm
all
Po
or
ma
rkets
Infr
astr
uctu
re
an
d s
taff
ing
po
or
La
ck o
f lin
ks to
inte
rna
tion
al
ca
pa
city
Po
or
qu
alit
y
se
ed
Inad
equate
ce
rtifie
d s
ee
d
Few
MA
AIF
insp
ecto
rs
Ina
de
qua
te
QD
S
insp
ecto
rs
Pe
na
ltie
s to
o low
/
po
or
or
fa
ke
se
ed
no
t d
estr
oye
d
Inp
uts
no
t
acce
ssib
le
Form
al
ce
rtific
ation
exp
en
siv
e
QD
S n
ot
we
ll
de
ve
lop
ed
Pesticid
e r
egu
lation
See
d r
egu
lation
Ma
rkets
A
dvis
ory
se
rvic
es
Pe
sts
no
t e
ffe
ctive
ly
con
trolle
d

Platfo
rm fo
r Agricu
ltural R
isk M
anagem
ent | C
rop
pests an
d d
isease man
agemen
t in U
gand
a: status an
d in
vestmen
t need
s
Platform for Agricultural Risk Management | Crop pests and disease management in Uganda: status and investment needs
Uganda | Tools Assessment | Full Report | March 2017 22
2.4 Current pest management options
As noted, Uganda is vulnerable to pest and disease attack especially due to environmental conditions that favour availability of crops in most parts of the region. The weather also favours the pests and diseases. Virtually every crop is affected by pests and therefore requires some form of pest management during cultivation. Some crop pests have largely been managed for example coffee wilt disease and banana xanthomonas wilt, but new pests keep emerging for example the coffee twig borer. For cassava, the problem has been the cassava mosaic disease, now the new challenge is the Brown Streak diseases. Table 3 shows a summary of key crop pests and available pest management options. Table 3: Major crop pests and diseases in Uganda and available management options Crop Major Pest/Disease Available management options
Coffee Coffee wilt disease [CWD]) Uproot and burn infected coffee trees (together with neighbouring trees) on site as soon as symptoms appear
If more than 70% of coffee trees are affected uproot and burn all coffee trees in the farm and replant with resistant/tolerant coffee germplasm
Restrict movement of infected planting materials, coffee husks and soil
Disinfect farm tools that have been used in an infected garden using flames or Jik solution (5%)
When pruning or handling plants, start with the healthy looking plants first
Avoid wounding of plants e.g. during weeding
Plant resistant varieties
A fallow period of 6 months to 2 years before replanting with susceptible coffee seedlings
Chemical control is difficult but painting cut stem and braches with copper-based fungicides (e.g. copper oxychloride solution) may reduce infection
Coffee leaf rust [CLR) (H. vastatrix Berk. and Br.)
Cultural strategies include; open pruning to reduce humid conditions; regular stumping; good weeding and soil fertility management to ensure strong and healthy trees
Supplement cultural practices by applying copper-based fungicides (2.5g per litre of water) every 3 weeks starting at the onset of rains for a maximum of 5 sprays per season
Alternatively, apply curative or systemic fungicides; spray the underside of the leaves as well
Coffee berry disease [CBD] Plant tolerant varieties e.g. SL14
Practice good field hygiene including: regular harvesting all ripe cherries; removing all remaining dried or ripe cherries from the tree or the ground at the end of the harvest; pruning coffee and shade trees to reduce humidity levels
Improving soil fertility management
Spray with copper-based fungicides such as Copper Nordox 75% (140g/CP20) – at the onset of rain in a well pruned and weeded garden at 4 week intervals
Black Coffee twig borer [BCTB] (Xylosandrus compactus (Eichhoff))
Regularly monitor fields for infestation
Field sanitation; trim off and burn infected branches; clean weeding; stump coffee trees if infestation is high; reduce excess shade
For heavily affected fields beyond 15% infestation, encourage farmers to seek expert advice from extension staff
Advise your neighbours to also control BTB to prevent re-infestation of your field
Use of adequate fertilizer and irrigation to ensure vigorous plants can speed recovery from pruning injury
Spray infested field with Imax (Imidacroprid) pesticide at 4mls/ litre of water
Banana (Musa spp.)
Bacterial Xanthomonas wilt [BXW] (Xanthomonas campestris pv musearum)
Early removal of male buds i.e. appx 2 weeks after emergence of the inflorescence & disinfection of cutting tools
Use clean planting material e.g. cultivars Mpologoma, Atwalira, Kisansa, Gonja, Kabana 3 (FHIA 17) & FHIA 25 o Combination of cultural practices: desuckering, monocropping, weeding, de-trashing, manure
application, mulching & soil/water conservation
Panama disease or Fusarium wilt (Fusarium oxysporum f.sp cubense)
Sanitary practices: removal of affected plants; providing adequate drainage; composting household refuse prior to its application to soil
Use of pathogen-free planting material in disease free soils
Black sigatoka or black leaf streak (Mycosphaerella fijiensis)
Use of resistant cultivars e.g. FHIA 01, FHIA 03, FHIA 17 and FHIA 23 hybrids
Cultural practices that reduce humidity in the field e.g.: correct spacing or plant density; good field sanitation; absence of weeds; and good drainage
Good fertilisation of banana plants reduces the impact of diseases through an increase in the rate of leaf production from photosynthesis.
Banana weevil (Cosmopolites sordidus)
Field sanitation e.g. destruction of crop residues
Plant healthy planting material which do not any visible tunnels
Hot water treatment of clean trimmed suckers to kill eggs and grubs
Applications of neem powder to reduce weevil numbers
Use appropriate insecticides at time of planting to reduce weevil numbers
Cotton African bollworm (Helicoverpa armigera)
Trap cropping/intercropping with marigold (cv. Golden Age) reduces both eggs and larvae of the African bollworm
Use neem tree (Azadirachta indica) extract as spray and other organic pesticides
Pheromone traps

Platform for Agricultural Risk Management | Crop pests and disease management in Uganda: status and investment needs
23 Uganda | Tools Assessment | Full Report | March 2017
Crop Major Pest/Disease Available management options
Cassava (Manihot esculenta)
Cassava brown streak disease [CBSD]
Use only healthy and disease free cuttings for planting
Plant tolerant/resistant varieties e.g. NASE 12
Remove and destroy any plants with symptoms of the disease including alternative hosts
Early harvesting
Disease surveillance & quarantine
Control of whiteflies (insect vector)
Cassava mosaic disease [CMD]
Inspect plants regularly for symptoms of disease and remove (roguing) and destroy any plant showing symptoms
Use resistant varieties e.g. ‘Rwizihiza’, ‘Ndamirabana’, ‘Cyizere’, ‘Seruruseke’, ‘Mavoka’, ‘Garukunsubir’ and ‘Mbakungahaze’
Use clean planting materials and avoid planting cuttings from plants showing symptoms of the disease
Cassava bacterial blight [CBB], (Xanthomonas axonopodis pv. manihotis)
Crop rotation with non-host
Intercropping with maize and melon
Field sanitation: plough crop debris into soil after harvest or remove and burn, pruning infected parts of the plant
Use clean planting cuttings obtained only from healthy plants
Cassava green mite (Mononychellus tanajoa, M. progresivus)
Together with Cassava mealy bug (Phenacoccus manihoti), the green mite has been effectively controlled using biological control (Typhlodromalus aripo)
Crop rotation, early planting, and intercropping
Maize Maize Lethal Necrosis (MLND) Use certified seed of tolerant maice varieties eg BAZOOKA (UH5354)
Avoid using home saved seed from previously infested MLN fields and seed from unknown sources eg local markets or country boundary seed exchange
Ensure proper soil fertility is maintained through use of manure and inorganic fertilisers
Avoid planting maize near crops in the grass family eg sorghum, millet, nappier. These are alternative hosts to MLN transmitting insects
Crop rotation with potato or common legumes to reduce disease incidence built up during previous season
Field sanitation – removal of weeds, volunteer maize crops
Uproot and burn MLN infected maize crops
Maize streak virus Grow resistant maize lines
Larger Grain Borer Mainly a storage pest and sources of infestation include; cross infestation from neighboring lots of stores; migration from waste or rubbish; hiding places in stores e.g. cracks; use of infested bags; and introduction of infested lots.
Cultural management practices; good store hygiene; removing and burning infested residues; immersing grain sacks in boiling water; fumigating the store to eliminate residual infestations; selection of only uninfected material for storage
Harvesting the maize as soon as possible after it has reached maturity will reduce the chances of attack by LGB and other storage pests.
Use of resistant cultivars
Chemical control using synthetic pyrethroid insecticides such as permethrin and deltamethrin. Only for grain that will be stored for long
Striga Seed treatment with herbicide (Imazapyr)
Incorporate soil fertility practices such as use of legume rotation and intercrops and fertiliser additions to replenish soil nutrients and optimise crop yields.
Aflatoxins Use healthy improved and early maturing seed varieties
Dress seeds with appropriate agro-chemicals before planting
Maintain at least 2 years of crop rotation in order to reduce the build-up of Aflatoxin producing fungi
Avoid using farm from which maize, cotton, tobacco and tomatoes, have just been harvested – these crops are susceptible to soil borne Aflatoxin producing fungi
Control soil inhabiting insects such as termites
Harvest the crop at right maturity and maintain the right moisture content
Grain infested by fungi should not be used as feed or food
Rice Bacterial blight Resistant varieties
Cultural practices – burn crop residue after harvesting heavily infested fields, destroying the surrounding weeds that serve as a reservoir of the pathogen, and management of fertilizers, particularly nitrogen
Beans Angular leaf spot Bean rust
Often, angular leaf spot and bean rust occur simultaneously (Paparu et al. (2014)
Can be controlled using fungicides, resistant varieties, biological control and cultural practices such as intercropping, crop rotation, optimum plant spacing and use of soil amendments that promote soil health and plant nutrition (Pamela et al., 2014)
Use of fungicide in Uganda is however limited to beans with high commercial value e.g. snap beans

Platfo
rm fo
r Agricu
ltural R
isk M
anagem
ent | C
rop
pests an
d d
isease man
agemen
t in U
gand
a: status an
d in
vestmen
t need
s
Platform for Agricultural Risk Management | Crop pests and disease management in Uganda: status and investment needs
Uganda | Tools Assessment | Full Report | March 2017 24
Crop Major Pest/Disease Available management options
Potato Ralstonia Also affects tomato, eggplant, nightshade and other solanacea plants
Use clean planting material
Organic matter amendments, such as plant residue, animal waste, and simple organic compounds, have been reported to suppress bacterial wilt diseases
Biological control agents e.g. R. solanaceurum, Pseidomonass spp, Bacillus spp, and Streptomycetes spp
Fruit and veg Tuta Absoluta (tomato) Using pheromone traps (Tutrack) and/or sticky traps
Chemical management e.g. chlorantraniliprol at a rate of 2ml in 20 litres of water, sprayed each time the pest is observed
Crop rotation with non-solanaceous crops
Field sanitation – remove and destroy crop residue and affected crops
Farmers in the area should comply with crop rotation ie have a season when there is not tomato growing
Plant pest free seedlings
Fruit fly (mango) Bagging (put a single fruit in a bag)
Collecting fallen fruits and burying them. Should be buried to a depth of not less than 2m
Use of pheromone traps
False codling moth (capsicum) Has a wide range of hosts- cotton, coffee, citrus, maize, sorghum, pineapple etc. so chemical control may not be feasible
Use cultural practices - destroy affected plants, use clean planting materials
Monitor fields for signs on pest
Avoid moving infected plant parts from one farm to another
Farmers advised not grow capsicum in a field where tree crops such as citrus, coffee have previously been affected by the moth

Platform for Agricultural Risk Management | Crop pests and disease management in Uganda: status and investment needs
25 Uganda | Tools Assessment | Full Report | March 2017
3. Legal and institutional framework for pest
management
3.1 Relevant legal documents
3.1.1 National Development Plan
The second national development plan (NDPII) covers the period 2015/16 to 2019/20. Agriculture is one of three prioritised areas (along with tourism and minerals, oil and gas). Although growth during the first national development plan was only around 1% per annum, attributed to a range of factors including crop pests and diseases, in line with the Comprehensive Africa Agriculture Development Program (CAADP), the sector is seen as critical to economic development. Infrastructure development and human capital development are also prioritised as fundamental to growth and the goal of achieving middle income status by 2020.
In agriculture 12 value chains are prioritised for investment (Cotton, Coffee, Tea, Maize, Rice, Cassava, Beans, Fish, Beef, Milk, Citrus and Bananas), 7 of which are crops, including the four which are reported by MAAIF as suffering the highest monetary loss due to pests (banana, cassava, cotton and coffee). For these 12 value chains, emphasis will be on the following:
strengthening agricultural research and implementing the single spine extension system
technology adaptation at the farm level
increasing access to and effective use of critical farm inputs
promoting sustainable land use and soil management
increasing access to agricultural finance with specific options for women farmers
strengthening agricultural institutions for effective coordination and service delivery
Key interventions planned for agriculture are in Table 4. While only one intervention refers directly to pests (1(vii) – control pests, diseases and vectors), a number of the others will affect how pests are controlled:
1(i) refers to ecologically sound technologies and practices, which could include Integrated Pest Management (IPM), although IPM is never mentioned.
Two interventions (1(iii) and 3(ii)) refer to quality standards, market requirements, regulation and safety standards, all of which are related to pest management, particularly the level of use of pesticides
A number of interventions concern the provision of information (1(ii), 4(iii), 4(v) and other services (2(i-iv)) to farmers, which can affect how pests are managed
The promotion of investment in storage infrastructure to reduce post-harvest losses (2(iv)) will affect management of stored product pests.
Elsewhere in the NDP it is said that a national regulatory mechanism consistent with the World Trade Organization (WTO) Sanitary and Phytosanitary (SPS) Agreement will be established, which would include phytosanitary issues for which DCP is responsible.

Platfo
rm fo
r Agricu
ltural R
isk M
anagem
ent | C
rop
pests an
d d
isease man
agemen
t in U
gand
a: status an
d in
vestmen
t need
s
Platform for Agricultural Risk Management | Crop pests and disease management in Uganda: status and investment needs
Uganda | Tools Assessment | Full Report | March 2017 26
Table 4: Interventions under the Agriculture Objective in the NDPll
Objective (Agriculture) Interventions
1. Increase agricultural production and productivity.
i. Strengthen ecologically sound agricultural research and climate change resilient technologies and practices.
ii. Implement the Single Spine Agricultural Extension system while promoting gendered innovation in agricultural research centres and extension services.
iii. Strengthen quality assurance, regulation and safety standards for agricultural products. iv. Increase access to agricultural finance services. v. Accelerate the development and commercialisation of the prioritised agricultural commodities. vi. Increase market access and improve physical agricultural infrastructure. vii. Control pests, diseases and vectors. viii. Enhance consumption of diverse diets at household level. ix. Develop early warning systems to prevent and mitigate shocks affecting nutrition and food security. x. Promote commercialisation of agriculture particularly amongst small holder farmers. xi. Strengthen Farmer Group formation and cohesion including commodity associations, platforms, federations
and co-operatives. xii. Enhance Sustainable Land Management Practices (SLM). xiii. Promote time and labour saving technologies targeting women farmers.
2. Increase access to critical farm inputs
i. Improve access to high quality animal breeds, seeds and planting materials. ii. Enhance access to and use of fertilisers by both women and men. iii. Increase access to water for agricultural production (Irrigation, water for livestock, aquaculture-fish
ponds/caging). iv. Increase agricultural mechanisation (Farm Power).
3. Improve agricultural markets and value addition for the 12 prioritised commodities
i. Promote private sector investment in value addition. ii. Build capacities of farmers, trades and processors in quality standards and market requirements. iii. Operationalize the commercialisation fund. iv. Promote investment in storage infrastructures to reduce post-harvest losses.
4. Strengthen institutional capacity of MAAIF and public agricultural agencies
i. Operationalize the new MAAIF structure ii. Strengthen capacity of MAAIF and its associated agencies as well as the Production Departments in the LGs
for effective coordination, regulation, planning, reporting and implementation iii. Revitalise and strengthen Agricultural Training Institutes (ATIs) (Bukalasa College and Fisheries
Training Institute), to effectively respond to knowledge and skills requirements in the extension service.
iv. Mainstream crosscutting issues (HIV/AIDS, climate change, gender, environment, etc) in planning and budgeting.
v. Strengthen LGs production departments’ capacity to deliver extension and other farm support services.
3.1.2 National Agricultural Policy (NAP) 2013
The vision of the NAP is “A Competitive, Profitable and Sustainable Agricultural Sector”, and the mission is “To transform subsistence farming to sustainable commercial agriculture.” There are 5 objectives:
Ensure household and national food and nutrition security for all Ugandans
Increase incomes of farming households from crops, livestock, fisheries and all other agriculture related activities
Promote specialization in strategic, profitable and viable enterprises and value addition through agro-zoning
Promote domestic, regional and international trade in agricultural products
Ensure sustainable use and management of agricultural resources
These have much in common with the agriculture component of NDPII, which built on the NAP. As in the NDPII, pests are mentioned as a cause of limited production, and something that will be addressed. The policy also describes the roles of key stakeholders (see section 3.2), and notes that as a result of the creation of a number of agencies, several divisions and departments have been re-organised, including those with responsibility for disease and pest control.

Platform for Agricultural Risk Management | Crop pests and disease management in Uganda: status and investment needs
27 Uganda | Tools Assessment | Full Report | March 2017
3.1.3 Agriculture Sector Strategic Plan (ASSP)
The Agriculture Sector Strategic Plan 2015/16-2019/20 (ASSP) is still in draft; this analysis is based on the April 2016 version. The ASSP follows on from the Agriculture Sector Development Strategy and Investment Plan (DSIP) for the period 2010/11 to 2014/15, and is based on a review of the DSIP. So the ASSP, NAP and NDPll have much in common.
In general the performance of the agriculture sector over the period of the DSIP was disappointing. Productivity of some crops increased only slightly, while for others productivity actually declined. The review highlighted some success. In the area of pest management progress was made in developing policies (mainly the Plant Protection and Health Act), resulting, it is claimed, in improved control of pests, vectors and diseases, although no evidence is presented. The review also found that continuous countrywide forecasting of crop pest and diseases was undertaken, and that the capacity of the MAAIF laboratory technicians was strengthened for diagnosis of pests and diseases. Furthermore it is stated that a robust post-entry quarantine regime to handle dangerous pests, diseases and weeds was established at various border posts.
Despite these successes, a high prevalence of pests and diseases is cited as a serious constraint, examples mentioned in the plan coffee wilt disease, banana xanthomonas wilt, cassava brown streak virus, fruit flies and citrus canker, all pests of the priority crops. One of the lessons from DSIP was that new and emerging pests and diseases are serious impediments to production, and by implication the ability to respond effectively to such pests will be necessary to achieve the ASSP targets.
The ASSP vision is ‘A competitive, profitable and sustainable sector’. Its mission is ‘Transforming the sector from subsistence farming to commercial agriculture’. In contrast to the sluggish performance over the last 5 years, the goal is an average growth rate of 6% per year over the period of the plan. The ASSP has four strategic objectives:
i. Increasing agricultural production and productivity; ii. Increasing access to critical farm inputs; iii. Improving agricultural markets and value addition; and iv. Improving service delivery through strengthening the institutional capacity of MAAIF and its agencies.
Crop protection largely falls under Objective 1, which aims to strengthen:
Generation and adoption of research technologies;
Provision of extension services: enhancing access to extension services through operationalisation of the single spine agricultural extension system;
Control of pests, diseases and vectors among crops and animals by strengthening the institutional and regulatory framework; strengthening the capacity of laboratories and disease control infrastructure; and conducting market surveillance to rid the market of counterfeit agro-chemicals.
Box 3: Description of control of crop and livestock pests and diseases from ASSP
This action will encompass the following interventions. a) Crop and livestock pests and disease control regulatory strengthening through formulating, reviewing and
operationalisation of supportive policies, legislation, standards and guidelines for pests, vectors and disease control including data collection for informed policy analysis and planning. This will be complemented with creation of awareness among the public on the new regulations to enhance control and compliance. The target audience will include crop and livestock farmers, traders, transporters, abattoir managers, law enforcement agencies, security personnel, DLG officials, Uganda Revenue Authority (URA) personnel, consumers and the general public.
b) Conducting early detection of crop and livestock pests, vectors, weeds and diseases outbreaks and timely reporting of crop pests, weeds and disease outbreaks is essential for rapid field investigations, laboratory confirmation and prompt interventions to control them. Investments will target the establishment of a functioning early warning and detection system for all outbreaks. This will involve upgrading the surveillance systems using communities and modern technology, timely reporting of diseases, vectors and pest outbreaks and conducting routine surveillance in addition to procurement of appropriate agro-chemicals and equipment to address the outbreaks;
c) Establishing and maintaining functional crop and livestock pests and disease control infrastructure through investments that will target establishment of functioning regulatory infrastructure needed for effective pests and disease surveillance and control. This will include laboratories, as well as other appropriate infrastructure for enforcement e.g. that required at border posts;
d) Controlling crop and livestock pests, diseases and vectors to ensure that communicable diseases are effectively managed in order to promote crop and livestock health as a means to higher production, productivity and market penetration. Over the plan period, surveillance, prevention and control measures will be implemented for each of the priority commodities and for the seven major livestock diseases, namely: tsetse and Trypanosomiasis; east coast fever; foot and mouth disease; rift valley fever; African swine fever; rabies; and animal brucellosis.

Platfo
rm fo
r Agricu
ltural R
isk M
anagem
ent | C
rop
pests an
d d
isease man
agemen
t in U
gand
a: status an
d in
vestmen
t need
s
Platform for Agricultural Risk Management | Crop pests and disease management in Uganda: status and investment needs
Uganda | Tools Assessment | Full Report | March 2017 28
Crop and livestock pests and diseases are lumped together here, which is reasonable at the level of detail in the ASSP, but clearly much more detailed plans will be needed where the two areas are separated. The ASSP notes that a number of framework implementation plans (FIPs) were developed for the non-commodity areas, including “one on research, extension and pests and disease control”, as well as another on inputs (seeds, fertiliser, agricultural mechanisation and water). It is stated that the respective Ministries, Departments, Agencies and local governments will also develop annual operational plans (AOPs) for these areas that will be integrated into the National Agricultural Annual Operational Plan. During this analysis, the FIP covering pest and disease control, was not seen but rather a draft report of the thematic review on pest and disease control (MAAIF, 2015a). However, the draft was concerned almost entirely with control of livestock pests and diseases, with very little on crop pests. It is not clear whether this reflects what is in the FIP, or whether the DCP had not had chance to make its input into the draft. In either case there is a need for more detailed planning for crop pest management.
In the budget crop and livestock pests are separated, as shown below in an extract from the budget (ASSP Annex D). On the one hand a total of UGX 84bn for crop pest management over 5 years is a substantial sum (approximately US$5m per year). However, in comparison with the amount for livestock pest and disease control it is relatively small, comprising just 1.83% of the total ASSP budget compared to 6.39% for livestock pests and diseases. While it may be more expensive to control livestock pests and diseases, this seems disproportionate. Of the US$4bn agricultural exports targeted by 2019/20 (ASSP Annex C), about 73% is from crops rather than livestock. Thus per dollar of targeted export value, the investment in livestock pests and diseases is nearly 10 times the investment in crop pests and diseases.
Table 5: Extract of ASSP Budget (NDPII constrained version) covering crop and livestock pests and diseases
(figures in UGX billions)
There are some additional funds for activities related to crop pest and disease management elsewhere in the budget. Table 6 below shows the main ones.
Table 6: Extract of ASSP Budget (NDPll constrained version) showing additional budgets related to crop and
livestock pests and disease (figures in UGX billions)
Budget line Year 1 Year 2 Year 3 Year 4 Year 5 Total
Outcome 1, Strategy 5: Control pests, vectors, diseases
Control of pests and diseases for crops
Crop pest and disease control regulatory strengthening 1.5 1.5 1.5 1.5 1.5 7.5
Conduct early detection and control of crop pests, weeds, diseases 4 4.4 4.84 5.32 5.86 24.42
Crop pests and disease control infrastructure 4 4 4 4 6 22
Banana bacterial wilt control 0.4 0.9 0.9 0.9 0.9 4
Management of coffee diseases and pests 4.93 4.93 4.93 4.93 6.9 26.6
Total for crop pests and diseases 14.83 15.73 16.17 16.65 21.15 84.52
Livestock diseases, vectors
Control livestock diseases and vectors 26.95 46.86 46.47 51.37 64.8 236.45
Policy and Regulatory Environment for Livestock desease control 2.81 2.26 1.62 1.66 1.73 10.08
Establish disease control infrastructure and operationalisation 6.6 10.29 9.9 9.07 13.16 49.02
Total for livestock pests and diseases 36.36 59.41 57.99 62.1 79.69 295.55
Grand total for Outcome 1, Strategy 5 51.18 75.14 74.15 78.76 100.85 380.07
Budget line Year 1 Year 2 Year 3 Year 4 Year 5 Total
Outcome 1, Strategy 1
Characterizing plant and animal disease strains and agents 3.57 3.62 3.64 3.71 3.79 18.33
Release pest and drought resistant varieties/breeds 4.71 4.85 4.98 5.13 5.34 25.01
Outcome 1, Strategy 4
Control of the new breed of weed and water hyacinth 1.2 1.2 1.5 1.9 5.8
Outcome 2, Strategy 2
Improve phytosanitary control at entry points 0.74 1.04 0.24 0.24 0.24 2.5
Several crop-specific lines on planting material, eg
Distribution of quality clean pineapple seedlings tolerant to P&D 0.9 0.9 0.9 0.9 0.9 4.5

Platform for Agricultural Risk Management | Crop pests and disease management in Uganda: status and investment needs
29 Uganda | Tools Assessment | Full Report | March 2017
The FIP may include additional details on how crop protection activities might be financed on an ongoing basis. Commercialised agriculture provides more opportunity for revenue collection, through general levies as well as specific fees for crop protection related activities such as field inspections and the issue of phytosanitary permits for consignments being exported. In some countries such fees are remitted to the treasury, while in other countries at least a portion of the income generated by the phytosanitary service is retained. Retention of the fees by the regulatory agency has some merits, although it can create a perverse incentive to increase regulation, rather than decrease it to the minimum level necessary to achieve public policy goals.
A specific case in which cost-sharing might be possible is when a new pest arrives in the country. This needs discussing and agreeing as part of a contingency or emergency response plan, and in some countries cost sharing arrangements are defined for different categories of pests in terms of where the costs and benefits accrue. So for example, for a new pest affecting a crop predominately produced by large scale commercial farmers, a higher proportion of the cost of the emergency response action would be covered by the private sector than for a new pest that predominately affected smallholders.
3.1.4 The Plant Protection and Health Act, 2016
The preamble identifies the purpose of the new act:
Consolidate and reform the law relating to protection of plants against destructive diseases, pests and weeds
Prevent the introduction and spread of harmful organisms that may adversely affect Uganda’s agriculture, the natural environment and livelihood of the people
Ensure sustainable plant and environmental protection
Regulate the export and import of plants and plant products and introduction of new plants in accordance with international commitments on plant protection
Protect and enhance the international reputation of Ugandan agricultural imports and exports
To entrust all plant protection regulatory functions to the government These objectives are in line with the International Plant Protection Convention (IPPC), to which Uganda is a contracting party. In particular, the convention requires contracting parties to nominate a National Plant Protection Organization (NPPO), and specifies the NPPO’s responsibilities (Box 4).
Box 4 Responsibilities of a National Plant Protection Organization (from IPPC Article lV).
The issuance of certificates relating to the phytosanitary regulations of the importing contracting party for consignments of plants, plant products and other regulated articles
The surveillance of growing plants, including both areas under cultivation (inter alia fields, plantations, nurseries, gardens, greenhouses and laboratories) and wild flora, and of plants and plant products in storage or in transportation, particularly with the object of reporting the occurrence, outbreak and spread of pests, and of controlling those pests, including the reporting referred to under Article VIII paragraph 1(a)
The inspection of consignments of plants and plant products moving in international traffic and, where appropriate, the inspection of other regulated articles, particularly with the object of preventing the introduction and/or spread of pests
The disinfestation or disinfection of consignments of plants, plant products and other regulated articles moving in international traffic, to meet phytosanitary requirements
The protection of endangered areas and the designation, maintenance and surveillance of pest free areas and areas of low pest prevalence
The conduct of pest risk analyses
To ensure through appropriate procedures that the phytosanitary security of consignments after certification regarding composition, substitution and reinfestation is maintained prior to export
Training and development of staff
The Act addresses all these issues, with the exception of training and development, although that would not necessarily appear in such an act. However, while the Act does align the plant protection institutional framework with the IPPC, it is noted that there are some slight inconsistencies.
The definitions provided in the Act have some small but potentially significant differences from the definitions provided by the IPPC (in ISPM5, Glossary of terms). Table 7 shows the IPPC definition of Quarantine, which is the official confinement of regulated articles. The IPPC defines a regulated article (see Table 7), while the Act does not, but instead spells out the items in the definition of quarantine. However, the list of items is narrower than that included in the definition of regulated article; for example, conveyances is included in “regulated items”, but not listed in the Act’s definition of quarantine. However, paragraph 16 of the Act is titled Conveyance, and the provisions would allow it to treat a conveyance as a regulated article for quarantine purposes.
A related example is in the definition of a quarantine pest. The IPPC definition includes a pest present in the country, not widely distributed, and being officially controlled. In contrast the definition of a quarantine pest in the

Platfo
rm fo
r Agricu
ltural R
isk M
anagem
ent | C
rop
pests an
d d
isease man
agemen
t in U
gand
a: status an
d in
vestmen
t need
s
Platform for Agricultural Risk Management | Crop pests and disease management in Uganda: status and investment needs
Uganda | Tools Assessment | Full Report | March 2017 30
Act is very similar but includes pests not widely distributed but being actively controlled, a broader definition than the IPPC’s, given the definition of official control (see table 7). However, in paragraph 20(d) the Minister is empowered to declare a pest to be a quarantine pest “if it presents or is likely to present a threat to the production of or trade in plant materials or the natural environment, and if is either not known to be established in Uganda, or is established in Uganda but is the subject of measures for its eradication or containment”. This is nearer to the IPPC meaning of “official control”, though here the distribution of the pest has not been mentioned as it is in the IPPC definition.
Table 7: Some definitions from the IPPC Glossary and the Plant Protection and Health Act
Term IPPC Glossary (ISPM5) Plant Protection and Health Act
Official control The active enforcement of mandatory phytosanitary regulations and the application of mandatory phytosanitary procedures with the objective of eradication or containment of quarantine pests or for the management of regulated non-quarantine pests
Not defined
Quarantine Official confinement of regulated articles for observation and research or for further inspection, testing or treatment
Official confinement of plants and plant products, organisms harmful to plants, beneficial organisms, goods or soil being imported into or exported from Uganda, subject to phytosanitary regulations, for observation and research, for further inspection and or testing
Quarantine pest
A pest of potential economic importance to the area endangered thereby and not yet present there, or present but not widely distributed and being officially controlled
A pest of potential national economic importance to the country endangered by such pest, and not yet present there, or present but not widely distributed and being actively controlled
Regulated article
Any plant, plant product, storage place, packaging, conveyance, container, soil and any other organism, object or material capable of harbouring or spreading pests, deemed to require phytosanitary measures, particularly where international transportation is involved
Not defined
These inconsistencies should not normally prove problematic, although it is possible that should a trade issue arise, they could confuse rather than help clarify the situation.
This act repeals the Plant Protection Act, although regulations, notices etc. made under that act remain in force until revoked or amended, and provided they are consistent with the provisions of the new act. A set of new regulations for implementation of the Act is in draft. An important feature of the Act is that it provides wide-ranging powers to the Minister, Commissioner for Plant Protection, and inspectors. In principle this should make it easier to take the necessary action to respond to new pests.
The Act also appears to provide for the regulation of biological control agents. Paragraph 9 empowers the Minister to make rules for preventing and controlling pest attacks and spread on a number of matters including (para. 9n) “the use of animals, plants or micro-organisms for combating specified harmful organisms”. Biological control, in various forms, is a critical approach for sustainable pest management, and it is important that the regulatory environment, while ensuring it is used safely, does not unnecessarily hinder its application.
It should be noted that the IPPC aims to prevent the introduction and spread of new pests, i.e. quarantine pests. It is not about the management of established and widely distributed pests that are not under official control, even though such pests can be extremely important in terms of damage and control costs. Although the Act is particularly concerned with issues covered by the IPPC, it does address non-quarantine/unregulated pests. For example paragraph 13, on Contingency measures for the containment of outbreak of pests, empowers the Minister to bring into force the rules under Paragraph 9, to contain the outbreak. The Act’s definition of “outbreak pests” clearly includes non-quarantine pests.
Thus although the responsibilities of DCP (as Uganda’s NPPO) listed in Box 3.2 are critical, and are in Uganda’s own interest as well as that of the global community, they only form part of its work. This is reflected in the fact that other legislation (see below) assigns responsibilities to DCP that do not fall within the ambit of the IPPC. This is a common situation in many countries, and is not seen as an impediment to managing pests.
Paragraph 7 is potentially very important – the appointment by the Minister of a Plant Protection and Health Technical Committee to advise him or her on all technicalities arising from the administration of the Act, and on any other related issues. The composition is given in Box 5; while good reason can be given for all the listed members, it is noted that only 2 of the 16 members are from the private sector, and one from civil society; the rest are government officials. However, the committee may co-opt members as it thinks fit. It is not known whether the committee is functioning yet, and if so, with what effect.
Box 5: Members of the Plant Protection and Health Technical Committee
The Commissioner for Crop Protection
The Principle Inspector who shall be the secretary
An entomologist
A plant pathologist

Platform for Agricultural Risk Management | Crop pests and disease management in Uganda: status and investment needs
31 Uganda | Tools Assessment | Full Report | March 2017
A forest officer
One person to represent the Farmers’ Associations
One person to represent the Agricultural Exporters or Importers organizations
One scientist to represent the National Environment Management Authority
One scientist to represent the Uganda National Council for Science and Technology
One scientist to represent the Agricultural Research Organization
One officer to represent the Uganda Revenue Authority
One officer to represent the Uganda National Bureau of Standards
One member of the Uganda Consumer Protection Association
A representative of the Ministry responsible for Trade and Industry
A representative of the Attorney General
Ministry responsible for Trade and Industry
One officer to represent the Uganda National Bureau of Standards
3.1.5 The Agricultural Chemicals (Control Act) 2006
This act is to control and regulate agricultural chemicals including all sorts of pesticides, fertiliser, growth regulators, wood preservatives, bio-rationals (potent plants, parts of plants or chemical extracts of plant origin), biopesticides, bio-fertilisers or any other chemicals used for promoting and protecting the health of plants.
The Act is administered through an Agricultural Chemicals Board, appointed by the Minister, comprising 10 members and 10 more ex-officio members including the Commissioner for Crop Protection, and a Registrar from MAAIF who acts as the secretary. The functions of the board are to ensure that regulations on the manufacture, storage, distribution and trade in, use, importation and exportation of agricultural chemicals are made and followed. The board advises the minister on applications for registration and licenses, on policies for safe use, storage and disposal of agricultural chemicals including public awareness campaigns, and on enforcement of regulations. The Board receives technical advice from a 15-person Agricultural Chemicals Technical Committee. The Act also confers powers on inspectors regarding monitoring and enforcing conformity with the Act and its regulations.
Thus as would be expected from such an act, there is appropriate control over the use of pesticides and other agrochemicals. However, the supporting regulations can have a significant effect on the way in which pesticides are used. The regulations regarding registration have not been seen, but we understand that the Board has discretionary powers, for example in granting specific producers a permit to import an unregistered pesticide for use on the farm only. Such discretionary powers should be used to promote and encourage investment in and marketing of lower risk products such as biopesticides. We have been told of cases where permits for biological control agents have resulted in quite rapid registration, though we do not know whether this is a frequent occurrence or not.
3.1.6 The Seeds and Plant Act 2006
This act provides for the promotion, regulation and control of plant breeding and variety release, and the multiplication, conditioning, marketing, importing and quality assurance of seeds and other planting materials. The Act is administered through the National Seed Board, comprising 9 members and 3 ex-officio members including the Commissioner for Crop Protection. The Act also establishes a Technical Committee which functions as the variety release committee, the secretary of which is the head of the certification service.
The Act establishes the National Seed Certification Service in the Crop Protection Department, which is responsible for the design, establishment and enforcement of certification standards, methods and procedures. This includes licensing of seed merchants and dealers, seed conditioners, and seed exporters and importers. The Act provides for different categories of seed to be defined in the regulations (which have not been seen).
The Act appears to provide the necessary legal powers for effectively regulating the seed sector, though as with control of agricultural chemicals, the difficulty is in implementation. The Department of Crop Protection has many important tasks including providing the seed certification service, but it has insufficient resources and capacity.
3.1.7 Biosafety and biotechnology bill 2012
There has been much debate about the pros and cons of biotechnology, especially genetic modification. This is relevant to crop protection because some of the most widely used modifications confer pest resistance, and in Uganda a number of such traits have been engineered and tested. Enactment of the Bill would provide the necessary regulatory framework for the commercialisation and release of these materials, which would have substantial implication for the way in which pest problems are managed.

Platfo
rm fo
r Agricu
ltural R
isk M
anagem
ent | C
rop
pests an
d d
isease man
agemen
t in U
gand
a: status an
d in
vestmen
t need
s
Platform for Agricultural Risk Management | Crop pests and disease management in Uganda: status and investment needs
Uganda | Tools Assessment | Full Report | March 2017 32
3.2 Stakeholders
3.2.1 MAAIF
MAAIF’s mandate is, “To promote and support sustainable and market oriented agricultural production, food security and household incomes”, with functions as listed in Box 6.
Box 6: Functions of MAAIF (from ASSP)
a) Formulate, review and implement national policies, plans, strategies, regulations and standards and enforce laws, regulations and standards along the value chain of crops, livestock and fisheries;
b) Control and manage epidemics and disasters and support the control of sporadic and endemic diseases, pests and vectors;
c) Regulate the use of agricultural chemicals, veterinary drugs, biological, planting and stocking materials as well as other inputs;
d) Support the development of infrastructure and use of water for agricultural production along livestock, crop and fisheries value chains;
e) Establish sustainable systems to collect, process, maintain and disseminate agricultural statistics and information;
f) Support provision of planting and stocking materials and other inputs to increase production and commercialisation of agriculture for food security and household income;
g) Develop public infrastructure to support production, quality / safety assurance and value-addition along the livestock, crop and fisheries commodity chains;
h) Monitor, inspect, evaluate and harmonize activities in the agricultural sector including local governments; i) Strengthen human and institutional capacity and mobilize financial and technical resources for delivery of
agricultural services; j) Develop and promote collaborative mechanisms nationally, regionally and internationally on issues
pertaining to the sector.
MAAIF is divided into Directorates, including one on Crop Resources within which the Crop Protection Department is situated. According to ASSP, MAAIF is implementing a new structure proposed in a 2010 review, which includes establishing new Departments of Crop Inspection and Certification (DCIC) and Entomology. However, this process appears to be progressing slowly. At least some stakeholders are uncertain as to its merit, and there is continuing discussion about the Department of Crop Inspection and Certification (see further discussion below). A split of the DCP would necessitate amending the Plant Protection and Health, and other Acts, to reassign the responsibility for certain activities which are currently assigned to Commissioner of Crop Protection, to the Commissioner of the new department. Nevertheless the ASSP says a Commissioner has already been appointed to the Department of Crop Inspection and Certification.
MAAIF also has a number of agencies, having some roles and responsibilities in pest management:
National Agricultural Research Organisation (NARO) - for generation and dissemination of technologies, knowledge and information related to pest management. Through its ZARDIs, NARO implements outreach and partnership programs to strengthen relevance and dissemination of research products and services.
National Agricultural Advisory Services (NAADS), previously in delivery of advisory services – since 2015 focus on input provision – particularly seed and planting materials. NAADS also supports demonstrations on pest and disease control methods, provision of chemicals for control of pests and diseases (particularly on mango and citrus), provision of clean planting materials e.g. tissue cultured banana and verification of materials supplied by service providers in collaboration with DAOs, MAAIF and OWC.
Uganda Coffee Development Authority (UCDA) for promotion of coffee development, also provides farmer training and distributes clean coffee planting material. Pest management for coffee is primarily done by UCDA, and MAAIF provides backstopping in case of coffee disease outbreaks.
Cotton Development Organisation (CDO) for promotion of cotton development, including pest and disease management;
According to the MAAIF website, the current MAAIF HQ establishment has a total of 411 positions out of which only 279 are filled.

Platform for Agricultural Risk Management | Crop pests and disease management in Uganda: status and investment needs
33 Uganda | Tools Assessment | Full Report | March 2017
3.2.2 Department of Crop Protection (DCP)
The structure of the DCP (Figure 4) is from the website of the IPPC; it is an obligation of contracting parties to report on the structure of their NPPO. The structure reflects the responsibilities as assigned by the three pertinent Acts.
Should the Department be divided into two, it is possible that the current structure would serve as the basis for that. However, that would mean the Epidemiology and Diagnostics sections would be in a different department from the Phytosanitary and Quarantine section, even though they need to work closely together. The DCP currently has inadequate capacity to fulfil all its roles, in terms of facilities, operating costs and human resource.
Figure 4: Structure of the Department of Crop Protection Source: IPPC website, www.ippc.int/en/countries/uganda/
3.2.3 Research
Under MAAIF, one of the agencies is the National Agricultural Research Organisation (NARO). It was created in 1992, but in the National Agricultural Research Act it was converted into a secretariat responsible for coordination of all agricultural research in the country. Nevertheless, public-funded research still predominates, undertaken by the National Research Institutes (NARIs) formerly part of NARO, and the Zonal Agricultural Research and Development Institutes (ZARDIs). The NARIs are mandated to do research on issues of strategic national importance (priorities), the ones with an interest in crop protection being the National Agricultural Research Laboratories (NARL), the National Crops Resources Research Institute (NaCRRI), the National Semi Arid Agricultural Research Institute (NaSARI) and the Coffee Research Institute (CoRI). ZARDIs address priorities that are articulated through participatory processes at the zonal level. There are nine ZARDIs corresponding to the major agroecological zones, so different ZARDIs focus on the crops relevant to their zone.
NARO is nearing the end of a 10-year strategic plan, with a vision of “A market-responsive, client-oriented, and demand-driven national agricultural research system”, and a mission “To generate and disseminate appropriate, safe and cost effective technologies”. The plan has 5 strategic objectives:
Client and impact-oriented, market responsive agricultural sector research agenda developed and implemented
Capacity and efficiency of public and private agricultural sector research service provider teams to respond to client needs and market opportunities improved

Platfo
rm fo
r Agricu
ltural R
isk M
anagem
ent | C
rop
pests an
d d
isease man
agemen
t in U
gand
a: status an
d in
vestmen
t need
s
Platform for Agricultural Risk Management | Crop pests and disease management in Uganda: status and investment needs
Uganda | Tools Assessment | Full Report | March 2017 34
Infrastructural and financial sustainability capacities to support and facilitate agricultural research enhanced and strengthened
Mechanisms for contributing to agricultural research sector policy formulation and development strengthened
Quality assurance procedures in the National Agricultural Research Systems (NARS) established and implemented
Although the plan identifies pests and diseases as a cause of poor productivity and as an ongoing threat, the document does not describe specific research areas (such as plant protection). Nor does it explain how NARO would collaborate with MAAIF departments such as that for Crop Protection. MAAIF is however seen as a “Buyer” of research, reflecting a more demand driven approach.
3.2.4 Education
Makerere University has a good track record in pest management, and in recent years the university has taken steps to ensure that their students are equipped with knowledge and experience that will be applicable in the jobs they are likely to get. For example, experience of providing advice to farmers at plant clinics has been added to the practical program, and the plant doctor training program that teaches practical field diagnosis, is being used to strengthen the diagnostics training. The demand for tertiary education is encouraging the establishment of new universities, though new universities can take time to match the quality of established universities.
A number of agricultural training institutes (ATIs) exist for more vocational training, but the ASSP notes that during the period of the DSIP, although student enrolment has increased, the credibility of the ATIs has remained poor. The ASSP thus includes review of the ATI curricula, and it will be important to ensure that pest management issues are adequately addressed in that review.
3.2.5 Local Government
Local governments are responsible for local agricultural activities including pest management, particularly in relation to endemic pests (that usually cause some damage every year). Extension is also the responsibility of local government. MAAIF’s responsibility is to support and build the capacity of district authorities so that they can better deliver regulatory and quality assurance services, as well as collect agricultural statistics. However, the MAAIF website says “The reality is that the link between MAAIF HQ and the districts is very weak, exacerbated by the increasing number of districts as well as the limited numbers of staff” as a result of capacity shortages both in MAAIF and in the Districts. Re-structuring of the extension system is described in section 3.2.7 with a new single spine extension system for extension staff deployed at sub-county level.
Nevertheless, a number of districts have allocated resources (staff time and operating expenses) to running plant clinics under the Plantwise program, which indicates an awareness of the need for improving pest management advisory services.

Platform for Agricultural Risk Management | Crop pests and disease management in Uganda: status and investment needs
35 Uganda | Tools Assessment | Full Report | March 2017
3.2.6 Private sector actors and value chain actors
3.2.6.1 Input providers
Agro-input dealers (seed, chemicals and fertilisers) are important players in crop protection. Actors in this area include Uganda Seed Trade Association (USTA), Uganda National Agro-dealers Association and National Organic Agricultural Movement of Uganda (NOGAMU). These are majorly membership organizations that bring together input providers to a common platform to work on key issues affecting the sector.
USTA was formed in 1999 to coordinate and oversee the development of the seed industry and to enhance the availability of quality assured seed for the entire farming community locally, regionally and internationally. The Association currently has a total of 27 members of whom 23 are seed companies and 4 are associate members. USTA has been key in the development and enhancement of the seed industry and currently represents 70% of the formal seed sector. USTA has been participating in regional seed harmonization efforts convened by EAC and COMESA.
UNADA is the umbrella body for all agro-input dealers. UNADA has been involved in efforts to train more dealers to operate efficiently and according to the law (see section 4.2.4 on agro-dealers). However, given the presence of USTA, UNADA has tended to concentrate more on agricultural chemicals, leaving the seed component to USTA.
NOGAMU on the other hand comprises producers, processors, exporters, trainers and other stakeholders with interest and practice in organic farming. NOGAMU markets and promotes local and export organic products; trains and coordinates research and extension; undertakes development of standards and promotion of application of organic standards; and carries out lobbying and advocacy on organic agriculture. NOGAMU has already developed the Uganda Organic Standard with the guidance and participation of UNBS and is coordinating with the East African Community through the East African Bureau of Standards to formulate the East African Organic Standards. Its focus on organic farming provides an opportunity to advise farmers on how to reduce reliance on pesticides and use alternative pest control measures.
3.2.6.2 Producers
At the production level, there are still large numbers of smallholder subsistence farmers (less than 5 acres). The ASSP expects the number of subsistence farmers to halve from 6 to 3 million during the period of the plan, by becoming “commercial”, but also through increased employment in non-agricultural enterprises. Currently 85% of the rural work force is involved in subsistence agriculture (UBOS, 2016) – also see section 1. Medium scale farmers (5-15 acres) and large scale farmers (more than 15 acres) comprise 12% and 3% of farming population respectively. Medium and large scale farmers mainly engage in production of cash crops and high value horticultural crops.
At lower levels, producers are organised under producer-owned cooperatives, where they access inputs, extension and business development services. However, more often than not, this is a recipe of medium and large scale farmers. Farmer cooperatives are also organized along value chains, implying any farmer support services target only those engaged in the respective crop. Notable are coffee marketing cooperatives, with some of the oldest member owned cooperatives such as Bugisu Farmers’ Cooperative Union and Bukonzu Joint Cooperative Union, still existing. Cooperatives have profiles of members but also farmers who trade through the cooperative and would form an important link between DCP and farmers.
3.2.6.3 Traders and processors
The level of organization of various value chains varies. Marketing of less commercial crops such as cassava and to some extent banana (which is both a commercial crop and a staple) is generally relatively informal. In contrast, value chains for commodity crops, especially export crops (e.g. coffee, cotton, flowers, vegetables and fruits) are more organized and have structures and systems for farmer outreach and extension. The level of organization of marketing also depends on the nature of producers. For example, the flower sector is well organized (being relatively small), and comprising commercial large scale farmers. In some cases associations have been established to help organize value chain actors for crops where production is still disaggregated yet the crops are largely exported e.g. maize. Uganda grain council is one of such organizations focusing on establishing standards for grain marketing in the country, including management of post-harvest pests, quality standards and processing.
Partnership with DCP or MAAIF will largely depend on the level of organization of the traders. The flower sector has already established a good relationship with DCP in successfully addressing a problem with caterpillars in exports of roses to EU (Box 3.5). Similar problems with interceptions (in this case false codling moth on fruits/vegetables) will be harder to address as there are many more, smaller producers, who are less well organized. However, partnerships with Uganda Export Promotions Board (UEPB), the national focal point for

Platfo
rm fo
r Agricu
ltural R
isk M
anagem
ent | C
rop
pests an
d d
isease man
agemen
t in U
gand
a: status an
d in
vestmen
t need
s
Platform for Agricultural Risk Management | Crop pests and disease management in Uganda: status and investment needs
Uganda | Tools Assessment | Full Report | March 2017 36
export promotion and development could be appropriate for ensuring wide awareness and compliance monitoring on regulation requirements.
With increased market orientation, other value chain actors will become more important than at present, including transporters, aggregators and processors, as well as operators of storage facilities. All these people will need some understanding of pest management issues, particularly in storage where major post-harvest losses can occur.
Box 7: Successful DCP-Private sector collaboration in pest management In a project designed to reduce Spodoptera interceptions on exports of roses to Europe, DCP and the private
companies involved in flower export worked together to solve the problem. Activities focused on building the capacity of both partners, and improving linkages between private sector companies (through the Uganda Flower Exporters Association) and DCP. Task force meetings between private and public sector representatives took place and common trainings were held where both groups participated. Private sector stakeholders organized themselves and set up traceability, enabling “naming and shaming” and fines if a member was non-compliant. A fund was established to facilitate DCP staff to implement farm assessments. Although fewer stakeholders are involved in flower exports making linking and setting up mechanisms relatively straight forward, an interviewee from the government wondered if similar processes could be established for other crops.
3.2.6.4 Farmers associations
The government of Uganda, through various initiatives has been promoting development of farmer associations to operate as business entities, demand advisory services, access markets and credit. Under the NAADS program, several farmers associations were created around enterprises such as dairy, crop, fisheries, coffee etc. depending on location and comparative advantage of producers. Farmers associations are organized under their umbrella bodies – District Farmers Associations (DFAs) and the Uganda National Farmers Federation (UNFFE). Membership to these associations is not limited to farmers, but also agro-industrialists and agro-commodity dealers. UNFFE and its DFAs support farmers by advocating and lobbying for support to farmers’ developmental issues and programs. These associations are different from farmer owned cooperatives due to their focus on policy issues affecting farmers and farming in general with less focus on specific value chains.
3.2.7 Dissemination/information service providers
Institutions currently mandated to provide pest management information to farmers include the Directorate of Agricultural Extension and Directorate of Crop Resources in the MAAIF, and Department of Production under the Ministry of Local Government. Dissemination has been in flux over the past 20 years. Prior to decentralization in 1997, MAAIF had a staff of 4,300 including subject matter specialists at the district and sub county level to implement its agricultural extension program. However, in 1998 the directorate of extension was abolished as the district local governments took over responsibility for extension and numbers of extension staff reduced to 2,000 with technical staff based at district level reporting to the local government. In 2001, the National Agro-Advisory Development Services (NAADS) was established as a semi-autonomous body under MAAIF with significant donor support promoting “privatized” extension, where services were contracted in response to farmer demand – often from staff that were previously working as sub-county extension staff. The MAAIF extension staff continued to work alongside the donor-funded NAADS program until 2010 when a circular from Ministry of Public Services (dated 14 January 2010) directed that all agricultural extension staff at the sub county be converted to NAADS. This move combined with the various reforms under NAADs had a major effect on extension service delivery, in particular crop pest management, because the cadre of staff that were in close contact with farmers were eliminated from the service. The NAADS reforms focused more on making agriculture a business venture and ignored the science of dealing with issues like pests and diseases. Danielsen et al. (2014) describes the issues caused by weak linkages between district staff and MAAIF and the frustration of MAAIF officials with the lack of authority and resources to handle major pests and enforce regulations. It was noted for example that: ‘The districts carry out disease surveys each in their own way, without any standardisation and coordinated follow up. Activities are scattered and fragmented, and many pests and diseases are getting out of control. If something is not done soon on cassava brown streak we will not have cassava in five years’ time’.
Latest restructuring in 2015 means that NAADS no longer has responsibility for extension and focuses on input provision particularly seed and planting material. During the year 2015/16, working under the Presidential direction, NAADS is concentrated on distributing seed for; maize, bananas, beans, mango, citrus, pineapple, passion fruits, grapes and cassava. Coffee is also prioritized, but seed distribution is managed by UCDA. A new Directorate of Agricultural Extension was established and an extension policy and implementation strategy has been developed and is in final stages of completion (pers comm. P. Rwamigisa). The strategy provides a framework on how capacity for extension services support will be enhanced under the new single-spine system. This includes how the following activities will be implemented and coordinated amongst the various players: recruitment; certification and re-tooling of extension service providers; farmer registration and; resourcing for

Platform for Agricultural Risk Management | Crop pests and disease management in Uganda: status and investment needs
37 Uganda | Tools Assessment | Full Report | March 2017
various extension visits. The strategy recommended to cabinet manpower of more than 12,000 technical staff for the structure to function in all disciplines - agriculture, veterinary, entomology, fisheries, and commercial / marketing. Approval was received to recruit 4000 staff, and so far 2000 have been recruited, expecting to reach 80% by end of 2016.
Beside the public extension system, several private sector players and NGOs are also increasingly engaging in extension services and agricultural information dissemination. These players either work directly through their own network of extension service providers or in partnership with existing public extension systems and private sector players. Mass media approaches including radio, TV and agricultural sections in national newspapers are also being used to deliver information to farmers. Mobile enabled agri-information services are also being used, with village based intermediaries interacting with farmers and sourcing information using a mobile phone or tablet. Some services deliver messages on SMS or voice – though the greatest success using mobile appears to be in providing information on markets (e.g. prices), weather and other services including financial.
3.2.8 Donors
Several donor funded projects are also being implemented in Uganda either through direct funding to MAAIF or through parallel structures that have no link (in terms of flow of information) with MAAIF. Some of the donors that have supported projects related to pest and disease management, or still do include;
- USAID Uganda Feed the Future support for Commodity production and marketing, and Agricultural inputs program.
- IFAD support to Vegetable Oil Development Project, Agricultural Technology and Agribusiness Advisory Services Project (ATAAS) co-financed with the World Bank, and Project for Restoration of Livelihoods in the Northern Region.
- European Commission support to Northern Uganda Agricultural Livelihoods Recovery program (ALREP) and the Karamoja Livelihoods Program (KALIP) programs.
- Food and Agricultural Organization (FAO) of the United Nations support for livestock disease surveillance in Karamoja region. FAO has also been involved in supporting emergency and relief actions including distribution of emergency relief seed/planting materials, awareness campaigns on pests and diseases and drought/flood early warning systems. Work carried out with the government of Uganda on management of Cassava Mosaic Disease (CMB) and Cassava Brown Streak Disease (CBSD) lead to a revival of cassava production in Northern Uganda
2. FAO Uganda website notes that through partners they have supported
establishment of over 4000 FFS/Agro-pastoral Field Schools, trained 58 master trainers, over 780 facilitators and build capacity of over 50 NGOs both local and international in the approach.
- Plantwise a CABI led project funded by consortium of donors including the UK Department for International
Development (DFID), the Swiss Agency for Development and Cooperation (SDC), the European Union, the Ministry of Foreign Affairs of the Netherlands, the Australian Centre for International Agricultural Research (ACIAR), the Ministry of Agriculture of the People’s Republic of China, Irish Aid, and the International Fund for Agricultural Development (IFAD).
- Bill and Melinda Gates Foundation agricultural support to organizations leading projects in Uganda e.g. Alliance for a Green Revolution in Africa (AGRA) focusing on soil health; CARE, Heifer International, International Development Enterprises, International Rice Research Institute, and TechnoServe, to develop local science, technology, farmer extension services, and market systems.
Embassy of the Kingdom of the Netherlands supports the Integrated Seed Sector Development program focusing on developing seed entrepreneurship and integrating formal and informal seed systems for enhanced access to seed by smallholder farmers.
While this list is not exhaustive, it is important that any efforts to manage pests and diseases recognize such existing initiatives, to ensure effective coordination and avoid duplication of efforts, as promoted through the Paris Declaration on Aid Effectiveness (2005) and Accra Agenda for Action (2008). Such coordination for the government side would occur through DCP, which probably currently is inadequately resourced to fulfil that role.
3.2.8.1 World Bank investment
A new investment by the World Bank in an Agriculture Cluster Development Project (ACDP) in Uganda merits more detailed mention. Although pest risk management is not a priority for proposed program, there are various areas where planned actions starting in 2017 intersect with the proposed investment in pest management (World Bank, 2015). World Bank and IFAD support to ATAAS (Agricultural Technology and Agribusiness Advisory Services) will close in Dec 2017. The project aims to transform and improve the performance of agricultural technology development and advisory service systems in Uganda. NAADS was the primary institution expected to deliver against ATAAS (also see sections 3.2.1, 6 and 7).
2 http://www.fao.org/fileadmin/user_upload/emergencies/docs/Uganda-Reviving-cassava-production-in-
northern-Uganda.pdf

Platfo
rm fo
r Agricu
ltural R
isk M
anagem
ent | C
rop
pests an
d d
isease man
agemen
t in U
gand
a: status an
d in
vestmen
t need
s
Platform for Agricultural Risk Management | Crop pests and disease management in Uganda: status and investment needs
Uganda | Tools Assessment | Full Report | March 2017 38
The new World Bank investment of $150m in ACDP will run from Jan 2017 to March 2022 and is intended to raise on-farm productivity, production, and marketable volumes of selected agricultural commodities in specified geographic clusters. The investment includes 4 components:
1. Support for intensification of on-farm production of 5 priority crops (maize, cassava, beans, rice and coffee) through an e-voucher scheme for inputs, training in input use and support to MAAIF to build capacity of to collect analyse and provide information on input markets.
2. Preparation for agricultural water management investment 3. Market linkages, post-harvest handling, storage and value addition 4. Project management, policy, regulatory and ICT functions of MAAIF that will include support to develop and
implement an ICT-based Agricultural information platform (AIP) intended to provide MAAIF with the ability to capture data using electronic devices connected to mobile networks. The AIP will support the development and implementation of new ICT tools including to provide farmers better access to practical information on farm management and farming practices.
Component 1 will support implementation of an e-voucher scheme for inputs (focused on seed and fertilizer) and includes a sub-component supporting development of the inputs market in which an agribusiness unit in MAAIF will support actions including: (a) establishment of a market intelligence function; (b) systematic surveys on input supply; (c) monitoring farmers efforts to bulk their demand for seeds and planting material; (d) capacity-building to strengthen the agro-input dealers’ distribution network. and their input quality control systems; (e) promotion and facilitation of bulking of demand for imports of adapted fertilizer and agro-chemical supply through public-private partnerships (PPPs) and; (f) development and implementation of a program of accreditation by MAAIF.
Component 4 supports a sub-component (4.2) that will support capacity building for policy and regulatory functions of MAAIF, led by the proposed DCIC (see 3.2.1). Activities will include: (a) updating the 2006 Seed Act and associated regulations; (b) developing guidelines and procedures for inspection and certification of vegetative planting materials; (c) developing plant variety protection regulations to promote private investment in genetic improvement and; (d) developing plans to review and implement several laws and regulations, including: (i) regulations to govern quality assurance and certification for planting materials, including pest and disease control and plant quarantine; and (ii) developing standards manufacturing, processing, and handling, registration, quality assurance, handling and safe use of agro-chemicals and safe labour-saving technologies. It should be noted that the ACDP also notes that DCP will be supported in fertilizer and agricultural input control in their role on the secretariat of the Agricultural Chemicals board.
The ACDP document (World Bank, 2015) notes that several public and private sector stakeholders see a gradual evolution towards the Kenyan model developed by KEPHIS – though it is noted that KEPHIS is the NPPO and covers both quarantine and phytosanitary services as well as seed regulation – so reflects the current structure of DCP. Kenya is also different in that pesticides are regulated by a separate body, the Pest Control Products Board.
Another sub-component of component 4 (4.3) will involve development of an ICT-based Agricultural Information Platform (AIP) for MAAIF led by the Department of Agricultural Planning. The AIP is intended to “capture data from ongoing programs and projects using electronic devices connected to mobile networks; upload information from manually collected data; and geospatially aggregate the data from local, regional, or national levels including agricultural statistics. The platform will enable email, file sharing, and creation of dashboards and provide benefits to M&E functions. The Agricultural Information Platform will also support the development and implementation of new ICT tools and information knowledge management assistance to MAAIF and TA to farmers to help them: (i) have better access to practical information, knowledge, and technical advice to improve farm management and farming practices; (ii) provide feedback and information to their advisors and program officers; (iii) find and establish marketing linkages with input suppliers and output purchasers; and (iv) participate in an e-Voucher scheme” (World Bank, 2015).
Under the auspices of the ACDP program, a pest management plan (MAAIF, 2014) was developed that will primarily address pesticide use. The plan was developed in order to mitigate increased use of crop protection products that was thought could take place as a result of improved and increased agricultural activities and production.
3.3 Issues related to the legal and institutional framework
From this review of the legal and institutional framework, we identify a number of issues for consideration in the development of the pest management investment plan by DCP.

Platform for Agricultural Risk Management | Crop pests and disease management in Uganda: status and investment needs
39 Uganda | Tools Assessment | Full Report | March 2017
3.3.1 Crop protection and sustainable intensification
The policy framework clearly promotes the commercialisation of agriculture, including amongst the large number of smallholders. The number of subsistence farmers is expected to halve to 3m by the end of the ASSP, and NDPII aims to increase agricultural exports from USD 1.3bn to USD 4bn by 2020.
In the context of pest management this presents both an opportunity and a risk. Commercial agriculture generally represents “intensified” production, characterised by higher investment, greater input use, reduced diversity of crops and cropping systems, and at least in the short term, higher production and productivity. This is an opportunity as commercial incentives can drive investment in inputs by individual farmers as well as investment by the private sector. The risk is that this intensification is unsustainable, often characterised by extensive use of pesticides to control pests.
This has led to the idea of ‘sustainable intensification’ (The Royal Society, 2009), in which increased productivity per unit area is achieved with reduced environmental impact. However, there are many examples round the world of unsustainable intensification resulting in damage to human health and the environment, and crop productivity eventually falling, such as through excessive use of pesticides. Figure 5 shows two trajectories of agricultural intensification, and the challenge for Uganda will be to find ways of pushing the trajectory towards B and away from A.
Figure 5: Possible trajectories of crop intensification under ASSP.
A: unsustainable intensification. B: sustainable intensification The following discussions therefore reflect this understanding and risk.
3.3.2 Pesticide policy
As Uganda’s agriculture intensifies along the lines of the ASSP, demand for and use of pesticides will increase, and undoubtedly this will be seen as improving yields. However, in order to promote sustainable intensification, pesticide policy and regulation needs to avoid promoting pesticides only, and instead promote lower risk alternatives. There are many factors that can encourage pesticide use, some of which may be hidden, but many of which are under the control or influence of government policy and regulations. Table 8 shows a list of items that are seen in different countries to be promoting pesticide use. Some of the factors are already at play in Uganda e.g. distribution of pesticides by government under OWC (especially for control of pests and diseases on mango and citrus), donors projects providing pesticides at low or no cost, and inadequate regulation of pesticide use. Others are listed as factors that DCP/MAAIF should seek to avoid doing as production (and so crop protection) becomes more commercially oriented / intensified.
Table 8: Factors encouraging pesticide use (Waibel, 1991) Price factors Non-price factors
Obvious factors
Government sells or gives pesticides
Donors provide pesticides at low or no cost
Government refunds pesticide companies’ costs
Subsidized credit for pesticides
Preferential rates for tax and exchange rate
Misguided use of governments’ activities in reducing pesticide damage
Governments’ investments in pesticide research
Inadequate government research in environmentally benign pest management
Hidden factors
Plant Protection Service outbreak budget
Pesticide production externalities
Pesticide use externalities
Lack of adequate procedures for: o pest definition o crop loss definition
Lack of information on agro-ecological parameters
Lack of transparency in regulatory decision making
Curricula of agricultural education and extension
Dominance of pesticide industry in the market for crop protection information

Platfo
rm fo
r Agricu
ltural R
isk M
anagem
ent | C
rop
pests an
d d
isease man
agemen
t in U
gand
a: status an
d in
vestmen
t need
s
Platform for Agricultural Risk Management | Crop pests and disease management in Uganda: status and investment needs
Uganda | Tools Assessment | Full Report | March 2017 40
3.3.3 Pesticide registration
Pesticide registration is a specific aspect of pesticide policy, which can have a very direct effect on the way in which pests are controlled, as it affects what products are in the market and their price. Registration has a cost, and pesticide traders will only pay that cost if they expect to make a return. The cost of registration is not simply the fee, but the cost of obtaining all the necessary data to support the application.
Consider two products. A broad spectrum organophosphate can be used against many pests, so can expect to have a sizeable market. But being broad spectrum, it has significant non-target effects, killing other organisms including beneficial species that usually keep pests in check. Conversely, a pest-specific biopesticide will have a smaller market, but being more pest-specific in its action, has a much lower impact on the environment, including killing fewer natural enemies of pests. If the registration process costs the same for both, then the broad spectrum organophosphate is more likely to come to market, and/or be cheaper to purchase than the biopesticide, despite being more damaging to the environment, and possibly causing additional pest problems.
So an opportunity in the area of pesticide regulation is to have a registration process that promotes and encourages the lower risk products, which are more likely to provide sustainable pest management. This would require DCP to be more regular in updating recommended pesticide lists for use in Uganda and developing capacity for pesticide testing (skills and equipment) before new pesticides are approved for use in the country.
3.3.4 Integrated Pest Management (IPM)
IPM (as defined in section 1.1.4) is widely promoted in many countries’ strategies and plans related to pest management, and CAADP clearly advocates the use of IPM. However, in the ASSP and other documents it is conspicuous by its absence, or at least by the lack of emphasis. There is also relatively little mention of pesticides, except with reference to the fake and adulterated products in the market.
In implementing the ASSP, there is an urgent need to firstly acknowledge that there is a risk of pesticides being overused, as in the intensification scenario described above. Then there need to be steps taken to actively promote IPM. IPM needs to be included in documentation, not just as a desirable goal, but as a set of specific steps to support sustainable intensification. The “Integrated” part of IPM generally refers to the combination of pest management methods (with pesticides used as little as possible), but integration is also needed between pest management and the other areas where crop production is to be intensified. The ASSP envisages a number of changes taking place in the way in which crops are produced, and these can all present risks and opportunities with respect to crop pests. Table 9 indicates some of these changes, which therefore need to be addressed, not only by those running crop protection activities.
An important element of IPM is using agronomic practices that reduce the likelihood of pests causing losses. There is a tendency, particularly among those less directly concerned with crop protection, to view crop protectionists as a fire brigade to be called when a problem arises. This is certainly an important part of their role, but just as a major part of reducing the costs of fires is preventing them occurring in the first place, so increasingly crop protection must be concerned with anticipating and responding to pest problems before they become serious. The use of pest resistant or tolerant varieties contributes to risk reduction, but there are many other aspects that are part of the IPM approach. Table 9 suggests some changes that may need to be addressed in crop protection, aimed at promoting lower risk pest management alternatives.

Platform for Agricultural Risk Management | Crop pests and disease management in Uganda: status and investment needs
41 Uganda | Tools Assessment | Full Report | March 2017
Table 9: Some changes envisaged by ASSP that have implications for pest management
Changes envisaged by ASSP Implications for pest management
Increased use of irrigation Irrigation modifies the agro-ecology of a crop, so changes pest risk. In many cases it can increase the probability and/or severity of pests, because there is a longer or unseasonal crop growing period allowing more scope for pest multiplication.
Increased use of fertiliser and soil fertility management
Fertilisers change the health and vigour of plants, which affects their susceptibility to pests. Healthy plants can be more attractive to pests, but at the same time better able to withstand pest attack. Adjustment of soil fertility and land management practices can be used to reduce pest problems.
Increased use of high yielding and pest resistant crop varieties
ASSP includes many references to the production of pest and disease resistant or tolerant crop varieties. However, such resistance can be associated with lower yield potential. It cannot be assumed that it will be possible to produce varieties that simultaneously maximise both yield potential and pest resistance/tolerance. Where preference is given to high yield potential, pest risk can be increased.
Expansion of post-harvest crop storage facilities and reduction of post-harvest waste
Pests are a major cause of post-harvest loss. Greater storage of crops could mean more stored pest problems, but appropriate storage facilities should also allow improved management of such problems.
Increased commercialisation of production
Commercial agriculture increases the opportunities for pest management, as investing in pest control becomes economically viable. Though there are dangers in over-reliance on and mis-use of pesticides
More export oriented production Some export markets are very demanding in their requirements, including in relation to pest management issues. In aiming to produce high quality crops, farmers may resort to use of pesticides, even on a prophylactic basis. However, markets may also be sensitive to pesticide residues (eg EU markets). Export markets may also have strict phytosanitary requirements regarding quarantine pests, which reduce the profitability of exports or halt them if the requirements cannot be met.
Increased accessibility of financial services
Greater access to credit makes investing in crop protection possible. But greater investment results in greater exposure to risk such as pest attack. Insurance against crop failure (including due to pests) is a new market for financial service providers, and an opportunity to promote IPM.
3.3.5 Clarification of MAAIF Departments’ responsibilities
There appears to be lack of clarity concerning the structure of MAAIF in respect of crop protection responsibilities. The Plant Protection and Health Act clearly recognises the Department of Crop Protection, and assigns responsibility to the Commissioner for Crop Protection. Similarly, “The Agricultural Chemicals Control Act” and “The Seeds and Plant Act” specify roles for DCP, but not for the DCIC.
This situation creates uncertainty for individuals working in DCP, which, together with the lack of clarity about who is meant to do what, must be reducing the efficiency of DCP and the Directorate of Crop Resources. Under the ASSP, one of MAAIF’s roles is to periodically review and restructure itself to ensure adequate alignment with the implementation requirements of the ASSP. The ideal situation therefore would be leaving DCP as originally organized and as recognised under the various Acts. However, should a split be necessary intended to increase efficiency, a preferable split might be to have the sections for seed certification and agrochemicals in one department and the other three in the crop protection department. That would mean that one section focuses on input quality (registration, certification and regulation), while the other focuses on pest and disease surveillance, diagnostics and control.
3.3.6 Public private partnership
Partnerships between public and private sector actors are important for all aspects of the ASSP, and in the area of crop protection there are several areas where there is opportunity and need.
One such area is in the development of crop protection products. A common area for research in universities and government laboratories is biopesticides, but often the research proceeds little further than identifying an organism, such as an insect pathogen, that can kill a pest. Turning such findings into viable commercial products is not easy, but requires partnership between the public and private sector. Such partnerships are not always easy to maintain, a secure intellectual property management framework being one of the areas that can assist in the building of trust and collaboration.
Phytosanitary services are another situation where good public-private partnership is required. The ASSP includes a number of references to phytosanitary regulations and services, but in practice it is not uncommon for there to be tension between a regulatory body and the private sector. Again, mutual trust needs to be built, based on the recognition that cooperation can enable both parties to achieve their goals (see example on Box 3.5 above). However, building partnerships with institutions such as Private Sector Foundation, Uganda Grain Council, Farmers Cooperatives, Uganda National Farmers Federation (and associated district farmers associations/ fora) and trading agencies could to a large extent help DCP reach more exporters/producers in the management of crop pests/diseases.

Platfo
rm fo
r Agricu
ltural R
isk M
anagem
ent | C
rop
pests an
d d
isease man
agemen
t in U
gand
a: status an
d in
vestmen
t need
s
Platform for Agricultural Risk Management | Crop pests and disease management in Uganda: status and investment needs
Uganda | Tools Assessment | Full Report | March 2017 42
3.3.7 Plant biosecurity planning
Plant biosecurity is a term being increasingly used, although much of what plant biosecurity entails is what crop protection departments are already doing. The main emphasis of plant biosecurity is preventing the introduction and spread of new pests and addressing phytosanitary issues around exports, although it commonly includes other aspects of crop protection.
One aspect of plant biosecurity is the preparation of biosecurity plans, and these would be particularly appropriate in the implementation of the ASSP where there are focus commodities. For each commodity a biosecurity plan could be developed, that would identify new pest risks (i.e. quarantine pests), and spell out the responsibilities of the different stakeholders including financing arrangements in monitoring/ surveillance of those risks, and in responding to an incursion or outbreak if the pest should arrive. Many of the major pest problems in Uganda originated outside the country, and often the response has been slow and inadequate. Biosecurity plans enable the country to react much more quickly and effectively, as many of the key decisions have already been clearly laid out and anticipated.
3.4 Summary and recommendations for pest management
The policy and legal framework for pest management in Uganda is satisfactory, particularly with the recent Plant Protection and Health Act that aligns the role of DCP with the responsibilities of an NPPO in regard to preventing the introduction of new pests.
Other key functions required for effective pest management (particularly for pests that are already widespread) are well spelled out in various other items of legislation.
It is important that regulations that currently exist or are in draft are properly aligned to the Acts.
An institutional framework is only fully adequate if it can be implemented. DCP and other stakeholders currently do not have sufficient capacity for implementation, monitoring and where necessary enforcing regulations.
The proportion of the ASSP budget allocated to crop protection is relatively small, and not adequate for the substantial increase of capacity required.
The proposed split of DCP needs to be resolved; we recommend it stays as one department, but with internal reorganization.
One aspect of the reorganization would be to better equip DCP to develop and maintain effective partnerships and relationships with its many stakeholders, including in the private sector.
The envisaged commercialization of agriculture in Uganda risks an increase in unsustainable activities (such as the use of pesticides). It is essential that the policy framework is strengthened to counter this risk.
In particular Integrated Pest Management (IPM) needs to be strongly promoted and encouraged by all means, including through policy, regulation and strategies. It is currently more or less absent from the ASSP.

Platform for Agricultural Risk Management | Crop pests and disease management in Uganda: status and investment needs
43 Uganda | Tools Assessment | Full Report | March 2017
4. Cost-benefit and sustainability of pest
management initiatives
4.1 Introduction
There have been many innovations in extension approaches to reach farmers that aim to strike a balance between the intensity of interaction and reach. This section examines how pest management knowledge and innovations are diffused to farmers in Uganda and evaluates the most cost-effective method or combination of methods available to disseminate that information. Effectiveness of different methods is measured based on a set of criteria that a particular method should possess in order to be considered desirable. The effectiveness of each method is weighed against the cost of diffusing information to farmers in order to create an overall measure of cost-effectiveness for the pest management diffusion methods. Delivery of advisory services has undergone many changes in the past 20 years in Uganda – both specifically related to pest management (see Danielsen et al., 2014) and more generally (see section 3.2.7).
Diffusing information to farmers whether conducted by government, NGOs, or private sector, should be done in the most cost-effective manner possible in order to ensure that the training and dissemination programs are sustainable and the funding from sponsoring institutions continues. However, inevitably there is a trade-off between cost and effectiveness that varies depending on the type and complexity of the message, importance of timing etc. The current section considers different service costs and efficiency factors associated with extension service delivery in Uganda.
4.2 Initiatives involved in agro-advisory services and approaches used
Primarily, extension services in Uganda have been led by the government or not-for-profit NGOs working in partnership with local government. Increasingly, private sector led extension is taking shape particularly focusing on key value chains (examples given in section 4.2.4). Different institutions utilize a variety of methods to diffuse pest management knowledge and practices to farmers. Diffusion methods usually involve some degree of interpersonal communication either between a qualified extension staff or a less qualified intermediary such as an agro-dealer or community worker. Interactions can be short one-off interactions, or a series of interactions over a period time. A number of indirect methods operating through mass media including radio, TV and increasingly mobile phones are also operating.
The choice of delivery mechanism will depend on a number of variables including: the level of complexity of pest management innovation to be transferred; the desired reach (number of farmers); the intended target audience (men/women; young/old tend to engage differently) and of course available resources (staff and money). Indirect methods such as mass media, may be useful to raise awareness of a new seed variety or the presence of a new pest and lead to a basic level of understanding but deliver information to a relatively large number of farmers per dollar spent. In contrast, very intense methods such as farmer field schools involving regular interactions between an extension staff and group of famers over a period of time provide a deep understanding of pest management but train a relatively small number of farmers per dollar spent on the program. Inevitably there is a trade-off – as illustrated in Figure 6 and usually a combination of approaches is needed.

Platfo
rm fo
r Agricu
ltural R
isk M
anagem
ent | C
rop
pests an
d d
isease man
agemen
t in U
gand
a: status an
d in
vestmen
t need
s
Platform for Agricultural Risk Management | Crop pests and disease management in Uganda: status and investment needs
Uganda | Tools Assessment | Full Report | March 2017 44
Figure 6: Tradeoff of different extension approaches based on desired reach and impact
As information needed becomes more complex, it is likely that more intensive interactions are needed or a combination of approaches which will reach fewer people. In this section, the trade-offs between reach and costs are considered in more detail. Delivery mechanisms used in Uganda can therefore be categorised into three classes: i) Intensive interpersonal interactions ii) Moderately intensive interpersonal interactions iii) Mass media approaches
4.2.1 Intensive interpersonal interactions
Here, extension workers provide direct training and technical support to farmers. Examples include technical agent visits and farmer field schools.
Extension or technical agent visits
In line with the training and visit approach recommended by the World Bank in the 1980’s, extension agents or technical staff undertake periodic visits to villages to give ½ day trainings to farmer groups and make a number of follow-up visits to individual farmers. This is still common practice in Uganda. Pest management issues are addressed, often in conjunction with other issues. In Uganda, technical staff are recruited up to sub-county level to provide extension services. The sub-county has an average of 2,000 farm households. These extension staff are either specialized in livestock, crop or fisheries. They provide training to groups of farmers within the sub county, organized under farmer groups or specific enterprises. Typically an extension agent will work with around 30 farmer groups – each with 30 members, although around 20 typically attend trainings. Field / farm follow-ups are later undertaken to ensure that trained farmers correctly apply techniques, with further on-spot support provided by extension staff. Extension officers also respond to ad-hoc farmer requests and inquiries on emerging crop pests and diseases, as well as reporting to higher authorities cases of pest and disease outbreaks. The sub-county extension staff (expected to comprise of technical people in crop, fisheries and livestock) are technically backed by MAAIF and the District Agricultural Officers. Beside the public extension, several NGOs and private sector (including commodity boards, cooperatives and trading companies) in various fields have employed field extension workers to work with farmers in this way. The minimum qualification for extension workers is a first degree in Agricultural sciences, though personnel with Diploma level training have been employed in some cases as service providers or by NGOs.
Transaction cost of having extension officers visit farmers is relatively low because the agents normally live in close proximity to the farmers with whom they work. Usually an extension officer has access to a motorcycle so transport costs are monthly cost for fuel and maintenance. Additional costs of the agent visits include salaries, perdiems and training materials. The main drawback to this system is that it is insufficiently funded so it is impossible for extension personnel to routinely interact with farmers. Also the government has not been able to recruit extension officers to reach each sub-county (see section 3.2.7). Furthermore, the quality of extension

Platform for Agricultural Risk Management | Crop pests and disease management in Uganda: status and investment needs
45 Uganda | Tools Assessment | Full Report | March 2017
agents varies as does their ability to connect with farmers and influence them to adopt new practices and technologies. This requires routine refresher trainings and re-tooling the extension agents so that they are able to adequately diagnose and recommend appropriate pest and disease management solutions.
Farmer field schools (FFS)
Farmer field schools comprise of weekly, small group training sessions, commonly focused on pest management, over a whole crop season for a specific crop. Sessions are normally led by a qualified extension officer, although use of lead farmers is also being tested in some cases. In this model, participatory, experiential learning approaches are used, requiring intensive training for facilitators/trainers. FFS programs stress the importance of observing fields regularly, conserving natural enemies, farmer experimentation, and using relevant, science-based knowledge. Hands-on training is important to attract both literate and illiterate farmers and to keep them interested in learning. FFS projects are used to communicate complex ideas such as integrated crop management while also empowering farmers by strengthening their skills, problem-solving capabilities and confidence. The standard FFS training involves a field-based, season-long program overseen by an FFS facilitator, with weekly meetings near the plots of participating farmers. Each FFS typically has 20–25 participants, with farmers working together in groups of five and a total of 14 sessions including a start-up session and field day, as well as 3 monitoring visits).
Farmer field schools were developed by FAO as a means of empowering farmers by improving their analytical and decision making skills. In Uganda, IFAD and a number of other organizations have adopted this approach as the most appropriate for disseminating pest management technologies and information. A “Learning site approach” and “Farmer Life Schools” are modifications of the FFS that have been largely applied in the area of health. Self Help Africa (SHA) in Uganda is using these two methods for nutritional outreach, targeting persons attending health facilities. The common attribute among farmer field schools and learning sites is the emphasis on experiential learning and participation.
To become a FFS facilitator extension staff undergo additional “training of trainers” programs, normally over 2 weeks to train them in the specific techniques used in the schools. A cadre of Master facilitators is established to implement these training of trainers. However, a challenge with many FFS is that quality is often an issue with some FFS simply providing traditional top-down teaching as opposed to the participatory and joint problem solving approach – the key selling point for FFS. Investment of time per farmer is also high – with extension staff spending around 17 work days delivering FFS which normally involve around 20-30 farmers.
4.2.2 Moderately intensive interpersonal interactions
This includes short interactions between a farmer and an intermediary – often where the farmer comes to ask specific advice where farmers travel to the venue. The intermediary may be a trained extension staff or a trained local facilitator. Examples include; plant clinics, farmer field days, plant health rallies and several variations of village-based intermediaries (e.g. Village based advisors, Community knowledge workers or Model/Lead farmers).
Plant clinics
Plant clinics are a novel way to provide plant health advice to farmers developed by CABI initially through its Global Plant Clinic, and since 2012 through the Plantwise program. At its core, a plant clinic is a simple rural service, run by trained agricultural extension workers, referred to as ‘plant doctors’, who operate in a similar way to staff at a human health clinic. The plant clinics encourage farmers to bring examples of the crop and use analysis of the sample as well as questioning the farmer on farm context to be able to diagnose the problem and offer advice on pest management as well as general advice on crop production. Clinics are open to everyone and address any crop and any problem brought to the clinic. They are typically run once a week or fortnight in a particular location where farmers naturally congregate, often a market place. Some clinics are “mobile” moving to different locations over a set period of months. Currently over 190 plant clinics are said to be operational across 91 districts in Uganda. An additional benefit of the clinics is that information on the problem, the diagnosis and the recommendation are collected. Although coverage of plant clinics is relatively low, collection of data at clinics provides a snapshot of plant health problems in a given area that can be used to inform complementary approaches that can deliver targeted messages at scale. At the same time, analysis of the data can serve as an early warning mechanism of new pests, information on pest abundance that could be used to inform agrodealers of required inputs as well as providing information on quality of advice. Data is currently collected on paper forms in a systematic way, with plant doctors recording information on symptoms, a diagnosis and recommendations. The data is collated by the Department of Crop Protection (DCP) and entered to the Plantwise Online Management System (POMS) where it can be accessed by individuals given permission by the DCP. Uploading into POMS is slow and quality of data are variable. New work in Uganda planned by Plantwise and funded by IFAD will introduce tablets to clinics to improve the efficiency of data collection and management and seek to streamline data harmonization, validation and use processes. Work in Kenya showed the use of tablets to make a big impact on the speed of data collection and meant less harmonization work.

Platfo
rm fo
r Agricu
ltural R
isk M
anagem
ent | C
rop
pests an
d d
isease man
agemen
t in U
gand
a: status an
d in
vestmen
t need
s
Platform for Agricultural Risk Management | Crop pests and disease management in Uganda: status and investment needs
Uganda | Tools Assessment | Full Report | March 2017 46
Plant clinics were piloted in Uganda in 2006 with technical and financial support from CABI’s Global Plant Clinic (GPC) as a collaborative effort between district local governments (LGs) and nongovernmental organizations (NGOs) as implementers and the Department of Crop Protection of MAAIF as coordinator. Trainee plant doctors including public sector and NGO extension workers receive basic plant doctor training comprising of 2 modules of 3 days; Module 1: Basic course: field diagnosis, how to run a Plant Clinic and; Module 2) Basic Plant Healthcare: control options, decision-making, quality of service. Normally 2 plant doctors are trained for each clinic established. Other courses run for some plant doctors and others involved in the Plantwise program include; Module 3) How to design extension messages and write Fact Sheets and pest management decision guides and Module 4) Monitoring Plant Clinic Performance. CABI and MAAIF continue to offer technical backstopping to the clinics and participate in monitoring visits.
The recurrent costs involved in running a plant clinic include allowances for clinic staff, transport of furniture and tent, labour to set up the tent and publicity. The recurrent costs for running a clinic session are estimated at an average of $40. A clinic session usually takes place fortnightly, operates for half a day and is run by 1-2 plant doctors and one plant nurse (equivalent to community based facilitator). Startup costs include training the plant doctors and equipping them with prescription books and related pest and disease management guides. This cost is estimated at an average of USD 260 per plant doctor. Numbers attending are very variable; Danielsen and Matsiko (2016) reported an average of 13 clients per clinic session. However, of these: five had 4-8 clients; three 15-27 and one 40. This level of variability is common, depending on season with clinics run during growing season attracting relatively larger numbers than those operating during off season. However, many argue that the greatest value of clinics is in the data that is collected and the information it provides on pest and diseases, if the data can be used, rather than the numbers reached directly with advice. The data can potentially be used to inform actions by other stakeholders including the NPPO. This is addressed in more detail in section 5, but it should be noted here that the use of tablets is being introduced to replace paper based data collection. This can increase start-up costs by an extra USD200. The cost of airtime to use the tablets is largely offset by the fact that record books are no longer needed.
Farmer field days
During the farmer field days, scientists or extension workers make in-depth presentations and hold discussions in farmers’ fields, or undertake demonstrations to introduce new management practices and innovations to farmers including those related to pests and diseases. Farmer field days may also be hosted by farmers themselves with some assistance from sponsor organizations. In this case, the host farmers share information and farming practices with participants and engage in discussions to learn from each other. Beside the farmers, field days are also attended by technical staff (district and sub county extension officials), political leaders, NGOs, agro-input dealers, researchers, agro-processors, financial institutions, press etc. This gives participants an opportunity to observe pest management or any other practices first hand and receive more in-depth information about specific practices. The interactions with various technical and input service providers’ helps participants obtain further information on availability of technologies and how they can be applied. Farmers also get contacts where they can seek further information.
Field days in Uganda are sponsored by MAAIF and a number of NGO’s. For example, MAAIF conducted several farmer field days to showcase successful BXW control on previously affected fields in 10 hotspots in Western Uganda (Byantwale, 2014). The press picked lessons and disseminated in local media the BXW control campaigns. Similarly, two of HORIZONT3000’s partner organizations in the Enabling Rural Innovation (ERI) East Africa Project, Safe Neighbourhood Foundation (SNF) and Caritas MADDO, have been organizing farmer field days. The Integrated Seed Sector Development (ISSD) Uganda has also been organizing field days focusing on utilization of quality seed and crop pest and disease management.
The benefit of field days is that a large number of farmers can receive information about pest management technologies or practice at the same time. On average field days involve 80-300 participants depending on available budget, and they typically last one day. The number of field days depends on the objective and urgency of response required. The costs associated with field days include allowances of the experts that administer the event, transportation for the experts to the event, cost of food and refreshment for participants, venue hire, publicity and invitations.
Plant health rallies
Plant health rallies have been developed and implemented in Uganda and other countries through CABI led initiatives including the Plantwise program and other projects. Each rally is a short event held in a public place, often a market place, where a particular problem is addressed. Typically, a rally lasts 30 minutes to one hour. A group of individuals, normally extension staff, come to the agreed place and deliver targeted information to the gathered crowd. Materials may be used and small leaflets distributed. No formal erection of tents and chairs are used and no refreshments given meaning the rally team can cover 2-3 venues in a day. The rallies can be used to raise awareness of a particular pest, provide simple advice as well as gather information on observations etc. They have been used in Uganda to address a number of key pests and diseases. As the teams are mobile and preparation time short, a large area can be covered in a short period of time. A challenge with plant health rallies

Platform for Agricultural Risk Management | Crop pests and disease management in Uganda: status and investment needs
47 Uganda | Tools Assessment | Full Report | March 2017
is that a crowd is gathered spontaneously meaning that many participants may not be those for whom the information is most relevant. Some countries overcome this by advertising the plant health rallies beforehand, for example on the radio to encourage those with a particular interest to attend.
Village based intermediaries
Village based intermediaries are typically farmers or other resource persons who live in the village and are trained to provide assorted advice/services to farmers. There are different models and different objectives for the village based intermediaries. Intermediaries sometimes use a mobile device allowing them to access information and data on weather/market prices to support interactions between themselves and farmers. For example community knowledge workers (CKW) by Grameen Foundation deliver information and sometimes collect information from farmers for monitoring or evaluation purposes. CKWs are equipped with mobile phones enabled with technical content of commonly asked questions by farmers relating to pests and disease management. Farmers send their questions to CKWs through SMS or calling. From key informant interviews, it was established that CKWs are commonly asked questions on pest management, though the most frequent questions relate to weather, market prices, livestock health and then crop pests and diseases.
The village agents approach by actors e.g. FIT-Uganda, Agrinet and Farm Gain uses a network of people located on strategic locations in the village who collect market information on a daily basis. The information is then sent by SMS to a central data base for analysis. Village agents may be traders or community workers. Feedback is received again by mobile phone which the agents can then share within their communities either by word of mouth or use of information boards placed at strategic places. Messages are also sent out to members who have subscribed for the SMS to these organizations. Village agents are currently not extending messages on pest management, but could be utilized to gather and share such information if there is need.
Village-based intermediaries approach places farmers at the centre of knowledge generation and dissemination process. Farmers’ abilities to spread innovation, due to their comprehensive local knowledge and location, make them potentially better able to communicate with fellow farmers, and at lower cost. The costs associated with village based advisors include training and extension materials. In some cases, they are facilitated with a bicycle to ease their transport, gumboots and demonstration materials.
4.2.3 Mass media
Mass media methods include; i) print media; ii) Radio and television broadcasts; and iii) mobile phone based extension messaging and information delivery. Mass media methods are relatively less intensive can transmit information to farmers quickly and widely where other more intensive methods may take longer for messages to spread. However, the potential for media such as phone and mobile have limitations on the complexity of information that can be shared.
Print media
Print media such as newspapers, leaflets, pest and disease management guides, posters and bulletins provide pest management information to farmers. These approaches give farmers a general knowledge of pest management practices, are inexpensive to produce and transmit, but reach a limited number of farmers. In Uganda, major newspapers have weekly bulletins on farming, which occasionally feature pest management messaging or early warning on key pests and diseases. Harvest Money in the New Vision and Seeds of Gold in the Monitor are examples of these weekly bulletins. Agricultural information is also produced in their sister newspapers in local language – Bukedde, Orumuri and Rupiny. Others print media sources include; farmers media and agribusiness digest magazine. Print runs are reported as around 20,000– but a large proportion of the distribution is in urban areas, with an estimated 20% reaching rural areas and farmers. An advantage is that farmers can keep articles to remind them of key messages.
Radio and TV broadcasts
Radio broadcasts and television programs on the other hand can be interactive, for example with technical experts responding to farmers’ phone-in questions. Radio broadcasts and television programming with agricultural themes occur every day in Uganda on various radio and TV stations. To a great extent, this is in response to presidential directive that all media houses should incorporate broadcasts on agriculture and agricultural development. Radio and TV broadcasters usually invite technical persons to deliver presentations on key topics, usually from the Directorate of Crop Resources in MAAIF. Also a number of partners (NGOs) are supporting radio and TV programming on various topics related to agriculture in general or specific interest areas like promotion of orange fleshed sweet potatoes, control of banana xanthomonas wilt, sensitization of maize lethal necrosis and consumption of vegetables for health and nutrition.
For example, Farm Radio International (FRI) has partnered with 60 community and private radios in Uganda supporting them to develop interactive radio programs on agriculture. The support given includes training radio broadcasters to air information in the right way, developing and sharing radio scripts, gathering feedback from

Platfo
rm fo
r Agricu
ltural R
isk M
anagem
ent | C
rop
pests an
d d
isease man
agemen
t in U
gand
a: status an
d in
vestmen
t need
s
Platform for Agricultural Risk Management | Crop pests and disease management in Uganda: status and investment needs
Uganda | Tools Assessment | Full Report | March 2017 48
farmers, and training farmers (organized in radio listening groups) how to use phone services and call centres. The radio programming also includes mechanisms for feedback generation and response to key questions from farmers through call centres and opinion polls.
Radio, because of its unrivalled access and low production costs, is thought to be one of the technologies that best meet the information and communication needs of farmers worldwide. Radio can reach communities at the very end of the development road — people who live in areas with no phones and no electricity. Radio also reaches people who can’t read or write. Even in very poor communities, radio penetration is vast. Calandro et al. (2012) report 77% of households in Uganda own radio, a figure that is typical for households in developing countries. However, although radio ownership is high, there are challenges. Uganda has an unusually high number of local radio stations (>150 reported by Myers, 2008) that are mostly regionalized. This leads to fragmentation of listenership, with no single station recording higher ratings than 4.5% in May-July 2015 (Elliott, 2015). Elliott (2015) further indicates that 11 radio stations covered 54% of listeners, with 46% listening to the other stations, with approximately 39% of their survey sample reporting listening to programs. Another limitation with radio is that listenership is skewed towards men and the better off – although listenership is high across communities compared to other sources of information (Perkins et al., 2011).
Mobile phone enabled messaging
Use of mobile enabled messaging is also increasingly being used. Farm radio international has included the use of SMS services and call centres in their various programs. SMS of up to 160 characters are sent out to subscribing farmers focusing on crop production and pest management. Through the call centres / beeping service, farmers beep and receive a call from the radio where they log their question. These can then later be addressed through radio or TV broadcasts. In a similar approach, some private sector players are also using SMS to reach to their subscribers. Currently the focus is on market prices and market information, though an opportunity exists to use such platforms to share information on pest management. Information on prices is gathered by agents located in various areas, is collated, analysed and simple messages developed that are sent to subscribers. The SMS platforms for information gathering currently range from web-based (e.g. Agrinet) to simple excel based systems. Examples of partners using ICT- enabled information delivery include; FIT Uganda, Farm Gain and Agrinet.
Overall, mass media offers opportunities to reach a large segment of the population quickly and with a relatively low average cost per farmer reached. Limitations associated with mass media include; its inability to reach the entire population. Print media is limited in the number of people it can reach because of limitations in literacy and numeracy levels that have remained low. The difficulty in reaching people with television is that while it can reach illiterate people, there are many farming households particularly in rural areas without electricity making access to television difficult or impossible (refer to Table 14).
4.2.4 Private sector led approaches
Approaches entirely led by the private sector aimed at managing key problems in agricultural product quality and market facilitation. Private sector led approaches may be very intensive or less intensive, but are distinctly different from public approaches due to their profit motivation. The business model used is able to cover operational costs for extension delivery. Examples include; trading agents/commodity aggregator model and agricultural service providers models.
Commodity aggregator model
The service provider provides extension services and an end-market for products. Usually focused on a particular value chain where the service provider is a private entity with interest in trading the commodity. The service provider ensures that farmers receive training and information on production, pest control and quality management. In this way, the service provider is assured of quality produce and farmers are assured of the market. Examples of organizations using this model are the Joseph Initiative (maize), Self Help Africa (honey) and Sustainable Traded Initiative (tea). This model largely uses extension agent visits, an intensive extension approach.
Agro-dealer networks
Agro-dealers are a cluster of private business operators, organized under the umbrella of Uganda Agro-input Dealers Association (UNADA). They are for profit entities, dealing in all farm inputs ranging from seed to chemicals and fertilisers, often in combination. For one to qualify as an agro-dealer, they undergo one week training facilitated by Makerere University focusing on product knowledge and handling and must be certified by MAAIF. Much as most agro-dealers don’t have technical knowledge in agriculture, they often offer advisory services to farmers at the point of sale, based on their experience with particular products, or feedback from farmers using particular products. This is partly due to the fact that they interface with farmers more often, but also due to the lack of adequate extension services in the recent past.

Platform for Agricultural Risk Management | Crop pests and disease management in Uganda: status and investment needs
49 Uganda | Tools Assessment | Full Report | March 2017
In Uganda, like most African countries where Alliance for a Green Revolution in Africa (AGRA) is working, there was a move to build their capacity including to act as service providers. This approach however presents difficulties due to the fact that their primary objective is profit and not service provision. Ideally they would be selling products and not necessarily advising farmers. In addition, it’s usually the shop owners who are trained yet, they are not the ones working in the shop.
4.3 Regional initiatives for pest management
At the regional level, several initiatives exist for pest management, linked to national strategies and programs. Some of the notable initiatives are:
East African Community: The agriculture and rural development policy for East African Community (EAC)
recognizes the need to manage plant and animal pests, in order to promote sustainable production and trade. The policy statement mandates the EAC to; Develop and harmonise policies, legislation and standards on plants, animals and their respective products quality control and safety assurance; Establish and coordinate mechanisms for monitoring and surveillance of trans-boundary pests of plants and animals; and Promote research and development in pests and diseases management programs. The EAC food security action plan further details how interventions related to pests and diseases management will be rolled. Key actions include to; Develop and support pest and disease surveillance system in the region; Enforce disease and pest control measures and procedures; and Develop regional disease and pest control regimes in the EAC. Further, the EAC developed an SPS and Quality Assurance, Metrology and Testing (SQMT) protocols, which member countries are required to ratify. Uganda so far has launched a National Policy on EAC Integration; adopted 359 standards in line with the SQMT Protocol and ratified the SPS Protocol.
Common Markets for Eastern and Southern Africa (COMESA): The core of COMESA’s strategy for the
agricultural sector is intended to address these two challenges - how to assure food security through sustainable increase in overall agricultural production, and how to stimulate a strong and dynamic agriculture-industry link. COMESA agricultural strategy stresses the importance of co-operation and co-ordination of regional agricultural policy, food security, marketing, research and development, plant and animal disease and pest control, training, irrigation development, and exploitation of marine and forestry resources. COMESA Regulations and harmonized Quarantine and Phytosanitary Measures aim to facilitate safer and faster movement of seeds through the establishment of common quarantine and phytosanitary measures. If well implemented, such measures could reduce the direct and indirect costs related to seed trade and result in greater transparency and harmonization of regulatory processes and documentation.
Association for Strengthening Agricultural Research in East and Central Africa (ASARECA):
ASARECA is a regional hub and think tank for knowledge, information and learning. ASARECA’s activities mainly include facilitating the generation of Technology Innovations and Management Programs (TIMPs) for the sub-region and up-scaling of appropriate TIMPs across borders. It also contributes to ensuring an enabling policy environment for agricultural transformation thus enhancing institutional and stakeholder capacities for innovation generation. ASARECA’s past initiatives include; Sustainable Management of Banana Xanthomonas Wilt within Banana; Management of cassava CMD and CBSD for improved productivity; Integrated Striga Management for Improved Sorghum Productivity; management of Napier Grass Smut and Stunt and management of Maize Lethal Necrosis disease. ASARECA works in partnership with NARS, supporting them to sustainably manage trans-boundary pests and diseases.
Integrated Pest Management - Collaborative Research Support Program (IPM-CRSP): East Africa.
This is an initiative of United States Agency for International Development (USAID), whose purpose is to foster IPM through collaborative research between U.S. and low developed countries institutions for their mutual benefit by improving their abilities to develop and implement economically and environmentally sound crop protection methods. The Satellite Sites include Ecuador, Honduras, Haiti, Uganda, and Thailand. The IPM CRSP fosters participatory, interdisciplinary IPM research, training, and information exchange programs that will be adopted in (1) horticultural export crop production in Latin America and the Caribbean, (2) semi-arid transitional systems in the Sahel, and (3) innovative programs for rice-based food systems in Asia. The activities of the program are broad and comprehensive. They cover IPM issues on insects, diseases, weeds, and nematodes on both field and horticultural crops. The broad project activity areas include technical as well as economic, policy, and socio-cultural issues as related to IPM. In Uganda, the host institution is Makerere University.
Food and Agriculture Organization of the United Nations (FAO): Under the Plant Production and
Protection Division, FAO has developed a strategy for improved IPM, aimed at promoting Sustainable Intensification of Crop Production. This requires the integration and harmonization of all appropriate crop production policies and practices. FAO has focused on developing; effective and strategic decisions that increase crop production using an ecosystem approach; national capacities to monitor and to respond to trans-boundary and other important outbreak pests; policies and technologies appropriate to reduce negative

Platfo
rm fo
r Agricu
ltural R
isk M
anagem
ent | C
rop
pests an
d d
isease man
agemen
t in U
gand
a: status an
d in
vestmen
t need
s
Platform for Agricultural Risk Management | Crop pests and disease management in Uganda: status and investment needs
Uganda | Tools Assessment | Full Report | March 2017 50
impact of pesticides; and conservation and sustainable use of plant genetic resources with strong linkages between conservation, plant breeding and seed sector development.
Australia-Africa Plant Biosecurity Partnership: The Australia-Africa Plant Biosecurity Partnership
(AAPBP) is a plant biosecurity capacity development program using Australian expertise to strengthen biosecurity skills and planning in Africa. The partnership aims to enhance plant biosecurity capacity in African countries and regions in order to lift agricultural economic productivity and promote safe trade in plant commodities. Countries involved include Burundi, Ethiopia, Kenya, Malawi, Mozambique, Rwanda, Uganda, Tanzania, Zambia and Zimbabwe. The AAPBP is led by Plant Biosecurity Program Capacity Development PBCRCP and funded by the Australian International Food Security Research Centre within the Australian Centre for International Agricultural Research. The program is being delivered by a consortium of PBCRC, the Crawford Fund and CAB International. The AAPBP aims to leverage support from other international agencies and to complement other work underway on plant biosecurity issues in Africa

Platform for Agricultural Risk Management | Crop pests and disease management in Uganda: status and investment needs
51 Uganda | Tools Assessment | Full Report | March 2017
4.4 Pest management technologies in Uganda
Certain characteristics of a pest management practice or technology are likely to influence the choice of dissemination method (or methods). Characteristics include:
1. Complexity of the technology and therefore of the messages needed to explain the technology to farmers;
2. Whether the method is relevant for control at an individual farm level – or whether effective control depends on collective action by all farmers in an area – or centralized action;
3. Whether purchased inputs are required. The main pest management methods can be clustered as follows: a) Cultural & physical; b) chemical c) biological d) use of resistance and e) regulatory. Integrated Pest Management (IPM) has been advocated for as a sustainable pest management approach. Though presented as a pest management method, ideally, it’s a set of guiding principles for effective and sustainable pest management. In the following, the various pest management options are described from a communications perspective and summarized in Table 10. a) Cultural and physical control
These are applied control practices aimed at altering conditions or pest behaviors or pest populations. These practices include; clearing fields of weeds and host plants to reduce harborage; removing infected plant parts, materials and burning / burying them; mulching; managing manure and other soil amendments to improve crop vigor; planting timing; crop rotations; using irrigation and related field measures. Passing on messages related to cultural practices may require relatively more intense dissemination approaches such as extension agent visits or moderate approaches like field days. For management of some pests, collective action is required because if only a few farmers implement field sanitation measures, their crops may still be infected as a result of poor sanitation in their neighbors fields. For example in the control of Banana xanthomonas wilt, collective community action was used due to the ease of spread of the disease from infected fields to non-infected fields. b) Chemical control
Chemical crop protection products (pesticides) are biologically active chemicals that control a range of insect and vertebrate pests, diseases and weeds. Pesticides may be systemic or contact, selective or non-selective, and residual or non-residual. Effective application of pesticides requires that farmer have appropriate knowledge of the type of pesticide in relation to the pest or disease they intend to manage. Use of pesticides is effective, fast and easy but requires proper diagnosis of the pest/disease problem is key, followed by appropriate application. Responsible use and good handling practices limit potential pesticide residues in crops and the environment as well as help avoid pest resurgence and resistance. To ensure this, there is need for demonstrations and more intensive extension approaches that incorporate follow up and routine check with farmers on usage of chemicals. c) Biological control
This involves nature’s own methods of pest control. This includes introduction of beneficial insects or predators; applying micro-organisms such as viruses, fungi and bacteria; and using pheromones to lure, trap and kill or interfere with insects’ mating habits. i) Use of natural enemies: This involves mass rearing of the pest natural enemy and its periodic release
into the environment. An example is mass rearing and release of T. aripo against cassava green mite and cassava mealy bug in Uganda. The natural enemy was obtained from IITA (West Africa) and currently managed by the Bio-Control Unit at the NARL in Kawanda. Deployment of the natural enemy is considered easy, even farmers can do it once given the biocontrol agent by research. Once released, the enemy sustains its self for long in the habitat though a post release monitoring is required to ensure pest populations do not build up.
ii) Bio-pesticides: Involves the mass rearing and use of bacteria, fungi, nematodes or viruses to control some pests. The most common and successful is Bacillus thuringiensis (Bt), a naturally occurring
bacterium, which has been used to control several important pests (e.g. caterpillar pests in vegetables, vineyards and orchards). Use of bio-pesticides is moderately complex and farmers need practical guidance on how to apply them.
iii) Sex pheromones baits and traps: This involves the development and use of insect sex pheromones and other behavior-modifying chemicals to trap and kill pests. Some pheromones disrupt mating thus slowing down population build-up of insect pests. Often use of traps requires collective action – and messages are relatively complicated. Sometimes farmers operating traps for monitoring are perceived to be rearing and releasing the pest.
d) Use of resistance
This involves use of planting materials that have levels of resistance or tolerance to pests and diseases. Two approaches are commonly used: i) Pest or disease resistant varieties. NARO and other research institutions have developed various crop
varieties with resistance to pests and diseases. Farmers need to be aware of these varieties and associated costs of acquiring seed/planting materials. Raising awareness of new varieties is likely to involve relatively simple messages – explaining what the advantages are and indicating where to buy a

Platfo
rm fo
r Agricu
ltural R
isk M
anagem
ent | C
rop
pests an
d d
isease man
agemen
t in U
gand
a: status an
d in
vestmen
t need
s
Platform for Agricultural Risk Management | Crop pests and disease management in Uganda: status and investment needs
Uganda | Tools Assessment | Full Report | March 2017 52
variety. To enhance further learning and observations, intermediate approaches such as farmer field days and demonstrations may be undertaken so that farmers observe first had the difference between their own varieties and resistant ones, and possibly associated agronomic practices.
ii) Grafting or budding is also used to enhance resistance of plants by selecting a resistant root stock on which a desirable plant material (high performing but susceptible) is grafted. Grafting has mainly been used in the management of pests and disease in fruits and vegetables. The technique is quite complex and therefore requires more intensive extension approaches, combined with demonstrations for farmers to be able to understand and effectively adopt it.
e) Regulatory pest management
The objective of regulatory pest management is to prevent the introduction and/or spread of pests through the application of various pest management techniques such as pest exclusion, detection, eradication, mitigation, and public education. Achieving this objective requires limiting movement of commodities and materials, and treating commodities, materials, and the environment. This requires regulatory authorities to efficiently and effectively identify pest harm, assess pest risk; and manage pest risk. Two approaches are commonly used: i) Quarantine: The primary strategy to exclude pest entry is through the use of quarantines. Quarantine
inspection programs at ports of entry are designed to prevent the introduction and establishment of pests into the country. Quarantine can be effective at reducing the incidence of pest introduction and reduce any incidents of pest introduction to a manageable population that can be eradicated.
ii) Eradication: If prevention is not successful and an introduction occurs, there is need for the control program to institute eradication measures. Eradication generally means using all available viable options, which often includes the application of pesticides or destruction of plant materials. Eradication programs require participation of farmers and communities who must first be sensitized especially if losses to farmers are anticipated. Farmers require adequate knowledge of such pests and implications for non-compliance. Moderately intensive measures such as field days can be used for farmer education, or lighter methods such as mass campaigns through radio and TV.
f) Integrated pest management (IPM)
IPM means considering all available pest control techniques and other measures that discourage the development of pest populations, while minimizing risks to human health and the environment. IPM emphasizes the growth of a healthy crop with the least possible disruption to agro-ecosystems and encourages natural pest control mechanisms (FAO, 2012). IPM requires a combination of cultural, biological and chemical measures to manage diseases, insects, weeds and other pests. It takes into account all relevant control tactics and methods that are locally available, evaluating their potential cost-effectiveness Implementation of IPM lies with farmers, who adopt practices they view as practical and valuable to their activities. Ultimately, IPM is a site-specific strategy for managing pests in the most cost-effective, environmentally sound and socially acceptable way. Using IPM is rather complex and require intensive extension measures to ensure that farmers learn and adopt IPM practices. Table 10: Typology of pest management practices from a communication’s perspective Pest management methods
Examples of pest management practices Complexity of message
Individual/Collective / Centralised action
Purchased inputs required
Cultural and physical Destruction of infected plant parts Moderate Collective No Fertility management Moderate Individual Yes Soil and water management Moderate Individual Yes
Crop rotation Simple Individual No Weed management Moderate Individual Yes
Chemical Inorganic pesticides Moderate Centralized Yes Organic pesticides Moderate Individual No
Biological Natural enemies Moderate Centralised Yes Bio-pesticides Moderate Individual Yes Pheromone baits and traps Complex Collective Yes
Resistance Pest resistant varieties Simple Individual Yes Grafting or budding Complex Individual Yes
Regulatory Quarantine Complex Centralized Yes Eradication programs Complex Centralized Yes
Integrated pest management
Integrated pest management Complex Individual Sometimes
4.5 Cost efficiency of extension methods
Impacts and benefits achieved by a given extension approach can be very variable. Although there are studies on the impacts of different approaches (including Farmer Field Schools, radio, mobile delivery and plant clinics) – impact assessments usually focus on the impact of particular practices and technologies. The economic benefit of an approach will depend not only on the effectiveness of the approach in influencing adoption – but also on the effectiveness of the practice or technology promoted to influence production.

Platform for Agricultural Risk Management | Crop pests and disease management in Uganda: status and investment needs
53 Uganda | Tools Assessment | Full Report | March 2017
The costs of and benefits from utilizing different extension methods to promote or train in pest management practices can differ depending on the intensity of the method (on the cost side) and the complexity of the practice and the influence that this has on the probability of farmer adoption—and thus the benefit side. Harris et al. (2013) talks of three levels of complexity: ‘‘simple,’’ ‘‘intermediate,’’ and ‘‘complex’’ technologies and noted that choice of extension approach should be influenced by the type of technology with low intensity approaches being used for simple technologies and higher intensity methods for more complex technologies.
It is assumed then that once farmers adopt technologies, they will be able to reduce crop losses as a result of pest and disease damage thus increasing their production and profitability. Similarly, there is likely to be spontaneous diffusion of technologies from farmer to farmer, if the technology is appreciated. Neighbours and other family members are often the most frequently cited source of information in studies, however we did not find indications in the literature that information acquired by farmers from different approaches were more or less likely to be shared – therefore the spillover effects were not considered.
The magnitude of economic benefits from a single dissemination activity therefore depends on the resources devoted to the activity, the number of farmers reached, the resulting level of adoption including spillovers and economic benefits of the technology (e.g., yield increase, input cost reductions, reduced consumer prices). Given the enormous range of possible practices that could be considered we avoid looking at monetary benefits of adoption and thus focus on cost-efficiency reflecting numbers reached and likelihood of adoption.
At the same time, many other factors influence adoption. For example: the timeliness of advice given, availability and affordability of any required inputs such as seed, fertilizer, crop protection products or labour; there should be adequate incentives for the farmers to be able to apply advice such as available market and the expected benefits should at least offset the costs.
In summary, agricultural extension projects generally can have strong and positive impacts on producer outcomes, but estimates also reveal high variance and are plagued by a number of measurement and attribution problems. Similarly, different extension methods achieve different results with different levels of investment. This has raised debate over the most appropriate diffusion methods.
In the analysis of cost-effectiveness, we first review the cost “ingredients” for different extension approaches, but then focus on variable costs of each method to estimate a cost per farmer reached. This is then converted into cost efficiency (cost per farmer adopting) for simple and complex technologies using estimates of likelihood of adoption based on “expert opinion” using information on adoption rates from the literature and personal experiences of the authors. We also briefly discuss other factors that may influence choice of approach.
4.5.1 Cost ingredients of extension approaches
The costs of extension are defined as the value of the resources that are given up by society to effect the information delivery. These are referred to as the ingredients of the extension approach, and it is the value of those ingredients that constitute its overall cost. In doing a cost analysis, the first step is to ascertain which ingredients are required for a given extension approach. Once the ingredients have been identified, then their cost is ascertained. Costs of extension include both fixed and variable costs, along with the marginal costs of these programs. Fixed costs are incurred by the institutions that implement extension and do not increase when additional events are held or when more farmers participate. Variable costs are the costs that increase when more events are held or when more farmers attend. The marginal cost is the cost of providing an additional session or allowing an additional farmer to participate. Each of these types of cost provides a different aspect of the true cost of administering extension for pest management. Table 11 shows the cost ingredients associated with selected extension approaches.
Table 11: Cost ingredients associated with selected extension approach Extension approach
Fixed costs Variable costs Marginal costs
Extension agent visits
- Maintaining the national extension including recruitment costs, cost of technical backstopping and administration
- Re training and re-tooling extension agents
- Extension agent’s salary - Perdiems for field visits - Transportation (fuel, lubricants and
spares)
Extension agents visit about 10 farmers per day. Reaching more farmers involves increasing the frequency of visits.
FFS - Costs associated with administering the national level program such as paying consultants and administrators
- Research on the field school program - Development of the curriculum - Training master trainers and facilitators
- Extension agent’s salary - Materials - Food and refreshments - Renting locations
FFS curriculum is designed to train no more than 25 farmers at a time. Increasing the number of farmers, implies a different FFS with all the associated variable costs
Plant clinics - Training of Plant doctors - Equipping plant doctors (prescription books,
pest and disease management guides, knife and magnifying glass, plant doctor coats).
- Costs associated with administering the
- Extension agent’s salary - Allowances for clinic staff - Transport of furniture and tent - Casual labour to set up the tent - Publicity
Plant clinics operate for 2-3 hours a day during public gatherings such as market days. Reaching more farmers requires establishment of more clinics or increasing the frequency of clinics.

Platfo
rm fo
r Agricu
ltural R
isk M
anagem
ent | C
rop
pests an
d d
isease man
agemen
t in U
gand
a: status an
d in
vestmen
t need
s
Platform for Agricultural Risk Management | Crop pests and disease management in Uganda: status and investment needs
Uganda | Tools Assessment | Full Report | March 2017 54
national level program such as national steering committees, data collection and management, local level supervision, cost of tablets for e-clinics etc.
Farmer field days
None - Extension agent’s salary - Publicity and invitations - Facilitators’ allowances - Food and refreshments - Training materials Transportation costs and venue hire
Extra food /refreshments and materials for the additional participants
Village based intermediaries
- Training costs - Transport and materials support (e.g.
bicycle, gumboots) - Admin of national program
- Information materials - Opportunity cost of intermediary’s
time - Allowances for the advisors in
some cases
An intermediary would have capacity to interact with a fixed number of farmers – additional farmers would require more facilitators
Radio - Radio programs and scripts - Cost of managing the program - Content development and packaging
- Cost of airtime - Facilitator’s allowance and
transport
Different radio stations have a fixed reach. The additional costs would relate to more programs being aired and/or more stations being used.
- -
4.5.2 Cost per farmer for different extension approaches
The number of farmers each method reaches includes those farmers in direct contact with the program plus the spread from those farmers to other farmers who did not have the initial direct contact. Determining how many farmers each method reaches for a given budget requires information on the number of people who participate in the various types of training. For this analysis, we obtained information on the number of people reached from the organizations that sponsor extension programs, whether face to face, through an intermediary or through mass media. The cost associated with each extension method was then divided by the number of people reached to obtain per farmer cost.
Cost estimates for various extension approaches and per farmer cost are shown in Table 12. Average costs are based on results obtained from key informant interviews. The costs that the study examines are the variable field cost of administering various extension methods. Fixed costs are not considered on assumption that sustainability of the system is based not on fixed but recurrent costs of maintaining it. Similarly, the analysis does not include the opportunity costs of farmers time on assumption that their time is covered by added benefits of participating in the trainings or receiving information.
Extension agents involved in training and visits and village-based intermediaries have a relatively fixed client base. In estimating variable costs for extension agents, it was assumed that only 20% of their time is spent on training and visit activities – this may be pest management or other aspects of crop production, soil fertility and enterprise management. In the remaining time they are engaged in other activities, including some of the other extension approaches e.g. field days, plant clinics, FFS etc. Village based advisors are normally not remunerated, but some cases where they received an allowance were encountered during the KIIs. For example Grameen Foundation initially paid CKWs an allowance of UGX100,000 per month as a startup. Other extension approaches, such as farmer field days and plant clinics, involve a single or series of events. The total number of farmers reached in this case depends on the frequency of the events, not necessarily implemented in the same locations. In this case, number of farmers reached are estimated for a single event. Radio is different as each station covers a fixed area. Costs are given for a single 30 minute program following a talk-show format. For FFS, salary costs are estimated assuming 1 day is spent on each ½ day session (including preparation and travel).
Table 12: Variable costs associated with administration of extension methods Extension methodd
Variable costs Costs (UGX) Costs (USD)
# farmers reached
USD/ farmer
Extension agent visits (1-day trainings)
Extension agent salary (20% of time on T&V)a 1,920,000 582
Perdiems for field visitsb 880,000 267
Transportation (fuel, lubricants and spares) 288,000 87
Total 3,088,000 936 600 1.56
FFS Extension agent salary (17 days) 741,818 225
Refreshments for 1st session 120,000 36
Refreshments for 12 regular sessions 600,000 182
Field day preparations 90,000 27
Training and materials 100,000 30
Facilitators’ allowances 340,000 103

Platform for Agricultural Risk Management | Crop pests and disease management in Uganda: status and investment needs
55 Uganda | Tools Assessment | Full Report | March 2017
Facilitators’ travel 111,273 34
Monitoring 3 visits 150,000 45
Total 2,253,091 628 30 22.76
Plant clinics Extension agent salary (1 day for 2 staff for a 1/2 day session) 87,273 26
Allowances for clinic staff 40,000 12
Transport of furniture and tent 50,000 15
Casual labour to set up the tent 20,000 6
Prescription books 3,120 1
Publicity 15,000 5
Total 232,273 65 13 5.02
Farmer field days Extension agent salary (5 staff for 1 day) 218,182
Invitations 100,000 30
Food and refreshments for participants 1,275,000 386
Brochures and information materials 300,000 91
Transportation costs and venue 650,000 197
Technical staff allowances 100,000 30
Total 2,543,182 735 85 8.65
Plant health rallies Extension agent salary (4 staff for 1 day) 174,545 53
Per diem 100,000 30
Travel 32,727 10
Publicity 100,000 30
Total 407,273 123 300 0.41
Village based intermediaries
Information materials 200,000 61
Allowances 1,200,000 364
Total 1,400,000 424 100 4.24
Radio – set of 12 programs
Extension staff salary (2 staff - 2 day) 43,636 53
Cost of airtime (radio and TV) 9,000,000 2,727
Allowance for technical staff for radio 200,000 61
Total 9,374,545 2,841 150,000 0.02
Print media Cost of print publication (newspaper pages) 5,000,000 1,515 5,000 0.30
Mobile Cost of SMS for phone based messaging 2,400,000 727 2,000 0.36
Notes: a) Salary cost of extension staff in each case assumes a similar person with a standard salary typical of a field extension staff grade and is based on the number of days spent on a particular event or series of events. b) Different allowances for per diem and travel were mentioned by different groups – reflecting different rates agreed with different projects. A standard rate of UGX 20,000 as day allowance was used in calculations. c) Costs based on sample private sector company charges for delivering 30 SMS to 2000 farmers over a period of 3 months (each sms at UGX40). d) Information used for different methods were gathered from key informants including; CABI, ISSD Uganda, Grameen Foundation, Farm Radio International, as well as review of literature for FFS e) it should be noted that the more intensive methods particularly FFS cover a larger number of topics compared to other approaches. Results from Table 12 show that mass media approaches (mobile, print and radio) have the lowest per farmer cost. This is because the cost of administering these programs is very low and their potential reach is very high. Extension agent visits, village intermediaries and plant clinics also have much lower cost of reaching farmers approximately $2, $4 and $5 per farmer respectively. Farmer Field Schools have the highest per farmer cost at $23. Extension agent visits are classified as very intensive approaches due to the routine training and follow up visits that are conducted by extension agents. The advantage is that the trainings may be conducted in groups, often involving demonstrations and follow ups which enhance farmer learning and retention of trained techniques.
4.5.3 Cost efficiency of extension approaches using estimated adoption
rates
Dissemination alone does not yield benefits; farmers who learn about a practice must decide to adopt it. Thus the effectiveness of extension also depends on the ability to affect adoption of technologies. Based on technology characteristics, certain dissemination methods may be more effective in inducing adoption than others. Less speedy but interactive approaches such as field days, agent visits and FFS may be appropriate for passing on more complex technologies such as IPM. These approaches allow for farmer participation and experiential learning which ultimately improves adoption. Table 13 presents costs efficiency estimates for the range of extension methods.

Platfo
rm fo
r Agricu
ltural R
isk M
anagem
ent | C
rop
pests an
d d
isease man
agemen
t in U
gand
a: status an
d in
vestmen
t need
s
Platform for Agricultural Risk Management | Crop pests and disease management in Uganda: status and investment needs
Uganda | Tools Assessment | Full Report | March 2017 56
Table 13: Cost efficiency estimates for various extension methods
Method
Cost $/ farmer
(variable only)
No. farmers /$1,000 (n)
Probability of adoption of
simple message (p1)
Probability of adoption of
complex message (p2)
Effectiveness for simple
message (n x p1)
Effectiveness for complex
message (n x p2)
Extension agent visits 1.6 641 0.3 0.2 192.3 153.8
Farmer field schools 22.8 44 0.4 0.4 17.6 15.8
Plant clinics 5.0 202 0.3 0.2 60.6 42.4
Farmer field days 8.7 116 0.3 0.2 34.7 24.3
Plant health rallies 0.4 2,439 0.2 0.1 487.8 292.7
Village based intermediaries 4.2 236 0.2 0.1 47.2 28.3
Radio 0.0 52,632 0.02 0.00 1052.6 210.5
Print media 0.3 3,333 0.03 0.01 100.0 20.0
Mobile 1.8 556 0.02 0.00 11.1 2.2
Notes: a) Probability of adoption of simple messages is based on data from the literature (e.g. Harris et al.2013) as well as individual experiences of the authors
From the analysis (Table 13), radio emerges as the most cost efficient for simple and complex messages because of the high reach, though it should be noted that the costs and reach can be variable. Often a series of radio shows are carried out – costs above are based on a single 30 minute show. FRI commonly use a campaign approach with 12-18 shows, participatory listening groups and feedback mechanism that increase costs – though also adoption rates.
In contrast to radio the high effectiveness of extension training and visits is attributed to the high adoption rates of techniques by farmers. Extension agents have capability to reach many farmers with information on pest management and offer an opportunity for further follow up to ensure that trained techniques are fully adopted. The biggest drawback of using extension agent is the big cost of establishing and maintaining the national extension system. But once established, the transactions costs are much lower compared to the benefits achieved.
Farmer field days follow in line in terms of their relative cost-effectiveness. Farmer field days are interactive, allowing farmers to engage with the technical teams on pest management. They also attract varied stakeholders who provide options for pest management, reaching many farmers. MAAIF has recorded success stories in the management of BXW using farmer field days. Farmer field days targeted in BXW hotspots demonstrated appropriate management practices. It’s documented that as a result, BXW incidence reduced from over 45% in June 2012 to below 13% at farm level and to 3% at plant level in November 2013 (Byantwale, 2014).
Analysis of FFS on the other hand shows high per farmer cost and relatively lower farmer benefits due to a relatively low number of farmers reached compared to other dissemination methods. This has also largely been the reason why FFS have been criticised – high participant costs. Waddington and White (2014) in their review of over 500 FFS evaluations report overall change in farmer practices and yield increases in pilot projects, but less effectiveness when FFS are taken to scale. The FFS approach requires a degree of facilitation and skilled facilitators, which are difficult to sustain beyond the life of the pilot programs. FFS still present the most appropriate for passing on more complex pest management technologies such as integrated pest management. For this approach to be cost-effective, requires that knowledge obtained spills over to non-participating farmers and that farmers transfer their knowledge to other crops (Ricker-Gilbert et al., 2008). This would directly increase the number of participants, thus reducing the per farmer cost. A mechanism to ensure spillover of information is important when using FFS approach.
4.5.4 Speed of information spread
Information on some pest and disease outbreaks and early warning of emerging pests and diseases, if not delivered early in an outbreak or before a new pest has time to spread could have negative consequences. For such information, finding a method that spreads information to large numbers of farmers quickly can be very important. Based on expert opinion we assume that mass media reaches farmers at the fastest rate of all formal methods. For example MAAIF launched awareness campaigns on BXW in several FM radios in all the 4 main

Platform for Agricultural Risk Management | Crop pests and disease management in Uganda: status and investment needs
57 Uganda | Tools Assessment | Full Report | March 2017
banana growing regions (central, mid-west, south west and east) in Uganda. As a result of the campaign, significant recovery of fields was registered - up to 60.9% in south west between June 2012 and November 2013 (Byantwale, 2014). Use of mass media approaches have also been applied to pass on information related to identification and management of maize lethal necrosis (MLN), cassava brown streak disease (CBSD) and other outbreaks. Early warning systems and advisories have also been based on mass media due to the speed desired for farmers to be able to make timely decisions within the season.
Other methods such as field days and extension agent visits that rely on a relatively small number of extension staff means that information is spread more slowly. Although technologies that are complex may require interactive approaches, to ensure learning and proper application, this may be particularly important for integrated pest management approaches that are often knowledge intensive. FFS takes even more time – but, many argue leads to additional benefits including increased capacity of farmers to solve new problems.
4.6 Summary and recommendations for pest management
The analysis provides a description of extension approaches and their effectiveness in achieving pest management. A number of factors affect overall effectiveness of extension methods. As explained there is a trade-off between reaching large numbers and achieving levels of understanding for farmers that allows them to adopt recommendations. Low intensity and mass media approaches can reach large numbers at low cost but are probably not suited to clearly getting across a complex message. High intensity interactions are more likely to lead to adoption of complex approaches – but this means that relatively few farmers can be reached.
Uganda government is already committed to staffing a single spine extension system that will put extension staff at sub-county level across the country. However, it is inevitable that staff will still have large numbers of farmers in their catchment areas. Ideally work-plans would be developed together with government departments that rely on them for service delivery, including the DCP, to ensure that priorities are addressed. At the same time plans would ideally embed different methods and approaches that use their time most efficiently and at the same time leverage contributions from other service providers including village based intermediaries and value chain stakeholders. Some scenarios with implications for pest management include:
Where a new pest is detected or a pest outbreak occurs and it is important to deliver information quickly to large numbers, mass media may be most appropriate – as well as rapid field based methods such as plant health rallies and farmer field days. Such methods may encourage farmers to seek further information from different sources.
For well-organized value chains, private sector service provision is feasible and already taking place. For advice on these crops, extension staff should also link with these service providers to spread messages further. DAE already has a plan of profiling extension service providers, which will provide an opportunity for coordinated extension delivery.
To ensure access to good advice – sources of information should be linked and made accessible. This is likely to capitalize on improving ICT infrastructure, for example through open and linked databases.
In some cases, where introduction of complex pest control methods are to be encouraged, more intensive methods such as farmer field schools could be used with selected farmers – complemented by the use of farmer field days, demonstration plots etc.
For demand-led advisory services for crop problems, plant clinics provide a method that has the added advantage of providing a pest monitoring approach. Targeting clinics strategically in districts where crop production is key and in areas of intensive production within districts would give good coverage of where new pests detections are most likely as well as providing advisory services.
To be effective extension staff as well as other intermediaries need to be well trained and equipped with various dissemination approaches / tools that they can employ depending on the nature of the message they intend to disseminate. Close collaboration with academia (e.g. Makerere University) to facilitate inclusion of new methods into curricula would contribute to capacity building. Currently MAAIF is working with 4 agricultural institutions – Makerere, Gulu and Uganda Christian Universities and Bukalasa agricultural college to develop the curriculum.
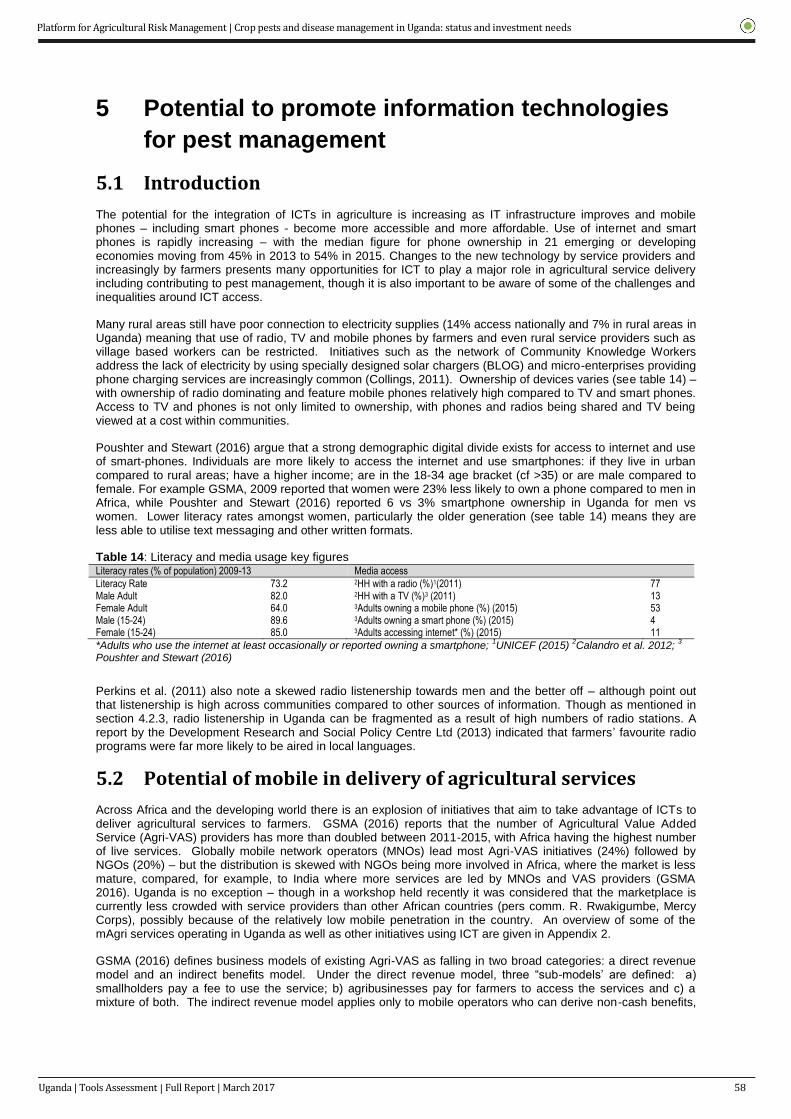
Platfo
rm fo
r Agricu
ltural R
isk M
anagem
ent | C
rop
pests an
d d
isease man
agemen
t in U
gand
a: status an
d in
vestmen
t need
s
Platform for Agricultural Risk Management | Crop pests and disease management in Uganda: status and investment needs
Uganda | Tools Assessment | Full Report | March 2017 58
5 Potential to promote information technologies
for pest management
5.1 Introduction
The potential for the integration of ICTs in agriculture is increasing as IT infrastructure improves and mobile phones – including smart phones - become more accessible and more affordable. Use of internet and smart phones is rapidly increasing – with the median figure for phone ownership in 21 emerging or developing economies moving from 45% in 2013 to 54% in 2015. Changes to the new technology by service providers and increasingly by farmers presents many opportunities for ICT to play a major role in agricultural service delivery including contributing to pest management, though it is also important to be aware of some of the challenges and inequalities around ICT access.
Many rural areas still have poor connection to electricity supplies (14% access nationally and 7% in rural areas in Uganda) meaning that use of radio, TV and mobile phones by farmers and even rural service providers such as village based workers can be restricted. Initiatives such as the network of Community Knowledge Workers address the lack of electricity by using specially designed solar chargers (BLOG) and micro-enterprises providing phone charging services are increasingly common (Collings, 2011). Ownership of devices varies (see table 14) – with ownership of radio dominating and feature mobile phones relatively high compared to TV and smart phones. Access to TV and phones is not only limited to ownership, with phones and radios being shared and TV being viewed at a cost within communities.
Poushter and Stewart (2016) argue that a strong demographic digital divide exists for access to internet and use of smart-phones. Individuals are more likely to access the internet and use smartphones: if they live in urban compared to rural areas; have a higher income; are in the 18-34 age bracket (cf >35) or are male compared to female. For example GSMA, 2009 reported that women were 23% less likely to own a phone compared to men in Africa, while Poushter and Stewart (2016) reported 6 vs 3% smartphone ownership in Uganda for men vs women. Lower literacy rates amongst women, particularly the older generation (see table 14) means they are less able to utilise text messaging and other written formats.
Table 14: Literacy and media usage key figures Literacy rates (% of population) 2009-13 Media access
Literacy Rate 73.2 2HH with a radio (%)1(2011) 77 Male Adult 82.0 2HH with a TV (%)3 (2011) 13 Female Adult 64.0 3Adults owning a mobile phone (%) (2015) 53 Male (15-24) 89.6 3Adults owning a smart phone (%) (2015) 4 Female (15-24) 85.0 3Adults accessing internet* (%) (2015) 11
*Adults who use the internet at least occasionally or reported owning a smartphone; 1UNICEF (2015)
2Calandro et al. 2012;
3
Poushter and Stewart (2016)
Perkins et al. (2011) also note a skewed radio listenership towards men and the better off – although point out that listenership is high across communities compared to other sources of information. Though as mentioned in section 4.2.3, radio listenership in Uganda can be fragmented as a result of high numbers of radio stations. A report by the Development Research and Social Policy Centre Ltd (2013) indicated that farmers’ favourite radio programs were far more likely to be aired in local languages.
5.2 Potential of mobile in delivery of agricultural services
Across Africa and the developing world there is an explosion of initiatives that aim to take advantage of ICTs to deliver agricultural services to farmers. GSMA (2016) reports that the number of Agricultural Value Added Service (Agri-VAS) providers has more than doubled between 2011-2015, with Africa having the highest number of live services. Globally mobile network operators (MNOs) lead most Agri-VAS initiatives (24%) followed by NGOs (20%) – but the distribution is skewed with NGOs being more involved in Africa, where the market is less mature, compared, for example, to India where more services are led by MNOs and VAS providers (GSMA 2016). Uganda is no exception – though in a workshop held recently it was considered that the marketplace is currently less crowded with service providers than other African countries (pers comm. R. Rwakigumbe, Mercy Corps), possibly because of the relatively low mobile penetration in the country. An overview of some of the mAgri services operating in Uganda as well as other initiatives using ICT are given in Appendix 2.
GSMA (2016) defines business models of existing Agri-VAS as falling in two broad categories: a direct revenue model and an indirect benefits model. Under the direct revenue model, three “sub-models’ are defined: a) smallholders pay a fee to use the service; b) agribusinesses pay for farmers to access the services and c) a mixture of both. The indirect revenue model applies only to mobile operators who can derive non-cash benefits,

Platform for Agricultural Risk Management | Crop pests and disease management in Uganda: status and investment needs
59 Uganda | Tools Assessment | Full Report | March 2017
such as increased market share and rural acquisitions; higher usage of SIM cards for core services, data usage, or other VAS usage; customer loyalty; and related churn reduction and brand awareness. In addition there are subsidised models, where the Agri-VAS relies mainly on donors, NGOs, government agencies, or private companies to sustain their operations. In Uganda – some actors are looking to establish direct revenue models, but direct payment for services is farmers is rare. FIT-Uganda is a good example where its Infotrade service operates a mixed model with some payments by farmers. According to key informant interviews – a significant amount of donor support was still being provided through NGOs and other partners using the FIT-Uganda platform. Some models are emerging within closed value chains – where a private sector enterprise uses ICT platforms to support its business with farmers. A good example of this is the Joseph Initiative. As far as the team is aware – no services led by mobile operators were identified.
In the outcome of a recent workshop in Nairobi (Harnessing ICT for Agriculture in Africa) supported by the African Development Bank and led by CABI (S Bannerjee, P Abrahams, personal communication), it was proposed that countries could develop a Universal e-agriculture service platform through public-private-partnerships that could be used by a range of service provision including insurance providers, input suppliers, produce aggregators, and extension providers. Entrepreneurs at the meeting noted that on average 60% of their investment to establish services were in development and maintenance of the ICT platform on which their solutions worked. It was proposed that a centralised platform would be: managed by a neutral trusted agency; provide Plug-n-play Software as a Service (SaaS); offer the opportunity to plug-in innovative solutions through Application Program Interfaces (software that assists users to interact with different programs or databases and allow multiple possibilities for cost recovery. Systems would be aligned with policy and appropriate regulatory frameworks.
5.3 Potential for information technology in data collection and sharing
Most of the ICT initiatives involve both collection and sharing of data and information. Data collected centrally by services consulted included: farmer profiles collected alongside farmer numbers, market information (prices and information on buyers and sellers of commodities); data on queries asked by farmers (nature of request); feedback on services or topics covered in radio programs and socio-economic and other data collected during surveys applied as part of services. Few collected data on pests and diseases except for the plant doctors receiving visitors at plant health clinics in the CABI lead Plantwise program.
Farmer profiles/numbers: FIT-Uganda explained the importance of farmer profiling – not only to allow farmers
to receive information that is relevant to them – but to start to build an identity that can help farmers access services such as finance or insurance. Such information also has a high value to service providers including: input-suppliers, banks, insurance companies, traders etc. Profiles generally include information on farmer location, crops grown and acreage as well as demographic information on age, sex etc. FIT are also developing a farm record management solution to help farmers keep records – as service providers are looking for this. The Joseph Initiative uses a technology platform that monitors all operations where farmers delivering to the company are registered and transactions recorded (Bymolt, 2015). A challenge for maintaining databases of farmer profiles is the high churn rate (switching between mobile service providers or numbers) – meaning that it is sometimes difficult to keep track of farmers.
Market data: Market data normally incurs a cost – as prices change constantly and value is in receiving real-time
prices. In most cases agents are present in key markets distributed across the country where the services operate.
Socioeconomic survey data: Two initiatives: Gutsinda and Grameen Foundation implement surveys using their networks of village agents, collecting monitoring and evaluation data paid for by partners.
Technical information on good practices: Information formed a core part of most systems, with most initiatives
providing technical information related to crop production including input supply. Information is sourced nationally (e.g. from NARO, NaCRRI) or regionally / internationally (e.g. AGRA / ASARECA / CABI / FAO / CGIAR). Information databases are developed that can be accessed using a smart phone by intermediaries (e.g. Gutsinda Development Group, Grameen Foundation, CABI-Plantwise) or over the web (e.g. AGINSBA (Agricultural Innovation System Brokerage Association) and the Plantwise Knowledge Bank) although during the review team attempts to access content databases, this was only possible for the Plantwise Knowledge Bank which is currently donor supported and open access. In a Plantwise meeting with ICT4AG partners, there was interest in developing a common framework leveraging different initiatives. Most claimed to include information on crop pests and diseases in their databases. Only Plantwise specialized on pests and diseases.

Platfo
rm fo
r Agricu
ltural R
isk M
anagem
ent | C
rop
pests an
d d
isease man
agemen
t in U
gand
a: status an
d in
vestmen
t need
s
Platform for Agricultural Risk Management | Crop pests and disease management in Uganda: status and investment needs
Uganda | Tools Assessment | Full Report | March 2017 60
5.4 Potential for information technology to track and monitor pests
5.4.1 Current pest monitoring systems
Currently, the primary source of monitoring pests and diseases for MAAIF is from local extension agents that have a responsibility to report pest and disease outbreaks in their localities. The information may come from their own observations or reports from farmers. The extension workers report to the District Agricultural Officers, who then report to the Department of Crop Protection in MAAIF. Other information sources are direct reports from farmers, Local government, Zonal Agricultural Research Institutes, and border post monitoring units. The Department of Crop protection has provided a direct line where issues related to pest and diseases can be reported. An interviewee noted that the private sector focus on data related to profits and sales rather than on pests and diseases. Although they also noted that flower exporters are keen on pest reporting and that it was more common for high value crops, where private sector need the data and will therefore help generate it.
Once information is received, the Plant Protection and Health Technical Committee (see section 3.1.4) evaluates the extent of the problem and devises strategies for management of the pest/disease. Depending on the nature of the pest/disease, MAAIF may mandate District Agricultural Officers to take action. Action is often with support from international organizations e.g. recent development of a manual and work plan for MLND and interventions brought to the Plantwise steering committee.
MAAIF also receives information through partnerships with other agencies including FEWSNET and ACTED (both collecting data for early warning systems) UNMA (National Meteorological Authority) and related agencies. As far as the consultants are aware – this information mainly relates to drought early warning rather and does not include pest and disease information.
5.4.2 Current use of ICT for pest monitoring
Plantwise: Use of information technologies is currently limited, although DCP staff interviewed referred to the
data collected at plant clinics under the Plantwise program. Plantwise involves establishment of a sustainable network of local plant clinics, run by trained plant doctors, where farmers can find practical plant health advice. In Uganda, plant doctors are mainly local government or, when NAADS was operational in extension, NAADS staff. A number of NGOs (including Self Help Africa, Rwenzori Information Centres Network (RICNET) and; Soroti Catholic Diocese Integrated Development Organization (SOCADIDO) support plant clinics, usually also working with government staff as plant doctors. Data is currently collected using paper forms that are collected and entered by a data manager, working in DCP, into the CABI managed Plantwise Online Monitoring System (POMS). Plantwise promotes sharing data nationally as widely as possible, but provides access to data according to the wishes of the national counterpart. It was highlighted in key informant interviews that some of the data can have major implications for trade and therefore access is largely restricted to DCP staff. However, the data can potentially be used to identify new outbreaks of endemic pests and diseases as well as occurrence of new pests and diseases and can act as an early warning system to trigger responses.
At the same time data can give an overview of the main pests and diseases by crop by region. To illustrate data available, Appendix 3 gives an overview of crops brought to clinics in different regions by male and female farmers. Similar tables can also be developed for problems diagnosed by crop and by region and advice given. This data is not presented because of restrictions. Other potential uses of data include: identification of gaps in plant doctor knowledge that can be used to target additional training and; monitoring of advice on banned chemicals.
The paper based system of data collection is slow and many plant doctors dislike completing the paper forms as they don’t see direct benefits for themselves. In order to improve diagnostics and speed of information delivery, CABI and MAAIF are currently starting to pilot e-clinics, shown to be successful in Kenya (Wright et al. 2016) - using internet enabled tablets at the clinics. The tablets allow access to the Plantwise factsheet application and knowledge bank and mechanisms for peer to peer support using social media to consult other plant doctors and supervisors when they cannot solve the pest/disease problem. Tablets also allow for a digitized system of collecting data that can be automatically sent to a central database for validation in real time. A proposal has already been submitted to IFAD for funding to support research to introduce ICT to explore more efficient ways of collecting, validating, sharing and using data. Institutional barriers to data collection and cooperation between different organizations also need to be addressed. Sensitive data needs to be protected – but sufficient incentives are needed to encourage data collection by plant doctors that are normally field extension staff who don’t report to DCP. This may require timely access to data by the organizations of individuals collecting data.
Crowd sourcing: Crowd sourcing information and data is a tool that is also gaining popularity and UNICEF has been working with a number of tools using RapidPro, their common platform for developing and sharing mobile services that can be adapted for different contexts and sectors and that is open source. Three tools that could

Platform for Agricultural Risk Management | Crop pests and disease management in Uganda: status and investment needs
61 Uganda | Tools Assessment | Full Report | March 2017
have relevance for pest and disease monitoring (see http://causetech.net/innovation-zone/unicef-innovation) include:
mTrac: Launched by the Uganda Ministry of Health - uses mobile phones and SMS to speed up weekly reports on disease outbreaks and medicines; provide a mechanism for community members to report on service delivery challenges, and provide timely information for action by district health teams.
U-Report: A mobile phone, text based service where young people can voice their opinions. The system is used to poll U-reporters and to share information and although not an agriculture based tool was used to gather information on Banana Xanthomonas wilt and share advice. (see http://www.unicefstories.org/2014/02/13/its-bananas-ugandas-youth-and-u-report-save-banana-crops/)
EduTrac: used in Uganda by District Education Officers’ to support schools. Teachers, head teachers, school committee members report periodically on indicators, such as absenteeism, cases of violence against children, and curriculum progress. Data is used to drive supervision efforts at the local level, and to inform planning nationally.
Event Mobile Application (EMA), a partnership project for FAO and MAAIF for livestock disease surveillance in Karamoja Region. EMA is a web based real-time technology that uses smartphone for making instant reporting on livestock disease. It’s anticipated that the technology will support the strengthening of early warning and disease surveillance capabilities and improve reporting and response to disease outbreaks in the Karamoja Region. (see http://www.fao.org/in-action/new-mobile-application-proves-essential-to-uganda-veterinarians/en/)
Uliza: Used in Uganda by Farm Radio International to gather feedback and response to key questions from farmers / listeners. Uliza (meaning ‘ask’) platform allows farmers to call in and log their questions, or respond
to poll questions so as to gauge level of farmer learning from radio programming.
Tracfm (http://tracfm.org) used by some radio stations provides a call-in facility to radio stations to gather feedback from listeners.
5.4.3 Integration of pest monitoring with new online statistics system
It was noted that there are plans to develop an online agricultural statistics and information system (ASIS) to collate and manage data collected at district level through local government. Feasibility of integrating data on pest and disease monitoring was not clear. One interviewee commented that this integration may not be easy given the different interests of each with the ASIS database focusing on details about farmers and on-farm production rather the pest situation.
5.5 Summary and recommendations for ICT
Potential opportunities include the following:
There is potential to build on the ICT based initiatives – for example – a major cost of setting up sustainable systems is collection and maintenance of farmer contacts and profiles and investment in development of VAS platforms. Centralized collection of farmer profiles would aim to protect user privacy – while supporting businesses that rely on them.
Potential for linking ASIS with pest monitoring was not clear – and there may be sensitivities – it does seem an opportunity if good working arrangements could be established. At this stage it would be important to avoid establishing parallel systems as occurs in some countries (see box 5.1)
Box 8: Parallel data management systems based on farmer profiles
In Costa Rica both the extension and crop protection departments have databases and collect information at farm level. Each data base manages a set of farmer profiles to which they add information on that farmer. However, the two databases were developed independently and have separate, incompatible farmer profile systems. This means there is no way of, for example, connecting a farmer’s history of pests with the extension services she’s receiving etc. as they have separate incompatible profile systems. A shared profile system would make more efficient use of resources. Source: C. Finegold, pers comm.
A strategically placed network of plant clinics operated by plant doctors using tablets to collect data, integrated into the working practice of government extension, could form the basis of a pest monitoring system as well as extending demand led advisory services. Data collected at clinics could be complemented by pest observation data collected by any extension officer at any place or time and sent electronically using a common form. To be sustainable clinics would need to be institutionalized with a customized data collection and management approach developed that is streamlined and tailored to national system. A key challenge would be to identify win-win situations where those collecting data benefited or had some incentives to ensure sustainable systems

Platfo
rm fo
r Agricu
ltural R
isk M
anagem
ent | C
rop
pests an
d d
isease man
agemen
t in U
gand
a: status an
d in
vestmen
t need
s
Platform for Agricultural Risk Management | Crop pests and disease management in Uganda: status and investment needs
Uganda | Tools Assessment | Full Report | March 2017 62
Crowd sourcing approaches – to verify occurrences and extent of spread could be used. An existing system such as U-report could be used such as in the example with BXW, or a tailor made approach developed. An approach could be designed to feed in to ASIS. It could target extension staff only or a broader community including farmers.
Without funds and systems to respond to monitoring data on outbreaks or new pests from Plant clinics, crowd sourcing or elsewhere – monitoring will not serve much purpose – low investment compared to other sectors could be an issue. Otherwise investment in building capacity to collect and analyse data and establish frameworks for response would be logical.
It would be important to audit available information and determine how accessible it is. For example, the phytosanitary section has developed a harmonised seed trade regulation for COMESA. Pest lists were developed and support provided to develop national pest lists for plant protection and health regulations. However it is not clear how easily can these be accessed? Access to this and other information – including recommendations for pest control approaches should be developed.
Different organizations maintain different databases of information on pest and disease management – the Plantwise Knowledge bank appears to be most organized –but there are other data sources being used in different ways. If there is appetite it would make sense to establish a network of partners with databases of information and work towards establishment of a central search page that allows users to search available national and international databases through a set of APIs – to effectively create a set of open and linked databases. APIs represent a piece of software that allows an individual not familiar with a database structure to nevertheless source content easily. In a recent workshop of organizations involved in ICT4AG there was enthusiasm for such an activity.
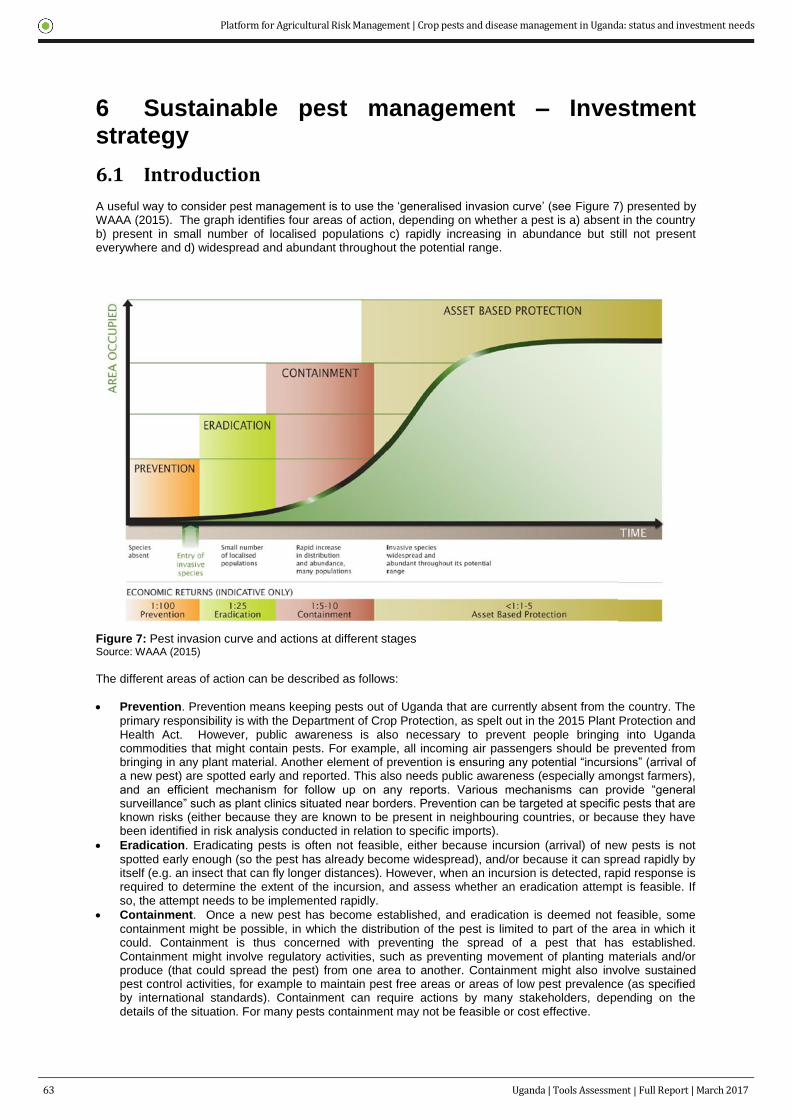
Platform for Agricultural Risk Management | Crop pests and disease management in Uganda: status and investment needs
63 Uganda | Tools Assessment | Full Report | March 2017
6 Sustainable pest management – Investment strategy
6.1 Introduction
A useful way to consider pest management is to use the ‘generalised invasion curve’ (see Figure 7) presented by WAAA (2015). The graph identifies four areas of action, depending on whether a pest is a) absent in the country b) present in small number of localised populations c) rapidly increasing in abundance but still not present everywhere and d) widespread and abundant throughout the potential range.
Figure 7: Pest invasion curve and actions at different stages Source: WAAA (2015)
The different areas of action can be described as follows:
Prevention. Prevention means keeping pests out of Uganda that are currently absent from the country. The
primary responsibility is with the Department of Crop Protection, as spelt out in the 2015 Plant Protection and Health Act. However, public awareness is also necessary to prevent people bringing into Uganda commodities that might contain pests. For example, all incoming air passengers should be prevented from bringing in any plant material. Another element of prevention is ensuring any potential “incursions” (arrival of a new pest) are spotted early and reported. This also needs public awareness (especially amongst farmers), and an efficient mechanism for follow up on any reports. Various mechanisms can provide “general surveillance” such as plant clinics situated near borders. Prevention can be targeted at specific pests that are known risks (either because they are known to be present in neighbouring countries, or because they have been identified in risk analysis conducted in relation to specific imports).
Eradication. Eradicating pests is often not feasible, either because incursion (arrival) of new pests is not
spotted early enough (so the pest has already become widespread), and/or because it can spread rapidly by itself (e.g. an insect that can fly longer distances). However, when an incursion is detected, rapid response is required to determine the extent of the incursion, and assess whether an eradication attempt is feasible. If so, the attempt needs to be implemented rapidly.
Containment. Once a new pest has become established, and eradication is deemed not feasible, some
containment might be possible, in which the distribution of the pest is limited to part of the area in which it could. Containment is thus concerned with preventing the spread of a pest that has established. Containment might involve regulatory activities, such as preventing movement of planting materials and/or produce (that could spread the pest) from one area to another. Containment might also involve sustained pest control activities, for example to maintain pest free areas or areas of low pest prevalence (as specified by international standards). Containment can require actions by many stakeholders, depending on the details of the situation. For many pests containment may not be feasible or cost effective.

Platfo
rm fo
r Agricu
ltural R
isk M
anagem
ent | C
rop
pests an
d d
isease man
agemen
t in U
gand
a: status an
d in
vestmen
t need
s
Platform for Agricultural Risk Management | Crop pests and disease management in Uganda: status and investment needs
Uganda | Tools Assessment | Full Report | March 2017 64
Asset based protection (farm level management including prevention and control). Many pests will be
present in a country in all the areas that are suitable for them. In most cases there will be little or no practical prospect or economic justification for attempting to create pest free areas, so the main strategy is to control them and prevent crop losses (asset based protection). The responsibility for this generally falls with the owner of the crop (or natural resource), but often they will need advice on how to do this. Agricultural extension is the role of local government, though advice may be received from and through many other sources including NGOs and mass media. As shown in the problem tree, there are multiple problems that mean farmers are unable to effectively manage the pests on their farms
Of the priority pests listed in table 2 most are at the control stage, except for BXW, Tuta Absoluta, certain species of fruit fly and of ralstonia that merit containment action.
Conceptualising the issues in this way is useful and aligns with the problem trees presented in section 2 that identifies two principal causes that contribute to the main problem of pests not being effectively controlled. The first is that new pests spread (from one country to another and within the country). This is the stage where DCP intervention is critical and action is needed to prevent, eradicate and contain pests. Recommendations to develop a strategy are presented in section 6.2. The second is that there is poor management at farm, or household level attributed to inadequate farmer knowledge on management practices, lack of practical solutions or lack of access to quality inputs (seed and pesticides). Once pests are widespread and abundant throughout their potential range – then the main responsibility for pest management lies at farmer level and the main responsibility of DCP shifts from direct action to detect and prevent spread, to supporting service provision – particularly regulation of pesticides and seed certification. DCP also has a role in taking responsibility for solutions as well as diagnosis – working together with NARO and the extension personnel. Recommendations will be presented in section 6.3. Table 15 illustrates the shifting responsibility of stakeholders as action shifts from prevention to control.
Table 15: Roles of key stakeholder groups in implementing actions from prevention to control and costs incurred
by the different groups Action or Strategy
Key stakeholders Occurrence Costs
DCP Local Gov’t Farmers, Traders, Transporters
Prevention Lead role as per 2015 Act. Border controls, inspections, specific surveillance.
General surveillance; reporting of possible incursions
General surveillance; reporting of possible incursions; compliance with biosecurity regulations
Continuous Mainly government Farmers
Eradication Lead role as per Act. Border controls, inspections.
Participate in eradication. Might share costs.
Possible compulsory actions
Rare, but high intensity when attempted
Mainly government. Maybe some local government or private sector contribution – ideally as per a pre-agreed plan
Containment Lead coordination role; sometimes implementation
Major role in local implementation, depending on specific details; enforcing (making) regulations
Major role in complying with containment procedures
Uncommon, but might require sustained and moderately intense activity
Central or local government; farmers cost of compliance with any regulations
Control Regulation of inputs; monitoring overall plant health situation; plant health strategy; coordination of stakeholders; occasionally major role if area-wide control method used (eg Sterile insect technique for fruit flies), or major outbreak such as armyworm.
Major provider of advice to farmers. Monitoring local situation. Enforcement of regulations on inputs.
On-farm decision making and implementation. Compliance with regulations and standards for inputs and material movement.
Continuous Mainly farmers, unless area-wide approach.
Source: Adapted from ASDP 2015/16 to 2019/20
6.2 Intervention areas The GoU, under the ASSP took the commodity-based approach as a cost-effective way to spur and realise agricultural production and productivity in the medium term. Among the selected priority commodities, nine are crops - bananas, beans, cassava, coffee, cotton, fruits & vegetables, Irish potatoes, maize, rice and tea. These commodities are also designated to each production zone. Agricultural planning and investment is therefore based on the priority commodity crops. Based on this, it’s logical to tailor pest management investment to the priority crops, but keeping in mind the need to monitor and respond to any pest outbreaks affecting other crops, including potential migratory pests such as quelea birds. Participation of other stakeholders in pest management will also vary depending on the value chain, economic importance of the value chain, trade value, geographical location, and pest risk. Table 16 shows the production and market arrangements of the key value chains that informs the nature of stakeholders to engage in pest management.

65 Uganda | Tools Assessment | Full Report | March 2017
Platform for Agricultural Risk Management | Crop pests and disease management in Uganda: status and investment needs
Ta
ble
16
: P
rio
rity
cro
ps u
nde
r th
e A
SS
P,
the
ir p
rodu
ctio
n a
nd
ma
rke
t a
rra
ng
em
en
ts a
nd
key s
takeh
old
ers
C
rop
P
rod
uct
ion
o
bje
ctiv
e K
ey p
rod
uct
ion
are
as
Pro
du
ctio
n 2
015
ton
s T
arg
et 2
019
ton
s V
alu
e ch
ain
o
rgan
izat
ion
20
15/1
6 E
xpo
rt
valu
e m
illio
n U
S$
Tar
get
201
9/20
m
illio
n U
S$
Key
sta
keh
old
ers
Pes
t ri
sk
Ban
ana
Foo
d se
curit
y / c
ash
Sou
th w
este
rn fa
rm la
nds
5,
493,
600
13,0
00,0
00
Mai
nly
info
rmal
, in
tern
al
0.83
3.
17
SH
gro
wer
s, lo
cal
trad
ers
Hig
h
Bea
ns
Foo
d se
curit
y N
orth
wes
tern
sav
anna
gr
assl
ands
1,01
1,00
0 10
,000
,000
In
form
al, i
nter
nal
51.8
2 (in
cl.
legu
mes
) 62
.98
(incl
. le
gum
es)
SH
gro
wer
s M
ediu
m
Cas
sava
F
ood
secu
rity
N
orth
eas
tern
dry
land
s,
and
sava
nnah
gra
ssla
nds
2,92
5,20
8 3,
579,
800
Lim
ited/
none
S
H g
row
ers
Hig
h
Cof
fee
Cas
h N
orth
wes
tern
, Lak
e V
icto
ria c
resc
ent,
mid
-w
este
rn, s
outh
wes
tern
an
d hi
ghla
nd r
ange
s
254,
246
595,
890
Org
aniz
ed, m
ainl
y ex
port
57
7.70
1,
153.
50
UC
DA
, Cof
fee
coop
erat
ives
, SH
gr
ower
s, p
lant
atio
ns,
expo
rt tr
ader
s
Hig
h
Cot
ton
Cas
h K
yoga
pla
ins,
wes
tern
sa
vann
ah
22,4
58
64,7
50
Org
aniz
ed, m
ainl
y ex
port
84
.00
355.
51
CD
O, e
xpor
t tra
ders
H
igh
Citr
us
Cas
h
Kyo
ga p
lain
s
Mix
ed in
tern
al a
nd
expo
rt
32.7
0
(fru
it an
d ve
geta
bles
)
102.
40
(fru
it an
d ve
geta
bles
)
SH
farm
ers,
exp
ort
trad
ers
Hig
h
Man
go
Cas
h
Kyo
ga p
lain
s
M
ixed
inte
rnal
and
ex
port
S
H fa
rmer
s, e
xpor
t tr
ader
s H
igh
Tom
ato
C
ash
L.
Vic
toria
cre
scen
t, m
id-
wes
tern
sav
anna
h
Mai
nly
info
rmal
, in
tern
al
SH
gro
wer
s, lo
cal
trad
ers
Hig
h
Cap
sicu
m
pepp
er
Cas
h
L. V
icto
ria c
resc
ent,
mid
-w
este
rn s
avan
nah
Mai
nly
expo
rt
0.80
3.
07
SH
farm
ers,
exp
ort
trad
ers
Hig
h
Iris
h po
tato
es
Foo
d an
d ca
sh
Hig
hlan
d ra
nges
, Nor
th
wes
tern
sav
anna
gr
assl
ands
Mai
nly
info
rmal
, in
tern
al
SH
gro
wer
s, lo
cal
trad
ers
Hig
h
Mai
ze
Foo
d se
curit
y / c
ash
Kyo
ga p
lain
s, w
este
rn
sava
nnah
3,
513,
300
10,0
00,0
00
Org
aniz
ed, m
ainl
y in
tern
al
55.9
0 10
5.40
S
H g
row
ers,
ag
greg
ator
s, m
iller
s,
loca
l tra
ders
, exp
ort
trad
ers
Med
ium

Platform for Agricultural Risk Management | Crop pests and disease management in Uganda: status and investment needs
Uganda | Tools Assessment | Full Report | March 2017 66
6.3 Investment plan
The proposed investment plan takes into cognizance the existing plans and efforts by MAAIF to address pest problems in the country. As such, the plan focuses on areas deemed key for investment in the medium term to ensure establishment of sustainable pest management systems.
6.3.1 Goal
The goal of this investment plan is: Crop losses due to pests and diseases reduced, leading to increased production and productivity of key crops, and increased household level incomes for smallholder farmers. This will directly contribute to ASSP priority areas 1 and 2.
6.3.2 Development Objective
In the medium term, the investment plan aims to strengthen capacity of agricultural institutions to establish sustainable pest management systems and structures for effective pest management. This includes the policies, frameworks and coordination mechanisms used by institutions to inform actions to reduce crop losses.
6.3.3 Strategic Outcomes
The proposed investment plan is presented as a set of outputs and activities under three components or strategic outcomes – though it should be noted that output 1.3 contributes to both monitoring plant pests and delivery of pest management services:
1. Cost-efficient information systems to detect and monitor plant pests and diseases established, providing timely information to MAAIF (and other relevant stakeholders) to effectively respond to pest situations;
2. Improved access to pest management services by smallholder farmers and other value chain actors to effectively manage plant pests and diseases;
3. Strengthened capacity of MAAIF (and other relevant stakeholders) to monitor, analyse and combat the threat of plant pests and diseases.
Strategic Outcome 1: Effective pest information system established
This strategic outcome covers activities that largely address root causes contributing to the introduction and spread of new pests. Although it should be noted that capacity development of a network of plant doctors running plant clinics provides at the same both a mechanism for pest monitoring and to deliver advisory services. For pests that are still not abundant and widespread within their potential range, actions are needed to eradicate or contain them, where detected. This component also proposes that contingency funds are set aside to cover costs of eradication or containment as well as to provide support to managing outbreaks of specific pests seen as requiring collective action. Three priority interventions are proposed under this outcome;
1.1 Emergency response plans operationalized, 1.2 Effective pest monitoring at borders points decreasing risk of new pest incursions and, 1.3 Pest surveillance system established providing early warning [and advisory services].
Strategic Outcome 2: Improved access to pest management services This outcome covers activities that address the root causes of poor farm level management described in section 2.3.2. Considerations are also made to ensure promotion of sustainable models to reach out to farmers with pest management services. Two priority interventions are proposed;
2.1 Improved farmer awareness of pest and disease management 2.2 Improved access to high quality inputs (crop protection products and seed)
Strategic Outcome 3: Strengthened capacity to monitor and combat pests and diseases The IPPC defines national phytosanitary as “The ability of individuals, organizations and systems of a country to perform functions effectively and sustainably in order to protect plants and plant products from pests and to facilitate trade, in accordance with the IPPC”. This is based on more general definitions of capacity developed by UNDP and OECD, which high-light that capacity has many facets, and is much more than the knowledge and skills of individuals (e.g. Land et al. 2009). In the proposed capacity development activities, we therefore recommend that the above factors are taken into consideration, including the use of capacity diagnostics. The main focus of capacity development recommended here is in relation to monitoring and combating pests and diseases as described in the previous two sections, including implementation of a pest information system. As DCP is also mandated to regulate various inputs important in pest management, we recommend capacity development in those areas too. DCP staff are not the only ones involved in implementation of the pest information system. Training district and sub-county extension staff to run plant clinics and collect and manage data is also required. Based on this, two priority intervention areas are proposed;
3.1 Department of Crop Protection structure reviewed and staff trained 3.2 Improved infrastructure for pest and disease management

Platform for Agricultural Risk Management | Crop pests and disease management in Uganda: status and investment needs
67 Uganda | Tools Assessment | Full Report | March 2017
6.3.4 Priority interventions and cost implications
It is proposed that a Program Management Unit be established to coordinate activities and support monitoring and evaluation. Three staff are suggested – a senior individual to provide overall leadership and coordination plus two more junior staff to support oversight and administrative requirements. Coordination will include the development and implementation of appropriate processes and practices for monitoring and evaluation (M&E). Processes are not elaborated in the current document – but would need to be designed to answer the following evaluation questions: Is the program doing what it expected to do? Are these the right things? Are they making any difference and delivering expected outcomes and impacts? Feedback loops to ensure that lessons learnt are fed back into implementation through adaptation and adjustment of planned approaches will be essential.
Costs required: Staff costs and operational costs including a travel budget for travel allowances, vehicles and vehicle running costs and office set-up and maintenance. A lump sum of 10% of total program cost is included in the budget to allow for monitoring and evaluation.
Strategic Outcome 1: Effective pest information system established
Output 1.1: Emergency response plans operationalised
Section 3.1.4 highlighted a provision in the Plant Protection and Health act for appointment of a Plant Protection and Health Technical Committee to advise the Minister of Agriculture in a number of areas including emergency response. It is proposed that investments build on this committee, bringing in additional private sector and civi l society participation as needed (the Act provides for the committee to co-opt members as it sees fit). One key role for the committee would be in overseeing the development and implementation of emergency response plans.
A1.1.1: Operationalise the plant protection and health technical committee: The Plant Protection and
Health Act 2015 establishes this committee to advise the Minister on “all technicalities arising from the administration of the Act, and on any other related issues”. It is thus proposed that this committee becomes the apex coordinating committee for plant protection in Uganda, and its effective operationalization is therefore a high priority. The committee should meet regularly (e.g. quarterly) to over-see development of plans and strategies developed by its appointed sub-committees tackling specific tasks, including those described below. Thus a key role for the committee would be priority setting, which needs to take place with involvement of stakeholders and needs to be an on-going process rather than a one-off activity. Section 3.2.3 used the example of the floriculture sector to demonstrate the value of private sector involvement in priority setting – though highlighted that the greater number of stakeholders involved in priority value chains is likely to mean that priority setting and collaborative action is likely to be a more complex process.
Costs required: Travel and allowances for quarterly working group meetings in year 1 &2 and biannually in years 3-5 – 17 individuals, assumed to be based in Kampala
A1.1.2: Develop and operationalize pest emergency response plans: Under strategic action 6 (control diseases pests and vectors) of priority area 2 (Improving Access To Critical Farm Inputs) in the ASDP, operationalization of the Emergency Preparedness Plans (EPP) is referenced. A sub-committee would be established to review and update the overall plan for responding to pest emergencies, however they might arise as well as a set of pest specific plans for priority pests. Pest specific plans will include pest risk, likelihood of pest occurrence, response options, responsibilities and resources required. These plans should consider endemic, introduced as well as migratory pests. The sub-committee would be led by DCP with input from public and private stakeholders. Technical experts and local or international consultants would analyse economic as well as biological data and integrate recommendations from sector specific sub-committees (A1.1.3) that would ensure involvement of representatives of private sector industries. District and other staff needed to implement the plan would also be represented. Response choices will not be the same irrespective of the crop affected or the pest identified. For example, the cost of maintaining a pest free area might be justifiable if it supports a high value export crop, but not for a lower value staple.
The plan would describe actions to be taken in response to observations of new pests or outbreaks of existing ones. While not providing the level of detail to be found in the crop sector-specific plans (A1.1.3) key elements will be roles and responsibilities of different stakeholders (including the private sector), and financial responsibility for the actions to be taken under different circumstances. Certain pest species that are already present but known to cause major damage during outbreaks may require collective and rapid action to support individual actions by smallholder farmers.
Costs required: Travel and allowances for quarterly sub-committee meetings in year 1 and 2 and costs of a lead consultant to lead plan preparation. Annual meetings in years 3-5, to review plans and reassess key risks. Sub-committee to consist of appx 10 individuals

Platform for Agricultural Risk Management | Crop pests and disease management in Uganda: status and investment needs
Uganda | Tools Assessment | Full Report | March 2017 68
A1.1.3: Development of sector specific prevention strategies for high risk commodities: For the four high risk priority crops (banana, cassava, cotton, coffee, fruits and vegetables) sector sub-committees need to be established with a view to deliver prevention strategies by the end of year 1. In year 2, sub-committees for other crops where risk is lower but still important would be established (e.g. maize and beans) Stakeholder involvement would vary depending on the nature of the value-chain (see table 15). The plans would be based on the generic plan, but provide as much detail as possible for the particular sector, highlighting specific risks where known (see activity 1.2.1), and how they will be addressed (including pests already present, as well as those known from elsewhere that could be introduced). The plans would specify investments in actions to eradicate, contain and control, including expected private sector contributions where organised private sector involvement is high. Where there is a high level of public good, such as where the main production base consists of smallholder farmers and where private sector involvement is less organized (e.g. banana or cassava), investments in responses are likely to be primarily by the government, whereas actions for crops such as coffee, cotton and maize would be expected to involve greater private-public sector partnership.
Costs required: Travel and allowances for quarterly sub-committee meetings for 5 sectors in year 1 to lead preparation of sector-specific strategies aligned with the emergency response plan. Another 3 sector sub-committees meet quarterly in year 2. Annual meetings for each sector once sector strategies developed to review plans and reassess key risks. Sub-committees to consist of appx 20 individuals. Sector expert to provide technical assistance to each sub-committee for 20 days in first year of sub-committee and 5 days a year thereafter.
Output 1.2: Effective pest monitoring at border points decreasing risk of new pest incursions
Some insect pests may gradually spread by themselves as they move across a landscape – some vector borne diseases can spread in a similar way. Another principal cause of new introductions is through movement of produce – including seed across borders (see section 2.3.1). Strengthening monitoring at border points is a first line of defense in prevention of new pests. Border points include both the land borders with neighbouring countries, and international ports such as Entebbe Airport.
A1.2.1: Risk analysis: Pest risk analysis assesses the likelihood of a pest entering a country, and the
consequences if it did. It thus provides the basis for identifying and prioritizing risk management activities, including import controls and border inspections. Often pest risk analysis is conducted when a new request is made to import a commodity (representing a new potential pathway of introduction), or when a new pest has been reported in a neighbouring country or trading partner, so is a new risk. This is the function of the NPPO (DCP). Risk analyses will be conducted for the high priority value chains where the consequence of a new pest introduction would be most serious.
However, risk-based approaches can also be adopted more generally to allocate risk management resources, such as allocating staff and effort between different border posts. Currently there are 30 gazetted border points and around 15 ungazetted border points where produce is moved. With a limited number of staff, it is appropriate to deploy staff where the risks are greatest. And at particular border posts, risk-based approaches should be used in guiding which consignments to inspect, and what types of pest to check for. Under the auspices of the plant protection and health technical committee, these various risk analyses will be conducted. The information gathered and analyses undertaken will inform subsequent investments in establishing DCP presence to monitor movements and check for quarantine pests. The study would identify which are the key posts to be staffed, likely to be influenced by assessing the principal trade routes for priority value chains, volume of produce movement and highest risk crops/pests. For example, it might be that the main border to manage effectively is the international airport, where people bring commodities from distant countries, while at land borders, with large amounts of informal trade and the possibility of natural pest spread, risk management might give less return on investment. There is certainly scope for increasing controls at Entebbe, though the benefit of this needs to be demonstrated by analysis. Complementary studies providing a greater level of detail for each value chain where a detailed response plan is to be developed will also be carried out.
Costs required: Costs of an initial study to be implemented by a consultant and DCP, to deliver a report to inform subsequent border risk management activities. Costs of follow up studies and analyses for the priority value chains – a total of 8 sectoral studies will take place in years 1-3, starting with banana, coffees, cassava and cotton.
A1.2.2: Re-establish DCP presence at gazetted border posts: Currently only 5 of the gazetted border posts are manned with DCP staff. Investments should be made to recruit, train and deploy new inspectors. A phased roll-out would initiate staff deployment at posts prioritized based on analysis of data collected in activity 1.2.1.
Costs required: The budget assumes that an inspector would be recruited for at least 25 border posts by year 4. Costs for new staff and training are provided for under Outcome 3 (see activity 3.1.3).
A1.2.3: Development of guidelines and materials to raise awareness of both public and border staff on pest risks. As the general public probably represents a high risk pathway for pest introduction, investment in

Platform for Agricultural Risk Management | Crop pests and disease management in Uganda: status and investment needs
69 Uganda | Tools Assessment | Full Report | March 2017
development of public awareness materials is required. While DCP staff will receive technical training other border agency staff (especially Uganda Revenue Authority) also need to be aware so that where there are few or no DCP staff, some risk management can still be undertaken. Materials and guidelines for other border agencies are therefore required, to ensure they are aware of the risks, understand the role of DCP, and know what role they can play in monitoring and/or inspecting people and consignments crossing borders.
Costs required: a) Costs of 6 workshops to be held with sub-groups of border post in years 2 and 3 (three per year) to discuss and agree appropriate working practices and then review and amend approaches; b) Costs of a local expert / consultant to facilitate the workshop and process, visiting border posts over the course of a year to identify challenges etc. c) Costs of two communications write-shops (to both train staff and draft materials) d) plus design and development of materials e) printing and distribution of information materials.
Output 1.3: Pest surveillance systems established providing early warning
The Framework implementation plan (FIP) for statistics and risk management (MAAIF, 2015b) recommends a national steering committee on agricultural risk management (ARM-NSC) involving stakeholders and the ARM unit to coordinate tasks designed to streamline collection and use of agricultural data. The FIP also mentions that the agricultural reporting service (where District staff take responsibility for collecting statistics) is to be reinstated. Data to spot pest outbreaks or emerging pests and estimate spread can potentially be collected by many different individuals engaged at ground level – from field extension officers, other private and public agricultural service providers to individual farmers or the general public. The system to be developed will need to be able to integrate data from different stakeholder groups collected and shared in different formats. It is proposed that a working group is established that reports to both the ARM-NSC and the plant protection and health committee (A1.1.1). Both committees will have over-sight and inputs into designing a system to collect, manage and use data. A system will be needed that can integrate data from different sources. As well as this “general surveillance”, specific surveys are also needed to collect data in a more structured manner.
As explained in section 4.2.2, plant clinics represent an approach that – in terms of delivering advisory services are expected to perform well alongside other approaches and have the added advantage of collecting data that can be used for different purposes including contributing to early warning if they are well placed. We propose a scale-up of clinics that aligns well with MAAIF plans for district staff to take greater responsibility for agricultural data collection. It is also proposed that other ICT based data collection tools mentioned in section 5 are leveraged such as; an electronic system used by veterinary authorities to report livestock disease outbreaks and; a youth chat-group U-report used to track cases of BXW and share information on management. However it is also important that actions are taken to develop a system that can integrate data from different sources that are delivered in different formats.
A1.3.1: Establish a working group to develop a pest information management system for early warning and household level data: A sub-committee or working group would be established reporting to both the Plant protection and health committee (A1.1.1) and the ARM-NSC and ARM unit. The group would include representatives of the Department of Planning and Statistics, DCP and ARM as well as invited participants from: national and international groups using ICT; representatives of district and national staff likely to play an important role in data collection and with interest in data to inform their work e.g. directorate of extension, district and zonal staff and; private sector representatives to ensure that the system facilitates their contribution to monitoring and reporting.
Costs required: Quarterly meetings in years 1 and 2; biannual in year 3 and annual meetings subsequently.
A1.3.2: Establish a network of plant health clinics: The ASDP (MAAIF, 2015b) refers to use of plant clinics to contribute to advisory services (priority area 1, strategic action 2 - see A2.1.1) and “to provide timely feedback.. on emerging pests and diseases” under strategic action 6 (control diseases, pests and vectors) of priority 2 (improving access to critical farm inputs). A staged scaling up of clinics is proposed, following a set of priorities identified by the working group in (A1.3.1). It is proposed that a clinic be sited in areas of intensive crop production in each sub-county in all districts where crop production is important – estimated as around 100 of the 116 districts. This would exclude Northern drier regions where crop production is limited – as clinics in areas where cassava is grown would also be relevant. This would mean establishment of around 1203 clinics in a phased manner over 4 years. Each clinic would be run twice a month by extension officers trained as plant doctors rotating around a number of locations within their mandate area. At least 1 sub-county extension officer per sub-county would undergo two short training modules teaching field diagnosis; how to give actionable recommendations and; how to run plant clinics. A separate course in monitoring plant clinic performance would also be taught. District staff would also be trained to supervise establishment and running of clinics. Key partners to support training include higher agricultural trainings institutions (e.g. Makerere University, Uganda Christian University, Uganda Martyrs University and National Agricultural Colleges). Backstopping by international consultants from CABI would also support roll-out in early years. Plant clinics would be included in job descriptions as part of the duties of field extension officers, but once trained would represent 2 days of their time per month.

Platform for Agricultural Risk Management | Crop pests and disease management in Uganda: status and investment needs
Uganda | Tools Assessment | Full Report | March 2017 70
Costs required: a) Training extension officers in all sub-counties in plant clinic modules to diagnose pests, make recommendations, use data management system and monitor plant clinic performance b) Providing basic set-up materials for clinics (table, chairs, umbrella, knife, information materials, magnifying glass etc.). c) Providing allowances for staff to travel to clinics (with their clinic materials) Appx once a fortnight – allow for 20 days/year. d) Technical support to plan rollout and backstop training
A1.3.3: Design and build a pest information system a) to collect and manage pest monitoring data: To be able to collect and manage pest data effectively an organized system is needed. It is assumed that the ARM-NSC will be developing an information system to serve multiple needs of the agricultural sector. It is recommended that the sub-committee or working group established in A1.3.1 oversees the design, building and piloting of data collection tools and a data management system serving as a pest early warning system.
The pest early warning system would be complementary to other databases and tools being developed. The system should allow data to be collected from different sources (extension staff, village-based intermediaries, public etc.) both in an ad-hoc manner and through regular sessions of plant clinics (see A1.3.2) and entered into a common database. The Plantwise data collection system could serve as a starting point to customize a system for Uganda, integrated into government systems. Issues to consider in designing the system would include:
identify a minimum data set that can easily be collected both during clinics and in day to day work of extension staff
incorporate capacity to manage additional data that may be relevant to delivery of advisory services but not to a pest warning
start with consideration of standards and interoperability –with consistent fields used in data base structures and controlled vocabularies
penetration of smart phones in rural communities remains low therefore, although extension staff are more likely to own smartphones or can be provided with tablets; crowd-sourced data from other actors e.g. farmers is most likely to come from SMS and IVR channels and therefore not georeferenced. The value of crowd-sourced data is in its spatial data but high levels of effort are needed if location is not automated and relies on place names
pre-existing systems where they exist – depending on what is popular in the country. An observation in Uganda is that plant doctors already use WhatsApp networks to share information and photos to seek assistance in diagnosis. If this is a common service used by agricultural staff across Uganda this may be a good option
quality assurance processes would be integrated into the system and automated data cleaning and processing steps included
A data collection and management system requires both human and ICT actions. Data collection processes should follow the decentralized system with district staff supervising sub-county extension officers and MAAIF supervising DAOs. Systems would allow querying of data at district/zonal and national level, with agreements being made around access to potentially sensitive data. It would need to be recognised that different stakeholders would have interests in different parts of the database, so effective processes to allow different individuals to query data in different ways would be needed. A staged process would be needed to pilot, evaluate and review systems.
An important consideration in designing the system is to ensure appropriate incentives are in place for different stakeholders to play their part. This may mean ensuring data collection is not time consuming or cumbersome for those that have to collect it, and organizations responsible for data collection have access and can easily use data for their own purposes. That data collection is included in performance contracts / job descriptions.
Costs required: It is assumed that the basic IT infrastructure exists or is being acquired as part of the strategy in the Department of Planning and statistics to increasingly use ICT tools to support data collection. Costs proposed are focused on the pest information system that will include capacity to: manage data on symptoms, diagnosis and recommendations collected at clinics and through other interactions. Links to the World Bank investments to build an ICT-based Agricultural information platform (AIP) should be explored and development of duplicate or competing platforms avoided:
Consultants to design the system and manage stakeholder consultations during build and piloting
IT developers to build the software – costs can be high – an estimated cost of 700,000 is used in the budget with 70,000 estimated as annual running costs
Training district and ZARDI staff to manage the system
Training MAAIF users of the pest information system
System maintenance, data analysis and reporting
Validation workshops to validate sub-sample of data collected (for M&E)
Travel and allowances for meetings with stakeholders

Platform for Agricultural Risk Management | Crop pests and disease management in Uganda: status and investment needs
71 Uganda | Tools Assessment | Full Report | March 2017
A1.3.4: Equip all district agricultural officers and sub-county extension staff with tablets and tools: All crop extension officers operating at sub-county level and DAOs involved in supervision should be allocated a tablet to facilitate their participation in data collection - loaded with a set of data collection and communication tools. Use of tablets would allow ease of communication within and between administrative levels (national, zonal, district, sub-county). Other available tools such as access to pest information including diagnostic support and recommendations for management could be loaded on to tablets as well as content related to other responsibilities of extension officers.
Costs required: Purchase of tablets for 1,500 sub-county extension staff and another 500 staff from each district and zone – rolled out over 3 years. Cost of basic airtime annually
A1.3.5: Respond to early warning of pest outbreaks - Implement specific surveys and pest surveillance: Where a new pest or pest outbreak is detected, specific surveys are needed to confirm the occurrence and ascertain actual distribution. Funds should be set aside to fund such surveys – according to priority setting and pest specific action plans. Such surveys need to be led/coordinated by DCP, although other stakeholders such as universities, research organizations may contribute. New crowd-sourcing approaches that capitalize on the increasing use of smart phones and ICT infrastructure could be considered, for example U-report. A bespoke system would also be established that requests feedback from sub-county extension staff. It is assumed that on average 6 specific surveys would be required each year – for example to evaluate the extent of a new outbreak, to implement a de-limiting survey to assess the extent of new pest distributions etc. Information from the early warning and specific surveys will be used to inform responses.
Costs required: It is recommended that 60,000 USD is set aside each year to cover the costs of specific surveys to establish extent and distribution of outbreaks.
A1.3.6: Respond to early warning of pest outbreaks – contingency to eradicate, or contain: Although rare,
in some cases there may be a good case for eradication or containment of high risk pests. The Plant Protection and Health Technical Committee (or its nominated sub-committee) would collect and review evidence, and make a decision on whether to attempt eradication or not, according to the emergency plan. An estimated contingency of 100,000 USD is proposed to be set aside that can be rolled over from year to year if not used.
Costs required: 100K to be allocated as a contingency fund in years 1 and 3 assuming that it is unlikely to be used every year.
A1.3.7: Respond to early warning of pest outbreaks – management in selected cases: Although new pest incursions and spread of pests within a country poses a high risk requiring prevention, eradication or containment responses– the majority of key pests identified are already abundant and widespread throughout their potential range. In this case, farmers must take the main responsibility for actions to control pests, although in a few specific cases there may be a role for local or national government in control. For example, for economically important value chains, particularly where pest management methods require collective action over a wide area, government intervention is justified. An example is BXW, where it is important that all farmers in an area employ a range of recommended cultural control methods to avoid spread and rapid reinfection from farmers where control does not take place. Another example of an outbreak in citrus plantations in Eastern Uganda is given in box 6.1.
Costs required: In the ASSP budget there is already provision for investments in management of banana bacterial wilt and coffee pests (coffee export has the highest value of all export crops in Uganda) additional contingency of $100K is proposed for other crops
Box 9: DCP involvement in management of a pest affecting a gazetted value chain Citrus leaf and fruit spot (CLFS) is an endemic fungal disease in the Teso region of Uganda. Farmers were not too concerned about the disease during times when orange production was not a major enterprise. Following gazetting of citrus as a key value chain for the region, large numbers of farmers invested in citrus production and the disease started to become a problem. In 2011, local government extension staff running plant clinics in Eastern Uganda observed large numbers of farmers bringing the problem to the clinics. DCP staff sent samples to the CABI laboratory in UK where the fungi was confirmed and DCP responded rapidly, procuring chemicals distributed to farmers for spraying through local government extension staff. Raising awareness of CLFS continues to be a part of plant health rallies and community awareness campaigns in the TESO region. Source: J Mulema, Personal Communication
A1.3.8: Develop systems for regional co-operation: Improved cooperation and coordination with other countries is also key for managing pests across borders. This cooperation is already spelled under the new EAC

Platform for Agricultural Risk Management | Crop pests and disease management in Uganda: status and investment needs
Uganda | Tools Assessment | Full Report | March 2017 72
SPS protocol (which Uganda has already ratified). Uganda is also a member of the Desert Locust Control Organization for Eastern and Southern Africa (DLCO-EA), which addresses several migratory pests, including desert locusts, armyworm and quelea bird. The role of DCP is to ensure that timely surveillance is done to inform actions by these bodies. There is also need to designate staff responsible for managing these regional links.
Costs required: Routine surveillance costs assumed to be already covered
A1.3.9: Build capacity of research It was noted that improved research capacity was needed and creation of linkages to international organizations. However, this is already proposed and costed under the ASSP
Costs required: Under ASSP
Strategic Outcome 2: Improved access to pest management services Output 2.1: Improved farmer awareness of pest and disease management The ASDP refers to strengthening the use of current dissemination pathways including “mass [media], print and online media; joint ICT applications; scientific publications and conferences, plant clinics, demonstration sites, trade shows and exhibitions; and the farmer field school approach (FFS)” (MAAIF, 2015b). As described in section 4, there is no “one-size fits all” approach to raising awareness. Combinations of approaches are needed depending on various factors as explained in section 4.5 and a mix of stakeholders need to be involved. Currently MAAIF is investing in increasing numbers of extension staff across the country in a single spine extension system with a total of 3000 by the end of 2016 (also see section 3.2.7. With an estimated number of farming households of 5.86 million
3, this means each extension officer will have responsibility for approx. 2,000 families. This means
that while field extension officers will be key in providing services, they will still have a limited capacity to reach all farmers. In discussions with stakeholders we estimate that around 50% of extension time is spent on organized extension activities – 110 days if it is assumed that the working year involved 220 working days. If they spent all 110 days using a single approach – by using extension agent visits, FFS, plant clinics, farmer field days or plant health rallies, they would reach approx. 1500, 162, 1430, 1870 or 8250 farmers
4 - with greater depth and breadth
of knowledge being shared where fewer farmers are reached. We would recommend that extension implement a range of new and existing approaches into their working practices according to table 17 below. Table 17: Recommended time allocation to different interpersonal extension methods
Activity # of days # farmers reached
Rationale
Group training 44 600 Already an integrated part of practice. Usually 20-30 farmer groups in a sub-county
Plant clinics 24 312 Numbers reached are not very high and interaction is short. However – respond to farmer demand and have valuable role in contributing to early warning system. Can be planned to specifically target women
Field days 10 170 Field days require organization but are popular to facilitate interactions between farmers and other service providers including input suppliers
Plant health rallies 16 1200 Rallies are a useful way of reaching large numbers rapidly while allowing face-to-face interaction with members of farming families
Backstop other approaches
17 Variable Extension staff can be more effective through backstopping approaches implemented by other service providers e.g. village based intermediaries, providing input to radio,
Other ad hoc activities Response to requests, activities with NGOs, planning meetings, trainings, vaccinations etc.
Total 111 2342
Farmer field schools represent an educational approach - building skills of farmers and capacity to solve problems. In a current proposal before the government of Uganda (MAAIF, 2014), 800,000 USD is included to train farmers’ groups and extension staff in IPM using farmer field schools – with implementation to be contracted out. Therefore, additional FFS are not recommended for this particular investment, although, the interventions proposed are highly complementary to the FFS. Methods in table 17, with the exception perhaps of group training cannot claim to be educational. Inevitably trade-offs have to be made between numbers of farmers reached and knowledge that can be shared in the time available.
For organized value chains such as coffee, tea, cotton - and to some extent maize - value chain approaches that are coordinated by aggregators, cooperatives etc. often incorporate some element of extension delivery, often through village based intermediaries. Extension should work together with such initiatives. Less formal value
3 Figure estimated in January-2015 by CABI staff based on the following figures: a) total population in 2014 of
35.0 million (CIA, 2015); 83.2% of total population living in rural areas (FAO 2014) and average family size in 2011 of 5.1 (ICF International, 2015) 4 Numbers of farmers reached was estimated using the figures in table 4.3 of days of extension staff time
invested (under variable costs) and numbers of farmers reached. This gives an approximate estimate as some methods require more than one extension staff to be involved. It also does not allow for spillover effects
Platform for Agricultural Risk Management | Crop pests and disease management in Uganda: status and investment needs
73 Uganda | Tools Assessment | Full Report | March 2017
chains for crops where much of the production is as staples (such as cassava and banana) rely more heavily on government extension and ICT approaches for these crops may be less sustainable.
As well as investing in mainstreaming some new approaches into working practices of sub-county extension officers, it is recommended that investments are made in additional approaches that capitalize on mass media, initiatives using village based intermediaries (particularly those linked to value chains where intermediaries provide advice and also can deliver other services). Some investment in ICT based services is also recommended. As explained in section 5 currently there are few, if any examples of services that do not still rely on donor investment. However, innovation in this area is rapid and there is potential to link information provision with other services including financial services, input/output brokerage, marketing and weather information, insurance etc.
Information on pests, including diagnostic support and control options is currently held in a number of national and international databases (e.g. databases managed by the CABI Plantwise program, Gutsinda, AGINSBA and Grameen mentioned in section 5. It is also important to consider: methods they use to be most cost effective in reaching farmers; mechanisms to facilitate streamlined interactions with departments such as DCP who do not have extensive presence at the field level and; complementarity of ICT methods that can reach large numbers of farmers and service delivery (including advice) through market driven closed value chains. Activities would include:
A2.1.1: Establish plant clinics: Clinics established that provide services on demand to communities where the clinics are held. See A1.3.2.
Costs required: Costs are covered under A1.3.2 above
A2.1.2: Implement mixed media campaigns: A number of mass media campaigns should be anticipated each year to support information sharing in cases of a new pest or pest outbreak and inform farmers of actions that can be taken to protect their crop – 4 a year is proposed. A mix of methods would be appropriate including radio/TV and mobile or rapid actions at community level such as plant health rallies etc.
Costs required: The following costs should be anticipated for 4 different problems:
Campaign planning and design workshop – bringing together technical and communication experts to develop key messages and develop content relevant for different media
Radio shows – e.g. three 30-minute talks shows, each repeated 3 times with associated jingles sending key messages. Air same program on 4 stations to account for different languages
TV show - prepare a short 7-15 minute video about the problem, how to recognize it, treat it and prevent it.
Costs of 20 plant health rallies to be carried out in key areas affected. Includes travel and allowances – and workshop to plan and implement
Technical assistance to support development and design of content and contract out SMS delivery to appropriate national organizations
A2.1.3: Improve access to information on effect of pests and how to manage them. Section 5.3 highlighted
a number of existing international and national sources of information. Although many sources are in theory open access – in practice databases can be difficult to query without good knowledge of structure. Openness of databases can be increased using Application Program Interfaces (API) which can improve searchability and link relevant content from different open data sources. Using APIs would make it easy for users to access information from multiple source databases can ensure that service providers can easily access information on behalf of farmers – or even farmers themselves.
Costs required: Consultancy to review existing sources of national and international information and plan to establish an open and linked set of databases. Costs would cover stakeholder consultations and IT development time to set up appropriate APIs and build a user interface that can be accessed over the web or via a mobile device.
A2.1.4: Enhance Extension staff skills: From the analysis, it was noted that often extension personnel lack adequate knowledge and skills to effectively advise farmers on pest and disease management especially emerging ones. Similarly, extension personnel may lack practical skills to administer the proposed extension approaches e.g. plant clinics, farmer field days, FFS etc. Refresher trainings for extension personnel particularly focusing on practical extension methods and new knowledge on pests and disease management are proposed. Extension workers should also be trained or oriented on how to use information technology to seek information from established data sources or share information across their networks. The Plantwise e-clinics that are currently in pilot are expected to address this by allowing plant doctor access to a rich database on plant pests and disease to help with diagnosis and recommendations.

Platform for Agricultural Risk Management | Crop pests and disease management in Uganda: status and investment needs
Uganda | Tools Assessment | Full Report | March 2017 74
Costs required: Practical extension refresher training sessions done at zonal level at least once in 2 years. ZARDIs can facilitate the training sessions, including demonstrations on new pest management approaches, new varieties and agronomic practices. Assume each individual receives training for 4 days and that 2000 are trained over a period of 4 years at a cost of $150/person.
Output 2.2: Improved access to high quality inputs (crop protection products, seed)
Use of inputs in Uganda is low. Although data is not easily available, particularly for pesticides, data from 2005 reported by Roberts and Azzarri (2014) 3.4, 19.2 and 10% of agricultural households used inorganic fertilizer, improved seed and pesticide respectively, with the proportion of households using inputs increasing with increasing wealth categories. There are two key areas for consideration: quality of the inputs and access to inputs by farmers at the right price at the right time. Key inputs impacting on pest management include pesticides and seed. For seed a key issue related to quality is that seed can be a source of transmission of pests, particularly vegetatively propagated material. NAADS is currently responsible for distribution of seed and other inputs – because of difficulty of sourcing good quality clean seed and high farmer demand, in some cases infected materials are used. For counterfeit pesticide and illegal imports the issue is a criminal one with potential personal risks to regulators trying to tackle the problem. A pest management plan developed under the auspices of the Agriculture Cluster Project is currently before the government, with a $4.7 million investment proposed over 5 years.
A2.2.1 Improve quality of pesticides: Activities would include training regulatory officials and police (particularly at border points), extension officers and farmers about the risk of pesticide misuse, how to manage pesticides, the dangers of counterfeit products and how to identify them etc. Awareness campaigns such as those implemented by CropLife would be implemented. However, detailed actions are not considered here as a pest management plan (PMP) is already before government (MAAIF, 2014) to be supported as part of the World Bank ACDP investment (World Bank, 2015). The PMP was designed because of fears about increased use of crop protection products as agricultural productivity increases. The plan therefore focuses on misuse of pesticide including the use of FFS covering principles of pest management and pesticide management and training of agrodealers in safer pesticide management. This work will be highly complementary to the proposed investment and therefore additional investment is not part of the proposed work presented.
Costs required: A total of $4.7 million over 5 years already proposed (MAAIF, 2014) and not included in present proposal.
A2.2.2: Improve quality of seed: A set of activities will take place to address the issue of poor quality seed leading to infected seed being distributed to farmers and at the same time spreading pests. Actions should be implemented together with USTA and link to the Integrated Seed Sector Development work being carried out in Uganda linked to CDI in Netherlands. Activities will also need to be aligned with actions under sub-component 4.2 of the ACDP investment (see section 3.2.8.1) to revise the 2006 Seed Act – including a proposed move to a semi-autonomous and self-sustaining institution complying with International Seed Testing Association (ISTA) and OECD accreditation (seed quality certification including for export) (World Bank, 2015). A combination of actions addressing seed production as well as distribution would include the following:
a) Establish a working group to oversee plans to address seed quality. The working group would meet twice a year and include representatives of the private sector, as well as of those responsible for seed distribution and regulation. Including NAADS, District staff and representatives of DCP. It may be appropriate to create a common group with representatives of the proposed investment and ACDP investment.
b) As explained in section 2.3.4 community based seed production under a Quality Declared Seed label can be used to support delivery of high quality seed for crops where seed supply does not offer high returns for private sector seed companies (e.g. cassava, beans and banana). District staff will be trained to inspect seed locally – initial operational costs of district staff visiting seed producers and of seed testing of the final product will be covered with a view to farmers gradually taking over responsibility for payment for services
c) An awareness raising campaign (using different media as in A2.1.2) would be carried out in year 2 and repeated in year 4 to highlight the importance of using good quality seed and clean planting material. This should include activities with USTA to encourage self-inspection amongst members and development of materials that can be used in seed distribution highlighting how to ensure against counterfeit seed.
d) Develop standards for inspection of vegetatively propagated crops by District and ZARDI staff responsible
for inspections and integrate information on these crops in training of QDS inspectors above.
e) Support strengthening of regulations and standards for material movement, and inspection of planting materials distributed through various programs. DAOs should be capacitated to undertake this role and given mandate to arrest and confiscate suspected material. Piloting of new approaches proposed by the work actions would be undertaken as part of a monitoring of seed quality.
The work is fully costed in the investment plan proposed – however it should be noted that in the ACDP (World Bank, 2015) a $3 million sub-component to build capacity of for policy and regulatory functions includes development of standards for inspection of vegetatively crops as part of a broader package to update the 2006 seed act and associated regulations. The proposed investment plan includes 25K to cover a consultancy to
Platform for Agricultural Risk Management | Crop pests and disease management in Uganda: status and investment needs
75 Uganda | Tools Assessment | Full Report | March 2017
implement this activity. The ACDP also mentions the need for “innovative mechanisms for quality assurance of non-commercial food crop seed including delegated authority for supervision of seed production at the district and/or ZARDI level (World Bank, 2015). This aligns with the concept of QDS seed – though it is not clear in the
ACDP plan exactly what activities will be funded. Costs required: a) Costs of seed regulatory working group to meeting twice a year to plan and review actions. Group of
approximately 30 individuals including representatives from DCP, Local Government, NAADS, private sector seed companies, ISSD staff, farmer organizations etc. Half to come from outside Kampala
b) Training at least 2 staff from each district (approximately 240 staff) together with ZARDI staff (approximately 10 staff) in a series of 12 trainings – 4 in each of years 1, 2 and 3
c) Awareness campaign using same costs for planning and implementation of a range of methods as described in A2.1.2
d) Consultancy to develop standards together with national partners e) Costs of piloting, monitoring, reviewing by working group of new ways of working f) Costs of sampling and testing seed distributed to support consultancy g) Technical assistance to backstop and coordinate actions
Strategic Outcome 3: Strengthened capacity to monitor and combat pests and diseases
Output 3.1: Department of Crop Protection structure reviewed and staff trained
Although steps have been taken to separate The Department for Crop Protection into two departments, the 2015 Plant Protection and Health Act, confers powers on the Commissioner for Crop Protection, as do several of the other legal instruments described above. Making the split would therefore require a major overhaul of the legal documents to reallocate the powers between the two new departments. In the long term there might still be merit in such a split, but for the time being we recommend strengthening the Department with its current mandates.
There might be some benefit in revisiting the internal structure of the Department for Crop Protection. The current structure is reasonable, but some improvements could be most easily made through revising the job descriptions of the principal inspectors. The principal inspector for phytosanitary and quarantine services is currently under the assistant commissioner for certification and regulation, and certainly phytosanitary work involves regulatory activities. However, it also has close connection to the work under diagnostics and epidemiology. Consideration could therefore be given to moving phytosanitary and quarantine services, and at the same time refining the roles of the principal inspectors in that half of the Department.
However, the current structure is based entirely on technical functions, which may in part be because the Department is part of a larger directorate, that can provide other non-technical services. Nevertheless, we recommend that the DCP should have administrative, financial and other non-technical capacity within the Department, dedicated to department functions.
An important part of institutional capacity is the ability to interact effectively with other organizations through various mechanisms. These linkages are critical to the effective performance of an entire system, and in the case of pest management, it is clearly important that DCP has the capacity to convene stakeholders, facilitate multi-stakeholder interactions, provide leadership, and ensure crop protection considerations are included in the work of other organizations where appropriate. For example, DCP has a seat in the proposed ARM task force within MAAIF, allowing pest risks to be addressed in the wider agricultural risk management context. Another key linkage or relationship is between DCP and local government. DCP needs to be seen as legitimate and competent, so that it can effectively provide guidance and direction to local government. Close links with the new Directorate of extension will be essential as many of the tasks rely on effective participation of sub-county extension staff.
We therefore recommend the establishment of 2 new posts. One post would be responsible for negotiating, maintaining partnerships and relationships with the large number of organizations that DCP needs to work with to fulfil its mandate effectively. This would include partnerships within Uganda, but also externally with regional and international partners. The other post (reporting to the first post) would be a communications officer.
As mentioned in section 2.3.1, the DCP departmental structure (presented in figure 4) provides for 70 staff, while currently only 39 posts are filled. Section 2.3.1 noted that of 30 gazetted border posts, only 5 are currently manned and; at a recent meeting of NPPO staff from East Africa – Tanzania was reported to have 165 staff at 36 border posts. A detailed breakdown of current staff in post was not available, but it is suggested that staffing is low and should be increased. A proper capacity needs assessment but should be carried out – but we recommend that all 70 posts be filled and estimate an additional 50 posts be created. The ACDP investment (World Bank, 2015) includes a sub-component including activities to strength capacities of the Phytosanitary and Quarantine Services. Planning for A 1.3.4 and other activities would need to align with plans under ACDP to be complementary.
Platform for Agricultural Risk Management | Crop pests and disease management in Uganda: status and investment needs
Uganda | Tools Assessment | Full Report | March 2017 76
A3.1.1 Apply IPPC diagnostic tool to clarify training needs: IPPC’s Phytosanitary Capacity Evaluation (PCE) tool should be used to assess existing capacity and develop a detailed training plan. IPPC is currently training a number of facilitators who can lead application of the tool, including someone from the Department of Crop Protection who would therefore be well placed to lead the process. Uganda previously used the tool over 10 years ago, so a repeat diagnostic would provide more detail to the sections below.
Costs required: Most of the cost would be for an existing staff member to implement the tool. Additional costs would include travel and allowances to visit laboratories, two 1-2 day workshops and consultancy to support preparation of the final document
A3.1.2 Develop DCP strategy: Based on the outcome of the PCE, DCP would be supported to develop a 5 year strategy covering its various areas of operation. This would not need to be a complicated document, but should set out clearly how it intends to more effectively fulfil its mandate. The IPPC has recently produced a useful document titled “Operation of a national plant protection organization: A guide to understanding the principal requirements for operating an organization to protect national plant resources from pests”. The need for a strategic plan, and the topics it could cover, are addressed further there. However, given that DCP is mandated with tasks beyond the role of an NPPO, particularly in the areas of input regulation, those areas would also need including. Another resource that would useful in this process is the Performance, Vision and Strategy for National Plant Protection Organizations (IICA, 2007). This tool provides a structure for a participatory approach for reviewing technical capability, human and financial capital, interaction with the private sector, and access to markets.
Costs required: Consultant support to prepare the strategy in consultation with DCP staff and other key stakeholders through face to face interviews and 3 workshops in years 1, 3 and 5 – to refine and then review the strategy
A3.1.3 Recruit new DCP staff. An estimated 50 new posts to be created and staff recruited and 31 empty posts to be filled. A phased recruitment would take place over a 3 year period and it is assumed that all new recruits would be at inspector level allowing for some more senior and some more junior staff. In addition, a senior partnership officer and communications officer would be recruited as explained above.
Costs required: Costs for an additional 81 staff are included at inspector level – to bring total staffing from 39 to 120. Costs of a 3 other senior posts are also included. This is very much an estimate and actual costs would need to be adjusted based on the results of the capacity diagnosis
A3.1.4 Implement training program to strengthen DCP skills required for effective pest management: It is assumed that existing staff and new recruits will already have recommended academic qualifications relevant for their jobs – but that short and long term vocational training will be needed to improve capacity. Study tours, attachments, mentoring and coaching are also proposed. Some training opportunities are available within the region (such as with the Centre of Phytosanitary Excellence in Kenya (www.AfricaCOPE.org). Under the Australia-Africa Plant Biosecurity Partnership (which includes several DCP staff), linkages have been established with Australian plant biosecurity agencies for advice/mentoring, so we assume those relationships will continue and do not need to be funded A training program will be rolled out over a number of years – and a final plan will depend on the result of A3.1.1 and A3.1.2. However, table 18 below shows a number of areas where training is recommended for DCP staff in the appropriate posts and costs are based on these recommendations. In addition, in view of the proposed development of information management systems, DCP training in data analysis on pests and diseases, and development of appropriate actions to any identified threats will be paramount.
Costs required: Actual costs will be based on the analysis carried out in A3.1.1 However expected costs are estimated based on table 18.
A3.1.5 Obtain ISO 17025 accreditation: Part of the strategic plan should be to work towards obtaining ISO 17025 accreditation. There are both management requirements and technical requirements for achieving this accreditation, which demonstrates that a laboratory is competent in testing, and this standard is widely used for phytosanitary laboratories. To become accredited a laboratory must have a documented quality management system, and progress on this was made in a recent project implemented by DCP to address phytosanitary problems in exported roses.
Costs required: Many of the costs are covered under the other capacity development activities. However, provision is required for application fees, consultants to advise on the process, and for the final accreditation.
Output 3.2: Improved infrastructure for pest and disease management
DCP needs facilities and equipment for providing a range of services. It does not have to provide all the services covered by its mandate itself; some could be provided by other organizations such as NARO or universities. However, DCP needs substantially more facilities and equipment than it currently has. As noted above, modern diagnostic techniques are now available at much lower cost than previously, which can provide quick results,

Platform for Agricultural Risk Management | Crop pests and disease management in Uganda: status and investment needs
77 Uganda | Tools Assessment | Full Report | March 2017
allowing more appropriate and rapid response to potential or actual pest problems. This does not preclude the need for the traditional approaches, but the new methods can provide very significant opportunities. Many of the new techniques are based on the use of various methods for analysing nucleic acids. For example, loop mediated isothermal amplification (LAMP) can provide a quick present or absent diagnosis for known species, once the appropriate primers have been developed and validated for local use. Thus LAMP is useful when the presence of a specific species needs to be ascertained. This might be when conducting a specific survey as part of prevention or in response to an incursion (the machines are small and robust so can be taken to the field). It can also be used in ensuring planting material is free from a particular disease.
A3.2.1: Assess infrastructure needs and develop improvement plan: An assessment will take place of
existing laboratory facilities managed by MAAIF, Universities and NARO. Laboratories would be visited and an inventory prepared of existing equipment, facilities and staff as well as of the capacity to diagnose which pathogens. The assessment will include a review of whether laboratories operate services the general public or serve only an internal clientele (e.g. laboratories in research organizations with a mandate to serve their own researchers only). Processes and procedures, including current sample throughput and time taken for service provision will be reviewed. Consultations with relevant stakeholders representing both clients and service providers undertaken and a plan for laboratory refurbishment and establishment of appropriate operating procedures developed. The assessment will also review existing linkages with overseas laboratories. To be cost effective – it can make sense to send certain complex samples to laboratories with better facilities. The activity relates closely to A3.1.1 so should be conducted concurrently if possible.
Costs required: Cost of consultancy (including travel) to implement assessment and costs of 2 workshops to consult stakeholders.
A3.2.2: Equip main laboratory. In section 2.3.1 it was noted that there was inadequate diagnostic services needed to backstop pest management services and inadequate equipment. It is assumed that there will be the need to refurbish laboratories – but not build new facilities or upgrade office space. It is expected that 8 laboratory rooms will need to be refurbished and equipped – either in a single location or distribution across several locations. Rooms will be required for: preparation/isolation/incubation of pathogens (nematodes, fungi, bacteria); 1 for virology; 2 for insects and 2 others. Equipment needed would include ELISA, PCR, LAMP and others as recommended from A3.2.1. It is proposed that plans are included to refurbish at least 8 rooms
Costs required: a) Costs for refurbishment including equipment based on a cost of 50K per room – with refurbishment taking place over 2 years – starting at the end of the first year b) running costs.

Uganda | Tools Assessment | Full Report | March 2017 78
Platform for Agricultural Risk Management | Crop pests and disease management in Uganda: status and investment needs
Ta
ble
18
: P
rio
rity
skill
s a
nd
are
as o
f kn
ow
led
ge
fo
r tr
ain
ing
DC
P s
taff
Ski
lls/k
no
wle
dg
e ar
ea
Des
crip
tio
n
S
taff
to
be
trai
ned
S
taff
Co
urs
es
C
ou
rse
typ
e
Ph
yto
san
itar
y p
roce
sses
R
isk
anal
ysis
P
hyto
sani
tary
ris
k an
alys
is in
rel
atio
n to
impo
rts.
S
enio
r an
d pr
inci
pal p
hyto
sani
tary
and
qua
rant
ine
insp
ecto
rs
4 2
Tw
o 5-
day
cour
ses
with
CO
PE
the
seco
nd to
follo
w-u
p on
firs
t-
Sur
veill
ance
D
esig
ning
and
con
duct
ing
spec
ific
surv
eys
to d
eter
min
e pe
st
dist
ribut
ion
and
abun
danc
e A
gric
ultu
ral i
nspe
ctor
s +
sen
ior
insp
ecto
rs w
ho w
ould
be
invo
lved
in d
esig
ning
and
con
duct
ing
surv
eys
10
2
Tw
o 5-
day
cour
ses
with
CO
PE
the
seco
nd to
follo
w-u
p on
firs
t-
Impo
rt c
ontr
ols
Bas
ed o
n ris
k an
alys
is, s
ettin
g ap
prop
riate
con
trol
s on
impo
rts
to m
anag
e th
e ris
ks c
ost e
ffect
ivel
y. T
his
wou
ld in
clud
e ne
gotia
ting
impo
rt c
ondi
tions
with
trad
e pa
rtne
rs, i
nspe
ctio
n,
post
-ent
ry q
uara
ntin
e.
Sen
ior/
prin
cipa
l or
high
er s
taff
resp
onsi
ble
for
nego
tiatio
n w
ith tr
ade
part
ners
5
2
Tw
o 5-
day
cour
ses
with
CO
PE
the
seco
nd to
follo
w-u
p on
spe
cific
impo
rt
issu
es
Exp
ort c
ertif
icat
ion
Sup
port
ing
expo
rter
s to
mee
t im
port
ers’
con
ditio
ns, i
nclu
ding
ne
gotia
ting
mar
ket a
cces
s, in
spec
ting
plac
es o
f pro
duct
ion,
ph
ytos
anita
ry c
ertif
icat
ion.
Sen
ior/
prin
cipa
l or
high
er s
taff
resp
onsi
ble
for
enga
gem
ents
and
neg
otia
tions
with
trad
e pa
rtne
rs
5 2
Tw
o 5-
day
cour
ses
with
CO
PE
the
seco
nd to
follo
w-u
p on
spe
cific
impo
rt
issu
es
Dia
gnos
tics
Tra
ditio
nal a
nd m
oder
n m
olec
ular
tech
niqu
es fo
r di
agno
sing
pl
ant h
ealth
pro
blem
s an
d id
entif
ying
cau
sal a
gent
s A
gric
ultu
ral i
nspe
ctor
s (d
iagn
ostic
s) a
nd; L
abor
ator
y te
chni
cian
s 4
4 4
mo
voca
tiona
l cou
rse
per
staf
f m
embe
r
Info
rmat
ion
man
agem
ent
D
atab
ase
man
agem
ent
Dat
a en
try,
che
ckin
g an
d cl
eani
ng; d
atab
ase
secu
rity;
de
velo
pmen
t and
impl
emen
tatio
n of
pro
toco
ls a
nd o
pera
ting
proc
edur
es
IT &
Dat
a m
anag
er a
nd d
ata
tech
nici
ans
4
4 1
mo
inte
rnat
iona
l tra
inin
g
Dat
a an
alys
is, m
odel
ling
Usi
ng th
e da
ta to
ans
wer
que
stio
ns, o
r to
mak
e fo
reca
sts,
pr
edic
tions
, ris
k as
sess
men
ts.
IT
& D
ata
man
ager
2
2 1
mo
inte
rnat
iona
l tra
inin
g
Pre
sent
atio
n, v
isua
lizat
ion
Com
mun
icat
ion
of in
form
atio
n in
way
s an
d fo
rmat
s su
itabl
e fo
r di
ffere
nt a
udie
nces
IT
& D
ata
man
ager
, tec
hnic
ians
and
insp
ecto
rs
20
2 1
wee
k co
urse
del
iver
ed lo
cally
by
natio
nal o
r in
tern
atio
nal c
onsu
ltant
-
Reg
ula
tory
fu
nct
ion
s
R
egul
atin
g pe
st c
ontr
ol p
rodu
cts
Set
ting,
impl
emen
ting
and
enfo
rcin
g re
gula
tions
, pre
fera
bly
that
sup
port
inte
grat
ed p
est m
anag
emen
t A
gric
ultu
ral i
nspe
ctor
s (p
estic
ides
) –
toge
ther
with
se
nior
/prin
cipa
l ins
pect
ors
3
3 P
art-
time
dist
ance
lear
ning
cou
rse
mix
ed w
ith m
ento
ring
visi
ts b
y in
tern
atio
nal c
onsu
ltant
(s)
R
egul
atin
g se
ed s
yste
ms
Set
ting,
impl
emen
ting
and
enfo
rcin
g re
gula
tions
that
allo
w
farm
ers
to a
cces
s an
d us
e qu
ality
see
d A
gric
ultu
ral i
nspe
ctor
s (s
eed)
– to
geth
er w
ith
seni
or/p
rinci
pal i
nspe
ctor
s
3 3
Par
t-tim
e di
stan
ce le
arni
ng c
ours
e m
ixed
with
men
torin
g vi
sits
by
inte
rnat
iona
l con
sulta
nt(s
) R
egul
ator
y im
pact
ass
essm
ent a
nd
regu
lato
ry g
ood
prac
tice
Ass
essi
ng a
nd m
onito
ring
regu
lato
ry im
pact
and
iden
tifyi
ng
oppo
rtun
ities
for
redu
cing
neg
ativ
e im
pact
s w
hile
ach
ievi
ng
publ
ic p
olic
y go
als
Sen
ior
staf
f 5
1 1
wee
k co
urse
del
iver
ed o
n-s
ite b
y in
tern
atio
nal c
onsu
ltant
(s)
Mon
itorin
g (p
estic
ide
anal
ysis
, se
ed te
stin
g)
Tec
hnic
al m
etho
ds fo
r m
onito
ring
inpu
t qua
lity
Agr
icul
tura
l ins
pect
ors
(see
d/pe
stic
ides
) 20
2
10 d
ay c
ours
e w
ith C
OP
E o
r ot
her
On
seed
test
ing
and
anal
ysis
Man
agem
ent
Str
ateg
ic p
lann
ing
Dev
elop
ing
plan
s fo
r th
e N
PP
O (
DC
P),
bas
ed o
n ac
tual
and
ex
pect
ed n
eeds
in th
e ag
ricul
ture
sec
tor
Sen
ior
staf
f 5
1 P
artic
ipat
ion
in in
tern
atio
nal
cour
se/m
ento
ring
– st
udy
tour
s an
d on
-si
te tr
aini
ng
Fin
anci
al m
anag
emen
t B
udge
ting,
allo
catin
g fin
ance
bas
ed o
n st
rate
gic
prio
ritie
s an
d co
st e
ffect
iven
ess
Fin
ance
sta
ff (a
ssum
e al
read
y in
pla
ce)
toge
ther
with
se
nior
DC
P s
taff
5 1
Fin
ance
cou
rse
Lead
ersh
ip
Lead
ing
an o
rgan
izat
ion
, suc
h as
the
NP
PO
S
enio
r st
aff -
ass
ume
alre
ady
in p
lace
5
1 P
artic
ipat
ion
in in
tern
atio
nal
cour
se/m
ento
ring
– st
udy
tour
s an
d on
-si
te tr
aini
ng
Qua
lity
man
agem
ent
setti
ng u
p an
d m
onito
ring
proc
edur
es to
ens
ure
qual
ity o
f all
activ
ities
A
ll se
nior
sta
ff in
volv
ed in
man
agin
g N
PP
O r
elat
ed
activ
ities
10
1
Par
ticip
ate
in s
ettin
g up
sys
tem
rel
ated
to
clin
ics
and
wor
k w
ith IC
T s
taff
deve
lopi
ng s
yste
m
Com
mun
icat
ion,
adv
ocac
y, p
olic
y in
fluen
ce
Com
mun
icat
ing
with
sta
keho
lder
s to
influ
ence
cha
nge
Sen
ior
staf
f - a
ssum
e al
read
y in
pla
ce
5 1
Par
ticip
atio
n in
inte
rnat
iona
l co
urse
/men
torin
g
CoP
E =
Centr
e o
f P
hyto
sanitary
Excelle
nce

Platform for Agricultural Risk Management | Crop pests and disease management in Uganda: status and investment needs
79 Uganda | Tools Assessment | Full Report | March 2017
A3.2.3: Install and equip post-entry quarantine facilities. When importing planting material such as seeds or
vegetative material, a facility to test the material following import is particularly valuable. Usually this would include a number of secure greenhouses where materials could be grown, and tested for any diseases of concern. Namalere is the designated post-entry quarantine station, and it is recommended that a set of greenhouses would be built there. However, a final decision will be determined under A3.2.1
Costs required: a) Installation of set of 3-5 greenhouses – estimated cost 50K b) running costs
A3.2.4: Equip border post laboratories. Border posts are a front line in the prevention of incursions by new
pests, and some equipment is required for sampling consignments, and undertaking any tests that might be necessary. There will always be a need to send samples to a central diagnostic laboratory, but given that this takes time, it is often not convenient or appropriate. Thus border posts should have at least a small laboratory facility.
Costs required: a) Costs of installing some small equipment including sampling equipment, a microscope, as well as IT equipment (see below)
A3.2.5: Equip laboratory for pesticide testing. To monitor and enforce regulations concerning pesticides,
laboratories are needed where the necessary analyses can be undertaken. Pesticide residue analysis laboratories can also support exports by ensuring consignments meet maximum residue level requirements.
Costs required: It is assumed that costs of laboratories to support pesticide regulations will be covered under a current proposal already before government (MAAIF, 2014)
A3.2.6: Equip laboratory for seed testing. To monitor and enforce regulations concerning seeds, capacity is
needed to test for purity, germination, diseases etc. Seed regulation also requires a field site and greenhouses to carry out distinctness, uniformity and stability (DUS) testing. It is expected that the seed testing laboratory hosted at Kawanda will also require re-furbishing and new greenhouses. A final decision will depend on the outcome of A3.2.1
Costs required: Costs of refurbishing facility and greenhouses in year 1 and running costs thereafter
A3.2.7: Install information technology (IT) to network DCP staff. Adequate IT equipment is essential for the
operation of a national plant protection organization. Fundamental to this is good access to the Internet; good bandwidth continuously available at all DCP premises. A few of the areas where IT equipment and internet access can significantly enhance NPPO activities include:
Accumulation of data, supporting risk analysis and the adoption of risk-based approaches that optimise resource use
Analysing risk and modelling risk management options
Electronic certification (the IPPC is currently developing a system that will allow any country that wishes to use electronic phytosanitary certificates)
Digital keys and other diagnostic aids
Repositories for standard operating procedures
Rapid sharing of information, including alerts
Costs required: Computers and Wi-Fi access would be needed at each border post. Current position is not known – it is assumed that 35 computers are needed for the border posts (for 35 gazetted posts); and 15 at HQ together with associated networking facilities. Technical assistance to set up a networked system and operational costs to cover costs of installation and maintenance of Wi-Fi.
6.3.5 Universal e-agriculture service platform
As outlined in section 5, the potential of ICT to facilitate service delivery is seen as having high potential in Africa as mobile technology spreads. There is an array of ICT facilitated services relevant to risk management that are already being explored on the continent designed to facilitate smallholder access to: weather and market data; financial services; insurance; input supply; output markets and; access to information on good agricultural practice. ICT can support linkages to various private sector service providers as well as facilitate financial transactions. Although specific services monitoring pest information at a field level are not yet addressed outside the Plantwise approach (as far as the team is aware) data collection is a building block of most if not all services.
An estimate for development of such a system that allows for a public and private sector contributions is at least $5 million, with 50% from public sector funding – although a detailed landscape and needs analysis would be needed to develop a feasible proposal.

Platform for Agricultural Risk Management | Crop pests and disease management in Uganda: status and investment needs
Uganda | Tools Assessment | Full Report | March 2017 80
In the ACDP project - $4 million is ear-marked to develop an ICT-based Agricultural Information Platform for MAAIF. This initiative lead by MAAIF’s department of Agricultural Planning is an obvious starting point – although the potential for such a platform to provide services to private sector ICT companies is not clear. Whatever is planned and implemented it will be important to map out different initiatives planned to avoid duplication and align efforts where possible.
6.3.6 Logical framework
Indicators for supporting the monitoring and evaluation of the investment plan have been developed at the, goal, outcome and output levels. These indicators address medium to long term results expected as a result of this plan. In the long term, indicators include reduction in crop losses and increases in production and yield at household level. In the medium term, indicators include; establishment of functional extension system responding to pest management at local level, and systems for early detection and response. This should be accompanied by appropriate skills in monitoring, analysis and response to pest situations as well as enforce regulations to ensure quality pest management services. At the farm level, increased access to quality information and inputs will be measured by the proportion of farmers with appropriate knowledge and applying recommended pest management practices. In the short term, performance indicators will include personnel development, emergency response planning, harmonized pest monitoring including border points, data collection and storage services, information dissemination and quality control. These are summarized in the Table 19.
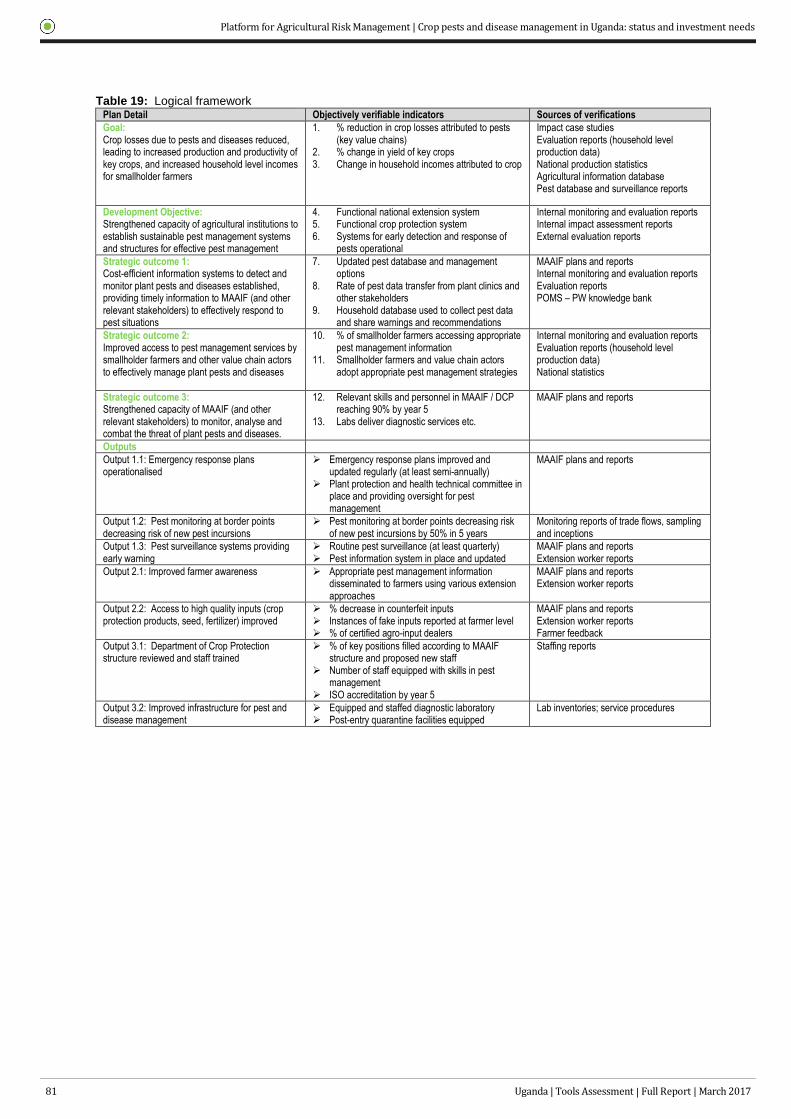
Platform for Agricultural Risk Management | Crop pests and disease management in Uganda: status and investment needs
81 Uganda | Tools Assessment | Full Report | March 2017
Table 19: Logical framework Plan Detail Objectively verifiable indicators Sources of verifications
Goal: Crop losses due to pests and diseases reduced, leading to increased production and productivity of key crops, and increased household level incomes for smallholder farmers
1. % reduction in crop losses attributed to pests (key value chains)
2. % change in yield of key crops 3. Change in household incomes attributed to crop
Impact case studies Evaluation reports (household level production data) National production statistics Agricultural information database Pest database and surveillance reports
Development Objective: Strengthened capacity of agricultural institutions to establish sustainable pest management systems and structures for effective pest management
4. Functional national extension system 5. Functional crop protection system 6. Systems for early detection and response of
pests operational
Internal monitoring and evaluation reports Internal impact assessment reports External evaluation reports
Strategic outcome 1: Cost-efficient information systems to detect and monitor plant pests and diseases established, providing timely information to MAAIF (and other relevant stakeholders) to effectively respond to pest situations
7. Updated pest database and management options
8. Rate of pest data transfer from plant clinics and other stakeholders
9. Household database used to collect pest data and share warnings and recommendations
MAAIF plans and reports Internal monitoring and evaluation reports Evaluation reports POMS – PW knowledge bank
Strategic outcome 2: Improved access to pest management services by smallholder farmers and other value chain actors to effectively manage plant pests and diseases
10. % of smallholder farmers accessing appropriate pest management information
11. Smallholder farmers and value chain actors adopt appropriate pest management strategies
Internal monitoring and evaluation reports Evaluation reports (household level production data) National statistics
Strategic outcome 3: Strengthened capacity of MAAIF (and other relevant stakeholders) to monitor, analyse and combat the threat of plant pests and diseases.
12. Relevant skills and personnel in MAAIF / DCP reaching 90% by year 5
13. Labs deliver diagnostic services etc.
MAAIF plans and reports
Outputs
Output 1.1: Emergency response plans operationalised
Emergency response plans improved and updated regularly (at least semi-annually)
Plant protection and health technical committee in place and providing oversight for pest management
MAAIF plans and reports
Output 1.2: Pest monitoring at border points decreasing risk of new pest incursions
Pest monitoring at border points decreasing risk of new pest incursions by 50% in 5 years
Monitoring reports of trade flows, sampling and inceptions
Output 1.3: Pest surveillance systems providing early warning
Routine pest surveillance (at least quarterly) Pest information system in place and updated
MAAIF plans and reports Extension worker reports
Output 2.1: Improved farmer awareness Appropriate pest management information disseminated to farmers using various extension approaches
MAAIF plans and reports Extension worker reports
Output 2.2: Access to high quality inputs (crop protection products, seed, fertilizer) improved
% decrease in counterfeit inputs Instances of fake inputs reported at farmer level % of certified agro-input dealers
MAAIF plans and reports Extension worker reports Farmer feedback
Output 3.1: Department of Crop Protection structure reviewed and staff trained
% of key positions filled according to MAAIF structure and proposed new staff
Number of staff equipped with skills in pest management
ISO accreditation by year 5
Staffing reports
Output 3.2: Improved infrastructure for pest and disease management
Equipped and staffed diagnostic laboratory Post-entry quarantine facilities equipped
Lab inventories; service procedures

Platform for Agricultural Risk Management | Crop pests and disease management in Uganda: status and investment needs
Uganda | Tools Assessment | Full Report | March 2017 82
6.4 Budget summary by result and activity
Costs of implementation are summarized below based on detail of the costs required. Note missing Activities are where activities are covered under other funding sources or elsewhere in the budget. Some of cost assumptions used to estimate the budget are given in the table below and a full detailed budget with workings provided separately.
Year 1 Year 2 Year 3 Year 4 Year 5 Total
Coordination
Salaries - coordination staff 14,500 14,500 14,500 14,500 14,500 72,500
Supplies/Equipment 22,000 2,000 12,000 2,000 2,000 40,000
Travel 5,000 5,000 5,000 5,000 5,000 25,000
Vehicles - including running costs 80,000 110,000 140,000 90,000 90,000 510,000
Monitoring and Evaluation1 480,000 480,000 480,000 480,000 480,000 2,400,000
Sub- total: Coordination 601,500 611,500 651,500 591,500 591,500 3,047,500
Strategic Outcome 1: Effective pest information system established
Output 1.1 Emergency response plans
operationalised
-
Meetings/workshops 39,004 34,474 15,602 15,602 15,602 120,284
Technical assistance 72,000 57,000 24,000 24,000 24,000 201,000
Sub- total: Output 1.1 111,004 91,474 39,602 39,602 39,602 321,284
Output 1.2 Effective pest monitoring at border points decreasing risk of new pest incursions -
Meetings/workshops - 4,860 4,860 - - 9,720
Supplies/Equipment - 40,000 - - 40,000 80,000
Technical assistance
Communication materials 6,000 29,806 12,000 - - 47,806
Risk analysis 72,000 54,000 36,000 - - 162,000
Sub- total: Output 1.2 78,000 128,666 52,860 - 40,000 299,526
Output 1.3 Pest surveillance systems established providing early warning -
Salaries - extension staff - - - - - -
Meetings/workshops to plan pest info system 125,284 125,284 122,642 121,321 121,321 615,852
Stakeholder consultations on IT system 5,000 5,000 5,000 - 5,000 20,000
Training
1500 extension staff as plant doctors2 420,300 420,300 420,300 420,300 420,300 2,101,500
1500 plant doctors in data management 168,120 168,120 140,100 140,100 140,100 756,540
Supplies/Equipment -
Clinic start-up equipment 90,000 60,000 60,000 60,000 90,900 360,900
Tablets for 1500 extension staff; 500 district
zonal and DCP staff
88,000 88,000 88,000 88,000 88,000 440,000
Technical Assistance -
Build data collection and management system3 280,000 280,000 140,000 - - 700,000
Backstop training by national trainers 80,000 80,000 56,000 56,000 44,000 316,000
Travel 8,000 8,000 4,000 - 2,000 22,000
Operations -
Allowances + equipment transport4 231,750 386,250 540,750 695,250 929,318 2,783,318
Airtime and maintenance 48,000 96,000 144,000 192,000 240,000 720,000
IT system maintenance - - 70,000 70,000 70,000 210,000
Data collection from HH using SMS - 30,000 60,000 90,000 100,000 280,000
Surveys and pest surveillance 60,000 60,000 60,000 60,000 60,000 300,000
Contingency - pest eradication or containment 100,000 - - 100,000 - 200,000
Contingency - pest management 100,000 100,000 100,000 100,000 100,000 500,000
Sub- total: Output 1.3 1,804,454 1,906,954 2,010,792 2,192,971 2,410,939 10,326,110
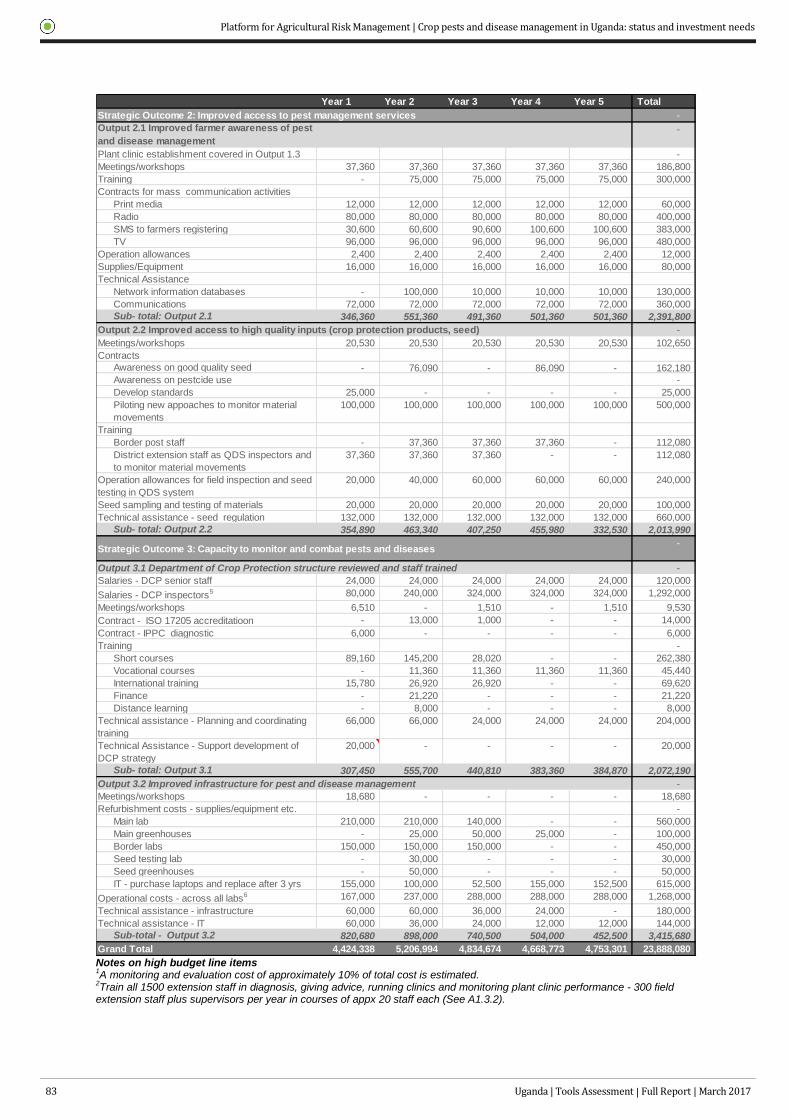
Platform for Agricultural Risk Management | Crop pests and disease management in Uganda: status and investment needs
83 Uganda | Tools Assessment | Full Report | March 2017
Notes on high budget line items 1A monitoring and evaluation cost of approximately 10% of total cost is estimated.
2Train all 1500 extension staff in diagnosis, giving advice, running clinics and monitoring plant clinic performance - 300 field
extension staff plus supervisors per year in courses of appx 20 staff each (See A1.3.2).
Year 1 Year 2 Year 3 Year 4 Year 5 Total
Strategic Outcome 2: Improved access to pest management services -
Output 2.1 Improved farmer awareness of pest
and disease management
-
Plant clinic establishment covered in Output 1.3 -
Meetings/workshops 37,360 37,360 37,360 37,360 37,360 186,800
Training - 75,000 75,000 75,000 75,000 300,000
Contracts for mass communication activities
Print media 12,000 12,000 12,000 12,000 12,000 60,000
Radio 80,000 80,000 80,000 80,000 80,000 400,000
SMS to farmers registering 30,600 60,600 90,600 100,600 100,600 383,000
TV 96,000 96,000 96,000 96,000 96,000 480,000
Operation allowances 2,400 2,400 2,400 2,400 2,400 12,000
Supplies/Equipment 16,000 16,000 16,000 16,000 16,000 80,000
Technical Assistance
Network information databases - 100,000 10,000 10,000 10,000 130,000
Communications 72,000 72,000 72,000 72,000 72,000 360,000
Sub- total: Output 2.1 346,360 551,360 491,360 501,360 501,360 2,391,800
Output 2.2 Improved access to high quality inputs (crop protection products, seed) -
Meetings/workshops 20,530 20,530 20,530 20,530 20,530 102,650
Contracts
Awareness on good quality seed - 76,090 - 86,090 - 162,180
Awareness on pestcide use -
Develop standards 25,000 - - - - 25,000
Piloting new appoaches to monitor material
movements
100,000 100,000 100,000 100,000 100,000 500,000
Training
Border post staff - 37,360 37,360 37,360 - 112,080
District extension staff as QDS inspectors and
to monitor material movements
37,360 37,360 37,360 - - 112,080
Operation allowances for field inspection and seed
testing in QDS system
20,000 40,000 60,000 60,000 60,000 240,000
Seed sampling and testing of materials 20,000 20,000 20,000 20,000 20,000 100,000
Technical assistance - seed regulation 132,000 132,000 132,000 132,000 132,000 660,000
Sub- total: Output 2.2 354,890 463,340 407,250 455,980 332,530 2,013,990
Strategic Outcome 3: Capacity to monitor and combat pests and diseases-
Output 3.1 Department of Crop Protection structure reviewed and staff trained -
Salaries - DCP senior staff 24,000 24,000 24,000 24,000 24,000 120,000
Salaries - DCP inspectors5 80,000 240,000 324,000 324,000 324,000 1,292,000
Meetings/workshops 6,510 - 1,510 - 1,510 9,530
Contract - ISO 17205 accreditatioon - 13,000 1,000 - - 14,000
Contract - IPPC diagnostic 6,000 - - - - 6,000
Training -
Short courses 89,160 145,200 28,020 - - 262,380
Vocational courses - 11,360 11,360 11,360 11,360 45,440
International training 15,780 26,920 26,920 - - 69,620
Finance - 21,220 - - - 21,220
Distance learning - 8,000 - - - 8,000
Technical assistance - Planning and coordinating
training
66,000 66,000 24,000 24,000 24,000 204,000
Technical Assistance - Support development of
DCP strategy
20,000 - - - - 20,000
Sub- total: Output 3.1 307,450 555,700 440,810 383,360 384,870 2,072,190
Output 3.2 Improved infrastructure for pest and disease management -
Meetings/workshops 18,680 - - - - 18,680
Refurbishment costs - supplies/equipment etc. -
Main lab 210,000 210,000 140,000 - - 560,000
Main greenhouses - 25,000 50,000 25,000 - 100,000
Border labs 150,000 150,000 150,000 - - 450,000
Seed testing lab - 30,000 - - - 30,000
Seed greenhouses - 50,000 - - - 50,000
IT - purchase laptops and replace after 3 yrs 155,000 100,000 52,500 155,000 152,500 615,000
Operational costs - across all labs6 167,000 237,000 288,000 288,000 288,000 1,268,000
Technical assistance - infrastructure 60,000 60,000 36,000 24,000 - 180,000
Technical assistance - IT 60,000 36,000 24,000 12,000 12,000 144,000
Sub-total - Output 3.2 820,680 898,000 740,500 504,000 452,500 3,415,680
Grand Total 4,424,338 5,206,994 4,834,674 4,668,773 4,753,301 23,888,080

Platform for Agricultural Risk Management | Crop pests and disease management in Uganda: status and investment needs
Uganda | Tools Assessment | Full Report | March 2017 84
3Estimated cost of building a data management system ($700,000 spread over 3 years) that allows automated data collection of
household data, annual survey data, clinic data etc.(See A1.3.3). 4Extension staff allowances to travel to run clinics 25 times a year with clinics gradually building to one per sub-county (1203) in
key districts and small amount of allowances for supervision by DAOs. NB: Daily allowances are estimated as follows ($12); transport of furniture ($15); casual labour to set up tent; publicity ($5) – but would be expected to follow normal government rules on allowances. 5Salaries of 81 new staff including inspectors for new border posts etc. and 3 new senior staff recruited gradually over 3 years.
Cost assumptions (in USD)
Salaries Technical assistance (average)
Senior govt. officer – annual 8000 International 600
Field extension staff – annual 4000 National 200
Agricultural inspectors – annual 4000
Clinic costs Other
Start-up: Table, chairs, printed materials 300 Laptop + accessories 2500
Start-up: Tablet 220 Contingency - pest specific survey 10000
Running costs (allowances, transport, setup, publicity) 38 2 plant health rallies per day implemented by a team of 5 people
60
Data bundles and airtime monthly 5 Rally materials 2500
Training Radio package – 3x3 talk-shows – repeated 3 times + jingles
5000
Vocational training (per person per month) 200 Short pieces posted in print media 1000
1 mo. data course – int flight + 2000 acc + subs assuming travel to EU – could be lower in Africa
3500 SMS – assume bulk delivery 0.02
1-week comms course – Africa flight + 7d T&S 2000 Mileage rate 1

Platform for Agricultural Risk Management | Crop pests and disease management in Uganda: status and investment needs
85 Uganda | Tools Assessment | Full Report | March 2017
6.5
W
ork
pla
n
Pla
n d
etai
l S
trat
egie
s Y
ear
1 Y
ear
2 Y
ear
3 Y
ear
4 Y
ear
5
2015
/16
2016
/17
2017
/18
2018
/19
2019
/20
Str
ateg
ic O
utc
om
e 1:
Eff
ecti
ve p
est
info
rmat
ion
sys
tem
est
ablis
hed
Out
put 1
.1:
Em
erge
ncy
resp
onse
pl
ans
impr
oved
A1.
1.1:
Ope
ratio
nalis
e th
e pl
ant p
rote
ctio
n an
d he
alth
tech
nica
l co
mm
ittee
(no
. com
mitt
ee m
eetin
gs)
4 4
2 2
2
A1.
1.2:
Dev
elop
pes
t em
erge
ncy
resp
onse
pla
ns (
no. s
ub-
com
mitt
ee m
eetin
gs)
4 4
1 1
1
A1.
1.3:
Dev
elop
men
t of s
ecto
r sp
ecifi
c pr
even
tion
stra
tegi
es fo
r hi
gh
risk
com
mod
ities
(se
ctor
sub
-com
mitt
ee m
eetin
gs)
XX
X
XX
X
X
X
X
Out
put 1
.2:
Pes
t mon
itorin
g at
bo
rder
poi
nts
decr
easi
ng r
isk
of n
ew
pest
incu
rsio
ns
A1.
2.1:
Ris
k an
alys
is
XX
X
XX
X
X
A1.
2.2:
Re-
esta
blis
h D
CP
pre
senc
e at
gaz
ette
d bo
rder
pos
ts
XX
X
XX
X
A1.
2.3:
Dev
elop
men
t of g
uide
lines
and
mat
eria
ls to
rai
se a
war
enes
s of
bot
h pu
blic
and
bor
der
staf
f on
pest
ris
ks
Out
put 1
.3:
Pes
t sur
veill
ance
sy
stem
s pr
ovid
ing
early
war
ning
A1.
3.1:
Est
ablis
h a
wor
king
gro
up to
dev
elop
a p
est i
nfor
mat
ion
man
agem
ent s
yste
m fo
r ea
rly w
arni
ng a
nd h
ouse
hold
leve
l dat
a:
(gro
up m
eetin
gs)
4 4
2 1
1
A1.
3.2:
Est
ablis
h a
netw
ork
of p
lant
hea
lth c
linic
s (c
linic
s ru
nnin
g)
300
500
700
900
1203
A1.
3.3:
Des
ign
and
build
a p
est i
nfor
mat
ion
syst
em a
) to
col
lect
and
m
anag
e pe
st m
onito
ring
data
:
XX
X
XX
X
XX
A1.
3.4:
Equ
ip a
ll di
stric
t agr
icul
tura
l offi
cers
and
sub
-cou
nty
exte
nsio
n st
aff w
ith ta
blet
s an
d to
ols
(nos
. rec
eivi
ng ta
blet
s)
400
400
400
400
400
A1.
3.5:
Res
pond
to e
arly
war
ning
of p
est o
utbr
eaks
- Im
plem
ent
spec
ific
surv
eys
and
pest
sur
veill
ance
A1.
3.6:
Res
pond
to e
arly
war
ning
of p
est o
utbr
eaks
– c
ontin
genc
y to
er
adic
ate,
or
cont
ain:
A1.
3.7:
Res
pond
to e
arly
war
ning
of p
est o
utbr
eaks
– m
anag
emen
t in
sele
cted
cas
es:
A1.
3.8:
Dev
elop
sys
tem
s fo
r re
gion
al c
o-op
erat
ion:
A1.
3.9:
Bui
ld c
apac
ity o
f res
earc
h

Uganda | Tools Assessment | Full Report | March 2017 86
Platform for Agricultural Risk Management | Crop pests and disease management in Uganda: status and investment needs
Pla
n d
etai
l S
trat
egie
s Y
ear
1 Y
ear
2 Y
ear
3 Y
ear
4 Y
ear
5
2015
/16
2016
/17
2017
/18
2018
/19
2019
/20
Str
ateg
ic O
utc
om
e 2:
Imp
rove
d a
cces
s to
pes
t m
anag
emen
t se
rvic
es
Out
put 2
.1:
Impr
oved
farm
er
awar
enes
s A
2.1.
1: E
stab
lish
plan
t clin
ics
See
Act
ivity
1.3
.2
A2.
1.2:
Impl
emen
t mix
ed m
edia
cam
paig
ns
A2.
1.3:
Impr
ove
acce
ss to
info
rmat
ion
on e
ffect
of p
ests
and
how
to
man
age
them
A2.
1.4:
Enh
ance
Ext
ensi
on s
taff
skill
s
Out
put 2
.2:
Acc
ess
to h
igh
qual
ity
inpu
ts (
crop
pro
tect
ion
prod
ucts
, se
ed, f
ertil
izer
) im
prov
ed
A2.
2.1
Impr
ove
qual
ity o
f pes
ticid
es
See
Act
ivity
1.3
.2
A2.
2.2:
Impr
oved
qua
lity
of s
eed
Str
ateg
ic O
utc
om
e 3:
Cap
acit
y to
mo
nit
or
and
co
mb
at p
ests
an
d d
isea
ses
Out
put 3
.1:
Dep
artm
ent o
f Cro
p P
rote
ctio
n st
ruct
ure
revi
ewed
and
st
aff t
rain
ed
A3.
1.1:
App
ly IP
PC
dia
gnos
tic to
ol to
cla
rify
trai
ning
nee
ds
A3.
1.2:
Dev
elop
DC
P s
trat
egy
A3.
1.3:
Rec
ruit
new
DC
P s
taff
X
X
XX
X
A3.
1.4:
Impl
emen
t tra
inin
g pr
ogra
m to
str
engt
hen
DC
P s
kills
req
uire
d fo
r ef
fect
ive
pest
man
agem
ent
X
XX
X
XX
X
X
X
X
A3.
1.5:
Obt
ain
ISO
170
25 a
ccre
dita
tion
X
XX
X
Out
put 3
.2:
Infr
astr
uctu
re im
prov
ed
A3.
2.1:
Ass
ess
infr
astr
uctu
re n
eeds
and
dev
elop
impr
ovem
ent p
lan
X
XX
X
XX
X
X
X
A3.
2.2:
Equ
ip m
ain
labo
rato
ry
XX
X
XX
X
XX
A3.
2.3:
Inst
all a
nd e
quip
pos
t-en
try
quar
antin
e fa
cilit
ies
X
X
XX
X
A3.
2.4:
Equ
ip b
orde
r po
st la
bora
torie
s
A3.
2.5:
Equ
ip la
bora
tory
for
pest
icid
e te
stin
g
Impl
emen
ted
unde
r A
SD
P
A3.
2.6:
Equ
ip la
bora
tory
for
seed
test
ing
A3.
2.7:
Inst
all i
nfor
mat
ion
tech
nolo
gy (
IT)
to n
etw
ork
DC
P s
taff
Note
s: 1)
Where
levels
of
effort
diffe
r acro
ss y
ears
– 1
-3 c
rosses in
dic
ate
rela
tive level of
eff
ort

Platform for Agricultural Risk Management | Crop pests and disease management in Uganda: status and investment needs
87 Uganda | Tools Assessment | Full Report | March 2017
6.6 Partnerships for sustainable implementation
The interventions described and budgeted in previous sections aim to ensure Uganda has a robust and reliable plant health system. Some initiatives are already in progress that contributes to this goal so are not included or budgeted for here, such as the Pest Management Plan under the Agriculture Cluster Development Project (ACDP), currently awaiting parliamentary approval. The ACDP itself is a major project that, while not focused on pest risk management includes a number of complementary activities. There is also overlap in a $3million sub-component on capacity building for policy and regulatory functions of MAAIF that is likely to influence the way the investment is implemented. Other activities that contribute will include the proposed changes in extension and focus of NAADS on input delivery, and a number of other donor funded initiatives such as delivery of information through ICT, Plantwise or radio, that we recommend are scaled up. And in the future, other projects might be developed which while not explicitly designed to contribute to the investment strategy described here, do contribute to the broad goal and so should be brought under the strategy as appropriate.
Two things follow from this scenario. First there is need for partnership and coordination, with central government playing a pivotal role. Second, financing will come from a variety of sources. In this section we briefly discuss some aspects of implementation that need to be taken into account, including roles and financing, as well as the recommended immediate next steps.
6.6.1 Partnerships
The investment strategy has made clear that multiple stakeholders will be involved in implementation. The main categories of stakeholder and their roles were described in Chapter 3.2 and Table 15 also indicated roles of some stakeholders in relation to prevention and control of pests at different stages of invasion.
Central government has a key role to play, as provided for in the legal and institutional framework. This role involves providing national leadership in addressing crop pest and disease risks; implementing specific activities (especially those delivering public goods); coordinating, guiding and overseeing the inputs of the various stakeholders; and facilitating and managing the different partnerships entailed. The importance of establishing and maintaining effective partnerships is reflected in the recommendation that a new position is created in DCP for partnership management (Output 3.1).
It is not possible or appropriate in a complex system for one actor to attempt to exercise full control. But it is important that the different actors engage with each other, share information, and have some concept of how their activities contribute to and fit in to the overall system. Facilitating this engagement is an appropriate role for DCP, and is why a post for partnership management is required. Some tasks that would fall under a pest management strategy are implemented by other government ministries, departments and agencies, and would require close cooperation. For example extension is in a separate directorate but is in the frontline in terms of sharing pest management information and collecting information from farmers. In order to ensure actions are complementary and integrated, effective partnerships need to be established and maintained.
Other actors, particularly the private sector, and especially in those crops where value chains are more organised, have key roles to play. However, while they are required to operate within the legal and regulatory framework, they may have their own priorities and make decisions accordingly. Thus the role of DCP is to ensure that such interventions are dovetailed with the overall strategy as far as possible, and that different actors’ interventions are complementary rather than duplicative or contradictory.
6.6.2 Financing the investment strategy
Finance for the investment strategy is likely to come from a variety of sources. Some elements of the strategy may be implemented as externally funded independent projects or private sector activities. Efforts should be made to embed such projects within the overall strategy, particularly those that are still at the planning stage.
As the key player in the strategy is central government, with many of the activities being for the public good, government could be expected to be the primary financier. At the same time, the financial requirements for the strategy are considerably in excess of what the government is likely to be able to provide in the short term.
A number of the required investments are one-time capital expenses or activities necessary to upgrade the capacity of DCP to fulfil the expanded and enhanced role required. These include refurbishing laboratories and facilities; setting up an IT system; collecting householder profiles that can be accessed in the implementation of ICT based services; training extension staff as plant doctors. Such investments would be appropriate for an external financier, with a long term impact to be expected from the short term investment.
Conversely, recurring costs will be required on an ongoing basis, as part of organizations’ mandates, and these should be funded through regular budget lines as soon as possible if not immediately. These include costs for:

Platform for Agricultural Risk Management | Crop pests and disease management in Uganda: status and investment needs
Uganda | Tools Assessment | Full Report | March 2017 88
allowances for extension staff to implement plant clinics; continued implementation of pest specific surveys and emergency actions; contracting communication services (TV, radio etc.); QDS seed certification services; costs of additional staff to recruited to fill the established vacancies and additional posts recommended; maintenance of running costs of refurbished laboratories; maintenance of new IT equipment. Details of on-going costs are listed in the table below based on cost estimates given in the fifth project year. Total recurring costs are 2,249,678/ year. However, some costs may already be budgeted for. For example, once plant clinics are integrated into extension staff work flows – allowances will become part of normal operational costs. Running costs of refurbished laboratories and facilities will not be greatly different to current costs. Main area where costs will be completely new will be maintenance of IT equipment not previously part of organizational equipment.
Table 20: Recurring costs following project end Activity Cost item Annual cost estimate
1.3.2 Allowances and travel to run clinic sessions for 1203 plant clinics @ $38/session and 20 sessions/year 914,280
1.3.2 Allowances and travel for DAO to supervise plant clinics 15,038
1.3.5 Airtime and maintenance of 2000 tablets @ $10/mo 240,000
1.3.6 Implement specific surveys and pest surveillance @ 6 surveys/year each costing $10,000 60,000
1.3.7 Contingency for pest eradication or containment - assume $100,000 used x1 every 3 years 30,000
1.3.8 Contingency for pest management – assume $100,000 used x1 every 3 years 30,000
2.1.2 Contract delivery of 4 mass media campaigns including radio, TV, press and plant health rallies 244,360
2.2.2 Costs of inspection (travel and allowances) $200/inspector for 300 inspectors 60,000
2.2.2 Costs of testing seed samples 20,000
3.1.3 Continued employment 3 new senior posts recommended @ estimated salary of $8000/yr – from KII 24,000
3.1.3 Continued employment of 81 inspectors to maintain border posts active @ estimated salary of $4000/yr – from in KII
324,000
3.2.2. Running costs main lab 30,000
3.2.3. Running costs main greenhouses 15,000
3.2.4 Running costs of 30 border post labs @ $3000/year 90,000
3.2.6 Running costs seed lab 15,000
3.2.6 Running costs seed greenhouses 15,000
3.2.7 IT Support including Wi-Fi for 123 staff @ $1000/year 123,000
Total on-going cost per annum 2,249,678
As part of implementing the strategy, opportunities for cost recovery should therefore be identified, and for public sector bodies be included in regulations where necessary. For example, fees can be levied for services that benefit specific private sector stakeholders, such as import risk analyses, input (pesticide and seeds) registration procedures, phytosanitary export certification, inspections at farms or packhouses. Where such fees are already levied, fee rates should be reviewed and revised if necessary.
However, a more important issue may be the retention of fees by the agency providing the service. It is common for fees to be remitted to the government treasury, with the regulatory agencies then having to prepare and request annual budgets. An alternative approach is for the regulatory agencies to retain the fees they generate, and this can be a more efficient and effective approach, provided it is used within the context of good regulatory practice. This includes adhering to the provision of the WTO SPS Agreement, for example, which specifies that such fees should not exceed costs of providing the services. The Trade Facilitation Agreement also requires countries to review the number and diversity of feeds and reduce them wherever practicable. Changes to fees must also be notified with a required interval before implementation.
Apart from the payment of fees, as noted above, private sector actors can also be expected to support the strategy especially as it relates to commodity value chains that are well organised and generating substantial foreign export earnings (Table 16). Such finance would support their activities and involvement in the implementation of the plan. Another specific area in which private sector funding could be expected is in the implementation of emergency responses. As described in Output 1.1, emergency response plans should detail, as far as possible, not only who does what in the event of an emergency, but how it will be financed by the various stakeholders.
6.6.3 Way forward
The following immediate steps are recommended:
Operationalise the plant protection and plant health technical committee (A1.1.1), if not already done. This committee should be the owner of the investment strategy and take all necessary steps to ensure its implementation
Appoint a strategy implementation task-force or sub-committee. The technical committee should constitute and define terms of reference for the sub-committee. It would be composed of selected members of the technical committee plus additional staff from public and private sector organizations. The sub-committee should have the job of identifying and executing the specific tasks to implement the strategy as part of the ASSP. The ToR could include:

Platform for Agricultural Risk Management | Crop pests and disease management in Uganda: status and investment needs
89 Uganda | Tools Assessment | Full Report | March 2017
o Preparing an implementation plan, including a detailed inception phase for year 1. o Preparation of detailed budgets for specific activities, within the overall framework of the investment
strategy. o Engaging stakeholders and promoting the investment strategy o Mobilising resources. o Ensuring coordination and dovetailing of different crop protection initiatives to strengthen the plant
health system, especially externally supported ones that might have been devised or designed outside the ASSP framework.
o Providing regular reports to the technical committee
Platform for Agricultural Risk Management | Crop pests and disease management in Uganda: status and investment needs
Uganda | Tools Assessment | Full Report | March 2017 90
Bibliography
Adipala, E., Lipps, P.E. and Madden, L.V. (1993). Occurrence of Exserohilum turcicum on maize in Uganda. Plant Diseases 77: 202-205
AfDB (African Development Bank) (2015). Uganda Rural Electricity Access Project, ONEC department. 24pp http://www.afdb.org/fileadmin/uploads/afdb/Documents/Boards-Documents/Uganda-_AR-_Uganda_Rural_Electricity_Access_Project_-_09_2015.pdf
Ahmed M., 2012. Analysis of incentives and disincentives for coffee in Uganda. Technical notes series, MAFAP, FAO, Rome.
Ahmed M., Ojangole S., 2012. Analysis of incentives and disincentives for cotton in Uganda. Technical notes series, MAFAP, FAO, Rome.
Akello B. and Hillocks , R.J. (2002). Distribution and races of Xanthomonas campestris pv. malvacearum on cotton (Gossypium hirsutum) in Uganda. Journal of Phytopathology 150, 65–69.
Alacho, F.O. and Akimanzi, D.R. (1993). Progress, achievements and constraints on bacterial wilt control in Uganda. pp 32-41 In: Workshop on Bacterial wilt of potato caused by Pseudomonas solanacearum, Bujumbura, Burundi, Feb.22-26, 1993.
Alicai, T., Omogo, C.A., Maruthi, M.N., Hillocks, R.J. and Baguma, Y. (2007). Reemergence of Cassava Brown Streak Disease in Uganda. Plant Diseases, 91:24-29.
Alicai, T., Omongo, C. A., Maruthi, M.N., Hillocks, R.J., Baguma, Y., Kawuki, R., Bua, A., Otim-Nape, G.W., and Colvin, J. (2007). Re-emergence of cassava brown streak disease in Uganda. Plant Dis. 91:24-29.
Alicai, T., Omongo, C.A. and Maruthi, M.N. (2007). Re-emergence of cassava brown streak disease in Uganda. Plant Disease: 91, 1, 24–29.
Altieri, M.A. and Nicholls, C.I. (2003). Soil fertility management and insect pests: harmonizing soil and plant health in agroecosystems. Soil & Tillage Research, 72: 203–211
ASARECA (2010). Policy Brief on counterfeit and illegal plant protection products, and fake or expired seeds, and fertilizers. Association for strengthening Agricultural Research in Eastern and Central Africa (ASARECA). Entebbe, Uganda.
Asea, G., Bigirwa, G., Adipala, E., Owera, S.A.P., Pratt, R.C. and Lipps, P.E. (2002). Effect of Cercospora zeae-maydis infested maize residue on progress and spread of grey leaf spot of maize in central Uganda. Annals of Applied Biology 140: 177-185.
Bekunda M (1999). Farmers’ responses to soil fertility decline in banana-based cropping systems in Uganda. Managing Africa’s soils. No. 4, Russell Publishers, Nottingham 2
Bekunda, M, Woomer P.L (1996). Organic resources management in banana-based cropping systems of the Lake Victoria Basin, Uganda. Agric. Ecosys. Environ 59(3): 171-180.
Bannerjee S. and Abrahams, P. (2017). Harnessing ICT for Agriculture in Africa. Report to African Development Bank. In production.
Benin, S., Nkonya, E., Okecho, G., Pender, J., Nahdy, S., Mugarura, S., Kato, E. and Kayobyo, G. (2007). Assessing the Impact of the National Agricultural Advisory Services (NAADS) in the Uganda Rural Livelihoods. IFPRI Discussion Paper 00724 October 2007.
Benin, S., Nkonya, E., Okecho, G., Randriamamonjy, J., Kato, E., Lubade, G. and Kyotalimye, M. (2011). Returns to spending on agricultural extension: the case of the National Agricultural Advisory Services (NAADS) program of Uganda. Agricultural Economics 42: 249–267.
Berocan, J., Akol, A.M., Munyuli, T. (2014). Insecticide use and practices among cotton farmers in northern Uganda, Uganda Journal of Agricultural Sciences, 15 (1): 51-61
Bigirwa, G., Kaaya, A.N., Sseruwu, G., Adipala, E. and Okanya, S. (2007). Incidence and severity of maize ear rots and factors responsible for their occurrence in Uganda. Journal of Applied Sciences 7: 3780-3785.
Bigirwa, G., Sseruwu, G., Kaaya, A.N., Adipala, E. and Okanya, S. (2006) Fungal Microflora causing maize ear rots in Uganda and associated aflatoxins. Journal of Biological Sciences, 6(3):540-546
Birikunzira, J.B. (2000). Recent advances in coffee berry disease (CBD) control in Uganda. Uganda Journal of Agricultural Sciences, 5:57-60
Bonabana-Wabbi, J., Ayo, S., Mugonola, B., Taylor, D.B., Kirinya, J. and Tenywa, M. (2013). The performance of potato markets in South Western Uganda. Journal of Development and Agricultural Economics, 5(6): 225-235
Brubaker, J., Danielsen, S., Olupot, M., Romney, D. and Ochatum, N. (2013). Impact Evaluation of Plant Clinics: Teso, Uganda. CABI working paper 6, October 2013.
Bureau of Statistics in collaboration with the Ministry of Agriculture, Animal, Industry and Fisheries, Kampala. Byantwale, S. (2014). Uganda Experience of Banana Xanthomonas Wilt Control. In: E. Adenya & A. Frenken
(Eds). Proceedings of the Regional Platform on Plant pest and diseases, held in Nairobi 15 -17 April 2014. FAO
Bymolt R. (2015). The Joseph Initiative and Agricultural Transformation. Available from: http://common-fund.org/fileadmin/user_upload/Publications/Special_Publications/CFC2014_Paper_Maize.pdf
Calandro, E., Stork, C. and Gillwald, A. (2012) Internet Going Mobile: Internet access and usage in eleven African countries. [Online] Available at http://www.researchictafrica.net/presentations/Presentations/2012%20Calandro%20Stork%20Gillwald%20-%20Internet%20Going%20Mobile-

Platform for Agricultural Risk Management | Crop pests and disease management in Uganda: status and investment needs
91 Uganda | Tools Assessment | Full Report | March 2017
%20Internet%20access%20and%20usage%20in%20eleven%20African%20countries%20.pdf [Accessed 1 Aug 2016]
Calatayud, P., Le Ru, B.P., Berg, J., Schulthess, F. (2014). Ecology of the African Maize Stalk Borer, Busseola fusca (Lepidoptera: Noctuidae) with Special Reference to Insect-Plant Interactions. Insects, 5:539-563
Chell, D. G. (2013). Uganda’s Cotton and Textile Sectors: Current Production Challenges, Motivations and Effects on Development. Independent Study Project (ISP) Collection. Paper 1692.
CIA (2015). The World Factbook. [online] Available at: https://www.cia.gov/library/publications/the-world-factbook/ [Accessed13 Jan. 2015].
CIAT. 2008. Highlights CIAT in Africa. The impact of improved bush bean varieties in Uganda. CIAT, Kampala. Collings, S. (2011) Phone Charging Micro-businesses in Tanzania and Uganda. Published by GVEP
International, London, UK, 26pp Available at http://www.energy4impact.org/sites/default/files/phone_charging_businesses_report_with_gsma_final_for_web_0.pdf [Aug 1, 2016]
Danielsen, S. and Matsiko, F. (2016) Using a plant health system framework to assess plant clinic performance in Uganda. Food Security. DOI: 10.1007/s12571-015-0546-6 [PDF]
Danielsen, S., Matsiko F.B., and Kjær A.M.. (2014). "Implementing Plant Clinics in the Maelstrom of Policy Reform in Uganda." Food Security 6: (6): 807-818.
Danielsen, S., Matsiko, F.B., Mutebi, E., & Karubanga, G. (2012). Second generation plant health clinics in Uganda: Measuring clinic performance from a plant health system perspective 2010–2011. Working paper 2. Centre for Health Research and Development, Faculty of Health and Medical Sciences, University of Copenhagen, Denmark. http://curis.ku.dk/ws/files/38142206/Second_generation_plant_clinics_in_Uganda_2010_2011_Work_Paper_2.pdf.
Davis, K., Nkonya, E., Kato, E., Mekonnen, D.A., Odendo, M., Miiro, R. and Nkuba, J. (2010). Impact of Farmer Field Schools on Agricultural Productivity and Poverty in East Africa. IFPRI Discussion Paper 00992 June 2010.
Development Research and Social Policy Centre Ltd (2013). Final Report of The Uganda Communications Commission’s 2nd National Electronic Media Performance Study (2012) for Eastern and Northern Uganda regions. Available at http://www.ucc.co.ug/files/downloads/NEMPS(N&E)%20final%20report.pdf
Ejeta, G. (2007). The Striga scourge in Africa: a growing pandemic. In: Ejeta G. and Gressel J. (eds). Integrating New Technologies for Striga Control: Towards ending the witch-hunt. World Scientific Publishing Co. Pte Ltd, 5 Tol Tuck Link, Singapore, 3-16.
Elliott R. (2015). Top radio stations in Uganda, May-July – Geopoll report: http://blog.geopoll.com/top-radio-stations-in-uganda-may-july accessed 25 July 2016
FAO (2012). The international code of conduct on pest management (Revised Ed.). Rome: Food and Agriculture
Organization of the United Nations. FAO (2014) FAO Statistical Yearbook 2014. [Online] Available at: http://www.fao.org/economic/ess/ess-
publications/ess-yearbook/en/ [Accessed 13 Jan 2015] FAO (2014). The International Code of Conduct on Pesticide Management. World Health Organization Food and
Agriculture Organization of the United Nations. 52pp. E-ISBN 978-92-5-108549-3 (PDF). FAO and GoU (2015) Responding to the Challenges of Poverty, Food Insecurity and Climate Change. Country
Programming Framework 2015-19. Food and Agriculture Organization of the United Nations / Government of the Republic of Uganda 50pp
Ferris, R.S.B., Okoboi, G., Crissman, C., Ewell, P. and Lemaga, G. (2002). Uganda’s Irish Potato Sector. Report Prepared for the Government of Uganda’s Conference on Competitiveness of Selected Strategic Exports.
Flood, J. and Brayford, D. (1997). The re-emergence of Fusarium wilt of coffee in Africa. Proceedings of the International Scientific Colloquium on Coffee (ASIC) Conference. ASIC,Nairobi, Kenya. 9.
Flood, J. and Brayford, D. 1998. Fusarium wilt of coffee in Africa. Proceedings of the 7th International Congress of
Plant Pathology, Edinburgh. Gafishi K.M., Karungi, J., Asea, G. and Gibson, P. (2012). Determination of the heterotic groups of maize inbred
lines and the inheritance of their resistance to the maize weevil. African Crop Science Journal, 20(1): 99-104
Gethi, J.G., Smith, M.E., Mitchell, S.E. and Kresovich, S. (2005). Genetic diversity of Striga hermonthica and Striga asiatica population in Kenya. Weed Research, 45: 64-73.
Gold, C.S., Kagezi, G.H., Night, G., and Ragama, P.E. (2004). The effects of banana weevil, Cosmopolites sordidus damage on highland banana growth, yield and stand duration in Uganda. Annals of Applied Biology, 145 (3): 263–269.
Gold, C.S., Karamura, E.B., Kigundu, A., Bagamba, F. and Abera, M.K. (1999). Geographic shifts in the highland cooking banana (Musa spp., group AAA-EA production in Uganda. International Journal of Sustainable Development & World Ecology, 6:45-59.
Gold, C.S., Night G., Ragama, P.E., Kagezi, G.H., Tinzaara, W. and Abera, A.M.K. (2004). Field distribution of banana weevil (Cosmopolites sordidus (Germar)) adults in cooking banana stands in Uganda. Insect Science and its Application 24:242–248

Platform for Agricultural Risk Management | Crop pests and disease management in Uganda: status and investment needs
Uganda | Tools Assessment | Full Report | March 2017 92
GSMA (2009). Women & Mobile: A Global Opportunity A study on the mobile phone gender gap in low and middle-income countries. 2013. Available from: URL: http://www.gsma.com/ mobilefordevelopment/wp-content/uploads/2013/01/GSMA_Women_and_Mobile-A_Global_Opportunity.pdf
GSMA (2009). Women & Mobile: A Global Opportunity A study on the mobile phone gender gap in low and middle-income countries. 2013. Available from: URL: http://www.gsma.com/mobilefordevelopment/wp-content/uploads/2013/01/GSMA_Women_and_Mobile-A_Global_Opportunity.pdf [Accessed 1 Aug, 2016]
GSMA (2016). Agricultural Value-Added Services (Agri VAS) Tolkit 2.0 How to design, develop and market next generation VAS for the rural market. Printed by GSMA head office, London, UK. 98pp Available from: http://www.gsma.com/mobilefordevelopment/program/magri/agricultural-value-added-services-agri-vas-toolkit-2-0
Habarurema, I., Edema, R., Gibson, P., Lamo, J., Asea, G., Sere, Y., Gasore, R. (2013), Population diversity of rice bacterial leaf blight isolates in Uganda. Asian Journal of Plant Science & Research, 3(1):1-9
Haggblade, S. and Dewina, R. (2010). Variation in staple food prices: Causes, consequence, and policy options. COMMESA Policy Seminar, Maputo, Mozambique, 25-26 January 2010
Harris, L.M. Norton, G.W. Rezaul Karim A.N.M., Alwang, J. and Taylor D.B. (2013). Bridging the Information Gap with Cost-Effective Dissemination Strategies: The Case of Integrated Pest Management in Bangladesh. Journal of Agricultural and Applied Economics, 45 (4):639–654
Hillocks, R.J. (1992). Fusarium wilt. In: Hillocks RJ (ed) Cotton diseases. CAB International, Wallingford, pp 127–160
Hillocks, R.J. (2013). A century of cotton research and development in sub-Saharan Africa. Natural Resources Institute, University of Greenwich, UK, 93 pp.
Horna, D., Kyotalimye, M. and Falck-Zepeda, J. (2009). Cotton Production in Uganda: Would GM technologies be the Solution? International Association of Agricultural economists Conference, Beijing, China, August 16-22, 2009
ICEIDA (2014), Uganda Country Strategy Paper 2014-2017. http://www.iceida.is/media/pdf/Uganda_CSP_2014-2017.pdf Kroschel, J., Okonya, J.S., Juarez, H., Forbes, G., Kreuze, J., Beed, F., Blomme, G. and Legg J. (2014). Project Planning Workshop. Management of critical pests and diseases in RTB crops under changing climates, through risk assessment, surveillance and modeling.29 - 31 January, 2014, Kabale, Uganda
ICF International (2015) 2008-2013.Demographic and Health Surveys (various) [Datasets]. Calverton, Maryland IITA. Banana and Plantain. (2016). Retrieved September, from http://www.iita.org/banana Isabirye, B.E., Akol, A.M., Muyinza, H., Masembe, C., Rwomushana, I. and Nankinga, C.K. (2016) Fruit Fly
(Diptera: Tephritidae) host status and relative infestation of selected mango cultivars in three agro ecological zones in Uganda. International Journal of Fruit Science, 16(1):23-41
Jassogne, L., Van Asten, P., Laderach, P. 2012. Impact of climate change on coffee in Uganda. Lessons from a case study on Arabica coffee in the Rwenzori Mountains. Oxfam Report. Oxford, UK: Oxfam-UK; Ibadan, Nigeria: International Institute of Tropical Agriculture (IITA).
Kagezi, G.H., Kangire, A., Tushemereirwe, W., Bagamba, F., Kikulwe, E., Muhangi, J., Gold, C.S. and Ragama, P. (2006). Banana bacterial wilt incidence in Uganda. African Crop Science Journal, 14(2): 83-91
Kagezi, H., Gkucel, P., Egony, P.J., Nakibuule, L., Kobusinge, J., Ahumuza, G., Matovu, R., Nakendo, S., Luzinda, H., Musoli, C.P., Kangire, A. and Chesang, B.F. (2014). Impact of the black coffee twig borer and farmers’ coping mechanisms in Uganda. In: Proceedings of African Crop Science Conference, Vol. 11. pp. 285 – 292. ISSN 1023-070X/2013
Kagezi, H.G., Kucel, P., Egonyu, P.J., Nakibuule, L., Kobusingye, J., Ahumuza, G., Matovu, R., Nakendo, S., Luzinda, H., Musoli, C.P.., kangire, A. and Chesanga, B.F. (2013). Impact of the black coffee twig borer and farmers’ coping mechanisms in Uganda. African Crop Science Conference Proceedings, 11:285-292
Kaguongo, W., Gildemacher, P., Demo, P., Wagoire, W., Kinyae, P., Andrade, J., Forbes, G., Fuglie, K. and Thiele, G. (2008) Farmer practices and adoption of improved potato varieties in Kenya and Uganda. International Potato Center (CIP), Lima, Peru. Social Sciences Working Paper 2008-5. 85p.
Kansiime, K.M., Karanja, D.K. and Chacha, D. (2015). Common Challenges in Promoting Seed Entrepreneurship in Africa: A Case Study of Tanzania. CAB International (unpublished report).
Karamura D.A., Karamura E.B. and Tinzaara W. (editors) 2012. Banana cultivar names, synonyms and their usage in Eastern Africa, Bioversity International, Uganda.
Kashaija, I., Speijer, P.R., Gold, C.S. and Gowen, S.R. (1993). Occurrence, distribution and abundance of plant parasatic nematodes of banana inn Uganda. African Crop Science Journal, 2(1): 99-104
Kaweesi, T., Kawuki, R., Kyaligonza, V., Baguma, Y., Tusiime, G. and Ferguson, M. E. (2014). Field evaluation of selected cassava genotypes for cassava brown streak disease based on symptom expression and virus load Virology Journal , 11:216
Kiiza, B., Abele, S., and Kalyebara, R. (2004). Market opportunities for Ugandan banana products: National, regional and global perspectives, Uganda Journal of Agricultural Sciences, 9:743-749
Kijima, Y. and Sserunkuuma, D. (2013). The adoption of NERICA rice varieties at the initial stage of the diffusion process in Uganda African Journal of Agricultural and Resource, Economics, 8(1):45-56
Kroschel J., Okonya, J.S. Juarez, H., Forbes, G., Kreuze, J., Beed, F., Blomme, G., and Legg J. (2014) Management of critical pests and diseases in RTB crops under changing climates, through risk

Platform for Agricultural Risk Management | Crop pests and disease management in Uganda: status and investment needs
93 Uganda | Tools Assessment | Full Report | March 2017
assessment, surveillance and modeling: RTB Workshop Report, Kabale, Uganda 29-31 Jan 2014. CGIAR Research Program on Roots, Tubers & Bananas. Available online at: www.rtb.cgiar.org
Kubiriba, J., Karamura, E.B., Jogo, W., Tushemereirwe, W.K. and Tinzaara W. (2012). Community mobilization: A key to effective control of banana Xanthomonas wilt. Journal of Development and Agricultural Economics, 4(5): 125-131
Kumakech, A., Acipa, A., Tumwine, V. and Maiteki, G.A. (2013). Knowledge on cassava disease management: The case of cassava brown streak disease awareness in Northern Uganda. African Journal of Plant Science, 7(12):597-601.
Land, T., Hauck, V., Baser, H. 2009. Capacity development: Between planned interventions and emergent processes. (Policy Management Brief 22). Maastricht: ECDPM. http://ecdpm.org/publications/capacity-development-planned-interventions-emergent-processes/
Legg, J.P. and Thresh, J.M. (2000). Cassava mosaic virus disease in East Africa: a dynamic disease in a changing environment. Virus Research, 71 (2000) 135–149
Lemaga, B., Kanzikwera, R.C., Kakuhenzire, R. Hakiza,J.J. and Manzi, G. (2001) The effect of crop rotation on bacterial wilt incidence and potato tuber yield. African Crop Science Journal, 9, 257–266
Luzinda, H., Nelima, M., H., Wabomba, A., Kangire, A., Musoli, P.C. and Musebe R. (2015). Farmer awareness, coping mechanisms and economic implications of coffee leaf rust disease in Uganda. Uganda Journal of Agricultural Sciences, 16 (2): 207-217
MAAIF (2010). Agriculture Sector Development Strategy and Investment Plan: 2010/11-2014/15. Ministry of Agriculture, Animal Industry and Fisheries, Entebbe Uganda. July, 2010.
MAAIF (2014). Pest Management Plan. Ministry of Agriculture Animal Industry and Fisheries. Kampala, Uganda. MAAIF (2015a). Policy Statement for the Ministry of Agriculture, Animal Industry and Fisheries Votes
010/121/125/142/152/155/160/501-850 for the Financial Year 2015/16. MAAIF (2015a). Review of the Agriculture Sector Development Strategy and Investment Plan 2010/11 - 2014/15.
Pests & Disease Control Thematic Area. Ministry of Agriculture, Animal Industry and Fisheries, Entebbe Uganda. March 2015.
MAAIF (2015b) Agriculture sector development plan 2014/16-2019/20: The revised/new FIP aligned to SIP for the agricultural statistics, ICT and agricultural risk management (Draft plan shared with team confidentially)
Matama-Kauma, T., Schulthess, F., Ogwang, J. A., Mueke, J. M., Omwega, C. O. (2007). Distribution and relative importance of lepidopteran cereal stemborers and their parasitoids in Uganda. Phytoparasitica, 35:27-36
Matovu R.J., Kangire A., Phiri N.A., Hakiza G.J., Kagezi G.H. and Musoli P.C., (2013). Ecological factors influencing incidence and severity of Coffee Leaf Rust and Coffee Berry Disease in major Arabica coffee growing districts of Uganda. Uganda Journal of Agricultural Sciences, 2013, 14 (1): 87 – 100
MDRAT. 2012. The Status of Maize Lethal Necrosis Disease and General Maize Performance in Kenya. Multi-Disciplinary Rapid Assessment Team, Ministry of Agriculture, Kenya.
Mukalazi, J., Adipala, E., Sengooba, T., Hakiza, J.J., Olanya, M., Kidanemariam, H.M. (2001). Metalaxyl resistance, mating type and pathogenicity of Phytophthora infestans in Uganda. Crop Protection, 20(5): 379-388.
Mulema, J.M.K., Adipala, E. and Olanya, O.M. (2005). Significance of tuber blight in late blight epidemics in Uganda. African Crop Science Society Proceedings, 6:329-334.
Nabbumba R. and Bahiigwa, G. (2003). Agricultural productivity constraints in Uganda: implications for investment. Economic Policy Research Centre, Research, Series No.31
Nankinga C. and Okasaai, O. (2005). Community approaches used in managing BXW in Uganda. In Karamura, E., Osiru, M., Blomme, G., Lusty, C. and Picq, C. (Eds). Developing a regional strategy to address the outbreak of banana Xanthomonas wit in East and Central Africa. Proceedings of the banana Xanthomonas wilt regional preparedness workshop held in Kampala, Uganda, 14-18 February 2005
Nankinga, C.M., Isabirye, B.E., Muyinza, H., Rwomushana, I., Stevenson, P.C., Mayamba, A., Aool, W. and Akol, A.M. (2014). Fruit fly infestation in mango: A threat to the Horticultural sector in Uganda. Uganda Journal of Agricultural Sciences, 15(1):1-14
Nkalubo, S., Melis, R., Laing, M.D. and Opio, F. (2007). Yield loss associated with anthracnose disease on Uganda market-class dry bean cultivars. African Crop Science Conference Proceedings, 8:869-874
Nyende P. (2015) Sourcing from smallholders. Case study format. AgriNet Uganda Ltd. Available from: https://africaagribusinessacademy.files.wordpress.com/2015/11/case-study-agrinet-uganda-ltd.pdf
Ochola D., Issaka S., Rakotomalala M., Pinel-Galzi A., Ndikumana I., Hubert J., Hébrard E., Séré Y., Tusiime G., Fargette D. (2015). Emergence of rice yellow mottle virus in eastern Uganda: Recent and singular interplay between strains in East Africa and in Madagascar. Virus Research, 195:64-72.
Ochwo, M.K.N., Kamoun, S., Adipala, E., Rubayihayo, P.R., Lamour, K. and Olanya M. (2002). Genetic diversity of Phytophthora infestans (Mont.) de Bary in the eastern and eestern Highlands of Uganda. Journal of Phytopathology, 150:541-524
Okech, S.H.O., Gold, C.S., Abele, S., Nankinga, C.M., Wetala, P.M., van Asten, P. and Nambuye, A. and Ragama, P. (2004). Agronomic, pests and economic factors influencing sustainability of banana-coffee systems of Western Uganda and potentials for improvement. Uganda Journal of Agricultural sciences, 9:415-427

Platform for Agricultural Risk Management | Crop pests and disease management in Uganda: status and investment needs
Uganda | Tools Assessment | Full Report | March 2017 94
Okoboi, G. (2010). Of what merit is improved inputs use in Uganda’s maize productivity? Joint 3rd
African Association of Agricultural Economists (AAAE) and 48
th Agricultural Economists Association of South
Africa (AEASA) Conference, Cape Town, South Africa, September 19-23, 2010 Okori, P., Fahleson, J., Rubaihayo, P.R., Adipala, E. and Dixelius, C. (2003). Assessment of genetic variation
among east African cercospora zeae-maydis populations. African Crop Science Journal 11: 75-85. Olupot J.R, D.S.O. Osiru, J. Oryokot and B. Gebrekidan, 1999. Development of an integrated striga management
strategy for Ugandan conditions. 17th East African Biennial Weed Science conference proceedings, pp. 131-136.
Onaga, G. and Asea, G. (2016). Occurrence of rice blast (Magnaporthe oryzae) and identification of potential resistance sources in Uganda. Crop Protection, 80:65-72.
Opio, F., Ugen, M.A., Kyamanywa, S., David, S., Mugisa-Mutetikka, M. (2001): Beans. P.162-191. In J.K. Mukiibi (ed.) Agriculture in Uganda: Crops II, Fountain Publishers, Kampala.
Osiru, D. 2006. FAO transboundary agro-ecosystem management program (TAMP): A report on crop/farming systems and PARA. Food and Agriculture Organization of the United Nations (FAO), Rome, Italy.
Osiru, S.O. (2014). Climate-smart agriculture report on comprehensive scoping and assessment study in Uganda Otim-Nape, G.W. & Zziwa, S. 1990. Cassava as a major staple food crop in Uganda. Working Paper No. 1.
Collaborative study of Cassava in Africa. Namulonge Research station, Kampala, Uganda. Otim-Nape, G.W. (1980). Cassava Bacterial Blight in Uganda. Tropical Pest Management, 26:3, 274-277, DOI:
10.1080/09670878009414412 Otim-Nape, G.W. and Sengooba, T. (1980). Cassava Bacterial Blight in Uganda. In Terry E.R., A.K. Oduro and F.
Caveness, (Eds.). Tropical Root Crops. Proceeding, 1st Symposium of the international society for the Tropical Root Crops, Africa Branch (ISTRC-AB) Ibadan, Nigeria.pp.61-65.
Pamela, P. Mawejje, D. and Ugen, M. (2014). Severity of angular leaf spot and rust diseases on common beans in Central Uganda. Uganda Journal of Agricultural Sciences, 15:63-72
Paparu, P., Katafiire, M. Mcharo, M. and Ugen, M. 2014. Evaluation of fungicide application rates, spray schedules and alternative management options for rust and angular leaf spot of snap beans in Uganda. International Journal of Pest Management 60(1):82-89.
Parizat, R., Hilten, J., Wunderlich, C., Nsibirwa, R. (2011). Ugandan coffee supply chain risk assessment. Washington D. C; World Bank.
PARM (Platform for Agricultural Risk Management) (2016) Agricultural risk assessment study, Uganda. IFAD PARM (Platform for Agricultural Risk Management) (2017). Information Systems for Agricultural Risk
Management. IFAD Pastor-Corrales, M.A. (1995). Enfermedades del frijol causadas por hongos. In: Lopez, M.,Fernadez, F. and
Schoonhoven, A. (eds). FRIJOL: Investigacion y Produccion Pp 172-180. PNUD-Centro Internacional de Agricultura Tropical, (CIAT). Cali, Columbia
Perkins K, Ward D. and Leclair M. (2011) Participatory Radio Campaigns and food security. How radio can help farmers make informed decisions. African Farm Radio Research Initiatives. Available from: URL http://bit.ly/farmradioprc
Phiri and Baker (2009) Phiri, N. and Baker, P. (2009). Coffee wilt in Africa: Final Technical Report of the Regional Coffee Wilt Program
(2000-2007). 233pp. Plan for Modernization of Agriculture (PMA). 2009. Cotton Value Chain Study in Lango and Acholi Subregions.
PMA Secretariat. MAAIF. Kampala. Plantwise (2016). ICT for Agriculture (ICT4AG) Stakeholders’ Workshop. 7-8th July, July 2016, Protea Hotel,
Kololo, July 2016. Currently internal report Poushter J and Stewart R. (2016) Smartphone Ownership and Internet Usage Continues to Climb in Emerging
Economies. Pew Research Center, February, 2016 Available from: http://www.pewglobal.org/2016/02/22/smartphone-ownership-and-internet-usage-continues-to-climb-in-emerging-economies/ [Accessed 31 July 2016]
Pratt, C.F., Constantine, K.L. and Murphy, S.T (2016). Estimation of the economic impact of invasive alien species on smallholder livelihoods: the case of mixed maize farming in eastern Africa (In Press)
Roberts, C.; Azzarri, C. (2014) "Uganda Agricultural Snapshot 2009/10," HarvestChoice - International Food Policy Research Institute (IFPRI).Rutherford, M. A. 2006. Current knowledge of coffee wilt disease, a major constraint to coffee production in Africa. Phytopathology 96:663-666.
Rukazambuga, N., Gold, C.S. and Gowen, S.R. 1998. Yield loss in East African highland banana (Musa spp., AAA-EA group) caused by the banana weevil, Cosmopolites sordidus Germar. Crop Protection 17:581-589.
Rwakakamba, M. (2012). Fixing Uganda's Extension System. Global Forum on Food Security and Nutrition.Available: http://www.fao.org/fsnforum/forum/have-your-say/fixing-ugandas-extension-system
Rwakakamba, M. (2012). Fixing Uganda's Extension System. Global Forum on Food Security and Nutrition.Available: http://www.fao.org/fsnforum/forum/have-your-say/fixing-ugandas-extension-system
Sabune, J. (2005). The Cotton Sector in Uganda: Progress made and recommendations for achieving further progress. 64th Plenary Meeting of the IACC, Liverpool, United Kingdom, 25-30 September 2005
Settle, W.; Hama Garba, M. Sustainable crop production intensification in the Senegal and Niger River Basins of francophone West Africa. International Journal of Agricultural Sustainability, 9: 171–185.
Platform for Agricultural Risk Management | Crop pests and disease management in Uganda: status and investment needs
95 Uganda | Tools Assessment | Full Report | March 2017
Settumba, M. (2012). Advances in cassava research in management of Cassava Brown Streak Virus Disease in Uganda . In: Proceedings of 3
rd RUFORUM Biennial Meeting 24 - 28 September 2012, Entebbe,
Uganda Silva, M.C., Varzea, V., Guimaraes, L.G., Azinheira, H.G., Fernandez, D., Petitot, A.S., Lashermes, P., Nicole, M.
and Bertrand, B. (2006). Coffee resistance to the main diseases: Leaf rust and coffee berry disease. Brazilian Journal of Plant physiology, 18 (1):119-147.
Sones, K.R., Oduor, G.I., Watiti, J.W. and Romney, D. (2015) Communicating with smallholder farming families - a review with a focus on agro-dealers and youth as intermediaries in sub-Saharan Africa. CAB Reviews 10(030), 1–6.
Sones, K.R., Oduor, G.I., Watiti, J.W. and Romney, D. (2015) Communicating with smallholder farming families - a review with a focus on agro-dealers and youth as intermediaries in sub-Saharan Africa. CAB Reviews 10(030), 1–6.
Soniia D, (2003). Growing beans in the city: a case study in Kampala, Uganda. Network on Bean Research in Africa, Occasional Publications Series, No. 39. CIAT, Kampala, Uganda
Soniia, D., Kirkby, R. and Kasozi, S. (1997). Assessing the impact of bush bean varieties on poverty reduction in Sub-Saharan Africa: evidence from Uganda. Occasional Publication Series, N0. 31.
Tumuhaise V., Khamis, F.M., Agona, A., Sseruwu, G. and Mohamed S.A. (2016). First Record of Tuta absoluta (Lepidoptera: Gelechiidae) in Uganda. International Journal of Tropical Insect Science, 36(3): 135-139
Tushemereirwe W. (1996). Factors influencing expression of leaf spot diseases of highland bananas in Uganda. PhD Thesis, University of Reading, UK.
Tushemereirwe, W.K. Holderness, M., Gold, C.S. and Deadman, M. (2000). Effects of the leaf spot complex and leaf pruning on growth and yield in highland banana. Results of the first ratoon crop. Acta Horticulture, 450:335-341
Tushemereirwe, W.K., Kangire, A., Kubiriba, J. Nakyanzi, M. and Gold, C. S. (2004). Diseases threatening banana biodiversity in Uganda. African Crop Science Journal 12(1):19-26
UBOS [Uganda Bureau of Statistics] (2010) Uganda Census of Agriculture 2008/2009. Volume 1, Summary Report. Uganda Bureau of Statistics in collaboration with the Ministry of Agriculture, Animal, Industry and Fisheries, Kampala.
UBOS [Uganda Bureau of Statistics] (2010) Uganda Census of Agriculture 2008/2009. Volume 1, Summary Report. Uganda
UBOS [Uganda Bureau of Statistics] (2010). Uganda Bureau of Statistics 2010, Summary Report on Uganda Census of Agriculture 2008/09
UBOS [Uganda Bureau of Statistics] (2016). The National Population and Housing Census 2014 – Main Report, Kampala, Uganda
UNDP (2008) Practice note: Capacity Development, 30 pp. http://www.unpcdc.org/media/8651/pn_capacity_development.pdf
UNICEF (2015) State of the World’s Children 2015 Country Statistical tables Available at: http://www.unicef.org/infobycountry/uganda_statistics.html
Waddington, H. and White, H. (2014).Farmer field schools: From agricultural extension to adult education. Systematic review 1. International Initiative for Impact Evaluation. March 2014.
Waibel, H. (1991). Pesticide subsidies in Southeast Asia. FAO Plant Protection Bulletin, 38(2), 111–120. Western Australian Agriculture Authority (WAAA) 2015. Invasive Species Plan for Western Australia 2015-2019,
75pp World Bank (2015). Project appraisal document on a proposed credit in the amount of SDR 106.4 (US$150
million equivalent) to the Republic of Uganda for an agriculture cluster development project. March 16, 2015. http://documents.worldbank.org/curated/en/655571468167071274/pdf/PAD9860PAD0P14010Box385454B00OUO090.pdf
Wortmann, C.S., Kirkby, R.A., Eledu, C.A. and Allen, D.J. (1998). Atlas of common bean (Phaseolus vulgaris L.) production in Africa, CIAT, Cali, Colombia. 133pp.
Wright H.J., Ochilo W., Pearson A., Finegold C., Oronje M., Wanjohi J., Kamau R., Holmes T. & Rumsey A. (2016) Using ICT to Strengthen Agricultural Extension Systems for Plant Health. Journal of Agricultural & Food Information 17 (1): 23-36, DOI:10.1080/10496505.2015.1120214

Uganda | Tools Assessment | Full Report | March 2017 96
Platform for Agricultural Risk Management | Crop pests and disease management in Uganda: status and investment needs
Ap
pe
nd
ices
Ap
pen
dix
1: O
ver
view
of
som
e o
f in
itia
tiv
es i
n U
gan
da
usi
ng
ICT
to
su
pp
ort
in
itia
tiv
es/p
rov
ide
serv
ices
S
om
e o
f in
form
atio
n is s
ou
rced
fro
m a
me
etin
g w
ith
IC
T4
AG
acto
rs r
un
by P
lan
twis
e in
July
, w
ith
ad
ditio
na
l in
form
ation
fro
m a
re
vie
w o
f th
e lite
ratu
re.
Ser
vice
nam
e/
(Org
aniz
atio
n)
Tar
get
au
die
nce
N
um
ber
of
sub
scri
ber
s T
ype
of
info
rmat
ion
W
ho
pay
s?
Des
crip
tio
n
INF
OT
RA
DE
(F
IT (
U)
LTD
) P
latf
orm
s: A
GM
IS
FA
RM
IS
Far
mer
s,
Tra
ders
18
,000
m
arke
t inf
orm
atio
n,
agric
ultu
ral e
xten
sion
, w
eath
er in
form
atio
n
Far
mer
s, T
rade
rs,
Con
greg
atin
g or
gani
zatio
ns
An
inte
grat
ed IC
T p
latfo
rm (
INF
OT
RA
DE
) pr
ovid
ing
mar
ket d
ata
and
farm
man
agem
ent m
odul
es.
AG
MIS
allo
ws
sing
le
acce
ss to
rea
l tim
e ag
ricul
tura
l mar
ket d
ata
thro
ugh
the
inte
rnet
and
the
mob
ile p
hone
[SM
S].
The
pla
tform
focu
sses
on
pric
es o
f inp
uts
and
crop
s, b
ut w
ill a
lso
be c
over
ing
the
quan
titie
s so
ld s
oon.
FA
RM
IS is
a fa
rm m
anag
emen
t sys
tem
for
farm
ers
to m
anag
e la
nd p
lant
ed, s
eeds
bou
ght e
tc
AG
-FIN
(M
ercy
Cor
ps
Uga
nda)
P
latf
orm
s: A
GM
IS
FA
RM
IS
Bey
onic
M
OB
IS
Far
mer
s an
d T
rade
rs
400,
000
wea
ther
, pric
es a
nd
brea
k of
pric
es (
mar
ket)
; fin
anci
al li
tera
cy
SA
CC
Os,
Don
or
part
ners
, Tru
Tra
de
(Tra
der)
The
Agr
i-Fin
Mob
ile p
rogr
am a
ppro
ach
wor
ks w
ith p
artn
ers
to b
uild
sus
tain
able
mod
els,
whe
re fa
rm a
nd c
rop
man
agem
ent t
ools
and
fina
ncia
l ser
vice
s ar
e "b
undl
ed"
in a
fford
able
, uni
fied
plat
form
s on
mob
ile p
hone
cha
nnel
s to
pr
omot
e m
ass
upta
ke c
omm
erci
ally
. The
pro
gram
wor
ks w
ith m
obile
net
wor
k op
erat
ors
(MN
O)
and;
par
tner
s w
ith
exis
ting
finan
cial
and
agr
icul
tura
l tec
hnic
al s
ervi
ce m
obile
pla
tform
s or
app
licat
ions
, or
dem
onst
rate
d in
tere
st in
de
velo
ping
and
inve
stin
g in
them
. Pla
tform
s in
clud
e A
GM
IS, F
AR
MIS
, MO
BIS
and
the
Bey
onic
pla
tform
for
mob
ile
mon
ey. A
gri-F
in fa
cilit
ates
dev
elop
men
t of a
bus
ines
s m
odel
whe
reby
the
bund
ling
proc
ess
prov
ides
an
incr
ease
d va
lue
prop
ositi
on fo
r ea
ch p
artn
er, s
uch
as, i
ncre
ased
fee
inco
me,
gre
ater
out
reac
h or
red
uced
ris
ks.
(G
ram
een
Fou
ndat
ion)
F
arm
ers
> 3
00,0
00
Agr
icul
ture
and
mar
ket
info
rmat
ion,
wea
ther
etc
D
onor
s G
ram
een
Fou
ndat
ion
laun
ched
its
mob
ile te
chno
logy
wor
k in
Uga
nda
in 2
002
with
“V
illag
e P
hone
” an
d it
rem
ains
a h
ub
for
man
y of
thei
r m
obile
-bas
ed in
itiat
ives
. The
ir C
omm
unity
Kno
wle
dge
Wor
ker
initi
ativ
e co
mbi
nes
mob
ile te
chno
logy
and
hu
man
net
wor
ks (
thro
ugh
peer
s) to
giv
e sm
allh
olde
r fa
rmer
s ac
cess
to a
ccur
ate,
tim
ely
info
rmat
ion
that
hel
ps th
em
prot
ect t
heir
crop
s an
d an
imal
s, im
prov
e th
eir
yiel
ds a
nd g
et b
ette
r m
arke
t pric
es. T
hrou
gh th
eir
App
Lab
Incu
bato
r an
d M
obile
Fin
anci
al S
ervi
ces
Acc
eler
ator
initi
ativ
es th
ey a
re te
stin
g an
d sc
alin
g ne
xt-g
ener
atio
n pr
oduc
ts a
nd s
ervi
ces
tailo
red
for
the
poor
and
bui
ldin
g a
plat
form
to d
eliv
er th
e m
ost v
iabl
e of
ferin
gs.
AG
RI-
NE
T
(TR
UT
RA
DE
fr
anch
isee
)
Far
mer
s A
ppx
2000
fa
rmer
s (1
500
selli
ng s
oya;
50
0 ot
her
grai
ns
Mar
ket p
rices
F
arm
ers
pay
12,0
00
pcm
for
serv
ices
A
griN
et o
ffer
mar
ket p
rices
via
an
SM
S s
ervi
ce, a
s w
ell a
s a
varie
ty o
f non
-mob
ile b
ased
agr
icul
tura
l ser
vice
s in
clud
ing
proc
essi
ng a
nd b
roke
rage
(lin
king
buy
ers
and
selle
rs a
nd s
uppo
rtin
g tr
ansa
ctio
ns, i
nclu
ding
ver
ifica
tion
of q
ualit
y an
d qu
antit
y of
ord
ers)
. Inf
orm
atio
n is
pro
vide
d th
roug
h S
MS
(3
SM
S s
ent p
er w
eek)
, inf
o bo
ards
, e-m
ails
, new
slet
ters
and
lo
cal F
M r
adio
Kub
ere
Info
rmat
ion
Cen
tre
(KIC
) (W
omen
of
Uga
nda
Net
wor
k (W
OU
GN
ET
))
Wom
en fa
rmer
s >
360
wom
en
farm
ers
Mar
ket i
nfor
mat
ion,
bes
t pr
actic
es
Don
ors
Wom
en o
f Uga
nda
Net
wor
k (W
OU
GN
ET
) is
an
NG
O in
itiat
ed in
May
200
0 by
sev
eral
wom
en's
org
aniz
atio
ns in
Uga
nda
to d
evel
op th
e us
e of
info
rmat
ion
and
com
mun
icat
ion
tech
nolo
gies
(IC
Ts)
am
ong
wom
en a
s to
ols
to s
hare
info
rmat
ion
and
addr
ess
issu
es c
olle
ctiv
ely.
Whi
le th
ey e
mph
asis
e in
tern
et te
chno
logi
es, t
hey
also
look
to s
ee h
ow th
ese
tech
nolo
gies
can
be
inte
grat
ed w
ith r
adio
, vid
eo, t
elev
isio
n an
d pr
int m
edia
. The
goa
l is
to im
prov
e co
nditi
ons
of li
fe fo
r w
omen
by
enha
ncin
g ca
paci
ties
and
oppo
rtun
ities
for
exch
ange
, col
labo
ratio
n an
d in
form
atio
n sh
arin
g.
The
y m
anag
e th
e K
uber
e In
form
atio
n C
entr
e (K
IC),
a m
ulti-
dim
ensi
onal
info
rmat
ion
cent
re o
fferin
g de
velo
pmen
t-or
ient
ed
info
rmat
ion,
em
phas
ing
agric
ultu
ral a
nd r
ural
dev
elop
men
t inf
orm
atio
n fo
r ru
ral w
omen
farm
ers
in A
pac
Dis
tric
t. It
now
se
rves
as
the
base
for
WO
UG
NE
T p
roje
ct a
ctiv
ities
in 5
mor
e di
stric
ts o
f Am
uru,
Gul
u, K
ole,
Lira
and
Oya
m.
(Bey
onic
)
Far
mer
s,
Tra
ders
P
artn
ers
Mob
ile m
oney
tran
sact
ion
supp
ort.
Bey
onic
, whi
ch c
urre
ntly
ope
rate
s in
Uga
nda
and
Ken
ya, p
artn
ers
with
mob
ile
netw
ork
oper
ator
s an
d di
gita
l fin
anci
al s
ervi
ce p
rovi
ders
to a
llow
bus
ines
ses
to m
ake
and
trac
k m
obile
mon
ey p
aym
ents
on
a s
ingl
e pl
atfo
rm r
egar
dles
s of
car
rier

Platform for Agricultural Risk Management | Crop pests and disease management in Uganda: status and investment needs
97 Uganda | Tools Assessment | Full Report | March 2017
Ser
vice
nam
e/
(Org
aniz
atio
n)
Tar
get
au
die
nce
N
um
ber
of
sub
scri
ber
s T
ype
of
info
rmat
ion
W
ho
pay
s?
Des
crip
tio
n
MO
BIS
(E
nsib
uuko
) S
AC
CO
S
Par
tner
s F
inan
cial
rec
ord
keep
ing.
MO
BIS
is a
rob
ust c
ore
-ban
king
sof
twar
e th
at e
nabl
es r
ural
-bas
ed fi
nanc
ial i
nstit
utio
ns to
m
anag
e in
form
atio
n an
d re
port
ing;
whi
le e
ffici
ently
del
iver
ing
finan
cial
ser
vice
s on
a m
obile
wal
let
MO
BIS
is d
esig
ned
to e
nabl
e th
e di
gita
lisat
ion
at th
e S
AC
CO
leve
l of t
heir
finan
cial
rec
ord
keep
ing
and
mem
bers
hip
man
agem
ent t
here
by b
ringi
ng m
ore
tran
spar
ency
and
effe
ctiv
e m
anag
emen
t of f
unds
and
spe
edy
tran
sact
ions
whi
le
putti
ng S
AC
CO
s at
the
sam
e le
vel a
s re
gula
ted
bank
s.
Key
Fea
ture
s in
clud
e:
-
Inte
grat
ed a
ccou
ntin
g
- R
eal-t
ime
inte
r-br
anch
con
nect
ivity
- M
obile
VS
LA w
alle
t
- E
nhan
ced
clou
d st
orag
e an
d se
curit
y
- S
MS
ale
rts
and
finan
cial
lite
racy
con
tent
Gut
sind
a D
evel
opm
ent
Gro
up
Far
mer
s,
Ext
ensi
on
wor
kers
, co
oper
ativ
es
and
part
ners
6 pa
rtne
rs;
14,0
00 fa
rmer
s A
gric
ultu
ral e
xten
sion
, cr
op c
ondi
tions
P
artn
ers
Pro
vide
ICT
sol
utio
ns in
clud
ing:
e-e
xten
sion
and
dat
a co
llect
ion
and
savi
ng s
olut
ions
on
the
mob
ile p
hone
. Gut
sind
a bu
ilt
the
Kul
ima
Con
tent
Pla
tform
to d
isse
min
ate
info
rmat
ion
and
faci
litat
e kn
owle
dge
tran
sfer
. The
Kul
ima
appl
icat
ion
feat
ures
an
agric
ultu
ral l
ibra
ry w
ith in
form
atio
n on
org
anic
and
non
-org
anic
farm
ing
tech
niqu
es, a
cros
s di
ffere
nt v
alue
ch
ains
. The
dat
abas
e de
scrib
es B
est A
gric
ultu
ral P
ract
ices
for
prod
uctio
n an
d po
st-h
arve
st h
andl
ing,
info
rmat
ion
on
com
mon
pes
ts a
nd d
isea
ses
and
stra
tegi
es to
com
bat t
hem
, and
rec
omm
enda
tions
bas
ed o
n lo
cal k
now
ledg
e an
d tr
aditi
onal
agr
icul
tura
l pra
ctic
es. T
he p
latfo
rm in
tegr
ates
imag
e an
d vo
ice
capt
ure
to a
ssis
t in
diag
nosi
ng p
robl
ems
and
expl
aini
ng p
ract
ical
sol
utio
ns.
G
utsi
nda
wor
ks w
ith p
artn
ers
to p
acka
ge in
form
atio
n fo
r de
liver
y ov
er m
obile
pho
nes,
usi
ng s
impl
e la
ngua
ge, p
hoto
s,
and
othe
r de
sign
ele
men
ts to
impr
ove
usab
ility
.
Mob
ile s
urve
ys u
sing
a d
ata
colle
ctio
n to
ol a
re d
esig
ned
with
par
tner
s to
enh
ance
thei
r M
&E
sys
tem
s. B
y pa
iring
te
chno
logy
with
a h
uman
net
wor
k of
Vill
age
Ent
erpr
ise
agen
ts, t
hey
help
par
tner
s ex
tend
thei
r re
ach,
incr
ease
the
freq
uenc
y of
inte
ract
ions
with
targ
et g
roup
s, a
nd c
olle
ct in
sigh
ts th
at a
llow
for
mid
-cou
rse
corr
ectio
n. T
hey
aim
to
acce
lera
te p
artn
ers
impa
ct m
easu
rem
ent a
nd im
prov
e re
turn
s on
inve
stm
ent.
(F
AR
MG
AIN
)
F
arm
gain
Afr
ica
is c
urre
ntly
run
ning
an
agric
ultu
ral m
arke
t inf
orm
atio
n se
rvic
e fo
r co
mm
oditi
es p
rodu
ced
in U
gand
a an
d th
is s
yste
m is
link
ed to
mar
ket i
ntel
ligen
ce n
etw
orks
with
in th
e E
ast A
fric
an r
egio
n. F
arm
gain
Afr
ica
Ltd
boas
ts o
f am
ple
know
ledg
e an
d sk
ills
in th
e fu
nctio
ning
agr
o-c
omm
odity
mar
kets
in th
e re
gion
due
to it
s in
volv
emen
t in
mar
ket
info
rmat
ion
syst
ems
Pla
ntw
ise
(CA
BI)
E
xten
sion
, fa
rmer
s
3,50
0 re
cord
ed
user
s –
not a
ll us
e re
cord
ed
Mai
nly
on c
rop
pest
s an
d di
seas
es b
ut c
over
s an
y cr
op a
ny p
robl
em
Don
or –
with
loca
l go
vern
men
ts a
nd
MA
AIF
taki
ng o
ver
resp
onsi
bilit
y
Pla
ntw
ise
(PW
) op
erat
es th
roug
h a
netw
ork
of n
atio
nally
ope
rate
d pl
ant c
linic
s, h
eld
in p
ublic
pla
ces
and
man
aged
by
Loca
l Gov
ernm
ent,
NG
Os
and
othe
r pa
rtne
rs. T
rain
ed p
lant
doc
tors
ans
wer
farm
ers
ques
tions
and
giv
e ad
vice
. A
n op
en
acce
ss w
eb-b
ased
dat
abas
e, th
e K
now
ledg
e B
ank,
pro
vide
s ac
cess
to in
form
atio
n on
pes
ts a
nd d
isea
ses.
A fa
ctsh
eet
app
deliv
ers
info
rmat
ion
to a
ndro
id p
hone
s. U
se o
f tab
lets
at c
linic
s to
col
lect
da
ta e
lect
roni
cally
on
crop
pro
blem
s br
ough
t, di
agno
sis
and
reco
mm
enda
tion
is b
eing
intr
oduc
ed
JI T
echn
olog
y P
latfo
rm
“Gra
ins
Cha
in”
(Jos
eph
Initi
ativ
e)
Jose
ph v
illag
e ag
ents
, far
mer
s
15,0
00 s
uppl
ied
JI in
201
4 w
ith
50,0
00 e
xpec
ted
in 2
015
Info
rmat
ion
on v
alue
ch
ain
tran
sact
ions
C
osts
cov
ered
by
the
busi
ness
(gr
ain
trad
ing)
The
cus
tom
ised
sof
twar
e ‘G
rain
s C
hain
’ is
desi
gned
to r
un o
n sm
artp
hone
s an
d ta
blet
s in
the
field
. It a
llow
s JI
to u
pdat
e pr
ices
, tra
ck tr
ansa
ctio
ns w
ith s
mal
lhol
ders
, mon
itor
inve
ntor
y ac
ross
all
60 J
osep
h C
entr
es, m
onito
r st
ocks
in th
e JI
pr
oces
sing
and
sto
rage
faci
lity,
and
qui
ckly
com
pile
com
pany
rep
orts
for
anal
ysis
. Whe
n fa
rmer
s br
ing
thei
r m
aize
to th
e Jo
seph
Cen
tre
for
the
first
tim
e th
ey a
re r
egis
tere
d in
the
syst
em o
n sm
artp
hone
s. T
he p
urch
ase
orde
r in
clud
es th
e nu
mbe
r of
kilo
gram
s so
ld, t
he m
oist
ure
cont
ent o
f the
mai
ze (
as m
easu
red
with
moi
stur
e m
eter
s on
site
) an
d se
vera
l ot
her
data
poi
nts.
The
sof
twar
e th
en c
alcu
late
s ho
w m
uch
the
farm
er s
houl
d be
pai
d ba
sed
on th
e nu
mbe
r of
bag
s, th
e cu
rren
t mar
ket p
rice,
and
the
mai
ze q
ualit
y (p
artic
ular
ly r
elat
ing
to a
low
moi
stur
e co
nten
t).T
he J
osep
h In
itiat
ive’
s su
pply
ne
twor
k is
coo
rdin
ated
ent
irely
on
the
Jose
ph In
itiat
ive
Tec
hnol
ogy
Pla
tform
. JI i
s no
w r
apid
ly in
tegr
atin
g ad
vanc
ed
man
agem
ent p
ract
ices
incl
udin
g m
obile
pay
men
ts, f
orw
ard
cont
ract
ing
capa
bilit
ies,
and
bio
met
ric id
entif
icat
ion
FE
WS
NE
T
Nat
iona
l de
cisi
on m
aker
s in
Uga
nda
and
othe
r A
fric
an
coun
trie
s
M
onito
rs v
eget
atio
n co
nditi
on a
nd r
ainf
all,
loca
lized
dat
a su
ch a
s fo
od p
rices
US
AID
FtF
pro
gram
F
EW
SN
ET
ana
lyst
s, w
orki
ng in
mor
e th
an 3
5 co
untr
ies,
con
tinuo
usly
gat
her
evid
ence
of t
he c
urre
nt fo
od s
ecur
ity
situ
atio
n in
are
as o
f con
cern
. The
y co
llect
dat
a fr
om a
var
iety
of s
ourc
es, i
nclu
ding
US
sci
ence
age
ncie
s, n
atio
nal
min
istr
ies
of tr
ade
and
agric
ultu
re, i
nter
natio
nal o
rgan
izat
ions
, and
NG
Os.
NA
SA
and
NO
AA
col
lect
and
pro
cess
sat
ellit
e da
ta th
at a
re u
sed
to m
onito
r th
e ve
geta
tion
cond
ition
(N
orm
aliz
ed D
iffer
ence
Veg
etat
ion
Inde
x, o
r N
DV
I) a
nd r
ainf
all
(Rai
nFal
l Est
imat
e, o
r R
FE
) ac
ross
the
entir
e A
fric
an c
ontin
ent.
In U
gand
a, th
e fo
cus
is o
n th
e K
aram
joa
regi
on. T
here
is
colle
ctio
n of
dat
a on
cro
ss-b
orde
r tr
ade
and
info
rmal
com
mod
ity fl
ows
in a
nd o
ut o
f the
cou
ntry
. A p
aper
sys
tem
is n
ow
tran
sfer
ring
to a
n an
droi
d ba
sed
syst
em. I
t is
led
by C
hem
onic
s. A
ll da
ta is
ope
n ac
cess
.

Uganda | Tools Assessment | Full Report | March 2017 98
Platform for Agricultural Risk Management | Crop pests and disease management in Uganda: status and investment needs
Ser
vice
nam
e/
(Org
aniz
atio
n)
Tar
get
au
die
nce
N
um
ber
of
sub
scri
ber
s T
ype
of
info
rmat
ion
W
ho
pay
s?
Des
crip
tio
n
AG
INS
BA
(M
aker
ere
Uni
vers
ity)

Platform for Agricultural Risk Management | Crop pests and disease management in Uganda: status and investment needs
99 Uganda | Tools Assessment | Full Report | March 2017
Ap
pen
dix
2: L
ist
of
Key
In
form
ants
N
o.
Nam
e o
f co
nta
ct
Po
siti
on
O
rgan
izat
ion
O
rgan
izat
ion
typ
e
1 M
s. M
arga
ret N
amug
amba
UN
AD
A
Agr
o-in
put D
eale
rs A
ssoc
iatio
n
2 M
r. P
eter
Kis
ambi
ra
U
NF
FE
F
arm
ers’
Fed
erat
ion
3 M
r. N
gand
a C
oord
inat
or
Muk
ono
Dis
tric
t Far
mer
s A
ssoc
iatio
n (M
UD
FA
) F
arm
er o
rgan
izat
ion
4 M
r. H
umph
rey
Mut
aasa
FIT
-Uga
nda
P
rivat
e/IC
T
5 M
r. D
avid
Luw
anda
ga
Agr
ibus
ines
s O
ffice
r F
AR
MG
AIN
P
rivat
e/IC
T
6 M
r. D
enni
s B
isas
e A
grib
usin
ess
Offi
cer
FA
RM
GA
IN
Priv
ate/
ICT
7 M
r. P
aul N
yend
e M
anag
ing
Dire
ctor
A
grin
et
Priv
ate/
ICT
8 M
r. O
kaas
ai O
polo
t D
irect
or C
rop
reso
urce
s D
irect
orat
e of
cro
p re
sour
ces
M
AA
IF
9 D
r. S
teph
en B
yant
wal
e
Com
mis
sion
er
Dep
artm
ent o
f Cro
p P
rote
ctio
n
MA
AIF
10
Mr.
Ben
ius
Tuk
ahiir
wa
P
lant
wis
e fo
cal p
erso
n D
epar
tmen
t of C
rop
Pro
tect
ion
MA
AIF
11
Mr.
Dav
id K
utun
ga
Cro
p D
iagn
ostic
s an
d ep
idem
iolo
gy
Dep
artm
ent o
f Cro
p P
rote
ctio
n
MA
AIF
12
Mr.
Kom
ayom
bi B
uleg
eya
For
mer
Com
mis
sion
er-
Dep
artm
ent o
f Cro
p P
rote
ctio
n M
AA
IF
13
Dr.
Pat
ienc
e R
wam
igis
a E
xten
sion
Coo
rdin
ator
D
irect
orat
e of
ext
ensi
on
MA
AIF
14
Dr.
Cha
rles
Muk
ama
AR
M fo
cal p
erso
n D
epar
tmen
t of P
olic
y &
Pla
nnin
g
MA
AIF
15
Mr.
Cha
rles
Sse
mw
oger
ere
G
ram
een
Fou
ndat
ion
N
GO
16
Ms.
Ann
ette
Bog
ere
G
ram
een
Fou
ndat
ion
NG
O
17
Mr.
Ron
ald
Rw
akig
umba
U
gand
a co
untr
y C
oord
inat
or, A
gri-F
in
Mob
ile
Mer
cy C
orps
N
GO
18
Mr.
Eric
Car
lber
g R
egio
nal A
gric
ultu
re S
peci
alis
t, th
e T
OP
S p
rogr
am
Mer
cy C
orps
N
GO
19
Ms.
Gra
ce R
wom
usha
na
Cou
ntry
Coo
rdin
ator
F
arm
Rad
io In
tern
atio
nal
NG
O
20
Pas
cal M
wer
uka
Rad
io a
nd IC
T O
ffice
r F
arm
Rad
io In
tern
atio
nal
NG
O

Uganda | Tools Assessment | Full Report | March 2017 100
Platform for Agricultural Risk Management | Crop pests and disease management in Uganda: status and investment needs
No
. N
ame
of
con
tact
P
osi
tio
n
Org
aniz
atio
n
Org
aniz
atio
n t
ype
21
Just
ine
Ste
phen
Eca
at
Pro
gram
Offi
cer
F
arm
Rad
io In
tern
atio
nal
NG
O
22
Mr.
Mis
aki O
kote
l H
ead
of P
rogr
ams
Sel
f Hel
p A
fric
a
NG
O
23
Ms.
Dor
othy
Nai
kesa
M
&E
Man
ager
S
elf H
elp
Afr
ica
N
GO
24
Mr.
Mos
es O
bbo
Ow
ori
F
EW
SN
ET
N
GO
25
Mr.
Chr
is M
uwan
ika
See
d E
xper
t IS
SD
Uga
nda
NG
O
26
Ms.
Phi
onah
Nin
sim
a A
gri-b
usin
ess
Exp
ert
ISS
D U
gand
a N
GO
27
Mr.
Idd
Ram
atha
ni
Pat
holo
gist
N
aCR
RI
NA
RO
28
Dr.
Chr
isto
pher
Om
ongo
C
oord
inat
or, C
assa
va R
egio
nal C
ente
r of
Exc
elle
nce
N
aCC
RI
NA
RO
29
Dr.
Jer
ome
Kub
iriba
P
rogr
am le
ader
Nat
iona
l Ban
ana
Res
earc
h P
rogr
am
Nat
iona
l agr
icul
tura
l res
earc
h la
bora
torie
s (N
AR
L)
NA
RO
30
Pro
f. Je
nina
Kar
ungi
E
ntom
olog
ist
CA
ES
) M
aker
ere
Uni
vers
ity
31
Pro
f. S
.B. M
ukas
a M
icro
biol
ogis
t C
AE
S
Mak
erer
e U
nive
rsity
32
Dr.
Tal
wan
a H
erbe
rt
Pat
holo
gist
C
AE
S
Mak
erer
e U
nive
rsity
33
Pro
f. P
aul K
ibw
ika
Ext
ensi
on s
peci
alis
t,
CA
ES
M
aker
ere
Uni
vers
ity
34
Ms
Pro
ssy
Mut
umba
C
rops
Coo
rdin
ator
N
AA
DS
Q
uasi
-gov
ernm
ent
35
Mr.
Tom
Mug
isa
Nat
iona
l foc
al p
erso
n
PA
RM
36
Dr.
Muk
uru
Dis
tric
t Pro
duct
ion
and
Mar
ketin
g O
ffice
r M
ukon
o di
stric
t LG
37
Mr.
Mab
ira S
teph
en
DA
O
Muk
ono
dist
rict
LG
38
Mr.
Gid
eon
Bad
agaw
a E
xcec
utiv
e di
rect
or
Priv
ate
sect
or fo
unda
tion
Uga
nda
Priv
ate
sect
or
39
Mr.
Chr
is K
aiju
ka
Cha
irman
U
gand
a gr
ain
coun
cil,
Nat
iona
l Mai
ze p
latfo
rm
Priv
ate
sect
or

101 Uganda | Tools Assessment | Full Report | March 2017
Platfo
rm fo
r Agricu
ltural R
isk M
anagem
ent | C
rop
pests an
d d
isease man
agemen
t in U
gand
a: status an
d in
vestmen
t need
s
Platform for Agricultural Risk Management | Crop pests and disease management in Uganda: status and investment needs
101 Uganda | Tools Assessment | Full Report | March 2017
Appendix 3: Crop queries from Ugandan clinics illustrating main crops brought to clinics in different regions and difference between men and women
Crop Women Men Total
Central (2093 queries, 36% women)
Bananas 17.0 19.6 18.8
Cassava 20.9 15.7 17.7
Coffee 9.1 16.7 14.2
Maize 13.4 14.5 14.2
Beans 11.8 5.4 7.6
Groundnut 6.7 3.2 4.4
Tomatoes 2.2 5.5 4.3
East (2536 queries, 18% women)
Citrus 25.2 30.9 29.9
Tomatoes 2.7 10.6 9.1
Groundnuts 17.6 7.2 9.0
Maize 7.3 7.0 7.1
Cassava 7.6 5.4 5.8
Cowpea 6.5 4.6 4.9
Mid-West (372 queries, 39% women)
Cassava 21.7 17.4 18.8
Bananas 13.0 17.4 15.9
Coffee 9.4 15.1 13.7
Mangoes 10.1 10.5 9.9
Maize 10.9 5.9 7.8
Cocoa 4.3 7.3 5.9
South West (269 queries, 33% women)
Coffee 19.0 30.6 26.6
Bananas 16.4 15.7 15.4
Tomatoes 9.3 7.0 7.7
Cassava 10.8 5.7 7.5
Citrus 5.9 7.7 7.3
Beans 11.5 3.0 5.5

3Uganda | Holistic approach to risk management: new opportunities for investment in agriculture | Final Report | May 2017
Platform for Agricultural Risk Management | Managing risks to improve farmers’ livelihoods

International Fund for Agricultural Development (IFAD)
Via Paolo di Dono 44 - 00142 Rome (Italy)
[email protected] www.p4arm.org @parminfo
ContactsPARM Secretariat
Platform for Agricultural Risk ManagementManaging risks to improve farmers’ livelihoods
Crop pests and disease management in Uganda: status and investment needs
Full ReportMarch 2017
Uganda
Tools Assessment
In collaboration with
Study conducted by


![Coffee Yield [Productivity] and Production in Uganda: Is ......fighting disease and pests, as the perceived main causes of low coffee productivity and production in Uganda. These efforts](https://static.fdocuments.net/doc/165x107/5e6b7f1181c35a088a029ac8/coffee-yield-productivity-and-production-in-uganda-is-fighting-disease.jpg)