Uganda: Managing More Effective Decentralization - IMF · Uganda: Managing More Effective...
34
WP/06/279 Uganda: Managing More Effective Decentralization Ehtisham Ahmad, Giorgio Brosio, and María González
Transcript of Uganda: Managing More Effective Decentralization - IMF · Uganda: Managing More Effective...

WP/06/279
Uganda: Managing More Effective Decentralization
Ehtisham Ahmad, Giorgio Brosio, and
María González


© 2006 International Monetary Fund WP/06/279 IMF Working Paper Fiscal Affairs Department
Uganda: Managing More Effective Decentralization
Prepared by Ehtisham Ahmad, Giorgio Brosio, and Maria Gonzalez1
December 2006
Abstract
This Working Paper should not be reported as representing the views of the IMF. The views expressed in this Working Paper are those of the author(s) and do not necessarily represent those of the IMF or IMF policy. Working Papers describe research in progress by the author(s) and are published to elicit comments and to further debate. A politically driven and ambitious decentralization program implemented by the authorities since the late 1990s has had mixed results in terms of enhancing service delivery. Paradoxically, concerns with the results of service delivery, partially driven by donors’ requirements, have resulted in a deconcentrated system relying on conditional grants and unfunded mandates. This has reduced the incentives, responsibility, and ownership for local authorities to improve service delivery. Crucially, for functions where the local authorities have had full responsibility, better service quality has resulted than in those areas in which there are overlapping responsibilities between the center and the local authorities. JEL Classification Numbers: H20, H77 Keywords: Fiscal policy, intergovernmental fiscal relations Author’s E-Mail Address: [email protected]; [email protected]; [email protected]
1 We thank Maria Albino-War and Jiri Jonas for helpful comments on an earlier draft.

- 2 -
Table of Contents Page I. Introduction....................................................................................................................3 II. A Benchmark: Principles of Decentralization Reform ..................................................3 III. Uganda’s Decentralization Process: The Institutions ....................................................6 A. Historical Overview: The Sequencing of the Decentralization Process ............6 B. Does Uganda’s Institutional Design Promote Accountability ...........................9 C. Capacity Constraints: The Experience with Public Financial Management....16 D. Accountability and Governance.......................................................................19 IV. Specific Outcomes in Service Delivery .......................................................................20 A. The Outcomes: Education, Health, and Water Services ..................................21 B. The Outcomes: A Possible Explanation ..........................................................27 V. Final Remarks ..............................................................................................................29 Tables 1. Total Sector Expenditure Executed by Local Governments........................................12 2. Incidence of Bribery in Contacts with Public Officials, 1998 and 2002 .....................20 3. Primary School Net Enrollment, 1995–2004...............................................................23 4. Secondary School Net Enrollment...............................................................................23 5. Reasons For Not Attending School, 2003....................................................................23 6. Indicators for Government and Private Primary Schools, 2003–04 ............................24 7. Indicators for Government Primary Schools Per District, 2003 ..................................25 8. Mortality Indicators .....................................................................................................25 9. Infant Mortality by Region, 1995–2000 ......................................................................27 10. Child (Under-five) Mortality by Region, 1995–2000..................................................27 11. Accessibility to Safe Water by Income Quintile and by Region, 1992–2002 .............28 12. Distance of Access to Water by Communities, 1992–2002 ........................................28 Figures 1. Size of the Public Sector ................................................................................................7 2. Government Tiers ........................................................................................................10 3. Domestic Development Expenditure Executed by Local Governments......................13 References................................................................................................................................31

- 3 -
I. INTRODUCTION
The complex interplay between political economy and fiscal decentralization is clearly seen in the case of Uganda, which has engaged in an ambitious decentralization reform over the last 15 years. Partly designed as an element of the political process following the civil war, the process quickly became enmeshed with the country’s overarching poverty-reduction strategy and as a mechanism to improve service delivery, as advocated by bilateral and some multilateral donors. As a result, both political and expenditure devolution in key social areas took place relatively fast, supported by a rapid process of financial and administrative decentralization that was not paralleled by improved revenue generation capacity nor the ability to make significant resource allocation decisions at the local level. It is in this light that available assessments of service delivery in key social sectors have brought, at best, mixed results to the promises of the decentralization process. Indeed, the tension between central financing and administrative controls, and the devolution of local responsibility for spending is at the core of the divergent forces that have prevented the full realization of the decentralization process. The assessment in this paper suggests that Uganda has implemented decentralization only partially. While quickly devolving spending, the process was also characterized by a centralization of revenues. Moreover, many of the new mandates were accompanied by a heavy system of conditional grants, possibly to mitigate the risks from low capacity and weak public financial management, and to ensure the appropriate tracking of pro-poor spending—all important requirements from the donor community that has financed more than half of Uganda’s spending over the last 10 years. As a result, the model built in a rigid structure of vertical accountability links, but undermined the generation of local autonomy in decision making and the system of horizontal accountability links that are at the root of strengthened performance by policymakers in decentralized frameworks. The paper is organized as follows. Section II briefly outlines some of the principles for decentralization reform that serve as a benchmark for the analysis. Section III presents a brief historical overview of the decentralization process in Uganda, analyzes the design and sequencing of the decentralization framework, and reviews the experience with public financial management. Section IV looks closely into sectoral outcomes, with the support of data from household surveys. The final section concludes.
II. A BENCHMARK: PRINCIPLES OF DECENTRALIZATION REFORM
The traditional advantages of decentralization are that it can substantially improve the efficiency, transparency and responsiveness of local service provision, compared to a centralized arrangement. Assuming that the institutional system includes mechanisms to enforce accountability at all government levels, the main factor behind this outcome is the level of information available to both citizens and policymakers. On the one hand, policymakers, who are closer to the beneficiaries of the public services they provide, are better posed than the center to identify their specific needs and relevant trade-offs in resource

- 4 -
allocation;2 on the other, decentralization could increase voter information—citizens who are closer to their public service providers are possibly better suited to monitor and hold them accountable for their policy choices. There are three main reasons why decentralization may fall short of its promise. Often, a faulty institutional design may weaken the links between information flows, service delivery and accountability thus leading to poor service delivery outcomes. Further, a poorly sequenced decentralization process may result in deterioration of the service provision when local capacity is low. In addition, political market failures can also render the well-known advantages of a decentralization framework ineffective (Breton, 2001). Institutional design issues A proper institutional design is key for a decentralization framework to deliver a better service provision than a decentralized system. Such design must touch upon a number of aspects determining service provision, including the actual expenditure mandates, the local government own-revenue sources and financing arrangements. At best, a well-designed institutional framework will take account of the relative capabilities and constraints of the center and local governments to set up a scheme of incentives that optimizes the production of public goods while strengthening information flows and horizontal accountability. At worst, a poorly-designed framework will weaken the links between service provision and accountability, generating incentives for policymakers to incur in wasteful allocation of resources, rent-seeking activities and corruption. The choice of assignment of expenditure mandates across government levels can impact service delivery significantly. In general, optimal allocation of resources is achieved when public expenditure mandates are allocated to the government level that most closely represents the beneficiaries of these outlays. A proper assignment of expenditure mandates should also consider specificities in the production structure of the public goods and services, including the presence of economies of scale, spillover benefits and the level of administration costs. In contrast, highly localized services—including public utilities, primary education and basic health—would tend to be best served at the local level. However, given that donors and the central government place a great deal of weight on basic services, say primary education and basic health care, overlapping responsibilities and incomplete information could lead to “game-play and bargaining” between the different governments levels, to the detriment of the effective delivery of public services. The assignment of local revenue-raising responsibilities is also a key factor in generating appropriate incentives for service provision. In general, accountability of local governments requires that they have access to significant own-source revenues at the margin, to ensure that hard-budget constraints can be made effective. In addition, local authorities should have the right to adjust the rates of those taxes that are assigned to them, to strengthen
2 However, Breton (2001) argues that central provision could also be tailored to meet local preferences and could also be managed efficiently.

- 5 -
their accountability over the collected resources. This does not necessarily imply that the local authorities should control all major revenue sources, as this may be detrimental to the central government’s ability to carry out macroeconomic management, and to address horizontal imbalances across different regions. The revenue-raising system should generally be supplemented by intergovernmental transfers, to help address the remaining fiscal imbalances. However, if grants are determined as gap-filling transfers to meet local deficits, local governments will have little incentive to manage their functions efficiently. A heavy reliance on special purpose or tied grants may limit local preferences or accountability. At the same time, untied transfers may not ensure that the requirements of donors or the center on adequate expenditure tracking and performance would necessarily be met. An adequate design of the transfer system is key to protecting local accountability and ensuring that the poorer regions have adequate resources to effectively provide basic services. Over-dependence of the subnational governments on central transfers can weaken local accountability on service provision, since it facilitates the “shifting of blame” for breakdowns in service delivery to upper-government tiers (Rodden 2002, Khemani 2004). Further, an ad hoc, discretionary transfer allocation system can be easily subject to political manipulation, leading to inefficient outcomes. In this context, institutional design should ensure the predictability of transfers—including through the use of a formula-based allocating system reliant on objective, quantifiable indicators. As in other countries, a judicious mix of grants types is likely to be needed. Local borrowing should also be carefully designed to address adverse incentives to fiscal responsibility and adequate service provision. Combinations of rules-based approaches for local debt control are likely to have to be supplementary arrangements based on administrative controls or statutory limits set up in a rolling basis, and in more advanced cases (possibly for the more advanced regions and municipalities) with a blend of market-based controls (Ter-Minassian 1997). Sequencing and capacity issues The management of the decentralization process can be as important for service delivery as is the decision to decentralize. Ideally, local governments should first be given clarity about their functions and associated expenditures responsibilities. A broadly accepted sequencing rule is that functions and responsibilities should be defined first, followed by rules for resource determination. Once expenditure mandates, fiscal and administrative pillars are established, the rules about market access to finance should be clarified and subnational borrowing permitted subject to clearly specified preconditions (Ahmad, et al., 2005). Along with fiscal and financial resources and autonomy, a key issue facing local authorities is the access to an appropriate level of human resources. Decentralized service delivery is handicapped when subnational governments lack skills and institutional capacity. International experience shows that often in decentralization reform, political and fiscal decentralization elements are given significantly more emphasis than administrative

- 6 -
issues. For instance, the legal devolution of mandates may take place without explicit staffing strategies or a well-crafted public administration reform. In this context, administrative decentralization may lag behind other aspects of the reform, weakening accountability and service delivery.3 A successful administrative devolution is deeply intertwined with local capacity-building. There are some broadly-accepted principles on how the decentralization and capacity-building processes should be sequenced. In particular, two main approaches are recognized. First, top-down training may be provided by the center possibly early in the process. Second, the center may allow the creation of an enabling environment at the local level, providing appropriate financing, regulation and support to help the local authorities to “learn by doing”. Generally, an asymmetric approach may be more consistent with effective devolution and more likely to produce capacity tailored to the specific responsibilities of the local governments (Ahmad, et al., 2005). Political market failures Even under a well-designed decentralization framework, the presence of political and market failures can eliminate the performance incentives stemming from horizontal accountability. Most commonly, the presence of voter mass fragmentation—say, social or ideological—would prevent physical proximity from delivering improved information flows and accountability. Specifically, voter fragmentation reduces politicians’ incentives and ability to make credible promises to the aggregate voter mass—which has heterogeneous preferences, and cannot easily verify whether the promises have been fulfilled. In this environment, politicians focus on making commitments only to narrow groups of voters—in terms of goods that are relevant to and monitorable by such groups—thus adversely affecting general service provision. (Ahmad, et al., 2005; and Keefer and Khemani, 2005).
III. UGANDA’S DECENTRALIZATION PROCESS: THE INSTITUTIONS
A. Historical Overview: The Sequencing of the Decentralization Process
Uganda’s initial experimentation with decentralization was associated with the colonial government, and did not survive independence from Great Britain. During British rule, elected local officials4 were permitted by the colonial administration as a measure to contain pressures for a full independence. By the time of independence in 1962, Uganda had a system of local governments, responsible for significant expenditure functions, although effective administrative control was retained by the center through the district commissioners. This effectively deconcentrated system was, however, dismantled shortly after independence, and replaced by a centralized administration in which the subnational authorities played only minor implementation roles—as the central government reacted to 3 For example, a large fraction of local civil servants may continue to respond directly to upper government tiers, or certain mandates can only be partially delegated to local authorities, which may break the links and internal coordination between the services they provide. 4 An Ordinance introducing democratic local governments was issued in 1949.

- 7 -
colonial structures and also sought to contain the unsettled political environment that prevailed in the country until the mid-1980s (Steffensen, et al., 2004). The end of the civil war in 1986 reopened the door to decentralization. This goal—which the new government of the National Resistance Movement (NRM) quickly adopted through a radical reform—facilitated the reconciliation of political ambitions for all previously warring factions, becoming a cornerstone of a new governance model. Thus, as early as 1987, the government introduced political decentralization by establishing “Resistance Councils” at all subnational government levels, with the objective of increasing local participation in the decision-making processes and strengthening democracy. The program was formalized in 1993 through the issuance of the Local Government Statute, enshrined in the 1995 Constitution, and later in the Local Government Act of 1997. The number of the local governments increased rapidly with decentralization, largely obeying political considerations. In line with historical experience, decentralization was seen as a tool to achieve national consensus among different groups. Thus, the need to satisfy regional and tribal demands for political power led the central government to permit a proliferation in the number of districts—originally, the highest government tier.5 By 2005, the government also reached agreement with regional and tribal leaders to establish regions—a new intermediate-tier of local authority comprised of interested districts, de facto representing tribal Kingdoms.6 The size of the public sector is indicated in Figure 1.
5 The total number of districts jumped from 33 in 1980 to 44 in 1997, 56 in 2000 and 78 by 2006. 6 In addition, political discussions have increasingly concentrated on developing a federal government framework, commonly referred to as FEDERO.
Figure 1: Size of the Public SectorIn thousands
0
50
100
150
200
1993
/94
1994
/95
1995
/96
1996
/97
1997
/98
1998
/99
1999
/00
2000
/01
2001
/02
2002
/03
2003
/04
Cash limited and conditional grant (local governments).Teaching service (local governments)Traditional civil service
Source: Ugandan authorit ies and staff estimates

- 8 -
Uganda’s administrative decentralization followed the political decentralization process apace. The main goal of administrative decentralization was to build managerial capacity at the local level, to increase transparency, efficiency and accountability in service delivery. The program devolved responsibility for a large number of key public services to the local level, including primary education and health services, and only with few exceptions—such as security and defense. In 1994, as the major legislative initiatives were being formulated and expenditure functions delegated, the central government employees working in the local governments officially became local employees, and hence accountable to them. Subsequently, the size of the central government was reassessed in light of the shift of many functions from the center to the local authorities. While the staff were transferred from central to local control, the center retained important financing controls, as well as an ability to determine and require spending, resulting in unfunded mandates, as discussed further below. The need to effectively ensure service delivery contributed to the strong and continuous expansion of Uganda’s local governments. This expansion took root as the government focused its economic program, supported by donors, more intently on poverty reduction in the second half of the 1990s. As the country’s grass-root-based Poverty Eradication Action Plan (PEAP) was launched in 1997, Uganda scaled up significantly the resources allocated to delivering pro-poor spending, in particular those identified and tracked under the Poverty Action Fund (PAF), which received strong financial backing and attention by the international donor community. The local governments were, in fact, assigned with the responsibility to execute a growing share of expenditures tracked under the PAF—a share that reached some 60–70 percent in the early 2000s. Partly to support the related service delivery, the number of local civil servants expanded—and the expansion was particularly pronounced in the case of the teachers hired to serve the Universal Primary Education Program (UPE), a frontline in the national program for poverty reduction (Figure. 1). The central government was thus confronted with a huge increase in the teachers’ wage bill over which it had little control. This put great pressure on the government to manage its macroeconomic constraints. In effect, the UPE effectively imposed unfunded mandates on the local governments, as the additional resources transferred were not commensurate with the mandate. At the same time, an upward drift in the central government staff outside the ministerial civil service was not contained. Off-ministerial staff includes that of special independent commissions, secondary and tertiary schools, police, prisons and central government staff delegated to districts (Langseth 1995, Golola 2001, and Kjaer 2004). Throughout the decentralization process, the strategy for local capacity building had a “learning-by-doing” orientation, which lagged behind the devolution of government responsibilities. Wide divergences in capacities across different local authorities quickly presented challenges to service delivery—with the poorest districts facing significant constraints to adequately execute and report spending, in spite of the technical assistance provided by the center and international donors. There are also widespread reports of rent-seeking behavior at the subnational level, compounded by the information and public financial management difficulties at several levels of government. Problems aside, however,

- 9 -
many local authorities also made attempts to improve service deliver once they gained autonomy. For example, some studies suggest that the ability to make employment decisions based on a block resources assigned directly to districts led a number of them to retrench workers, reorganize their administrative structures and try to recruit better qualified staff. These reorganizations were based on improvements in the methods of service provision—including by allowing outsourcing to the private sector (Lubanga 1997, Brixiova 1999). Given its rapid pace, the design of Uganda’s decentralization program has been subject to reassessments, and continues to be refined over time. A first decade of experience allowed the authorities to identify a host of outstanding problems, ranging from capacity weaknesses to institutional design issues that have undermined performance in service delivery—including factors such as intergovernmental resource allocation and flexibility, design and capacity weaknesses in public financial management and policy coordination. To address some of these problems, the government developed the Fiscal Decentralization Strategy (FDS)—containing a strategy, in sequenced stages to improve the grant allocation formulae across districts, and improve and simplify expenditure management and reporting by the local authorities. The FDS was formally adopted in June 2002, and launched through a number of sequenced pilot phases for its implementation—these are still ongoing.
B. Does Uganda’s Institutional Design Promote Accountability?
Legislation and administrative structure Uganda’s decentralization scheme is supported by a legal framework under, the 1997 Local Government Act, which was drafted to provide a clear description of the key responsibilities to be undertaken by the different tiers of local authorities in the country. In addition, this is supported by the 1998 Local Government Financial and Accounting Regulations (LGFAR), to cover a framework for development planning, budgeting, revenue collection, expenditure management, accounting and audit. The authorities have revised the LGFAR in 2005, to bring them in line with the 2003 Public Finance and Accountability Act (setting out nationwide provisions on public financial management), and other modernization initiatives, including the FDS itself. Despite its legislative foundations, the institutional design of Uganda’s decentralization framework is intricate. There are five basic tiers of local governments in Uganda (Figure 2), linked through complex political and administrative arrangements.7 The highest basic tier is comprised by districts (LC1) and the city of Kampala. Urban areas are divided into municipalities (LC2) and towns (LC3); both Kampala City and the municipalities are split into divisions, and subsequently, wards and zones. In the rural areas, the districts are split into subcounties (LC3), and subsequently into parishes and villages. Most executive decisions are taken at the districts and municipalities; the lower-level authorities are 7 As noted earlier, since 2005 districts are allowed to group voluntarily to form regions. These regions would be able to establish a regional assembly with elected representatives, and a regional government with ministers appointed by the regional kings, and approved by the regional assemblies. The regional governments would control the policies currently devolved to the districts.

- 10 -
considered to be the subcounties, towns and divisions, while parishes and wards are regarded as administrative units supporting their upper structures (World Bank, 2004). Crucially, there is no formal subordination or hierarchical control across the different local government layers. The executive bodies at different tiers are designed to be highly representative, but are vulnerable to local pressures. Districts, municipalities and subcounties are headed by an elected executive (the chairperson) and an elected Local Government Council.8 The Council is formed by directly elected councilors from specific constituencies. In rural areas, chairpersons and councilors are elected at the district, subcounty, and village levels, while in urban areas, they are elected at the city, municipality, town, division, and cell levels.9 Operations are conducted through executive committees elected directly by the chairperson, and endorsed by the Council. The presence of Local Council at low government tiers is meant to ensure a more direct system of accountability of the local affairs by the voters; in practice, however, in small communities, the scheme has often been monopolized by interest groups (World Bank, 2004). External local government oversight is cumbersome. There are a large number of institutions with sometimes overlapping or unclear mandates for monitoring local authorities, working with little or no coordination among them. At the central government level, the Ministry of Finance, through the Treasury Inspectorate Department at the Treasury is responsible for collecting fiscal data and overseeing specific local government grants; the Ministry of Local Governments is responsible for policy design, and for monitoring the adherence of the local authorities to their laws and regulations; the Auditor General is legally 8 At lower-government tiers, the administrative role of the chairperson and local government is insignificant, as it involves little use of financial resources. 9 To avoid political influences, councilors are not allowed to campaign on a party basis.
Figure 2: Uganda: Government Tiers
D IS T R IC T C IT Y o f K A M P A L A
M U N IC IP A L IT Y
S u b -C o u n ty
P a rish
V illa g e
T ow n D iv ision
W a rd
C ell/Z o n e
R u ra l U rb a n
Source: World Bank, Country Integrated Fiduciary Assessment (CIFA), 2004, Vol. V.
- 11 -
vested to inspect the local authorities’ accounts. Auditing, scrutinizing and follow-up of the local accounts and performance are also under the mandate of the Local Government Public Accounts Committees (LGPACs) and the Parliament’s Local Government Accounts Committee (LPAC). The Local Government Finance Commission has an advisory role, responding directly to the President on revenue issues. Finally, there are Resident District Commissioners—assigned from the center, and mainly responsible for security issues, but retaining strong central control over the local governments, as was the case in colonial times. Expenditure assignments Uganda’s allocation of sectoral expenditure responsibilities between the central and local authorities is broadly along the lines expected in developing countries. In particular, subnational authorities are charged with delivering basic services that affect their communities more directly, to strengthen the link between delivery and accountability. These services are: primary education—as well as some services at the secondary and tertiary schooling levels; primary health care and district hospitals; rural water services; most agricultural extension services; and district, feeder and municipal roads. The picture is muddied through the use of unfunded mandates by the center. The allocation of expenditure responsibilities between local government tiers is more obscure. Generally, only the upper-government tiers (including districts, municipalities, towns and subcounties) execute significant expenditures on their own. The only spending taking place at the level of the parishes and urban wards is the remuneration of the local councils. While each of the sub-tiers has some responsibilities assigned by the legislation, most important responsibilities are allocated to districts and municipalities, which have discretion to delegate some of them to lower government tiers. In this context, some of the largest subcounties and towns have been able to take over some functions related, for example, to primary education, basic health care and agricultural extension. These arrangements may favor accountability between the towns and subcounties and their constituencies, but only when such responsibilities are known by all and well demarcated; at the same time, the districts and municipalities do not have clear legislative ability to impose a strong vertical oversight mechanisms, given the lack of direct subordination between the different local government levels established by the law. From a sectoral perspective, the devolution of expenditure responsibilities in Uganda has proceeded fast. The local authorities’ share of execution of total government expenditure per sector, excluding the share directly financed by earmarked donor projects rose from some 30 percent in 1997/98 to about 37 percent by 2004/05—with the subnational governments picking up the responsibility for 75 percent of the resources assigned to education, 62 percent of those assigned to the health sector, and about half of the budget for water services (Table 1). Crucially, once earmarked donor projects—that have increased significantly in Uganda in recent years—are taken into account, the trend moderates
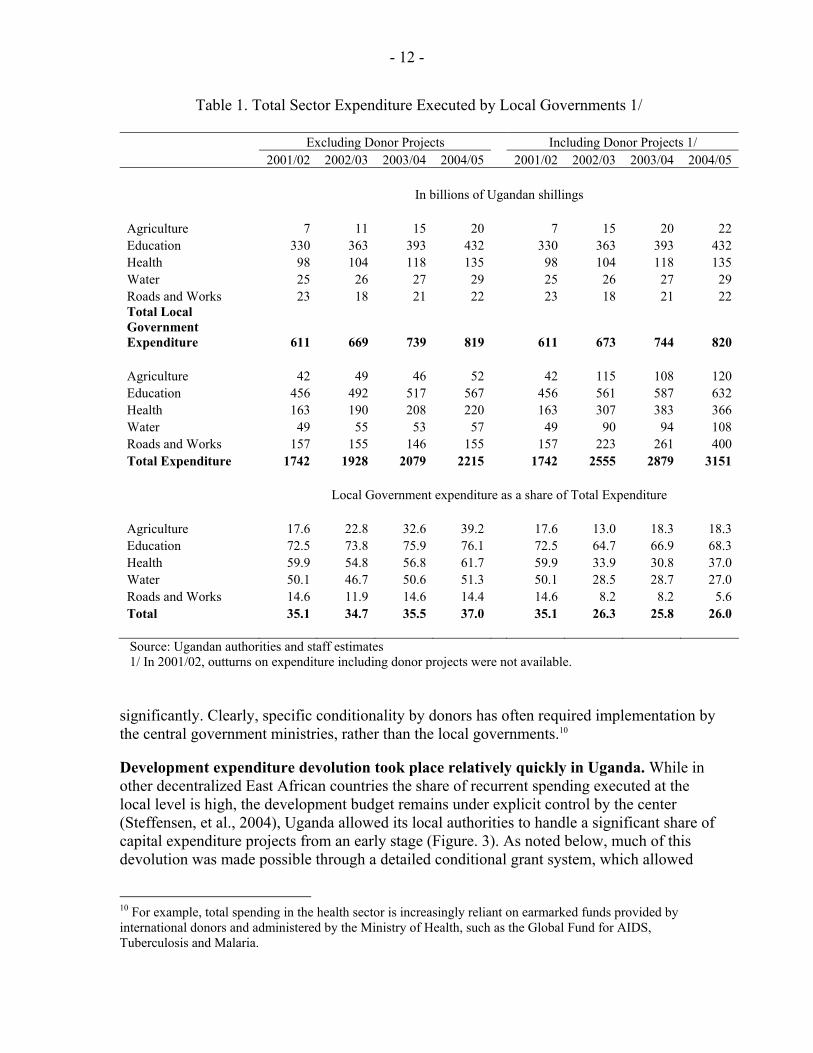
- 12 -
Table 1. Total Sector Expenditure Executed by Local Governments 1/
Excluding Donor Projects Including Donor Projects 1/ 2001/02 2002/03 2003/04 2004/05 2001/02 2002/03 2003/04 2004/05
In billions of Ugandan shillings Agriculture 7 11 15 20 7 15 20 22 Education 330 363 393 432 330 363 393 432 Health 98 104 118 135 98 104 118 135 Water 25 26 27 29 25 26 27 29 Roads and Works 23 18 21 22 23 18 21 22 Total Local Government Expenditure 611 669 739 819 611 673 744 820 Agriculture 42 49 46 52 42 115 108 120 Education 456 492 517 567 456 561 587 632 Health 163 190 208 220 163 307 383 366 Water 49 55 53 57 49 90 94 108 Roads and Works 157 155 146 155 157 223 261 400 Total Expenditure 1742 1928 2079 2215 1742 2555 2879 3151
Local Government expenditure as a share of Total Expenditure Agriculture 17.6 22.8 32.6 39.2 17.6 13.0 18.3 18.3 Education 72.5 73.8 75.9 76.1 72.5 64.7 66.9 68.3 Health 59.9 54.8 56.8 61.7 59.9 33.9 30.8 37.0 Water 50.1 46.7 50.6 51.3 50.1 28.5 28.7 27.0 Roads and Works 14.6 11.9 14.6 14.4 14.6 8.2 8.2 5.6 Total 35.1 34.7 35.5 37.0 35.1 26.3 25.8 26.0
Source: Ugandan authorities and staff estimates 1/ In 2001/02, outturns on expenditure including donor projects were not available. significantly. Clearly, specific conditionality by donors has often required implementation by the central government ministries, rather than the local governments.10 Development expenditure devolution took place relatively quickly in Uganda. While in other decentralized East African countries the share of recurrent spending executed at the local level is high, the development budget remains under explicit control by the center (Steffensen, et al., 2004), Uganda allowed its local authorities to handle a significant share of capital expenditure projects from an early stage (Figure. 3). As noted below, much of this devolution was made possible through a detailed conditional grant system, which allowed
10 For example, total spending in the health sector is increasingly reliant on earmarked funds provided by international donors and administered by the Ministry of Health, such as the Global Fund for AIDS, Tuberculosis and Malaria.

- 13 -
close supervision by the center of the execution of capital projects, but did not favor the build up of horizontal accountability, between the local governments and their constituencies. The effectiveness of the central supervision has been open to question. Revenue and borrowing arrangements Perhaps the weakest aspect in Uganda’s decentralization arrangements is that pertaining to the revenue framework. By generating a large dependence of the subnational governments on the center, and emphasizing hierarchical monitoring mechanisms on the use of the resources, the institutional structure has taken little advantage of the horizontal incentive potential upon which decentralization is based. As a result, it has, de facto, built a system of “deconcentration” rather than one of decentralization—blurring the information available to the constituencies on the extent to which local authorities are truly responsible for their own performance, thus weakening accountability. In contrast to the rapid devolution of spending, decentralization in Uganda has been very unambitious with regard to local revenue-generation. The share of the revenues mobilized locally to total resources available to the subnational governments collapsed over time, from about 80 percent at early stages of the decentralization process to about 20 percent by 2004/05. The share of total domestic revenue to GDP has remained stagnant at around 12 percent. With the share of public expenditure on GDP at around 24 percent of GDP, Uganda has had to rely significantly on foreign aid. Expanding revenues and increasing the effectiveness of public expenditure at all levels of government remains a crucial challenge. In the immediate future, the there has to be a substitute for the revenue loss, particularly for the local governments, incurred through the suspension of the graduated income tax.
Figure 3. Domestic development expenditure executed by local governments(In percent of total development budget per sector)
0
10
20
30
40
50
60
70
80
1998/99 1999/00 2000/01 2001/02 2002/03 2003/04 2004/05
Total AgricultureEducation HealthWater Roads and Works
Source: Ugandan authorities

- 14 -
At the root of the bleak local revenue collections lies the design of the “own-revenue” raising instruments available to the subnational authorities. These have several problems when contrasted with the broad principles suggested by the literature: They are very limited—In addition to the presently suspended graduated income tax,
applied to individuals; the main local revenue instruments are: (1) a graduated income tax applied to individuals; (2) a property tax; and (3) a series of market dues. The assignment of these taxes and dues to the local authorities, given their structural characteristics (e.g., the volatility of their collection bases, and their administrative requirements) is broadly in line with best practice, but the number of instruments itself is very small. Moreover, the local authorities have no ability to modify neither the bases nor the rates—thus these taxes do not strictly constitute own-taxes in the sense needed generate additional revenues at the margin and to impose hard-budget constraints on the local governments.
They are suboptimal due to design and/or capacity constraints—Several problems have
been identified with these revenue instruments. First, poor administrative capacity and the lack of proper enforcement have generated weak assessment practices in the collection of the graduated income tax, rendering it burdensome and widely unpopular.11 Second, the proliferation of lower levels of government may add to administrative constraints—indirectly increasing the dependency on the center. Third, the base of the property tax has remained unnecessarily narrow, as it is confined by the legislation to urban areas—thus accentuating the fiscal imbalances between wealthy urban local governments and the poorer rural districts. Fourth, the specific market dues constitute a widely varying share of the available product prices, generating distortions that fall more heavily on small traders in poorer administrative jurisdictions (Nsibambi 1998).
They are subject to political manipulation—For example, due to its lack of popularity,
the graduated income tax was picked up as a frontline issue in the local and presidential campaigns of 2004/05. As a result, the tax was “suspended” for a 10-year period—which has deprived the local authorities from their largest yielding revenue source.12
The revenue-sharing arrangements within local governments are narrow and administratively complex. Given the low level of local revenue collections, transfers among local governments are not feasible However, local revenues are redistributed within districts and municipalities, after being collected at the lower local government units. This redistribution takes place through a complex transfer system that requires resources to flow back-and-for across tiers.13 These arrangements, aside from being burdensome, have often generated incentives for underreporting of revenue collections.
11 In general, wealthier people have usually been able to easily evade payment, while the poorest have been forced to pay the highest rates because the appropriate payment tickets were not available. 12 The graduated tax represented some 60 to 80 percent of local tax collections prior to its suspension. 13 According to the Local Government Act, 35 percent of the collections attracted by the villages and parishes (and submitted to the subcounties) must be transferred to the upper-level district. Of the remaining 65 percent,
(continued…)

- 15 -
Given their weak revenue collections, Uganda’s local governments are highly reliant on central government transfers—in particular, on those of a conditional nature.14 On average, about 80 percent of the central transfers are conditional—that is, earmarked by the center for the provision of specific services. The remaining 20 percent of transfers is composed by equalization and unconditional grants. In practice, the unconditional transfers are mostly used to cover administrative costs—including councilor wages and allowances—rather than to deliver direct services to the public. Therefore, the allocation decisions of the bulk of the funds accruing to the local governments are widely perceived as being largely predefined by the central government. This, coupled with the fact that transfers available for discretionary use are not allocated to service provision has weakened the degree of accountability of the local authorities to the beneficiaries of such services, at least in what pertains to decision making in expenditure allocation. The monitoring mechanism implied by the conditional grants has been key to facilitating the devolution of expenditure mandates. As national social spending grew, on the basis of the PEAP, the delegation of expenditure responsibilities in priority sectors to local authorities with relatively low capacity increased.. Corruption remains endemic. Furthermore, bad practices are widespread, such as request of nonofficial fees for access to services. The problems described above called for strengthened oversight by the center. Thus, the central authorities established conditionality on their grants to ensure that their use was properly monitored and accounted for. This tendency has been, perhaps, exacerbated by the need to track poverty-related expenditures appropriately, to provide assurances to the donor community that largely financed them, that the resources would be used effectively for priority needs, such as basic education or health care.. In the event, districts were required to produce monthly accounts on expenditures undertaken with the resources from conditional grants. Grants under the Poverty Action Fund (PAF), which tracks key poverty-reducing spending, were subject to even more stringent requirements.15 Thus, the framework sought to offset the falling accountability from the local governments to the citizens in their jurisdictions by imposing stronger vertical accountability links between the center and the local governments. In effect, the decentralization process now depends to an even greater extent on centralized controls, and as stated above, this weakens even further the local preferences and accountability.
5 percent stays at the subcounty councils, 5 percent of the parishes, and 25 percent to the villages; urban authorities have a different sharing formula. 14 These grants are financed from taxes collected at the national level, and from resources provided by Uganda’s international development partners to the country. 15 These include the submission of quarterly work plans and execution reports by the districts, detailing expenditures made and the associated activities undertaken on the basis of agreed work plans prior to each quarterly release of resources. These requirements under the PAF grants have provided assurances to donors, who have channeled a large amount of budget support through this virtual fund. The World Bank provided financial and technical support to the authorities in this area.

- 16 -
Horizontal accountability has also been undermined by other weaknesses in the overall system of grant allocation to the subnational governments. For example, the magnitude and distribution of equalization grants are scheduled to be revised in the context of the FDS, in the light of new available indicators and updated data in different jurisdictions. In addition, the allocation scheme of the conditional grants is also to be modified based on new measurements of uncovered needs across local governments.16 As the local authorities have been able to claim that the need for revision of the allocation formulas has generated unfunded mandates—and provided insufficient discretionary resources for them to assign to the generation of public goods—the ability of their constituencies to monitor and hold them accountable for their performance, and the effectiveness of the decentralization framework to improve service delivery has waned. The local government resort to formal debt financing has been very limited. Borrowing by local governments is allowed by law, but it has a very stringent cap—of 25 percent of locally generated revenue—and is subject to central government conditions and approval. In this context, formal indebtedness by the local authorities has remained contained.17 While this may have limited moral hazard and fiscally irresponsible behavior on the side of the subnational governments, it has also eliminated the subnational authorities’ ability to access additional resources to finance service delivery based on local needs.
C. Capacity Constraints: The Experience with Public Financial Management
The public financial management (PFM) system behind Uganda’s decentralization structure is coherent, but has suffered from flaws in capacity and institutional design. The system is based on the principle of civil society participation, relying on a scheme in which lower government tiers are expected to seek grass-root feedback, to define expenditure priorities at the country level. These inform the PEAP—which is periodically revised—as well as the national medium term framework and budget, prepared every year. This bottom-up approach is expected to entrench ownership of the budget in every jurisdiction, and favor accountability for the decisions made by local policymakers. A full scheme of arrangements has been set in place to facilitate budget execution and reporting, as well as ex post auditing, although some of these arrangements can be seen as transitory mechanisms that compensate for more fundamental weaknesses in the PFM system. Poor performance has often been observed at the various stages of the financial management cycle, partly because of faulty arrangements, but also due to the lack of human capital, especially in the most disadvantaged districts and municipalities. Budgeting and planning have proved challenging to Uganda’s local authorities. The weakest element of the local budget cycle has been the effort to link the chosen policies and plans to the budget. Districts are expected to reflect their own development priorities in
16 Some other issues, such as the lack of an allowance for the poorest and far-away jurisdictions—particularly, districts—to pay higher wages and incentives to attract qualified staff, and resources to compensate for insecurity in the regions affected by armed conflict are also to be resolved. 17 There are, however, no official figures on aggregate local government borrowing.

- 17 -
three-year district development plans that serve as a basis for local budgets, which are later integrated at the national level. However, the quality of the development plans is generally low—even when presenting coherent objectives and strategies, they are often not properly cost and poorly linked with the local budgets (World Bank, 2004). As a result, the local government input into the final national budget exercise does not effectively reflect local priorities, undermining ownership. Budget implementation by the subnational authorities has suffered from serious problems of under-execution, often driven by capacity constraints. Assessments of the quality of public financial management by the donor community have reported frequent discrepancies between budget ceilings and effective outturns, with the latter being significantly below budget ceilings.18 Two main causes explain such an under-execution. First, the projected collections on local government’s taxes included in the budget ceilings are usually overoptimistic, later giving raise to shortfalls that generate strains in the local finances. Second, central government grants, although generally predictable in size, are often delivered with a delay—be it for lack of compliance of the local authorities with the reporting requirements on the grants’ use, or because of cash constraints imposed by the center for macroeconomic management purposes. Thus, at the beginning of the year, local governments tend to have time but no resources, while at the end of the year, they have resources but no time—especially since the law obliges them to return unspent funds to the Treasury (World Bank, 2004). Expenditure controls are very weak, reflecting low capacity and institutional loopholes. Most importantly, the local authorities have constantly experienced very serious difficulties managing and updating their wage payrolls and pension registries. This has caused large wage arrears, especially for the primary teaching service with the introduction of UPE,19 as well as a large stock of pension arrears that had to be absorbed by the central government given is size.20 Further, nonwage arrears are also a problem, since no commitment control system for expenditure is used at the local government level, except under pilot programs to strengthen public financial management in selected local governments21—according to some
18 For example, the World Bank’s CIFA (2004) reported that, on the basis of a benchmarked average for districts, aggregate expenditures were at 87 percent of the budget, and total revenues at 91 percent, although local revenue collection was well below budget, averaging just 76 percent of the projected amount (2002/03). On the basis of a sample, deviations between budgeted and actual amounts were most significant at a departmental level—while most sector departments underspent against budget, the problem was chronic for those departments funded by locally generated revenues. 19 The problem is particularly acute in the case of primary school teachers assigned to rural areas. A particularly strong increase in arrears took place in 1997 with the expansion of the UPE—reports at the time suggested that about 89,000 teachers were working in public schools, while only 74,300 were registered in the payroll. These arrears had to be partly cleared through a World Bank credit. See IMF (1998) [EBS/98/58]. 20 The stock amounts to about U Sh 17 ½ billion. 21 Two main pilot programs are in place. The most important is the roll-out of a computerized Integrated Financial Management System (IFMIS) both at the central and local-government level, intended to improve cash planning and management, and imposing automatic expenditure control and auditing—a sound initiative that will only be fully in place over the medium term. In this light, technical assistance from the International
(continued…)

- 18 -
reports, some subnational authorities hold stocks of arrears of up to 20 percent of their budget expenditures (World Bank, 2003; and IMF, 2005). Local authorities lack an effective cash planning system. In fact, most subnational governments do not forecast their intra-year disbursements or plan their use—rather, they wait for cash to arrive, and then choose how to spend it. Conditional grants are usually transferred promptly to the appropriate sectoral account, while—as previously noted—unconditional and equalization grants are allocated to pay salaries. Cash received from the local government’s own revenue collections is disbursed as soon as it is received, typically in an ad hoc manner (World Bank 2004). While most district hold meetings to discuss spending priorities, the budget rarely serves as a basis for these discussions—possibly as a reflection of the weaknesses observed during budget formulation.22 Complicated cash management arrangements are in place to compensate for the lack of effective monitoring mechanisms, posing strains in the local governments with lowest capacity. In particular, conditional grants are disbursed and managed through a large number of separate bank accounts. This facilitates the tracking of their use, by allowing for the reconciliation between the balances in the accounts and the financial reports submitted by the local authorities to the center. Additional bank accounts are used for projects funded by donor sources. These arrangements, while providing assurances on use of funds, have resulted in the creation of 30 or more separate bank accounts in each district—a costly arrangement, particularly when capacity is weak. Under the FDS, the number of accounts is being streamlined to bring the total number of bank accounts to less than ten in each district. The reporting requirements have placed a heavy administrative burden on the local authorities, and are being rationalized. Districts are required to submit individual monthly reports, accompanied by a bank reconciliation statement, for each and every account through which conditional grants are processed. In addition, they are required to provide quarterly performance reports for each grant financing PAF-related expenditures—in most districts, the accounting is still done manually. Despite the burden imposed by these reports, compliance has improved over time, as grant disbursements are conditional on their timely submission.23 Under FDS, new reporting arrangements are being put in place, streamlined into a consolidated monthly financial statement, and a detailed comprehensive quarterly report, covering financial data and performance against budget plans.
Monetary Fund has intended to develop a manual Commitment Control System for the use of the local authorities, to serve as a transitory mechanism while the IFMIS is rolled out to all jurisdictions. 22 As an exception, the district of Kabale has developed its own cash management systems. The district has a cash-flow budget that sets out the expected timing of inflows, from different revenue sources and the department expenditure ceilings, over a two-month period. The district also keeps quarterly cash projections and schedules for disbursement of the spending departments (World Bank 2004). 23Compliance with the requirements is relatively higher during the year—at about 85 percent—and lower for final accounts—at 40 percent (World Bank 2004).

- 19 -
Overall, the severe weaknesses in the PFM systems have hampered service delivery. Moreover, they have also flagged the limited capacity of the local authorities to respond to the strong demands placed by the heavy devolution of spending that has taken place, especially as they have entailed burdensome reporting requirements to satisfy the vertical oversight mechanisms. Perhaps more worrisome, however, are the weaknesses observed when the local governments had greater autonomy—for example, in the cases of payroll management, cash planning, or the decision-making process for the allocation of their scarce local revenues. These results suggest, on the one side, that low PFM capacity reduced the effectiveness of the decentralization process. But, perhaps more importantly, they also hint at the presence of institutional design has flaws that might prevent an adequate level of performance in service delivery to emerge, even if greater degree of autonomy in decision making were granted to the local authorities.
D. Accountability and Governance
Accountability Generally, the available tools for holding the local authorities accountable for their performance are as weak as other aspects of the public financial system. The strongest mechanisms in place are vertical. In contrast, the public rarely demands accountability from its local authorities directly, and Local Councils have remained largely passive and ineffective at holding their administrations responsible for their performance. With this said, recent donor assessments suggest that a few local service commissions have become more active in disciplining staff, especially in cases of misappropriation of resources (World Bank 2004). Vertical accountability mechanisms are complex, and narrow in scope and effectiveness—although they are gradually improving. External audit by the Executive is performed by the Office of the Auditor General (OAG), who is mandated to audit the accounts of all higher and lower local governments at the end of each financial year. While timely preparation of these reports has improved over time, the OAG has continuously faced severe staff and resource limitations, which have hampered both the coverage and depth of its assessments. The LGPACs are mandated to review internal and external audit reports on local government performance, and make recommendations for follow up. The LGPACs reports are, however, of varying quality and limited in scope, since they focus mostly on noncompliance with the regulatory framework, rather than on correcting the underlying faults of the system. In Parliament, the LGAC is active in reviewing the scrutiny and performance reports prepared by the LGPACs. The LGAC’s investigations have resulted in some prosecutions, demotions and recommendations for withdrawal of status of accounting officers. There is some debate, however, as to the relevant authority of the LGAC relative to the LGPACs (World Bank 2004). Public Expenditure Tracking Studies (PETSs) have been increasingly used to assess performance in service delivery at the local government level. Since 1999, PETSs have been carried out in the education, health, water and sanitation sectors (World Bank 2004). PETS are useful exercises for assessing issues of central concern to the local authorities with respect to the achievement of national objectives. However, since they are carried out on a

- 20 -
sample basis, they cannot be seen as a mechanism for identifying systematic problems in local governments. In this context, they can only complement the system of monitoring and assessing individual local government performance. Moreover, follow up on the results of the PETSs remains at the discretion of the central government ministry that spearheads them. Corruption Corruption in Uganda is widespread, but modest improvements have been reported for local administrations. In parallel with the implementation of the PEAP, and under pressure from the international donors, the authorities have implemented policies to strengthen governance and curb corruption in the recent years. Data from the surveys on corruption and bad government practices prepared by Uganda’s Inspectorate General of Government suggest that these efforts have achieved some success (Table 2). Corruption in education appears to be less than in other sectors.
IV. SPECIFIC OUTCOMES IN SERVICE DELIVERY
There is mixed evidence on the effectiveness of local service delivery. As noted in the following sections, data analysis from a range of household surveys, suggests that the improvements observed in the service provision in three key sectors—education, health and water services—have not been consistent or widespread across the country’s different jurisdictions. Further, in sectors in which comparisons can be made, it is clear that the quality of public services remains lower than that of private services. More broadly, there is no system in place to allow for comparisons on performance in service delivery across sectors.
Table 2. Incidence of Bribery in Contacts with Public Officials, 1998 and 2002
Percent of Contacts with Payment of Bribes
Average Bribe (in Ugandan Shillings)
1998 survey
2002 survey
1998 survey
2002 survey
Health 28.0 24.5 11,998 12,178 All Police 63.0 46.0 50,453 42,211 Local Governments 39.0 16.0 15,322 13,948 Judiciary 50.0 29.0 106,542 87,436 Education n.a. 8.5 n.a. 10,245
Source: Inspectorate of Government, National Integrity Surveys, 1998 and 2003. The analysis of service delivery outcomes presented here has two main caveats. In particular, while a number of household surveys is available, they have little disaggregation even at the territorial level, limiting the depth of the analysis. Moreover, even in cases in which performance improvements have been registered in the assessed sectors, it is not possible to disentangle whether these were generated by the decentralization process itself, or by the nationwide scaling up of social expenditure in the sectors examined. Thus, the outcomes presented should be used to shed light on key aspects of the decentralization

- 21 -
framework that may have triggered them. The analysis also draws attention to factors that might be relevant in making local service delivery more effective in the future.
A. The Outcomes: Education, Health, and Water Services
Education Primary education has been a top priority in Uganda, and the most important expenditure responsibility assigned to local governments (Jeppson (2001)). The institutional assignment is, however, complicated. As noted earlier, while local governments are formally mandated to provide primary education and some services at the secondary and tertiary education levels, the central government level has the entire responsibility for the funding of the sector. Thus, districts have full responsibility for teacher recruitment, but salaries are determined and paid by the central government; further, the central government provides conditional grants that can be used for other nonwage school needs.24 Second, districts are permitted to devolve the primary education mandate to lower government tiers at their discretion, which further blurs the assignment of responsibilities. In effect, the central government has little control over the numbers or quality of teachers hired, and the local governments hiring the teachers do not face the financial consequences of their actions. Performance monitoring in education has evolved gradually. As in the case of other priority sectors, the tracking of education outcomes against nationwide priorities has hinged heavily from the national budget for the identification of performance indicators. Some progress has been made in moving away from purely quantitative targets, such as the number of exercise books, to contextual targets, such as the ratio of text books to pupils, but even these new targets remain to be input-oriented. Focused monitoring through PETSs has also become systematic.25 A widely quoted PETS found that during the first half of the 1990s only some 30 percent of funding for nonwage education spending reached the schools (Reinika 2000).26 This share improved sharply, to about 90 percent in 1999/2000, through strengthened transparency and procurement procedures. Survey data confirms that the heightened attention paid to education in Uganda since the mid-1990s has yielded positive results. The introduction of the UPE program in 1997, aimed at providing free primary education to Ugandan children, generated a boom in primary school enrollment almost immediately. Across the country, the net enrollment ratio climbed
24 Including several conditional grants covering the primary and secondary and tertiary education levels. 25 The education sector has had at least five PETSs since 1996. Every year, an area of concern identified during the semiannual sector review is evaluated through PETSs. The last four assessments have covered: (i) two studies on the status of Universal Primary Education system; (ii) the Teachers’ Recruitment, Deployment, and Payroll Management; (iii) the Value-for-Money of the School Facilities Grant; and (iv) the Cost-Effectiveness and Efficiency of Education Spending, for which the terms of reference are currently being prepared. 26 The first PETS in the Ugandan education sector, undertaken in 1996, disputed official records, which seemed to understate the increase in primary enrollment during 1991–1995, following an increase in funding. Despite the increases in primary enrollment, the study also showed a significant amount of leakage of resources before they reached schools, and serious accountability problems on nonwage education spending (World Bank 2003).

- 22 -
from 67 percent to 79 percent between 1995 and 2000, reaching 90 percent by 2004 (Table 3). Uganda reached primary school net enrollment rates slightly exceeding 100 percent shortly afterwards, suggesting that the goal of universal primary education was broadly achieved (Table 4).27 Moreover, regional data also show a reduction in the disparities in enrollment over time. The poorest regions— identified as those with higher shares of people in the lowest quintile of the income distribution—have increased enrollment faster than other regions, and no gender disparities are apparent.28 Secondary school net enrollment remains extremely low. The ratio increased only from 10 percent in 1995 to about 14 percent at the country level in 2000 (Table 5). In addition, it suffered huge regional differences—ranging from a minimum of 5 percent in the Northern region—which is the poorest one and plagued by a guerrilla war—to 22 percent in the Central region, which has the lowest poverty rate (Table 3) Moreover, enrollment in secondary schools has not substantially increased in the recent years. Net enrollment rates are expected to rise, however, as the bulk of students attending primary education graduate to secondary school levels, putting additional demands on this service, and stretching available resources further. School attendance has been undermined by a host or constraints, especially in rural areas. Physical and financing restrictions are the main reasons deterring children’s continuous attendance to primary school. Results from the National Delivery Survey (2004) suggest that the need to cover long distances between the place of residence and the school is a significant disincentive for attendance, particularly at young ages.29 High education costs also reduce attendance—while under UPE, public schools are supposed to provide free services, the 2004 Survey revealed that two thirds of the interviewees declared to be paying nonspecified fees, including for building development and lunch provision. Finally, nearly a quarter of the oldest children drop out school because they need to work—a problem that is likely affecting secondary school enrollment and attendance as well. The public sector is the main, but not the only provider of education in Uganda. In 2004, it owned almost 80 percent of primary schools, but less than 30 percent of secondary schools. Quality of public school is lower than that of private schools, as indicated by the much higher pupil-to-teacher and pupil-to-class ratios, although the ratios at public schools are slowly improving (Table 6). The indicators on the quality of public education vary widely across districts. For example, in 2003, the pupil-to-teacher ratio ranged between 39 and 90, suggesting significant stress on the capacity of the available teachers,
27 Data from the Ministry of Education’s Statistical Abstract for 2003 also shows a net enrollment ratio of slightly over 100 percent 28 Unfortunately, no distinction between rural and urban areas is available in regional data. 29 In fact, according to the Ministry of Education survey for the year 2001, distance to school represents for 24 percent of the persons interviewed the main reason for not attending school.

- 23 -
Table 3. Primary School Net Enrollment, 1995–2004
1995 2000 2004 Total Male Female Total Male Female Poverty
Incidence Total Male Female
Central 79 77 80 77 77 78 20 n.a n.a n.a Eastern 68 70 67 87 88 86 28 n.a n.a n.a Northern 55 62 44 70 69 70 37 n.a n.a n.a Western 64 65 63 78 76 79 65 n.a n.a n.a Total 67 79 35 90 93 88
Source: Education Profile and Education Statistics Abstract, and 1999/2000 Uganda National Household Survey (UNHS).
Table 4. Secondary School Net Enrollment
1995 2000 2004 Total Male Female Total Male Female Total Male Female Central 16 18 14 22 20 24 n.a n.a n.a Eastern 9 10 8 14 13 15 n.a n.a n.a Northern 5 8 2 5 7 4 n.a n.a n.a Western 9 10 8 10 10 10 n.a n.a n.a Total 10 14 15 16 14
Source: DHS Education Profile and Education Statistics Abstract 2004.
Table 5. Reasons For Not Attending School, 2003
Age Too young
Long distance
High cost
Lack of interest
Disability Need to work
Other All
6 62.5 40.4 32.4 13.8 19.7 6.3 17.2 47.6 7 19.7 15.2 18.1 25.8 19.8 15.1 28.3 19.8 8 9.8 20.7 17.6 14.7 19.6 18.3 12.7 12.6 9 3.7 4.7 5.2 10.1 7.9 12.9 26.2 5.8
10 2.4 10.1 15.0 17.0 18.6 19.3 4.1 7.1 11 1.2 1.5 3.3 7.1 6.4 5.9 6.3 2.6 12 0.7 7.4 8.4 11.5 7.9 22.2 5.3 4.5
Total 100.0 100.0 100.0 100.0 100.0 100.0 100.0 100.0
Source: National Service Delivery Survey, 2004.

- 24 -
Table 6. Indicators for Government and Private Primary Schools, 2003–04
Type of School Indicator Public Private All
2002 2004 2002 2004 2002 2004 Pupil-to-teacher ratio 56 53 28 n.a. 52 50 Pupil-to-classroom ratio 94 n.a. 41 n.a. 87 n.a.
Source: Uganda Ministry of Education, Statistical Abstract 2003–2004 especially in the rural areas (Table 7).30 Huge disparities were also present on the pupil-to-classroom ratio, which varied from 33 to 187, reflecting the capacity of districts to comply with their responsibility of building and equipping schools. Sizable pupil-per-classroom ratios are a clear indicator of lower quality and constraints on teachers as well as physical infrastructure—the rate of construction of new premises does not follow adequately the rate of growth of pupils. Outcomes in health care Health care has also been a social priority in Uganda. The sector has experienced a growing inflow of resources, in line with the implementation of the PEAP. In this context , local governments were assigned growing resources to finance service delivery related to primary health care centers and district hospitals and referral hospitals. As in the case of the education sector, these funds were channeled mainly through a number of conditional grants—which also covered the salaries of primary health care workers and other district health workers. However, as noted earlier, the overall resource delivery of the health sector has become more centralized over time, once the earmarked donor resources for specific projects are taken into consideration. As in the case of the education, the dependence on funding and policy priorities predefined from the center, as well as the re-centralization tendencies observed in the overall flow of sectoral resources have likely reduced the horizontal accountability of the local authorities regarding service delivery. Detailed information on health care outcomes in Uganda is scant. There is no data that may allow for territorial disaggregation or intertemporal comparisons, and hence it is difficult to draw definite conclusions about the impact of decentralization in this sector.31 The available data hints at a worsening in health care performance. In fact, countrywide trends (Table 8) suggest that mortality indicators have generally deteriorated over time 30 The problems with updating the payroll data may either overstate or understate these indicators. On the one hand, there may be teachers providing services not incorporated in the registry; at the same time, the authorities have often recognized the presence of “ghost” teachers in the payroll. 31 The health sector has also had several surveys to track performance in specific areas. Specifically, PETSs have been implemented for: (i) funds under the primary health care conditional grant (2001); (ii) drugs (2002); and (iii) conditional grant for shared services (2003).

- 25 -
Table 7. Indicators for Government Primary Schools Per District, 2003
District
Pupil Teacher
Ratio (September
Payroll)
Pupil
Classroom Ratio
District
Pupil Teacher
Ratio (September
Payroll)
Pupil
Classroom Ratio
1 Adjumani 74 59 30 Kyenjojo 61 92 2 Apac 62 119 31 Lira 56 84 3 Arua 63 130 32 Luwero 50 70 4 Bugiri 61 103 33 Masaka 48 82 5 Bundibugyo 54 88 34 Masindi 51 87 6 Bushenyi 56 78 35 Mayuge 57 128 7 Busia 57 89 36 Mbale 55 110 8 Gulu 59 96 37 Mbarara 50 92 9 Hoima 53 71 38 Moroto 45 53
10 Iganga 62 118 39 Moyo 52 64 11 Jinja 58 91 40 Mpigi 66 81 12 Kabale 43 77 41 Mubende 59 100 13 Kabarole 52 97 42 Mukono 46 77 14 Kaberamaido 61 84 43 Nakapiripirit 77 104 15 Kalangala 39 33 44 Nakasongola 38 60 16 Kampala 46 61 45 Nebbi 70 105 17 Kamuli 67 103 46 Ntungamo 56 80 18 Kamwenge 53 93 47 Pader 80 154 19 Kanungu 50 82 48 Pallisa 64 103 20 Kapchorwa 50 95 49 Rakai 41 84 21 Kasese 57 101 50 Rukungiri 43 65 22 Katakwi 56 93 51 Sembabule 55 97 23 Kayunga 68 98 52 Sironko 59 95 24 Kibaale 56 83 53 Soroti 60 98 25 Kiboga 51 80 54 Torero 62 187 26 Kisoro 53 70 55 Wakiso 48 68 27 Kitgum 71 122 56 Yumbe 69 185 28 Kotido 72 115 National Total 56 94 29 Kumi 56 90
Source: Uganda Ministry of Education, Statistical Abstract 2003
Table 8. Mortality Indicators
1995 2000 Infant mortality (per 1,000 live births) 81.3 88.4 Neonatal mortality (per 1,000 live births) 27.0 33.2 Post neonatal mortality (per 1,000 live births) 54.3 55.2 Maternal mortality (per 100,000 live births) 527 505 Source: UDHS 1995, 2000.

- 26 -
(World Bank 2003). Information on infant and child mortality by regions (Tables 9–10), also shows wide geographical variations, reflecting the structural characteristics of the regions. Most strikingly, while some reduction of mortality in the richest regions is apparent, the impact of the war and other adverse factors seems to have seriously worsened the health outcomes in Northern and Western Uganda, particularly in what respects to the child mortality rate.32 Data also suggest that the quality of service provision has been weak. According to the National Service Delivery Survey (2004), the government is only one provider of health services—but about one third of sick people did not make use of such services, owing to the “lack of drugs, demand for payment, and the long distance to the facilities”. Data also indicate that the illegal charge of fees and other payments appears to have increased—from about 40 percent of patients, according to the National Integrity Survey of 2002, to 50 percent according to the National Service Delivery Survey for 2004. Access to safe water Uganda’s spending in water services has been relatively modest compared to that in education and health, although spending on water and sanitation is often perceived as a key factor for improving in health outcomes—including infant mortality. In Uganda, the share of expenditure in water and sanitation executed directly by the local authorities—particularly, the districts and municipalities—is relatively large, even when the financing of earmarked donor projects is taken into account. As in the case of education and health, the funds are allocated by the center in the form of a conditional grant to the local authorities. At the same time, the weight of the water sector as a share of total general government spending has been very small—at about 3 percent—suggesting that the sector has not received particularly high attention by the center. The information on water outcomes is relatively better than that available for the health sector. Variations on the distance of access to safe water are a crucial indicator of the impact of policy, particularly from the point of view of the poor. Distant access uses time and energy and hampers the effort exerted by individual to overcome their poverty conditions.33
32 There is widespread public recognition that Uganda has been one the most successful countries in fighting HIV/AIDS. This fight has been engaged both the central and the local governments, but there is no information on the specific actions at the subnational level. 33 The water and sanitation sector has also implemented PETSs. In 2002, at the request of the MFPED, a technical audit/value-for-money study was initiated for the rural water and sanitation conditional grant. While some questions arose about the methodology and overall quality of both studies, their completion allowed the Ministry to focus its efforts on a deeper analysis of areas of concern.

- 27 -
Table 9. Infant Mortality by Region, 1995–2000
1995 2000 Incidence of poverty 2000
Central 77 72 20 Eastern 98 89 28 Northern 99 106 37 Western 75 98 65
Source: UDHS 1995, 2000.
Table 10. Child (Under-five) Mortality by Region, 1995–2000
1995 2000 Incidence of poverty 2000
Central 141 135 20 Eastern 176 147 28
Northern 190 178 37 Western 131 176 65
Source: UDHS 1995, 2000. The data suggest a significant improvement in water service provision, especially in the poorest jurisdictions. At the national level, the wealthiest quintiles have seen reduced their importance in the share of access to water services, while the poorest quintiles have seen it increase (Table 11). This pattern is supported by the regional data—in most regions, accessibility to safe water has increased for the lowest quintile of population, while decreasing for the highest quintile. Access to water for the lowest quintile is quite high in the Northern region, which is poor and ravaged by war, and low in the Central region, which is the richest. Perhaps surprisingly, the regional variations in service provision are relatively mild. There are no substantial discrepancies in the distance to access to water by communities (Table 12), with the exception of the Central region, where the share of communities situated at a distance of less than one kilometer from a safe source has decreased slightly.
B. The Outcomes: A Possible Explanation
In summary, the survey data shows an improving performance in the education and water sectors, as opposed to that observed in the health sector. Three main factors appear to be behind this outcome:
National relevance. In particular, the education sector has been at the forefront of
Uganda’s development priorities since early in the 1990s. As a result, it has received significantly more resources and scrutiny than other sectors—by the central and local governments, and by Uganda’s development partners. To this extent, the improvements observed are not directly linked to the benefits of decentralization, but rather to the

- 28 -
Table 11. Accessibility to Safe Water by Income Quintile and by Region, 1992–2002
Region/Quintile I II III IV V
National Total 2002 20.8 22.9 20.6 15.4 20.3 1996 20.5 21.5 21.7 13.6 22.7 1992 16.9 18.7 21.9 13.8 28.8
Central Region
2002 8.7 11.2 21.5 23.3 35.4 1996 6.0 10.6 20.5 20.5 42.4 1992 2.0 9.6 19.0 21.2 48.2
Eastern Region
2002 29.2 29.3 18.0 8.6 15.0 1996 24.9 31.3 20.9 10.0 12.9 1992 22.8 22.6 21.7 12.0 20.9
Northern Region
2002 42.3 26.1 17.7 10.2 3.7 1996 53.5 17.3 16.1 8.8 4.3 1992 52.7 19.4 14.4 7.5 6.0
Western Region
2002 13.4 31.0 24.3 15.3 16.0 1996 13.8 35.0 29.3 8.8 13.0 1992 11,6 33,6 34,3 5,5 14,9
Source: N. Rudaheranwia, L. Bategeka, and M. Banga, Beneficiary of water services delivery in Uganda, Economic Policy Research Centre. Kampala, 2003. Original sources of data are National Health Surveys (in particular that for 2002).
Table 12. Distance of Access to Water by Communities, 1992–2002
Communities with Access to Safe Water Within a Distance of Less Than 1 km
1992 1996 1999 2002 Central Urban 20.8 17.1 9.8 13.5 Central Rural 22.3 21.5 20.5 20.7 Eastern Urban 5.7 4.8 9.9 9.3 Eastern Rural 12.5 16.9 16.9 17.3 Northern Urban 5.9 5.8 6.2 5.2 Northern Rural 12.1 12.6 12.3 11.4 Western Urban 7.6 8 12 8.2 Western Rural 13.2 13.4 12.5 14.3
Source: N. Rudaheranwia, L. Bategeka, and M. Banga, Beneficiary of water services delivery in Uganda, cit.

- 29 -
central government’s efforts to strengthen basic education services, including through a heavy monitoring system of the local authorities. To a lesser degree, the achievements in the water sector may also be the result from a well-targeted use of resources—albeit at a much smaller scale—as directed by the center.
A sectoral structure that favors horizontal accountability. According to donor
assessments, while the involvement of the direct beneficiaries in the management and monitoring of service delivery usually varies across sectors, the education sector appears to have received the most attention. In particular, school management committees have been reported as the most effective units for horizontal accountability—perhaps because the parent-teacher relationship is strong, and the link between parents and their children’s education providers tends to be continuous over the medium-term nature, thus allowing for close supervision. Experience shows that maintaining user committees in other sectors has proven harder, likely because the relationship between the service providers and the beneficiaries tends to be more sporadic (World Bank 2003). Interestingly, the provision of water-services also generates a long-term and constant relation between the service provider and the beneficiaries, creating space for the emergence of horizontal accountability.
Relatively higher autonomy in decision making the local authorities. Improvements in
the water sector are striking, especially because the relatively small amounts allocated to the sector over time do not support viewing the sector as a headline in the central government’s priorities. There is, however, a crucial feature in the sector’s financing structure that calls attention: namely, the resources allocated to the local authorities to finance service delivery under the conditional grant were largely nonwage related. In fact, the share of development expenditures exceeded 95 percent throughout the 1990s. This situation is almost opposite to that observed in the cases of education and health sectors, were recurrent spending—mostly to serve politically-sensitive and rigid wages—has consistently neared 70–80 percent. Therefore, the capital-intensiveness of the water sector, as well as it relatively unimportance, seems to have brought significant flexibility to the local authorities, allowing them to allocate resources for specific water projects more efficiently and significantly improving delivery, while still meeting the requirements imposed by the central government’s conditional grants.34
V. FINAL REMARKS
While there was much initial enthusiasm, Uganda’s decentralization process soon became subject to “central directions” taking it more towards deconcentration in certain areas. Indeed, the initial model implemented focused ambitiously on the devolution of significant spending functions to the local authorities. However, the center soon imposed a revenue structure that made the local authorities overly dependent on the center. Also, with the flow of donor funds for priority spending on education and health care, there was greater
34 Interestingly, the share of donor-earmarked financed projects in the total development budget for the water sector has also been quite modest, at rates below 10 percent of total spending.

- 30 -
pressure on the center to ensure that the funds were being effectively spent and tracked. By creating a strong arrangement to ensure vertical accountability to the center and the donor community, the government may have undermined local autonomy, as well as the horizontal accountability links on which decentralization frameworks rely, thus hampering effective service delivery. Capacity constraints and loopholes in the PFM system also contributed to this result. In this light, Uganda’s decentralization reform appears to have fallen short of its promise in key areas of public service delivery. The assessment of service outcomes in key priority sectors—including education, health, and water services—tend to provide only mixed results. The close examination of sectoral outcomes appears to support these conclusions. The sector that has performed best—water services—received only a minimal share of the overall government expenditure over the last 15 years, but has structural features that favor the creation of grassroots monitoring mechanisms and horizontal accountability. In addition, by being largely capital-intensive and domestically financed, it has escaped decision-making restrictions faced by other sectors dealing with a largely rigid and politically sensitive wage component. Going forward, Uganda has the option of providing greater responsibilities in key sectors to the local authorities. While the process should be adequately sequenced to avoid failures in service delivery, especially in the poorer areas, strengthening devolution and the ability to reallocate resources in line with local priorities and needs will create incentives for a better expenditure management cycle—including an improved budget (owned by the local authorities), and more careful execution and better and more streamlined reporting (to satisfy the requirements for quality assurance of Uganda’s development partners). The alternative will be an increasingly greater reliance on central mandates and deconcentrated operations. It is evident that political economy concerns will be important in the choice that eventually results in Uganda.

- 31 -
References
Ablo, E., and R. Reinikka, 1998, “Do Budget Really Matter? Evidence from Public Spending on Education and Health in Uganda” (unpublished; Washington: World Bank).
Ahmad, Junaid, S. Devarajan, S. Khemani, and S. Shah, 2005, “Decentralization and Service
Delivery,” World Bank Policy Research Working Paper No. 3603 (Washington: World Bank).
Brixiova, Z., 1998, “Public Service Reform,” Uganda: Selected Issues and Statistical
Appendix, IMF Staff Country Report No. 98/61 (Washington: International Monetary Fund). June 1998
Golola, Moses, “Decentralization, Local Bureaucracies and Service Delivery in Uganda,”
WIDER Discussion Paper No. 2001/115 (Helsinki: World Institute for Development Economics Research).
Government of Uganda, 2004, Poverty Eradication Action Plan, 2004/05. Integrated Institutional Plan (IIP), 2004, 2004–07 Final Report Ministry of Local
Government, Kampala. Jeppson, Anders, 2001, “Financial Priorities under Decentralization in Uganda,” Health
Policy and Planning, Vol. 16, No. 2, pp 187–92. Kjaer, Anne Mette, 2004, “Old Brooms Can Sweep Too!: An Overview of Rulers and Public
Sector Reforms in Uganda, Tanzania, and Kenya,” Journal of Modern African Studies, Vol. 42, No. 3, pp. 389–413.
Langseth, Peter, 1995, “Civil Service Reform in Uganda: Lessons Learned,” Public
Administration and Development, Vol. 15, No. 4, pp. 365-90. Nsibambi, Apollo, 1998, “Financing Decentralization,” in Decentralization and Civil Society
in Uganda: The Quest for Good Governance, ed. by A. Nsibambi (Kampala: Fountain Publishers).
Reinika, R., 2000, Recovery in Service Delivery: Evidence from Schools and Clinics
(Washington: The World Bank). Steffensen, Jesper, Per Tideman, Harriet Naitore, Emmanual Ssewankambo, and Eke
Mauaipopo, 2004, “A Comparative Analysis of Decentralization in Kenya, Tanzania, and Uganda,” Final Synthesis Report, (Washington: The World Bank).
The Republic of Uganda, 2004, Country Integrated Fiduciary Assessment, Volumes I and V,
World Bank, August 2004, Report No. 29377-UG, Washington.

- 32 -
World Bank, 2003a, Uganda Public Expenditure Review 2003, (Washington). ———, 2003b, Decentralization Policies and Practices: Case Study Uganda (Washington).