Improving malaria diagnosis and treatment in the private retail sector in uganda a mbonye
1
Uganda Malaria Quarterly Bulletin Issue 10: April — June 2015
Uganda Ministry of Health | National Malaria Control Program | P.O. Box 7272 | Kampala | Uganda
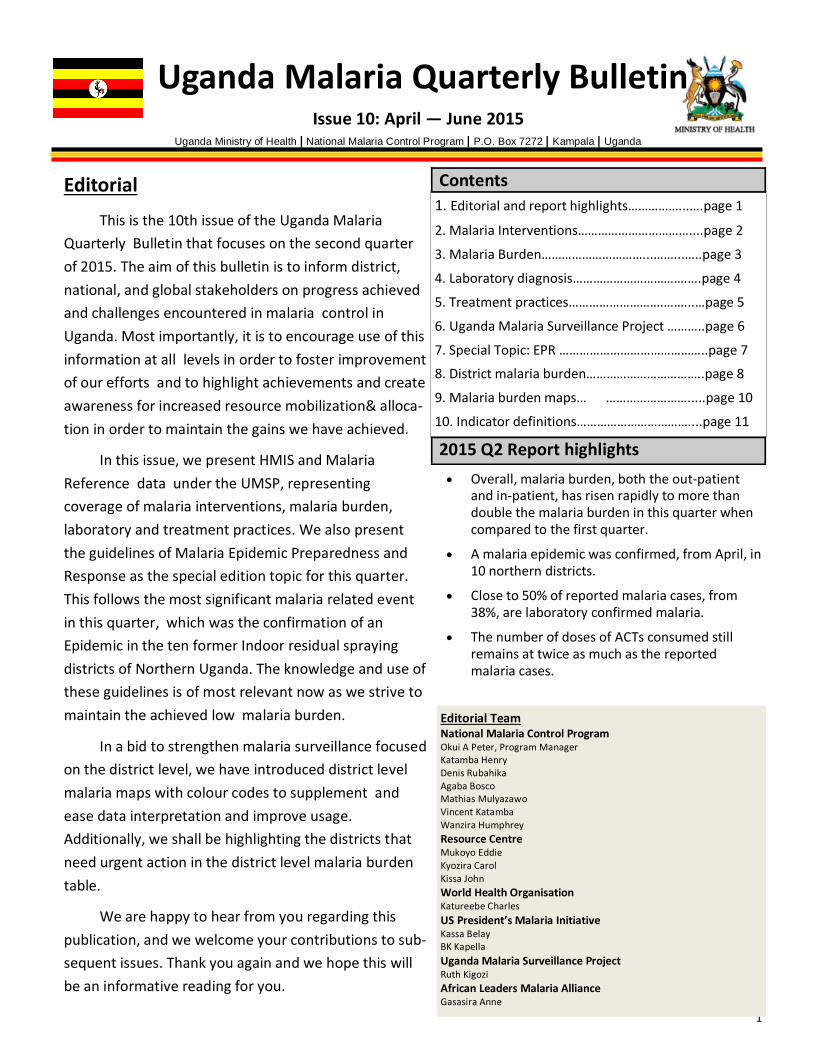
Editorial This is the 10th issue of the Uganda Malaria Quarterly Bulletin that focuses on the second quarter of 2015. The aim of this bulletin is to inform district, national, and global stakeholders on progress achieved and challenges encountered in malaria control in Uganda. Most importantly, it is to encourage use of this information at all levels in order to foster improvement of our efforts and to highlight achievements and create awareness for increased resource mobilization& alloca-tion in order to maintain the gains we have achieved.
In this issue, we present HMIS and Malaria Reference data under the UMSP, representing coverage of malaria interventions, malaria burden, laboratory and treatment practices. We also present the guidelines of Malaria Epidemic Preparedness and Response as the special edition topic for this quarter. This follows the most significant malaria related event in this quarter, which was the confirmation of an Epidemic in the ten former Indoor residual spraying districts of Northern Uganda. The knowledge and use of these guidelines is of most relevant now as we strive to maintain the achieved low malaria burden.
In a bid to strengthen malaria surveillance focused on the district level, we have introduced district level malaria maps with colour codes to supplement and ease data interpretation and improve usage. Additionally, we shall be highlighting the districts that need urgent action in the district level malaria burden table.
We are happy to hear from you regarding this publication, and we welcome your contributions to sub-sequent issues. Thank you again and we hope this will be an informative reading for you.
Contents 1. Editorial and report highlights……………...….page 1
2. Malaria Interventions……………………………....page 2 3. Malaria Burden…………………………...……...…..page 3 4. Laboratory diagnosis…………………………….….page 4 5. Treatment practices……………………….……...…page 5 6. Uganda Malaria Surveillance Project ………..page 6 7. Special Topic: EPR ……………………………………..page 7 8. District malaria burden……………………………..page 8 9. Malaria burden maps… …………………….....page 10 10. Indicator definitions……………………………....page 11
2015 Q2 Report highlights • Overall, malaria burden, both the out-patient
and in-patient, has risen rapidly to more than double the malaria burden in this quarter when compared to the first quarter.
• A malaria epidemic was confirmed, from April, in 10 northern districts.
• Close to 50% of reported malaria cases, from 38%, are laboratory confirmed malaria.
• The number of doses of ACTs consumed still remains at twice as much as the reported malaria cases.
Editorial Team National Malaria Control Program Okui A Peter, Program Manager Katamba Henry Denis Rubahika Agaba Bosco Mathias Mulyazawo Vincent Katamba Wanzira Humphrey Resource Centre Mukoyo Eddie Kyozira Carol Kissa John World Health Organisation Katureebe Charles US President’s Malaria Initiative Kassa Belay BK Kapella Uganda Malaria Surveillance Project Ruth Kigozi African Leaders Malaria Alliance Gasasira Anne
2
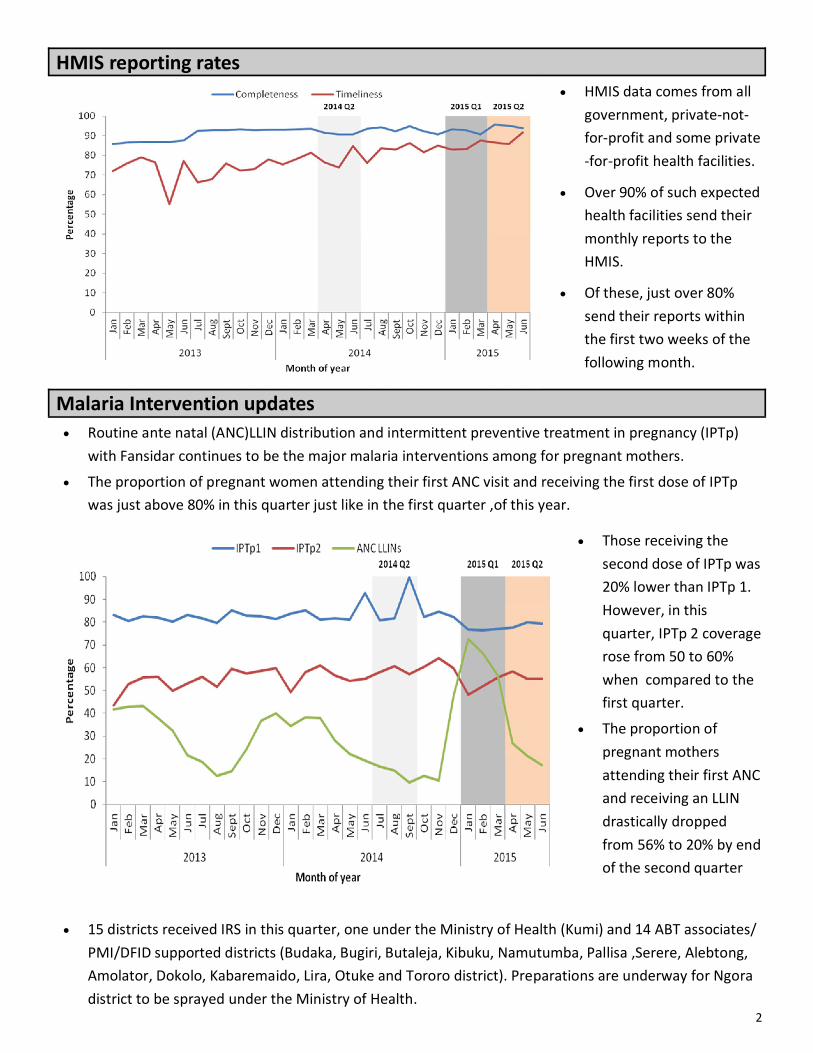
HMIS reporting rates
Malaria Intervention updates
• Routine ante natal (ANC)LLIN distribution and intermittent preventive treatment in pregnancy (IPTp) with Fansidar continues to be the major malaria interventions among for pregnant mothers.
• The proportion of pregnant women attending their first ANC visit and receiving the first dose of IPTp was just above 80% in this quarter just like in the first quarter ,of this year.
• HMIS data comes from all government, private-not-for-profit and some private-for-profit health facilities.
• Over 90% of such expected health facilities send their monthly reports to the HMIS.
• Of these, just over 80% send their reports within the first two weeks of the following month.
• 15 districts received IRS in this quarter, one under the Ministry of Health (Kumi) and 14 ABT associates/PMI/DFID supported districts (Budaka, Bugiri, Butaleja, Kibuku, Namutumba, Pallisa ,Serere, Alebtong, Amolator, Dokolo, Kabaremaido, Lira, Otuke and Tororo district). Preparations are underway for Ngora district to be sprayed under the Ministry of Health.
• Those receiving the second dose of IPTp was 20% lower than IPTp 1. However, in this quarter, IPTp 2 coverage rose from 50 to 60% when compared to the first quarter.
• The proportion of pregnant mothers attending their first ANC and receiving an LLIN drastically dropped from 56% to 20% by end of the second quarter
3
Malaria Burden
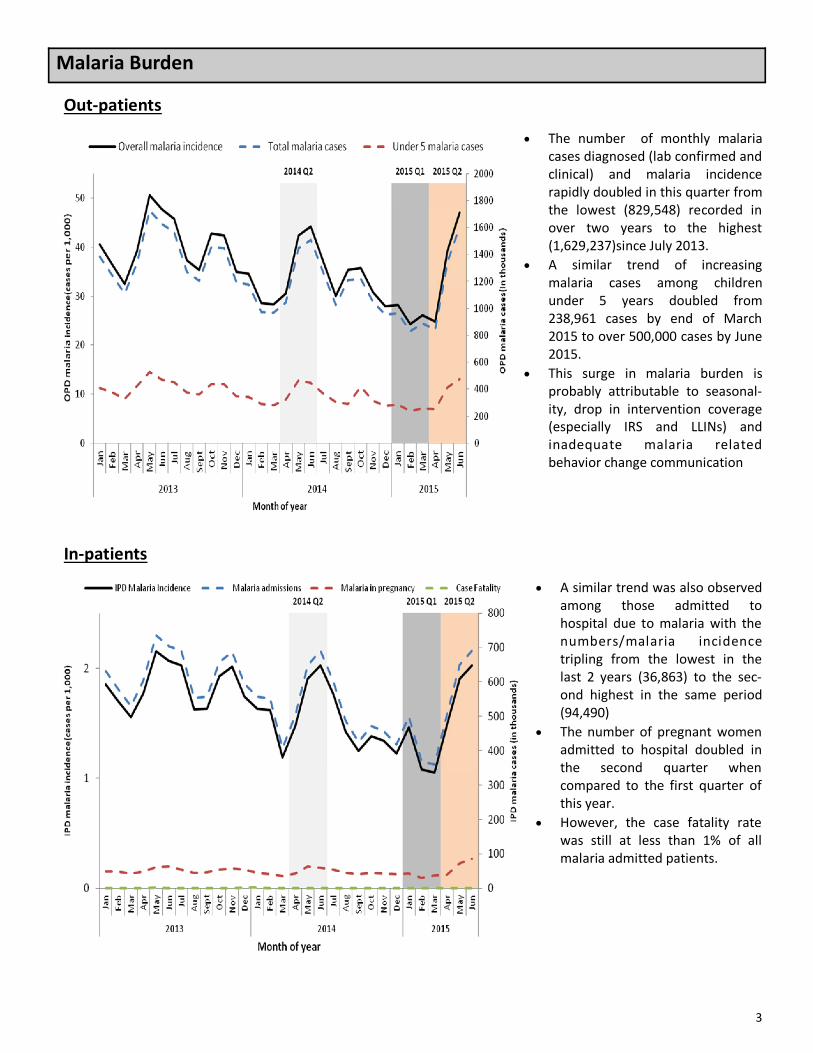
• The number of monthly malaria cases diagnosed (lab confirmed and clinical) and malaria incidence rapidly doubled in this quarter from the lowest (829,548) recorded in over two years to the highest (1,629,237)since July 2013.
• A similar trend of increasing malaria cases among children under 5 years doubled from 238,961 cases by end of March 2015 to over 500,000 cases by June 2015.
• This surge in malaria burden is probably attributable to seasonal-ity, drop in intervention coverage (especially IRS and LLINs) and inadequate malaria related behavior change communication
• A similar trend was also observed among those admitted to hospital due to malaria with the numbers/malaria incidence tripling from the lowest in the last 2 years (36,863) to the sec-ond highest in the same period (94,490)
• The number of pregnant women admitted to hospital doubled in the second quarter when compared to the first quarter of this year.
• However, the case fatality rate was still at less than 1% of all malaria admitted patients.
Out-patients
In-patients
4
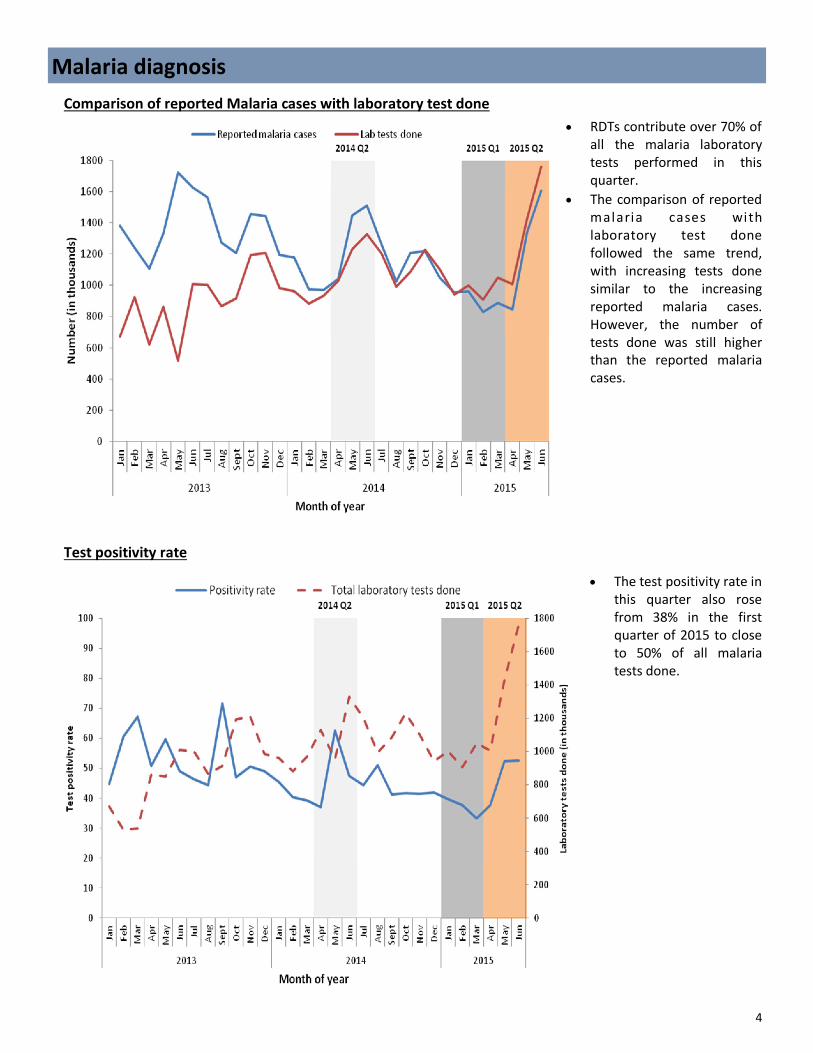
Malaria diagnosis Comparison of reported Malaria cases with laboratory test done
Test positivity rate
• RDTs contribute over 70% of all the malaria laboratory tests performed in this quarter.
• The comparison of reported malaria cases with laboratory test done followed the same trend, with increasing tests done similar to the increasing reported malaria cases. However, the number of tests done was still higher than the reported malaria cases.
• The test positivity rate in this quarter also rose from 38% in the first quarter of 2015 to close to 50% of all malaria tests done.
5
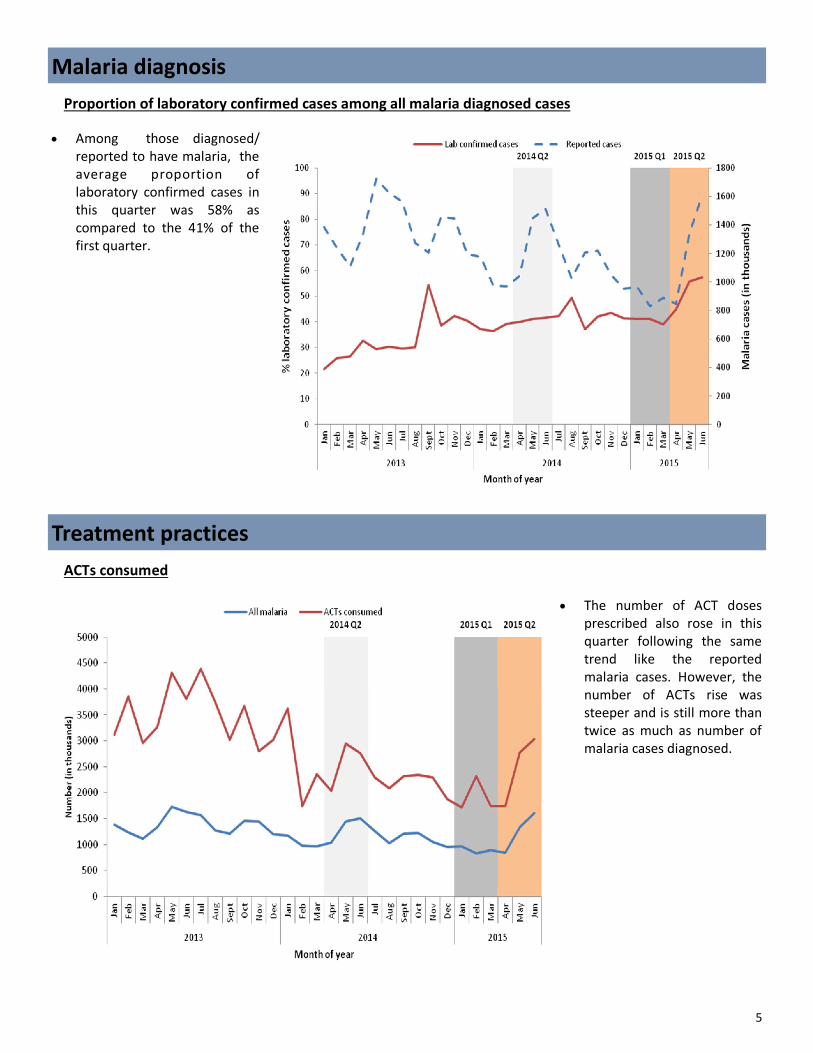
Proportion of laboratory confirmed cases among all malaria diagnosed cases
• The number of ACT doses prescribed also rose in this quarter following the same trend like the reported malaria cases. However, the number of ACTs rise was steeper and is still more than twice as much as number of malaria cases diagnosed.
• Among those diagnosed/reported to have malaria, the average proportion of laboratory confirmed cases in this quarter was 58% as compared to the 41% of the first quarter.
Treatment practices
Malaria diagnosis
ACTs consumed
6
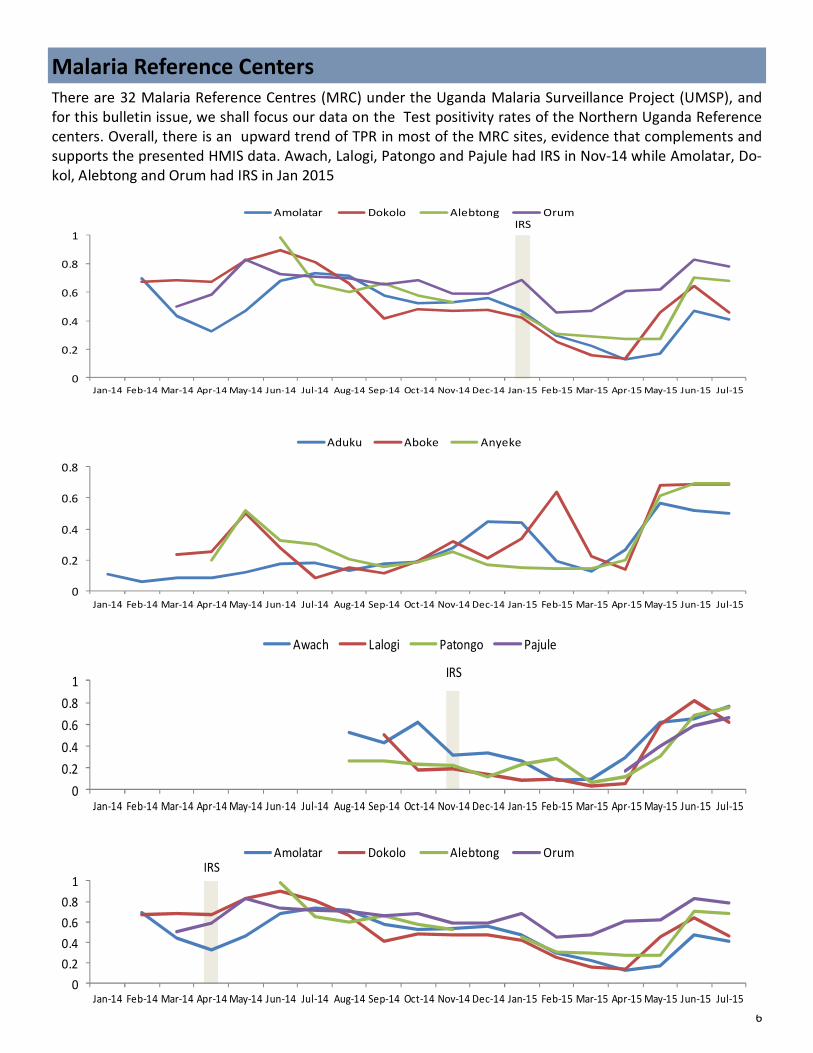
Malaria Reference Centers There are 32 Malaria Reference Centres (MRC) under the Uganda Malaria Surveillance Project (UMSP), and for this bulletin issue, we shall focus our data on the Test positivity rates of the Northern Uganda Reference centers. Overall, there is an upward trend of TPR in most of the MRC sites, evidence that complements and supports the presented HMIS data. Awach, Lalogi, Patongo and Pajule had IRS in Nov-14 while Amolatar, Do-kol, Alebtong and Orum had IRS in Jan 2015
IRS
0
0.2
0.4
0.6
0.8
1
Jan-14 Feb-14 Mar-14 Apr-14 May-14 Jun-14 Jul-14 Aug-14 Sep-14 Oct-14 Nov-14 Dec-14 Jan-15 Feb-15 Mar-15 Apr-15 May-15 Jun-15 Jul-15
Amolatar Dokolo Alebtong Orum
0
0.2
0.4
0.6
0.8
Jan-14 Feb-14 Mar-14 Apr-14 May-14 Jun-14 Jul-14 Aug-14 Sep-14 Oct-14 Nov-14 Dec-14 Jan-15 Feb-15 Mar-15 Apr-15 May-15 Jun-15 Jul-15
Aduku Aboke Anyeke
IRS
00.20.40.60.8
1
Jan-14 Feb-14 Mar-14 Apr-14 May-14 Jun-14 Jul-14 Aug-14 Sep-14 Oct-14 Nov-14 Dec-14 Jan-15 Feb-15 Mar-15 Apr-15 May-15 Jun-15 Jul-15
Amolatar Dokolo Alebtong Orum
IRS
00.20.40.60.8
1
Jan-14 Feb-14 Mar-14 Apr-14 May-14 Jun-14 Jul-14 Aug-14 Sep-14 Oct-14 Nov-14 Dec-14 Jan-15 Feb-15 Mar-15 Apr-15 May-15 Jun-15 Jul-15
Awach Lalogi Patongo Pajule
7
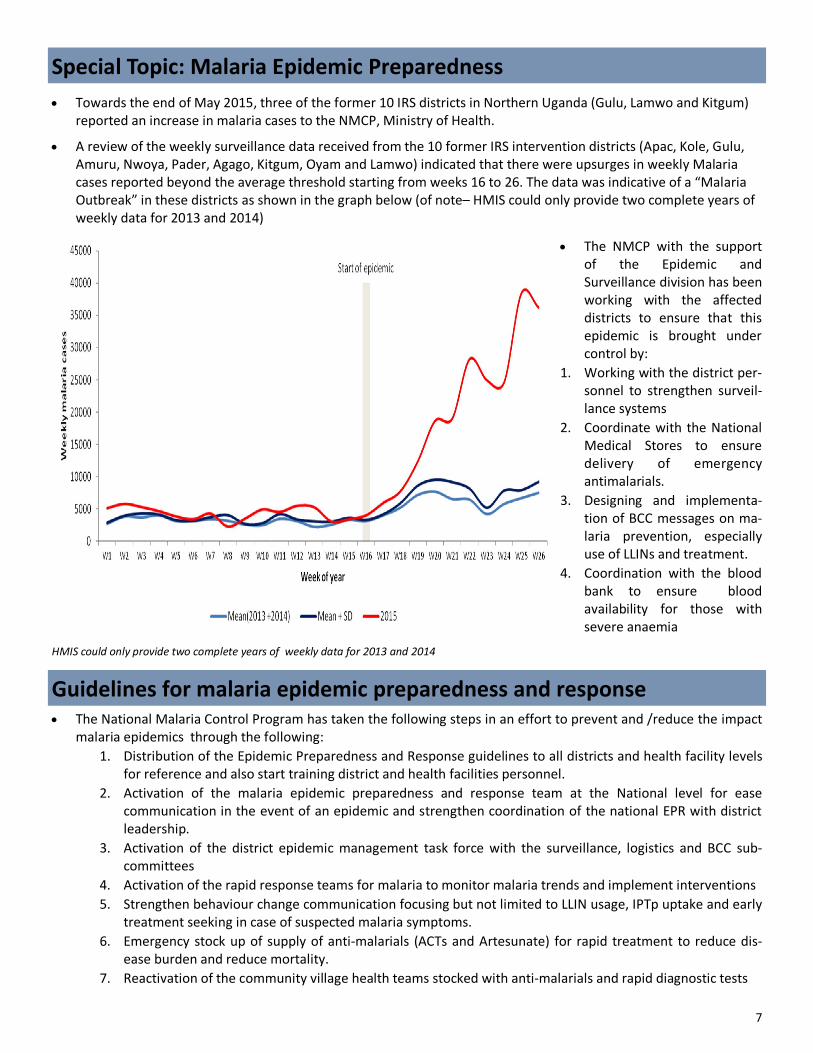
Special Topic: Malaria Epidemic Preparedness • Towards the end of May 2015, three of the former 10 IRS districts in Northern Uganda (Gulu, Lamwo and Kitgum)
reported an increase in malaria cases to the NMCP, Ministry of Health.
• A review of the weekly surveillance data received from the 10 former IRS intervention districts (Apac, Kole, Gulu, Amuru, Nwoya, Pader, Agago, Kitgum, Oyam and Lamwo) indicated that there were upsurges in weekly Malaria cases reported beyond the average threshold starting from weeks 16 to 26. The data was indicative of a “Malaria Outbreak” in these districts as shown in the graph below (of note– HMIS could only provide two complete years of weekly data for 2013 and 2014)
• The National Malaria Control Program has taken the following steps in an effort to prevent and /reduce the impact malaria epidemics through the following:
1. Distribution of the Epidemic Preparedness and Response guidelines to all districts and health facility levels for reference and also start training district and health facilities personnel.
2. Activation of the malaria epidemic preparedness and response team at the National level for ease communication in the event of an epidemic and strengthen coordination of the national EPR with district leadership.
3. Activation of the district epidemic management task force with the surveillance, logistics and BCC sub-committees
4. Activation of the rapid response teams for malaria to monitor malaria trends and implement interventions 5. Strengthen behaviour change communication focusing but not limited to LLIN usage, IPTp uptake and early
treatment seeking in case of suspected malaria symptoms. 6. Emergency stock up of supply of anti-malarials (ACTs and Artesunate) for rapid treatment to reduce dis-
ease burden and reduce mortality. 7. Reactivation of the community village health teams stocked with anti-malarials and rapid diagnostic tests
Guidelines for malaria epidemic preparedness and response
• The NMCP with the support of the Epidemic and Surveillance division has been working with the affected districts to ensure that this epidemic is brought under control by:
1. Working with the district per-sonnel to strengthen surveil-lance systems
2. Coordinate with the National Medical Stores to ensure delivery of emergency antimalarials.
3. Designing and implementa-tion of BCC messages on ma-laria prevention, especially use of LLINs and treatment.
4. Coordination with the blood bank to ensure blood availability for those with severe anaemia
HMIS could only provide two complete years of weekly data for 2013 and 2014
8
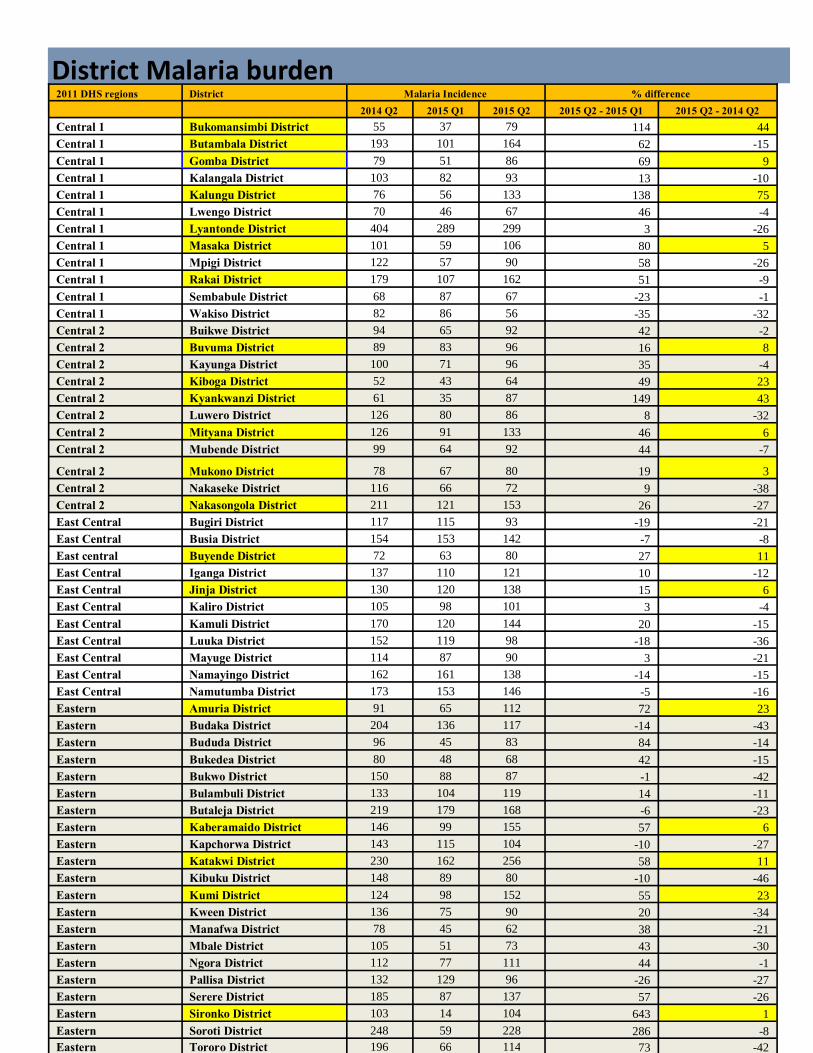
District Malaria burden 2011 DHS regions District Malaria Incidence % difference 2014 Q2 2015 Q1 2015 Q2 2015 Q2 - 2015 Q1 2015 Q2 - 2014 Q2 Central 1 Bukomansimbi District 55 37 79 114 44 Central 1 Butambala District 193 101 164 62 -15 Central 1 Gomba District 79 51 86 69 9 Central 1 Kalangala District 103 82 93 13 -10 Central 1 Kalungu District 76 56 133 138 75 Central 1 Lwengo District 70 46 67 46 -4 Central 1 Lyantonde District 404 289 299 3 -26 Central 1 Masaka District 101 59 106 80 5 Central 1 Mpigi District 122 57 90 58 -26 Central 1 Rakai District 179 107 162 51 -9 Central 1 Sembabule District 68 87 67 -23 -1 Central 1 Wakiso District 82 86 56 -35 -32 Central 2 Buikwe District 94 65 92 42 -2 Central 2 Buvuma District 89 83 96 16 8 Central 2 Kayunga District 100 71 96 35 -4 Central 2 Kiboga District 52 43 64 49 23 Central 2 Kyankwanzi District 61 35 87 149 43 Central 2 Luwero District 126 80 86 8 -32 Central 2 Mityana District 126 91 133 46 6 Central 2 Mubende District 99 64 92 44 -7
Central 2 Mukono District 78 67 80 19 3 Central 2 Nakaseke District 116 66 72 9 -38 Central 2 Nakasongola District 211 121 153 26 -27 East Central Bugiri District 117 115 93 -19 -21 East Central Busia District 154 153 142 -7 -8 East central Buyende District 72 63 80 27 11 East Central Iganga District 137 110 121 10 -12 East Central Jinja District 130 120 138 15 6 East Central Kaliro District 105 98 101 3 -4 East Central Kamuli District 170 120 144 20 -15 East Central Luuka District 152 119 98 -18 -36 East Central Mayuge District 114 87 90 3 -21 East Central Namayingo District 162 161 138 -14 -15 East Central Namutumba District 173 153 146 -5 -16 Eastern Amuria District 91 65 112 72 23 Eastern Budaka District 204 136 117 -14 -43 Eastern Bududa District 96 45 83 84 -14 Eastern Bukedea District 80 48 68 42 -15 Eastern Bukwo District 150 88 87 -1 -42 Eastern Bulambuli District 133 104 119 14 -11 Eastern Butaleja District 219 179 168 -6 -23 Eastern Kaberamaido District 146 99 155 57 6 Eastern Kapchorwa District 143 115 104 -10 -27 Eastern Katakwi District 230 162 256 58 11 Eastern Kibuku District 148 89 80 -10 -46 Eastern Kumi District 124 98 152 55 23 Eastern Kween District 136 75 90 20 -34 Eastern Manafwa District 78 45 62 38 -21 Eastern Mbale District 105 51 73 43 -30 Eastern Ngora District 112 77 111 44 -1 Eastern Pallisa District 132 129 96 -26 -27 Eastern Serere District 185 87 137 57 -26 Eastern Sironko District 103 14 104 643 1 Eastern Soroti District 248 59 228 286 -8 Eastern Tororo District 196 66 114 73 -42
9
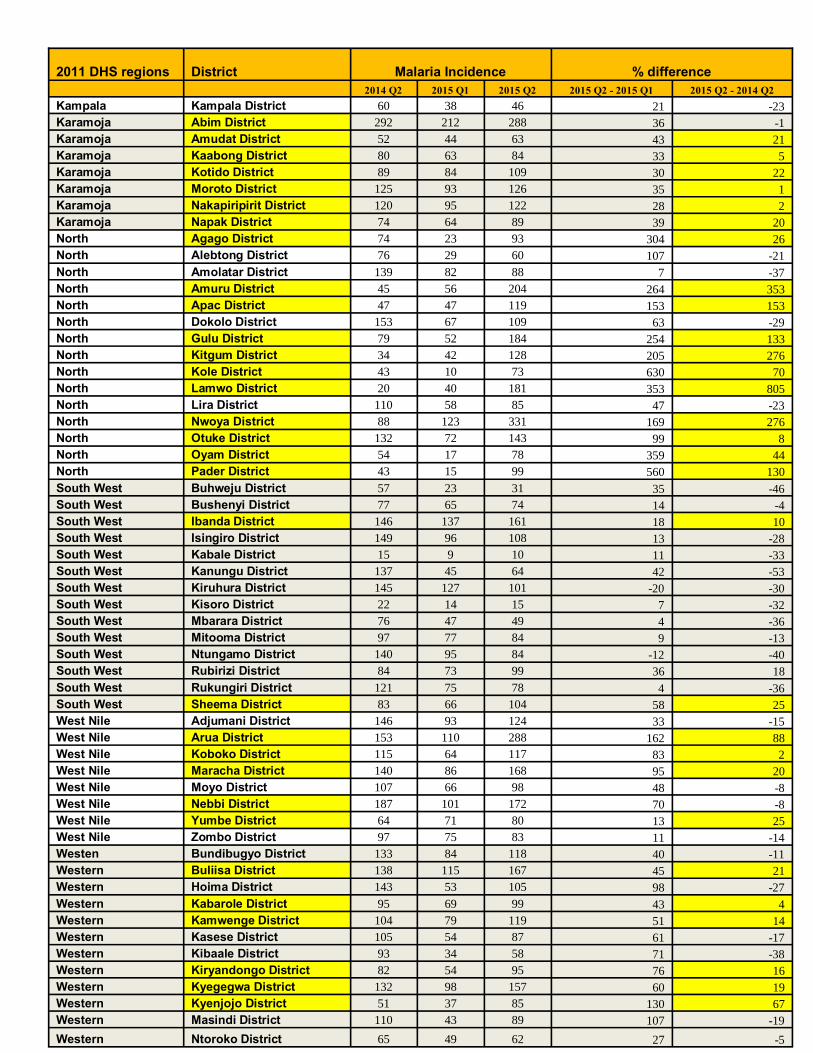
2011 DHS regions District Malaria Incidence % difference 2014 Q2 2015 Q1 2015 Q2 2015 Q2 - 2015 Q1 2015 Q2 - 2014 Q2 Kampala Kampala District 60 38 46 21 -23 Karamoja Abim District 292 212 288 36 -1 Karamoja Amudat District 52 44 63 43 21 Karamoja Kaabong District 80 63 84 33 5 Karamoja Kotido District 89 84 109 30 22 Karamoja Moroto District 125 93 126 35 1 Karamoja Nakapiripirit District 120 95 122 28 2 Karamoja Napak District 74 64 89 39 20 North Agago District 74 23 93 304 26 North Alebtong District 76 29 60 107 -21 North Amolatar District 139 82 88 7 -37 North Amuru District 45 56 204 264 353 North Apac District 47 47 119 153 153 North Dokolo District 153 67 109 63 -29 North Gulu District 79 52 184 254 133 North Kitgum District 34 42 128 205 276 North Kole District 43 10 73 630 70 North Lamwo District 20 40 181 353 805 North Lira District 110 58 85 47 -23 North Nwoya District 88 123 331 169 276 North Otuke District 132 72 143 99 8 North Oyam District 54 17 78 359 44 North Pader District 43 15 99 560 130 South West Buhweju District 57 23 31 35 -46 South West Bushenyi District 77 65 74 14 -4 South West Ibanda District 146 137 161 18 10 South West Isingiro District 149 96 108 13 -28 South West Kabale District 15 9 10 11 -33 South West Kanungu District 137 45 64 42 -53 South West Kiruhura District 145 127 101 -20 -30 South West Kisoro District 22 14 15 7 -32 South West Mbarara District 76 47 49 4 -36 South West Mitooma District 97 77 84 9 -13 South West Ntungamo District 140 95 84 -12 -40 South West Rubirizi District 84 73 99 36 18 South West Rukungiri District 121 75 78 4 -36 South West Sheema District 83 66 104 58 25 West Nile Adjumani District 146 93 124 33 -15 West Nile Arua District 153 110 288 162 88 West Nile Koboko District 115 64 117 83 2 West Nile Maracha District 140 86 168 95 20 West Nile Moyo District 107 66 98 48 -8 West Nile Nebbi District 187 101 172 70 -8 West Nile Yumbe District 64 71 80 13 25 West Nile Zombo District 97 75 83 11 -14 Westen Bundibugyo District 133 84 118 40 -11 Western Buliisa District 138 115 167 45 21 Western Hoima District 143 53 105 98 -27 Western Kabarole District 95 69 99 43 4 Western Kamwenge District 104 79 119 51 14 Western Kasese District 105 54 87 61 -17 Western Kibaale District 93 34 58 71 -38 Western Kiryandongo District 82 54 95 76 16 Western Kyegegwa District 132 98 157 60 19 Western Kyenjojo District 51 37 85 130 67 Western Masindi District 110 43 89 107 -19 Western Ntoroko District 65 49 62 27 -5
10
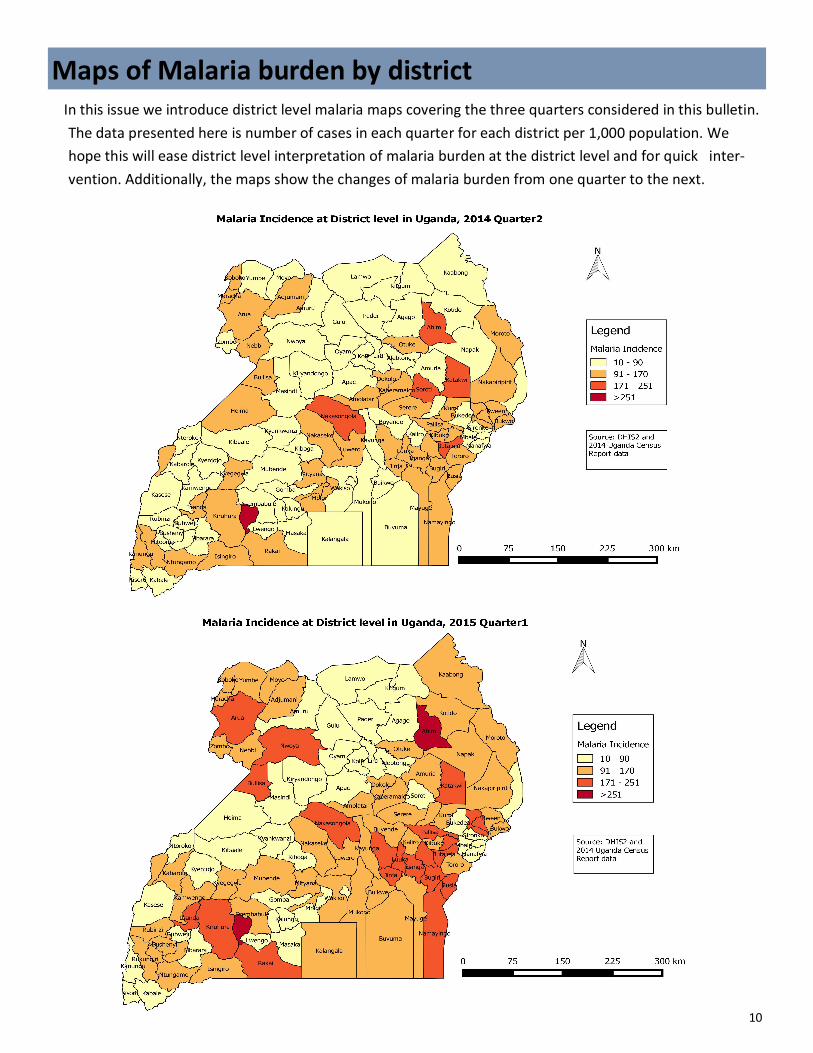
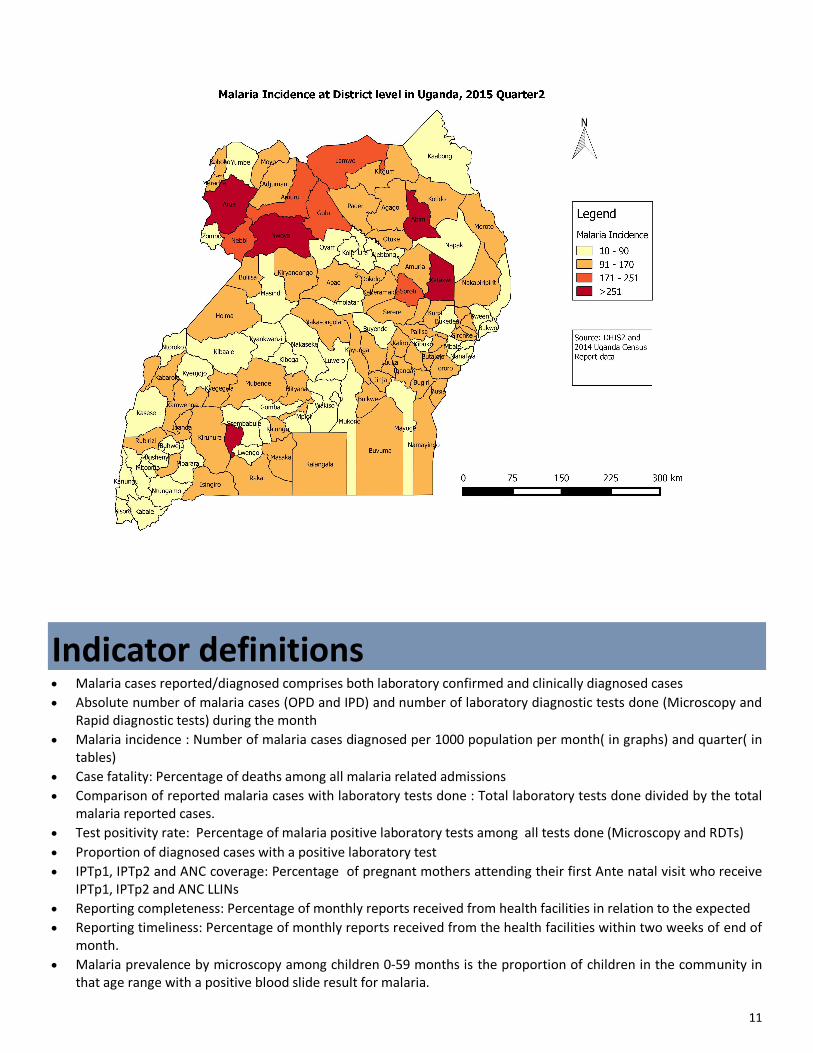
Maps of Malaria burden by district In this issue we introduce district level malaria maps covering the three quarters considered in this bulletin. The data presented here is number of cases in each quarter for each district per 1,000 population. We hope this will ease district level interpretation of malaria burden at the district level and for quick inter-vention. Additionally, the maps show the changes of malaria burden from one quarter to the next.
11
Indicator definitions • Malaria cases reported/diagnosed comprises both laboratory confirmed and clinically diagnosed cases • Absolute number of malaria cases (OPD and IPD) and number of laboratory diagnostic tests done (Microscopy and
Rapid diagnostic tests) during the month • Malaria incidence : Number of malaria cases diagnosed per 1000 population per month( in graphs) and quarter( in
tables) • Case fatality: Percentage of deaths among all malaria related admissions • Comparison of reported malaria cases with laboratory tests done : Total laboratory tests done divided by the total
malaria reported cases. • Test positivity rate: Percentage of malaria positive laboratory tests among all tests done (Microscopy and RDTs) • Proportion of diagnosed cases with a positive laboratory test • IPTp1, IPTp2 and ANC coverage: Percentage of pregnant mothers attending their first Ante natal visit who receive
IPTp1, IPTp2 and ANC LLINs • Reporting completeness: Percentage of monthly reports received from health facilities in relation to the expected • Reporting timeliness: Percentage of monthly reports received from the health facilities within two weeks of end of
month. • Malaria prevalence by microscopy among children 0-59 months is the proportion of children in the community in
that age range with a positive blood slide result for malaria.