Catalogue of the International exhibition of modern art / Association ...
Upload
truonglienCategory
view
231download
0
Barometer Report based on the results of a survey concluded in July 2018
UFI Global Exhibition
Southern Africa
Global
United Kingdom
Central & South America
Mexico
US
Thailand
Brazil
India
Australia
Indonesia
Macau
21st Edition
221st UFI Global Exhibition Barometer / July 2018 ©
Contents
Introduction 03
Results by region 1. Gross Turnover Development 04 2. DevelopmentofOperatingProfits 063. Most Important Business Issues 08 4. Actions Towards Digitisation 11
Detailed results for selected countries or zones
North America: Mexico, US 22 CentralandSouthAmerica:Brazil,othercountriesinCentral&SouthAmerica 26Europe: Germany, Russia, UK, other countries in Europe 30 Africa: South Africa 40 Middle East 42 Asia-Pacific:China,India,Thailand,othercountriesinAsia-Pacific 44
Conclusion 58
Appendix Answers per country/region 59
321st UFI Global Exhibition Barometer / July 2018 © 321st UFI Global Exhibition Barometer / July 2018 ©
Introduction
Important remarks
It should be noted that the number of replies to the current survey (312 from 55 countries - see full list at the end of the document) provides representative results. However, the consolidated regional resultsmaynotreflectthesituationofspecificcountriesinthatregion. This is why the report also includes a set of detailed results forthe18countriesorzoneswhereasignificantnumberofanswerswere obtained.
Questions related to this survey can be addressed to Christian Druart, UFI Research Manager, at [email protected].
This research is available online at www.ufi.org/research.
Welcome to the 21st edition of the “UFI Global Exhibition Barometer“ survey. This study is based on a global survey, concluded in July 2018. It represents up to date information on the development and theoutlookoftheglobalexhibitionindustryaswellason18specificcountries and zones.
UFI began assessing impact of the global economic conditions on the exhibition industry twice a year in 2009. Since then, it has regularly grown in size and scope, as numerous industry associations around the world have joined the project. These are: AAXO (The Association of African Exhibition Organizers) and EXSA (Exhibition and Events Association of Southern Africa) in South Africa, AEO (Association of Event Organisers) in the UK, AFIDA (Asociación Internacional de Ferias de América) in Central and South America, AMPROFEC (Asociación Mexicana de Profesionales de Ferias y Exposiciones y Convenciones) in Mexico,, EEAA (The Exhibition and Event Association of Australasia) in Australasia, IECA (Indonesia Exhibition Companies Association) in Indonesia, IEIA (Indian Exhibition Industry Association), in India, MFTA (Macau Fair Trade Association) in Macau, SISO (Society of Independent Show Organizers) for the UK, TEA (Thai Exhibition Association) in Thailand and UBRAFE (União Brasileira dos Promotores Feiras) in Brazil.

421st UFI Global Exhibition Barometer / July 2018 ©
Gross Turnover Development
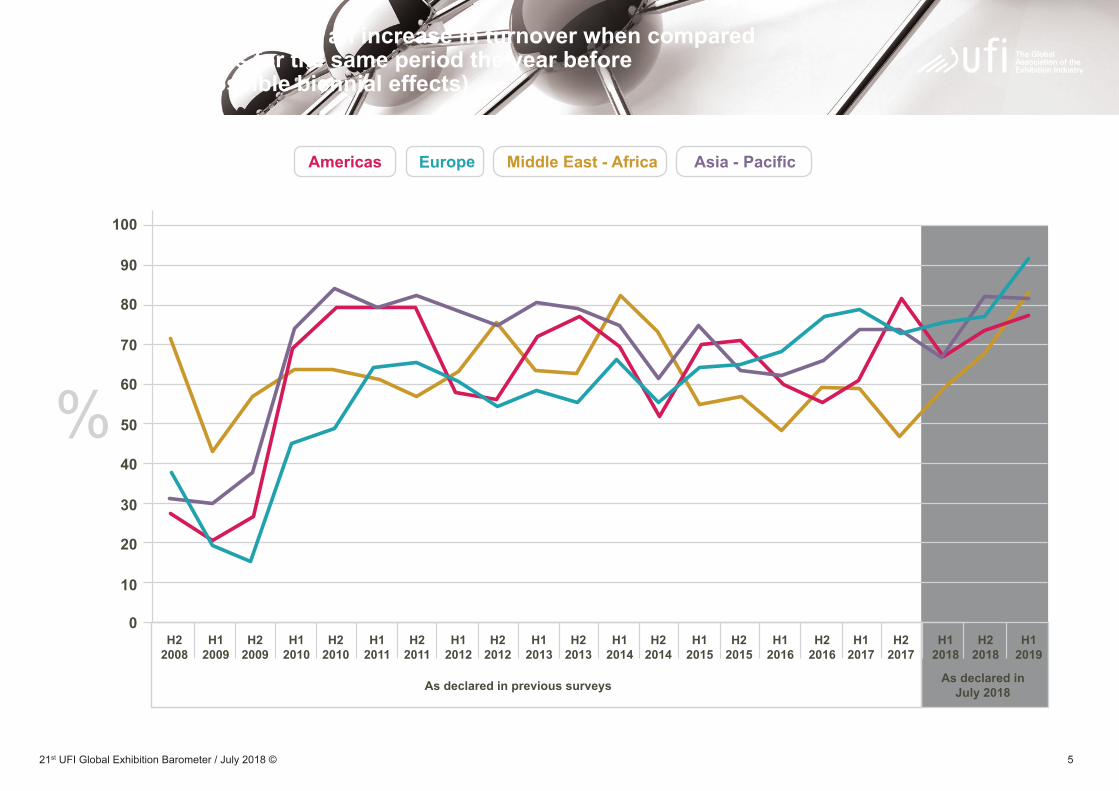
for selected countries or zones”) detail these regional results, adding the percentage of companies declaring decreases in their turnover and the percentage of “unknown” answers.
The 21st Barometer surveyed the evolution of participants’ gross turnoverexpectationsforthetwohalvesof2018andthefirsthalfof 2019 compared to their turnover during the same period in the previous year (regardless of possible biennial effects).
The following chart presents, at regional level, the percentage of companies declaring an increase in their turnover. It combines these results with those of previous surveys since 2008 and it does not take into account the “unknown” or “not applicable” answers.
For the first time in ten years, all four global regions report a positive development simultaneously: Everywhere, the share of companies declaring an increase in turnover is rising, regarding the second half of 2018.
For the first half of 2019, the barometer reports the highest ever share of positive expectations for Europe.
The charts included in the second part of this report (“Detailed results
521st UFI Global Exhibition Barometer / July 2018 ©
% of companies declaring an increase in turnover when compared to their projections for the same period the year before (regardless of possible biennial effects)
100
90
80
70
60
50
40
30
20
10
0H2
2008H1
2009H2
2009H1
2010H2
2010H1
2011H2
2011H1
2012H2
2012H1
2013H2
2013H1
2014H2
2014H1
2015H2
2015H1
2016H2
2016H1
2017H2
2017H1
2018H2
2018
%
As declared in previous surveys As declared inJuly 2018
H12019
Americas Europe Asia - PacificMiddle East - Africa

621st UFI Global Exhibition Barometer / July 2018 ©
Development of Operating Profits
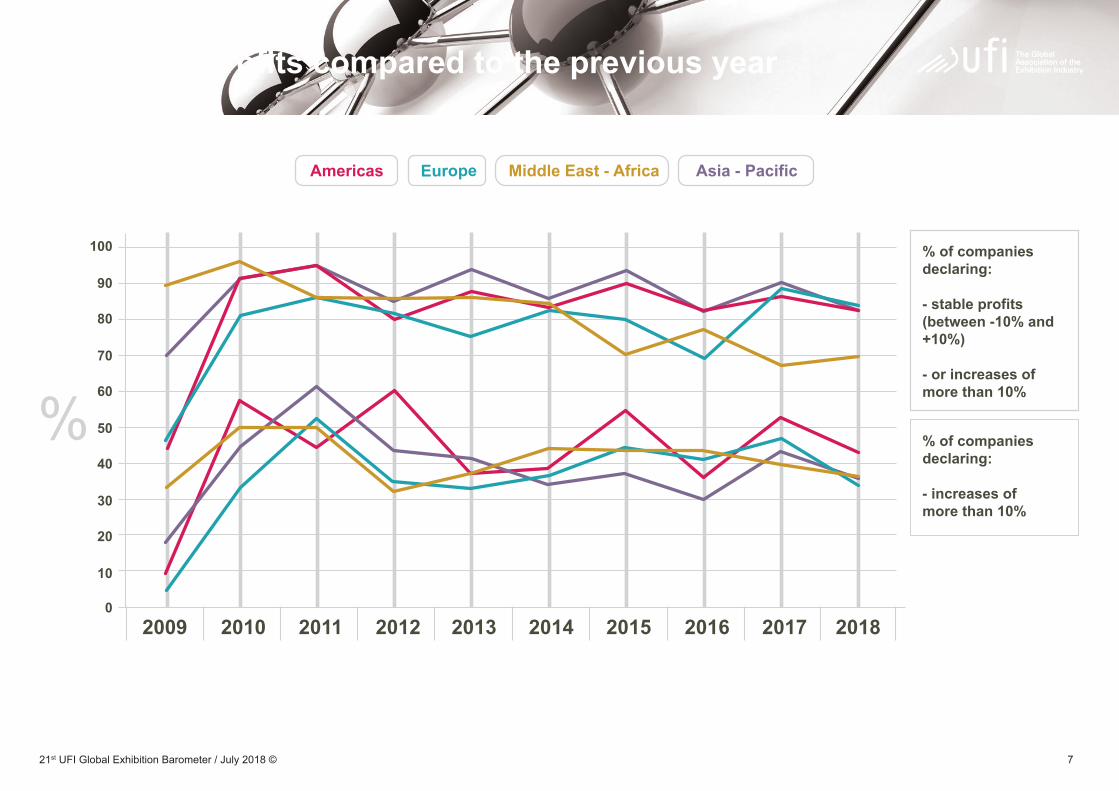
The detailed results show that most companies maintained a good level of performance in 2017 and more than 40% of companies from all regions declared an increase of more than 10% compared to 2016.
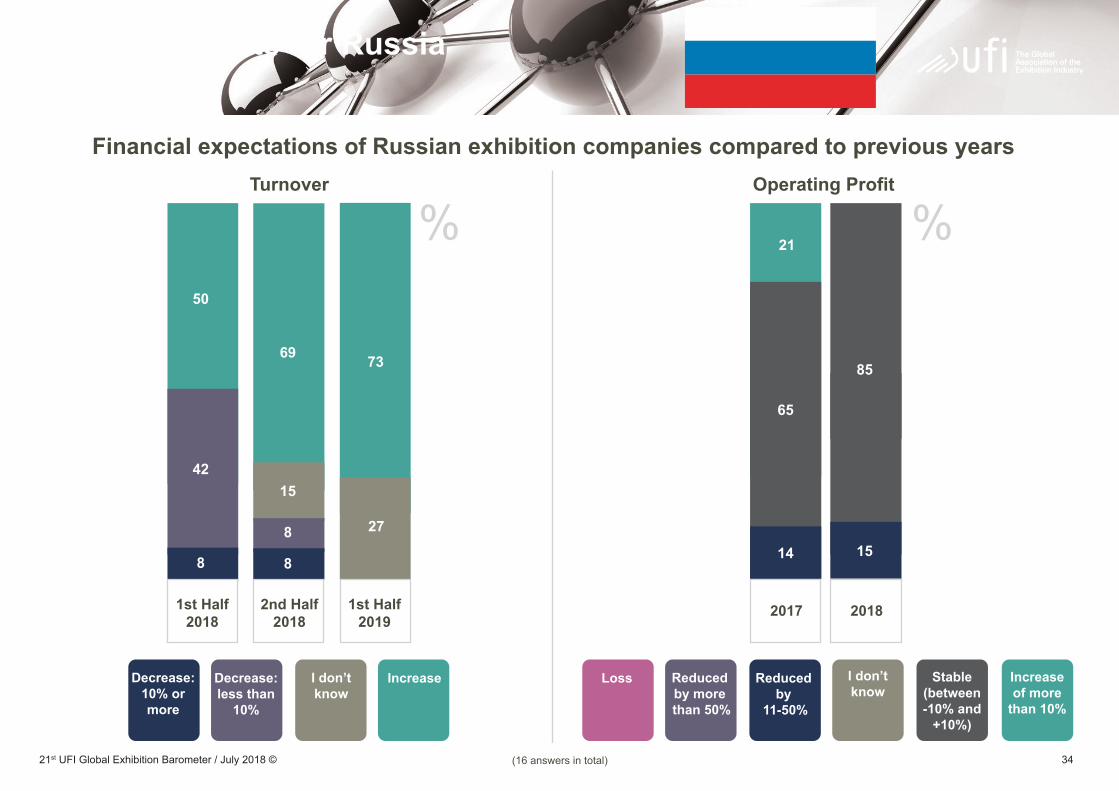
The highest proportions of companies declaring such an increase are observed in India (72%), Germany and the U.S. (both 70%); on the opposite side, the lowest proportions are in Russia (21%), South AfricaandmanycountriesinAsia/Pacific(40%orbelow,butnotinIndia, China and Indonesia).
However, the perspectives for 2018 are currently lower globally, with a smaller share of companies expecting a profit increase.
Significantlevelsofcompaniesanticipatereductionoftheirprofitorlossinseveralsubmarkets:MiddleEast(36%),Indonesia(33%),South Africa (28%), Australia (24%), India (21%) and the U.S. (17%).
Footnote: The charts included in the second part of this report (“Detailed results for selected countries or zones”)detailtheseresults,addingthepercentageofcompanieswithreductionsinprofitsorlosses.
The 21st Global Barometer survey questioned the evolution of operatingprofitsfor2017and2018comparedtothepreviousyear.
The following chart combines these results with those of previous surveys,whichtrackthedevelopmentofoperatingprofitssince2009.It highlights the results of companies declaring an increase of more than 10% and those declaring a stable result (between -10% and +10%) – see footnote.
721st UFI Global Exhibition Barometer / July 2018 ©
Operating Profits compared to the previous year
100
90
80
70
60
50
40
30
20
10
02009 2010 2011 2012 2013 2014 2015 2016 2017 2018
%
% of companies declaring:
- stable profits (between -10% and +10%)
- or increases of more than 10%
% of companies declaring:
- increases of more than 10%
Americas Europe Asia - PacificMiddle East - Africa
821st UFI Global Exhibition Barometer / July 2018 ©
Most Important Business Issues
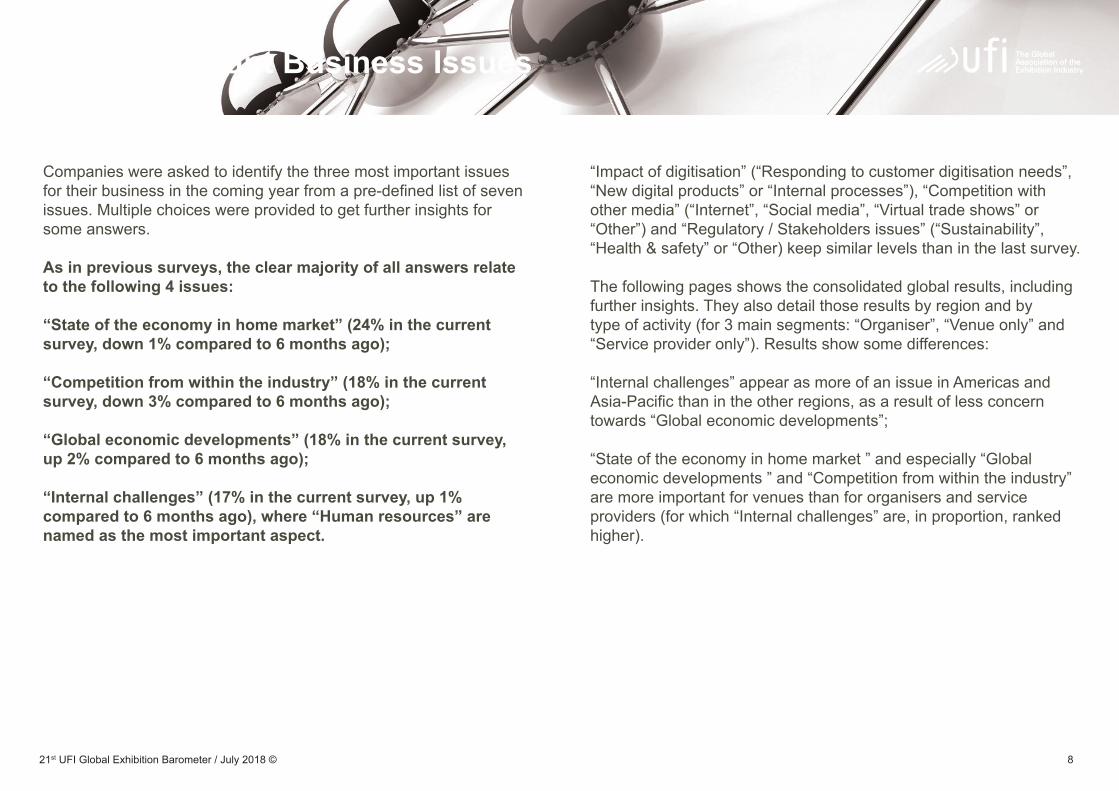
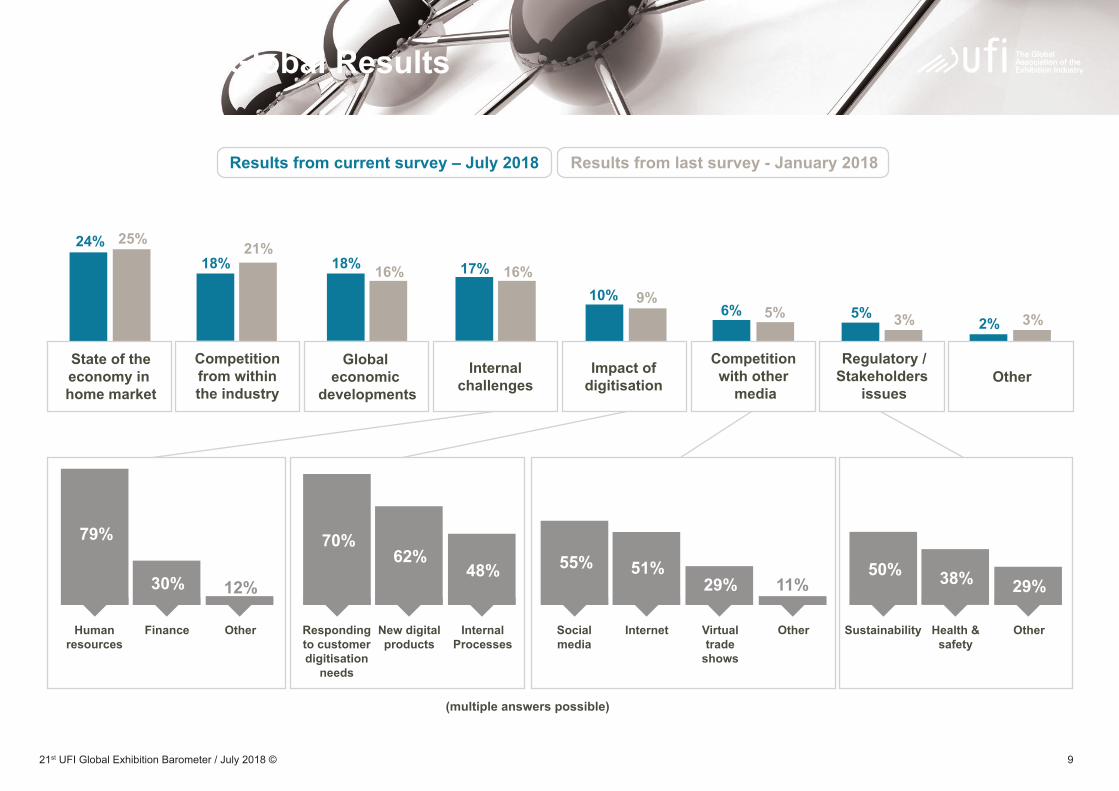
“Impact of digitisation” (“Responding to customer digitisation needs”, “New digital products” or “Internal processes”), “Competition with other media” (“Internet”, “Social media”, “Virtual trade shows” or “Other”) and “Regulatory / Stakeholders issues” (“Sustainability”, “Health & safety” or “Other) keep similar levels than in the last survey.
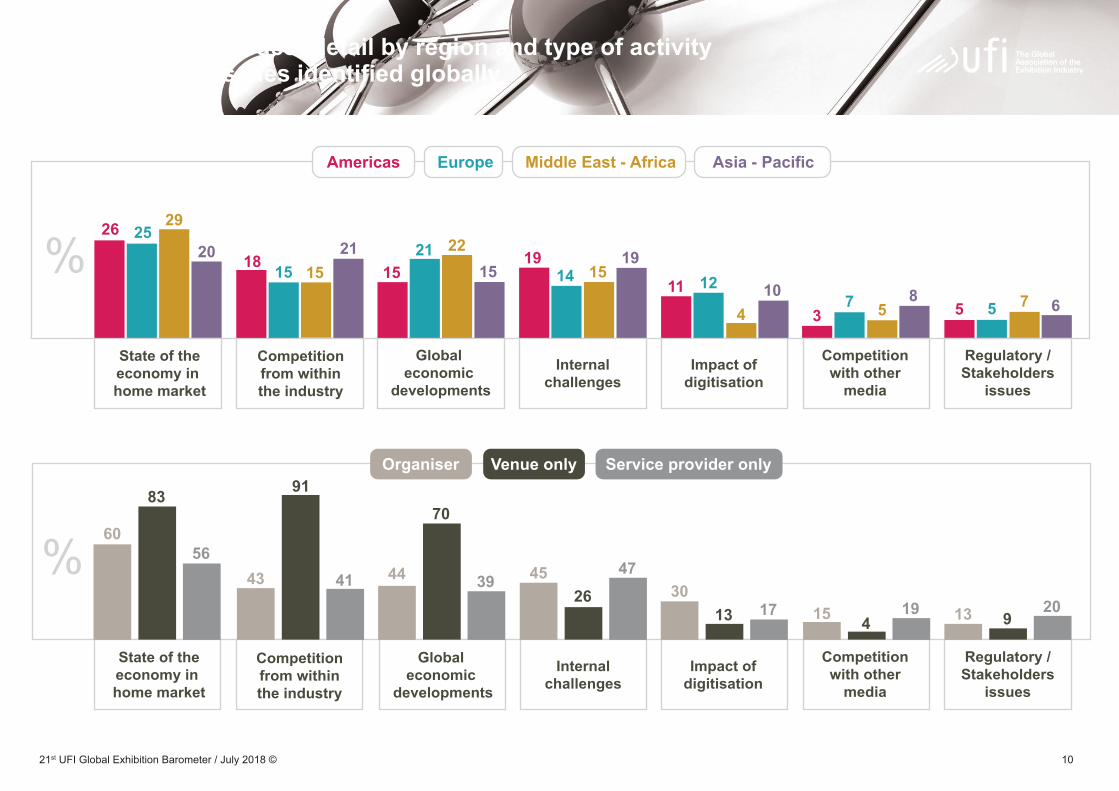
The following pages shows the consolidated global results, including further insights. They also detail those results by region and by type of activity (for 3 main segments: “Organiser”, “Venue only” and “Service provider only”). Results show some differences:
“Internal challenges” appear as more of an issue in Americas and Asia-Pacificthanintheotherregions,asaresultoflessconcerntowards “Global economic developments”;
“State of the economy in home market ” and especially “Global economic developments ” and “Competition from within the industry” are more important for venues than for organisers and service providers (for which “Internal challenges” are, in proportion, ranked higher).
Companies were asked to identify the three most important issues fortheirbusinessinthecomingyearfromapre-definedlistofsevenissues. Multiple choices were provided to get further insights for some answers.
As in previous surveys, the clear majority of all answers relate to the following 4 issues:
“State of the economy in home market” (24% in the current survey, down 1% compared to 6 months ago);
“Competition from within the industry” (18% in the current survey, down 3% compared to 6 months ago);
“Global economic developments” (18% in the current survey, up 2% compared to 6 months ago);
“Internal challenges” (17% in the current survey, up 1% compared to 6 months ago), where “Human resources” are named as the most important aspect.
921st UFI Global Exhibition Barometer / July 2018 ©
Top Issues: Global Results
17% 16%18%
Humanresources
Finance Other
79%
30% 12%
Respondingto customerdigitisation
needs
New digitalproducts
InternalProcesses
70%62%
48%
Socialmedia
Internet Virtualtrade
shows
55% 51%29% 11%
Other Sustainability Health &safety
Other
50% 38% 29%
(multiple answers possible)
Results from last survey - January 2018Results from current survey – July 2018
25%
9%5% 3%3%
24%
10%6% 5%
2%
State of theeconomy in home market
16%
Global economic
developments
21%18%
Competitionfrom withinthe industry
Internalchallenges
Impact ofdigitisation
Competitionwith other
media
Regulatory /Stakeholders
issuesOther
1021st UFI Global Exhibition Barometer / July 2018 ©
Most important issues: detail by region and type of activity for the five top issues identified globally
37 5
85 5 7 6
Regulatory /Stakeholders
issues
Competitionwith other
media
%26 25
29
20 18 15 1521 19
14 1519
1521 22
1511 12
410
State of theeconomy in home market
Competitionfrom withinthe industry
Global economic
developments
Internalchallenges
Impact ofdigitisation
%
State of theeconomy in home market
Impact ofdigitisation
Regulatory /Stakeholders
issues
Competitionwith other
media
60
Organiser Venue only Service provider only
83
56
Global economic
developments
44
70
39
Internalchallenges
4526
4730
13 17 15 419 13 9
20
Americas Europe Asia - PacificMiddle East - Africa
Competitionfrom withinthe industry
43
4
41
91
1121st UFI Global Exhibition Barometer / July 2018 ©
Actions Towards Digitisation
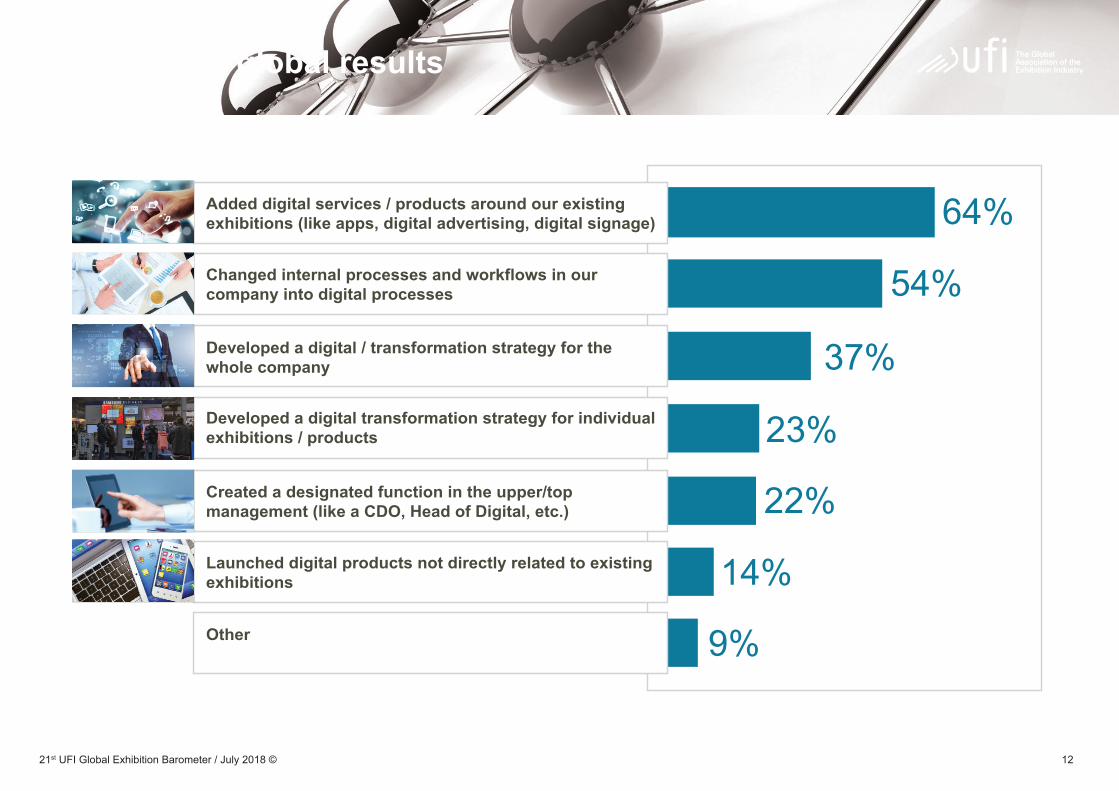
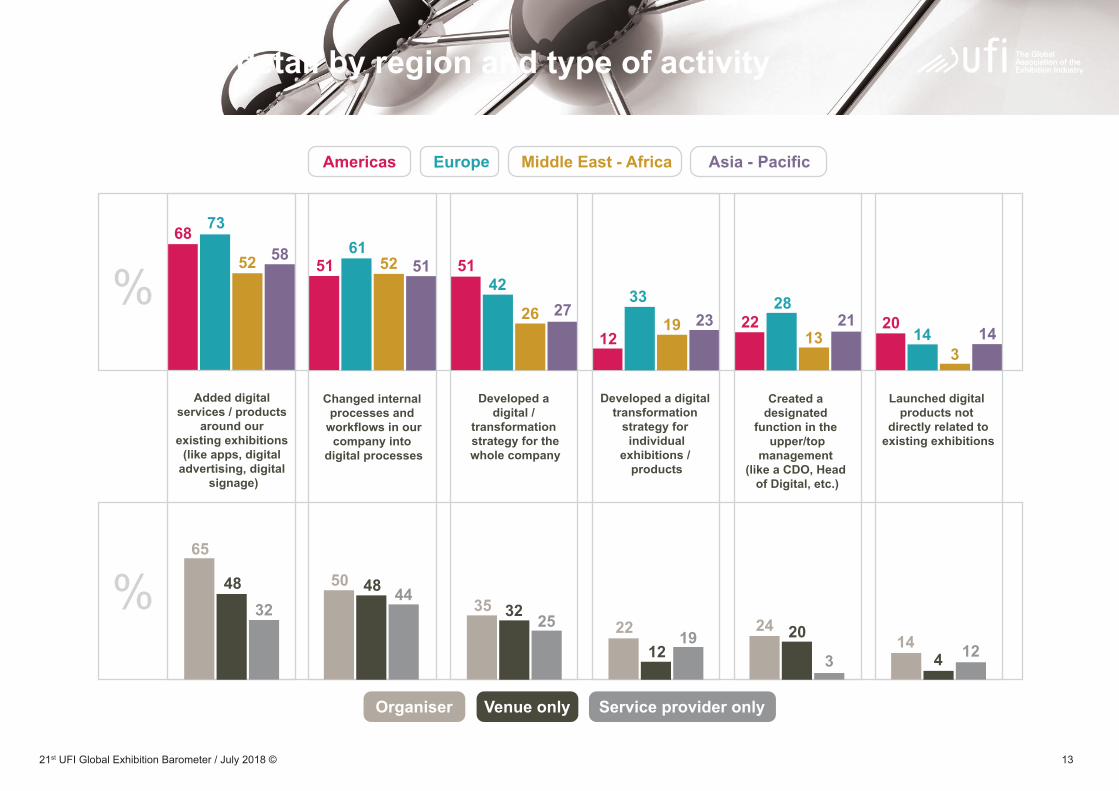
• 37% of companies participating in the survey reported that they have developed a digital transformation strategy for the whole company, with Mexico (71%), Germany (67%) and Brazil (57%) leading;
• 22% have created a designated function (like a Chief Digital Officer) in the upper/top management – led here by the U.K. (40%), Germany and the U.S. (both 33%);
• Finally, 14% of survey participants stated that they have launched digital products not directly related to existing exhibitions – a development especially visible in the U.S. (42%) and the U.K. (30%).
The following pages show the global results, followed by detailed results.
With digitisation accelerating in businesses around the world, the Global Barometer started a year ago to also focus on the state of digital activity in the exhibition industry. The results show that the majority of companies have responded to the accelerating process of digitisation in the exhibition industry. However progress is limited.
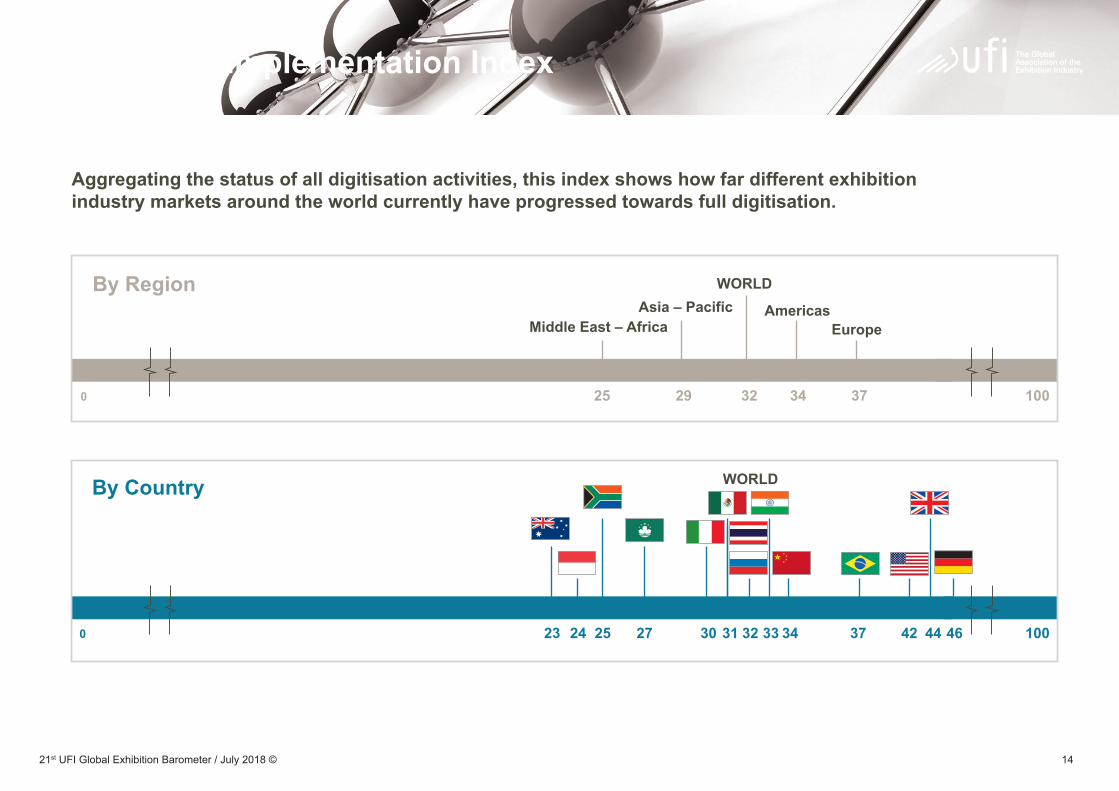
The “digitisation Implementation Index” towards a “full digitisation” is 32 globally (+1 compared to a year ago). Compared to last year’s initial survey, the most striking development is the fact that, by now, 37% of the participating companies state that they have developed a digital transformation strategy on a company level.
Germany,theU.K.andtheU.S.areidentifiedastheexhibitionmarkets who are currently most advanced in the digital transformation process.
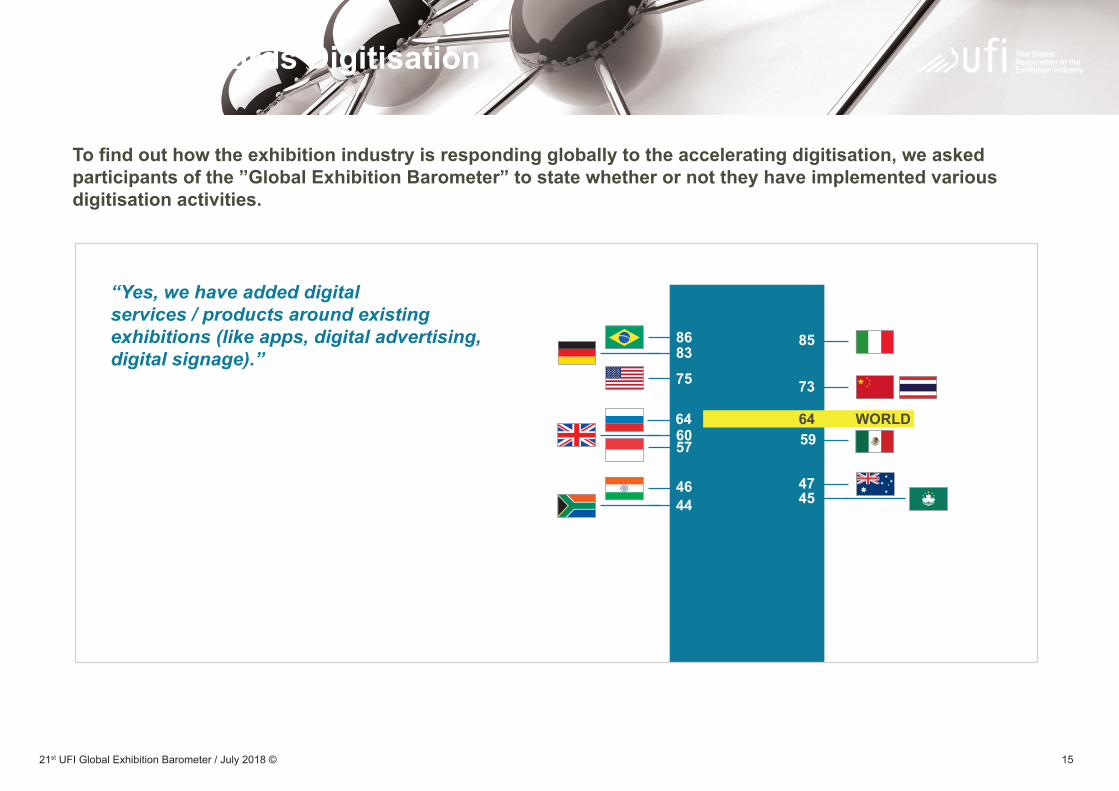
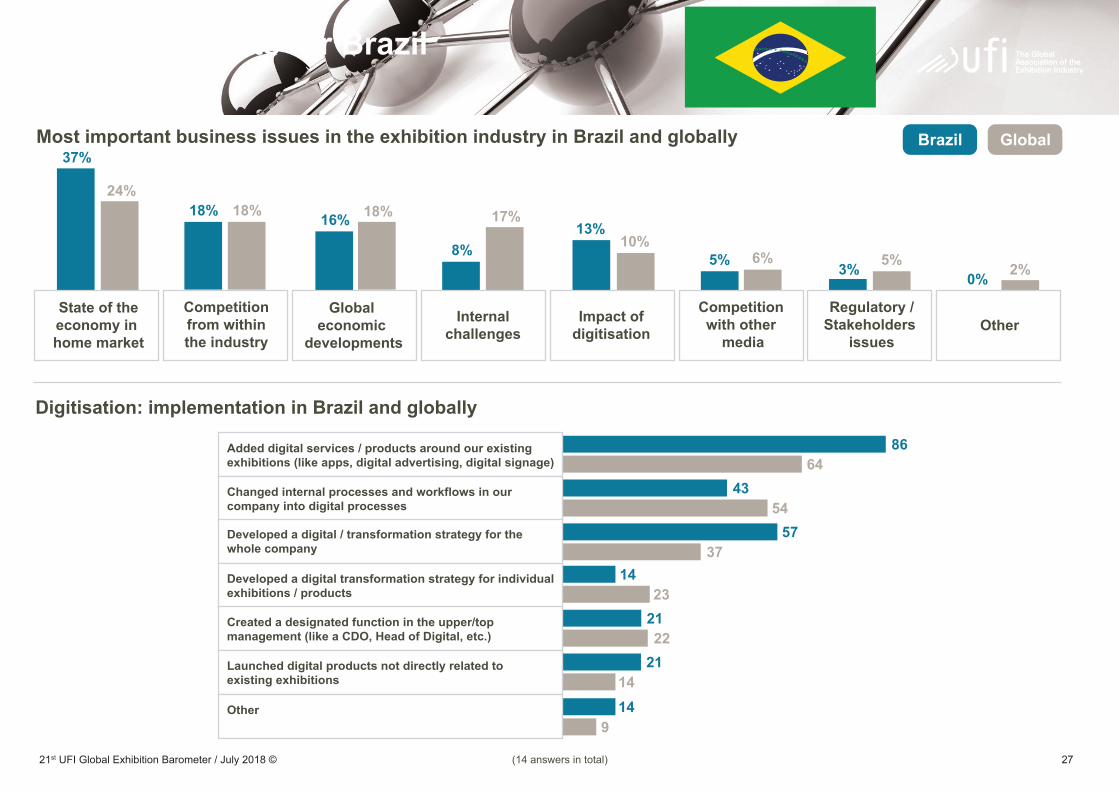
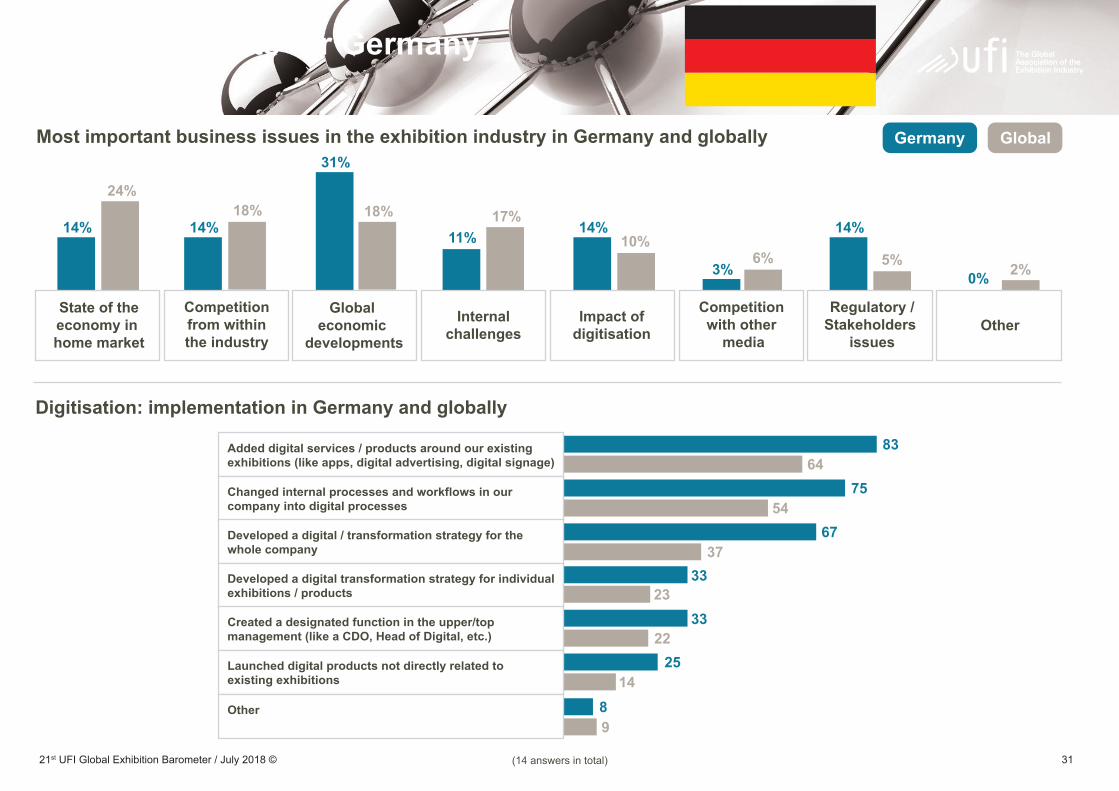
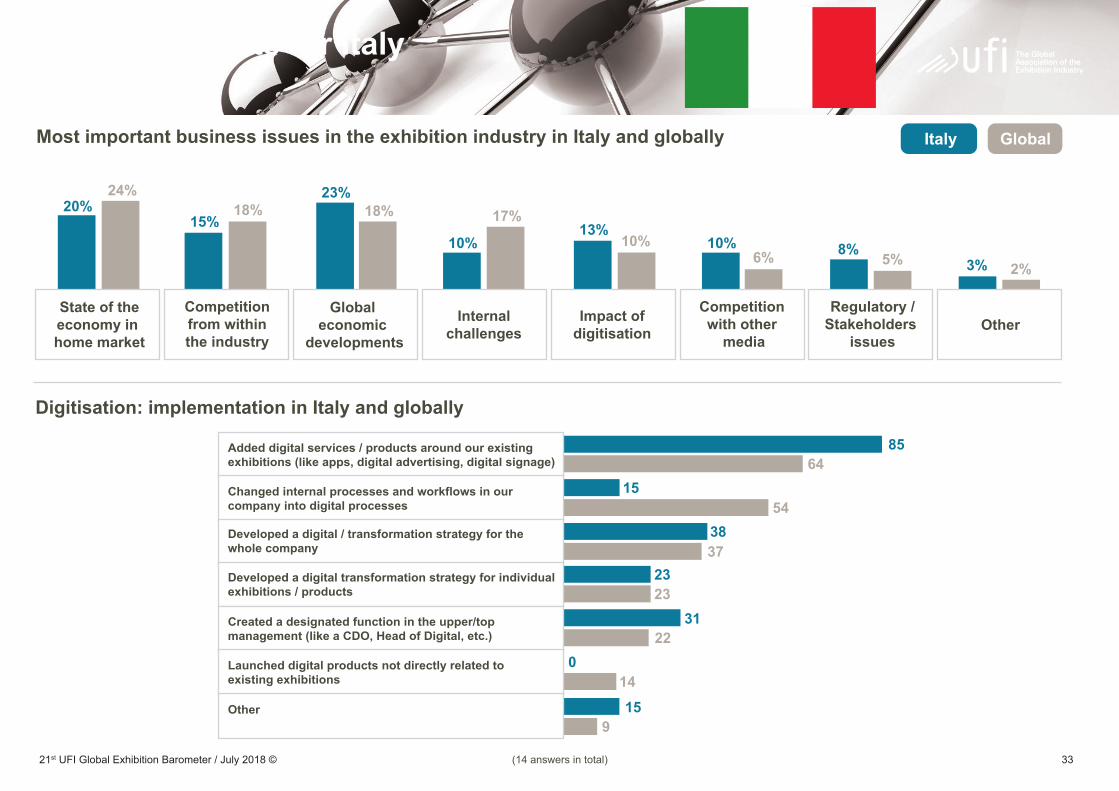
• 64% of survey participants reported that they have added digital services/products (like apps, digital advertising, digital signage) around existing exhibitions. This is already widely established in Brazil (86%), Italy (85%) and Germany (83%);
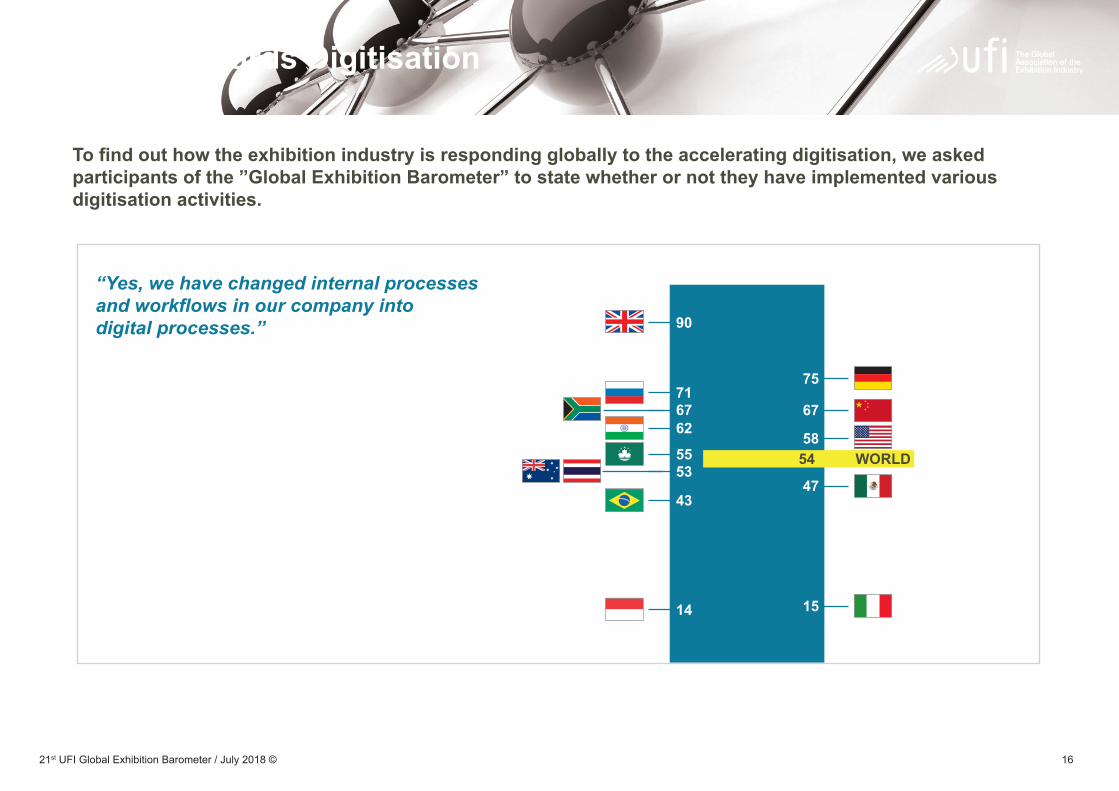
• The companies in the exhibition industry are digitising themselves as well: globally, 54% stated that they have changed internal processes and workflows to be more digital. The most advanced exhibition markets here are the U.K. (90%), Germany (75%) and Russia (71%);
1221st UFI Global Exhibition Barometer / July 2018 ©
64%
54%
Added digital services / products around our existingexhibitions (like apps, digital advertising, digital signage)
Changed internal processes and workflows in ourcompany into digital processes
Developed a digital / transformation strategy for thewhole company
Created a designated function in the upper/topmanagement (like a CDO, Head of Digital, etc.)
Launched digital products not directly related to existingexhibitions
Other
37%
23%
22%
14%
9%
Developed a digital transformation strategy for individualexhibitions / products
Digitisation: global results
1321st UFI Global Exhibition Barometer / July 2018 ©
Digitisation: detail by region and type of activity
%68 73
52 5851
6152 51 51
42
26 27
12
33
19 23 2228
1321 20
143
14
Added digital services / products
around our existing exhibitions
(like apps, digital advertising, digital
signage)
Changed internal processes and
workflows in ourcompany into
digital processes
Developed a digital transformation
strategy for individual
exhibitions / products
Developed a digital /
transformation strategy for thewhole company
Created a designated
function in the upper/top
management (like a CDO, Head
of Digital, etc.)
Launched digital products not
directly related toexisting exhibitions
Americas Europe Asia - PacificMiddle East - Africa
%65
4832
50 48 44 35 32 25 2212
19 144 12
24 20
3
Organiser Venue only Service provider only
1421st UFI Global Exhibition Barometer / July 2018 ©
Digitisation Implementation Index
By Region
By Country
25 37 10032 340
1000 2723 24 25 30 31 32 33 34 37 42 44 46
Middle East – Africa
WORLD
AmericasEurope
WORLD
Aggregating the status of all digitisation activities, this index shows how far different exhibition industry markets around the world currently have progressed towards full digitisation.
29
Asia – Pacific
1521st UFI Global Exhibition Barometer / July 2018 ©
Actions Towards Digitisation
8683
6064
75 73
85
57 59
4644
4745
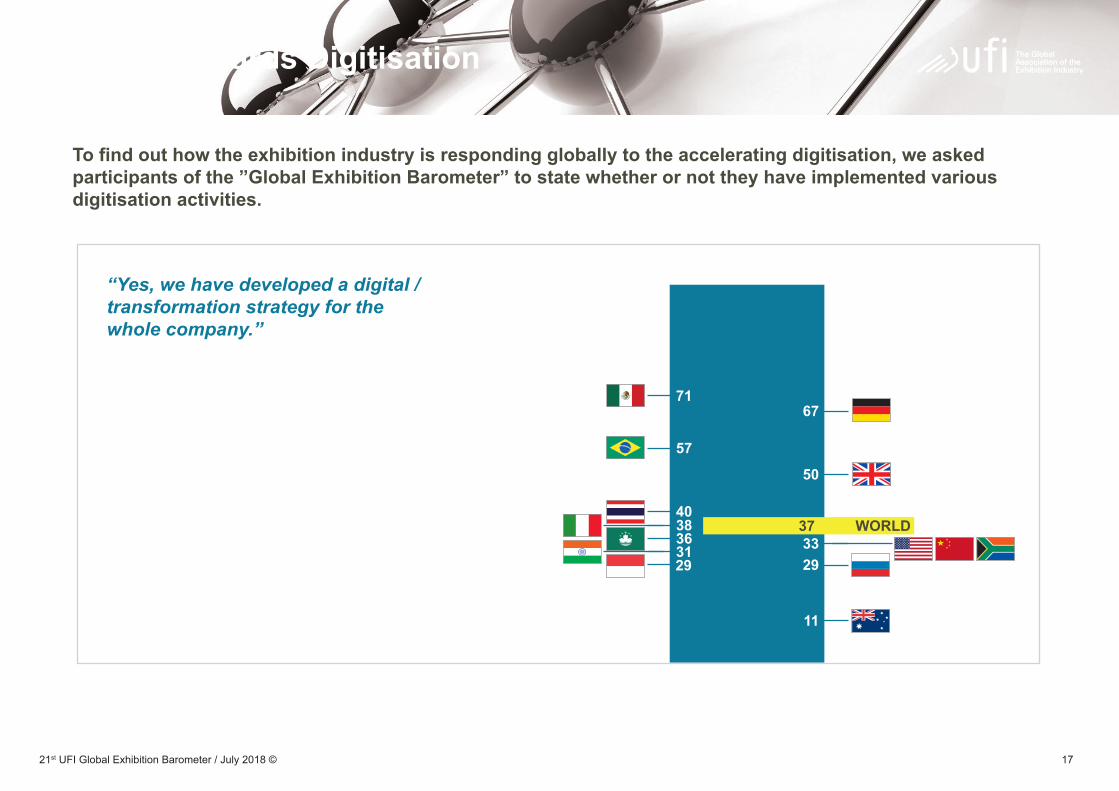
To find out how the exhibition industry is responding globally to the accelerating digitisation, we asked participants of the ”Global Exhibition Barometer” to state whether or not they have implemented various digitisation activities.
“Yes, we have added digitalservices / products around existingexhibitions (like apps, digital advertising, digital signage).”
WORLD64
1621st UFI Global Exhibition Barometer / July 2018 ©
Actions Towards Digitisation
90
71
62
55
43
14
53
67
75
67
58
47
15
To find out how the exhibition industry is responding globally to the accelerating digitisation, we asked participants of the ”Global Exhibition Barometer” to state whether or not they have implemented various digitisation activities.
WORLD54
“Yes, we have changed internal processes and workflows in our company intodigital processes.”
1721st UFI Global Exhibition Barometer / July 2018 ©
Actions Towards Digitisation
71
57
40
3638
31
67
50
3329
11
To find out how the exhibition industry is responding globally to the accelerating digitisation, we asked participants of the ”Global Exhibition Barometer” to state whether or not they have implemented various digitisation activities.
WORLD37
29
“Yes, we have developed a digital /transformation strategy for thewhole company.”

1821st UFI Global Exhibition Barometer / July 2018 ©
Actions Towards Digitisation
4338
25
18
36
27
23
14
6
40
33
7
16
To find out how the exhibition industry is responding globally to the accelerating digitisation, we asked participants of the ”Global Exhibition Barometer” to state whether or not they have implemented various digitisation activities.
WORLD23
“Yes, we have developed a digital /transformation strategy for individualexhibitions / products.”
1921st UFI Global Exhibition Barometer / July 2018 ©
Actions Towards Digitisation
33
20
714
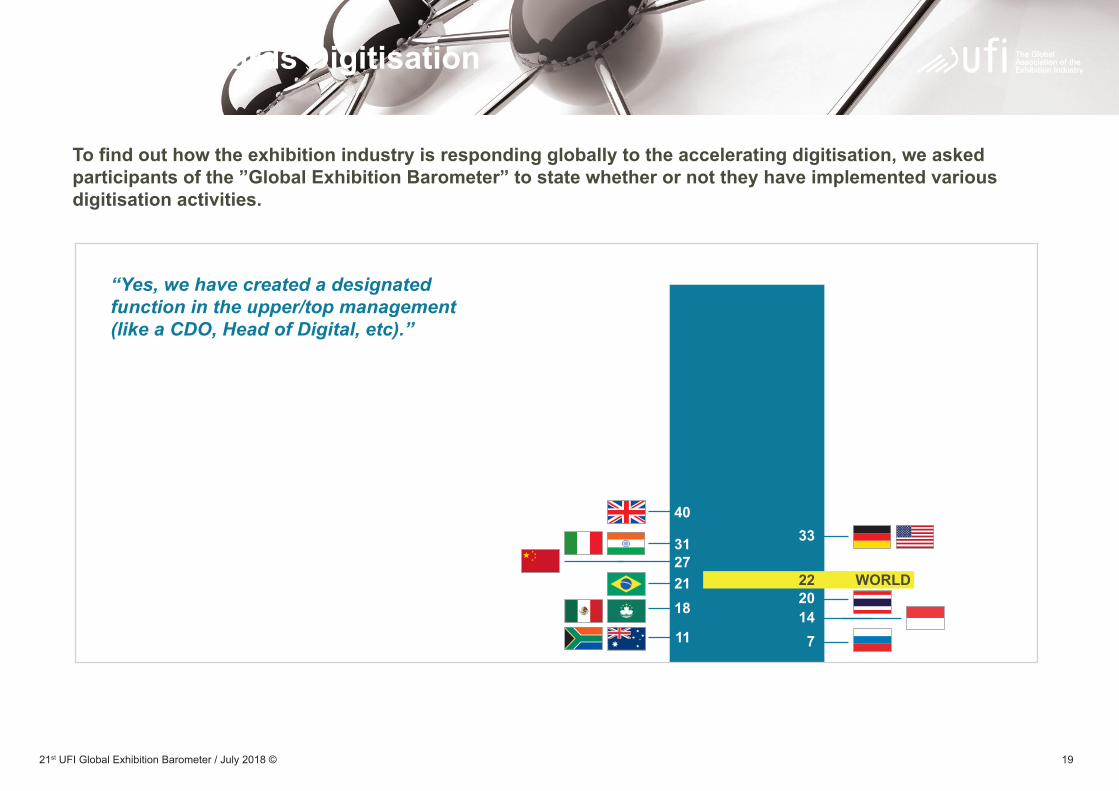
To find out how the exhibition industry is responding globally to the accelerating digitisation, we asked participants of the ”Global Exhibition Barometer” to state whether or not they have implemented various digitisation activities.
“Yes, we have created a designated function in the upper/top management (like a CDO, Head of Digital, etc).”
40
2118
11
3127
WORLD22

2021st UFI Global Exhibition Barometer / July 2018 ©
Actions Towards Digitisation
30
7
1825
To find out how the exhibition industry is responding globally to the accelerating digitisation, we asked participants of the ”Global Exhibition Barometer” to state whether or not they have implemented various digitisation activities.
42
27
15
6
21
WORLD14
“Yes, we have launched digitalproducts not directly related toexisting exhibitions.”
2121st UFI Global Exhibition Barometer / July 2018 ©
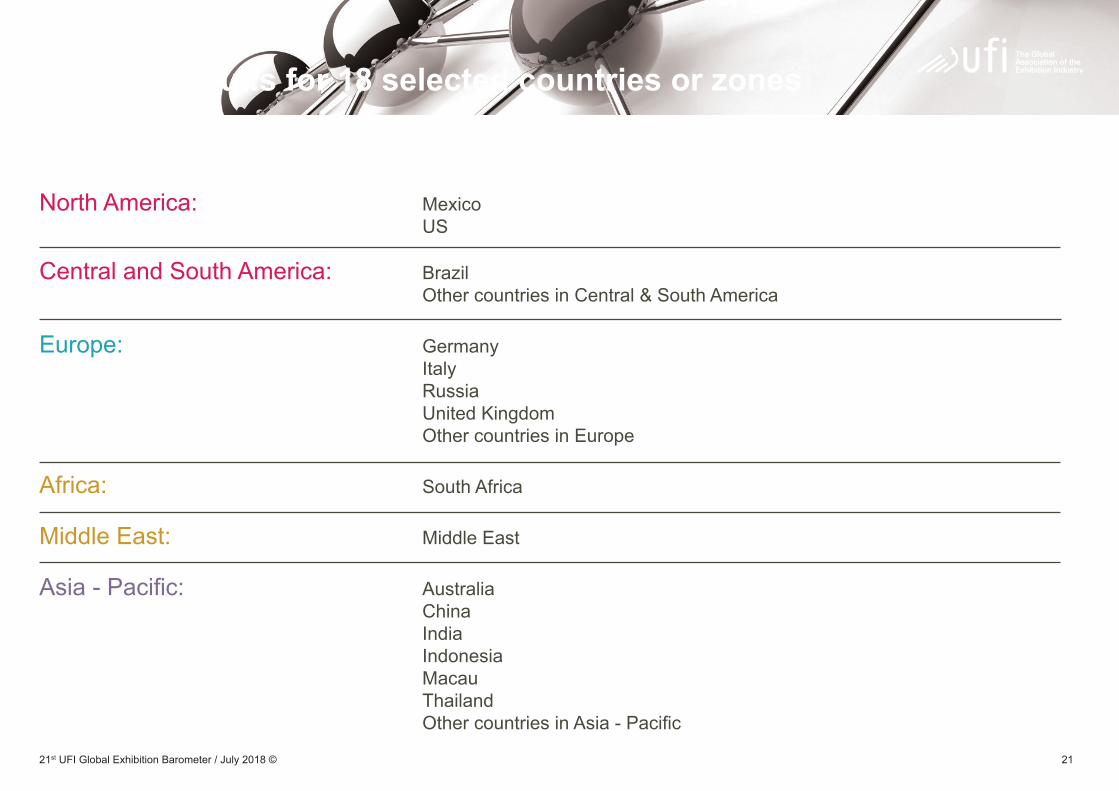
Part 2: Detailed results for 18 selected countries or zones
North America: Mexico US
Central and South America: Brazil Other countries in Central & South America
Europe: Germany Italy Russia United Kingdom Other countries in Europe Africa: South Africa
Middle East: Middle East
Asia-Pacific: Australia China India Indonesia Macau Thailand OthercountriesinAsia-Pacific
2221st UFI Global Exhibition Barometer / July 2018 ©
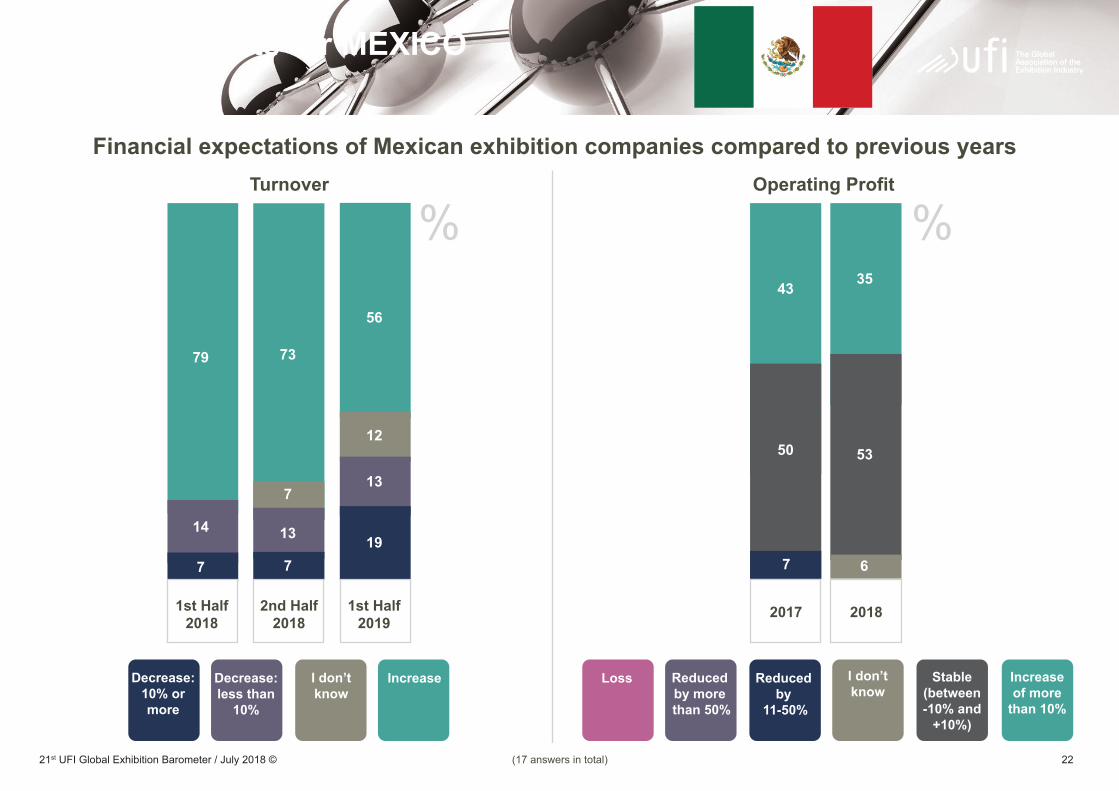
Detailed results for MEXICO
7
14
79
Turnover Operating Profit
7
7
13
73
19
13
12
56
%%43
7
50
35
53
6
Financial expectations of Mexican exhibition companies compared to previous years
Increaseof more
than 10%
Stable(between-10% and
+10%)
I don’tknow
Reduced by
11-50%
Reduced by more than 50%
LossIncreaseDecrease:less than
10%
I don’tknow
Decrease:10% ormore
1st Half2018
2nd Half2018
1st Half2019
2017 2018
(17 answers in total)
2321st UFI Global Exhibition Barometer / July 2018 ©
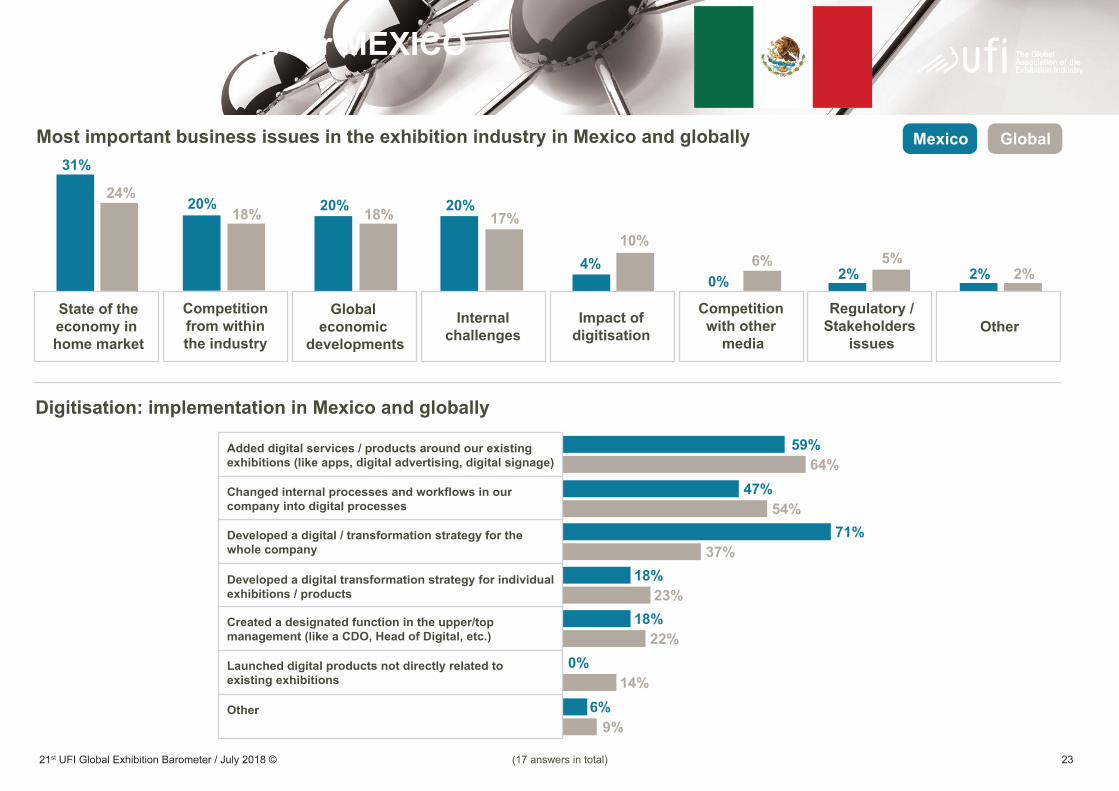
Detailed results for MEXICO
31%
24%20%
18% 20% 18% 20%17%
4%10%
0%6%
2% 2% 2%5%
State of theeconomy in home market
Global economic
developments
Competitionfrom withinthe industry
Internalchallenges
Impact ofdigitisation
Competitionwith other
media
Regulatory /Stakeholders
issuesOther
Most important business issues in the exhibition industry in Mexico and globally
Digitisation: implementation in Mexico and globally
59%64%
47%54%
37%18%
23%18%
22%0%
14%6%
9%
Added digital services / products around our existingexhibitions (like apps, digital advertising, digital signage)
Changed internal processes and workflows in ourcompany into digital processes
Developed a digital / transformation strategy for thewhole company
Created a designated function in the upper/topmanagement (like a CDO, Head of Digital, etc.)
Launched digital products not directly related toexisting exhibitions
Other
Mexico Global
71%
Developed a digital transformation strategy for individualexhibitions / products
(17 answers in total)
2421st UFI Global Exhibition Barometer / July 2018 ©
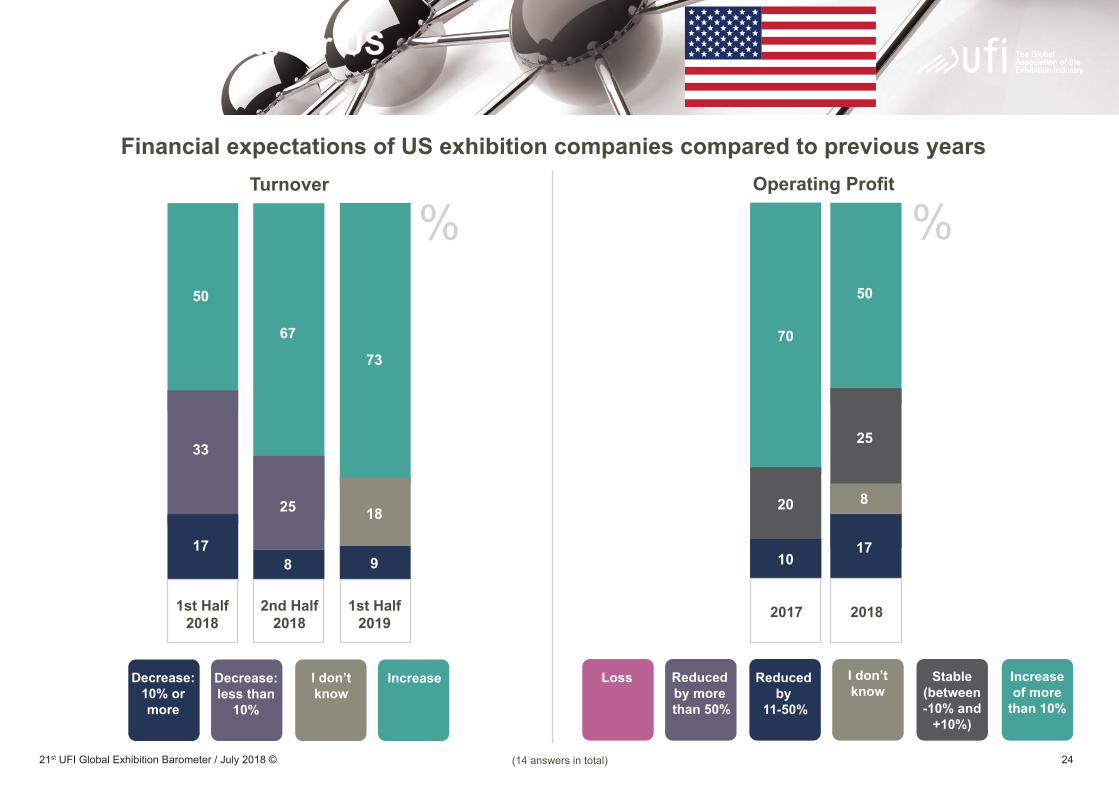
Detailed results for US
17
33
50
Turnover
8
25
67
9
18
73
%
Financial expectations of US exhibition companies compared to previous years
IncreaseDecrease:less than
10%
I don’tknow
Decrease:10% ormore
Operating Profit
%
70
10
20
50
25
17
8
Increaseof more
than 10%
Stable(between-10% and
+10%)
I don’tknow
Reduced by
11-50%
Reduced by more than 50%
Loss
1st Half2018
2nd Half2018
1st Half2019
2017 2018
(14 answers in total)
2521st UFI Global Exhibition Barometer / July 2018 ©
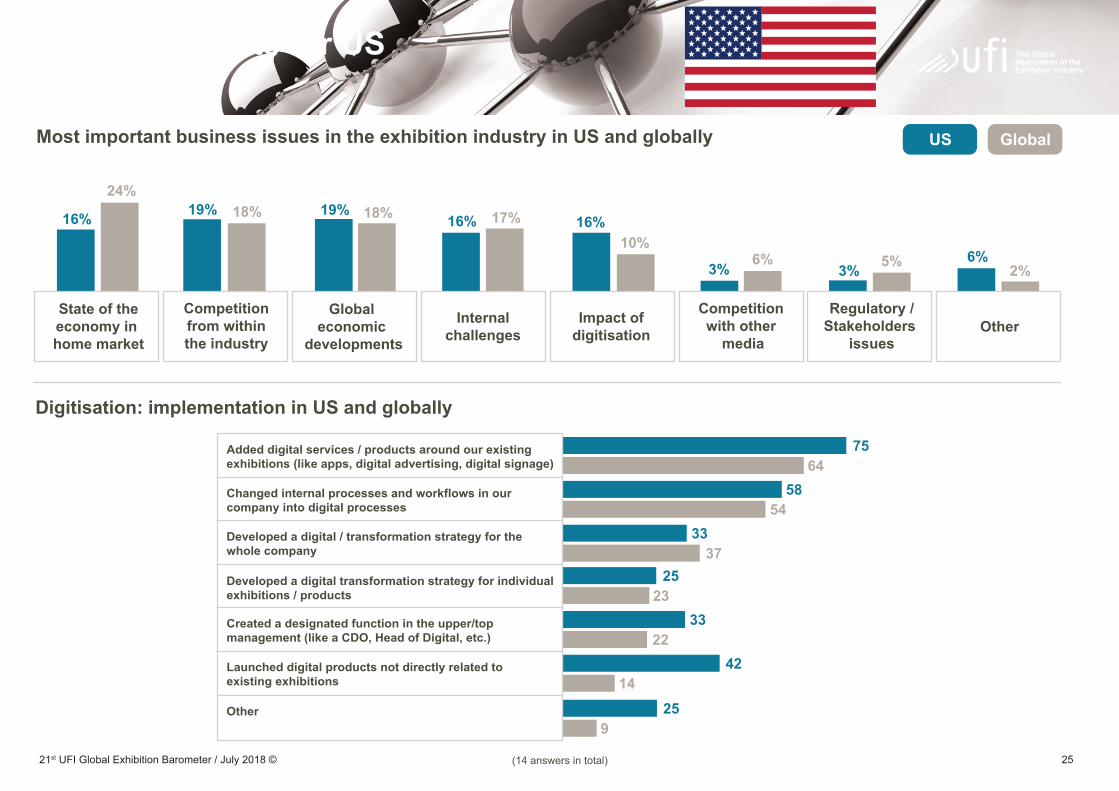
Detailed results for US
16%
24%19% 18% 19% 18% 16% 16%17%
10%
3% 6% 5%3% 2%6%
State of theeconomy in home market
Global economic
developments
Competitionfrom withinthe industry
Internalchallenges
Impact ofdigitisation
Competitionwith other
media
Regulatory /Stakeholders
issuesOther
Most important business issues in the exhibition industry in US and globally
Digitisation: implementation in US and globally
US Global
7564
5854
3337
2523
3322
4214
259
Added digital services / products around our existingexhibitions (like apps, digital advertising, digital signage)
Changed internal processes and workflows in ourcompany into digital processes
Developed a digital / transformation strategy for thewhole company
Created a designated function in the upper/topmanagement (like a CDO, Head of Digital, etc.)
Launched digital products not directly related toexisting exhibitions
Other
Developed a digital transformation strategy for individualexhibitions / products
(14 answers in total)
2621st UFI Global Exhibition Barometer / July 2018 ©
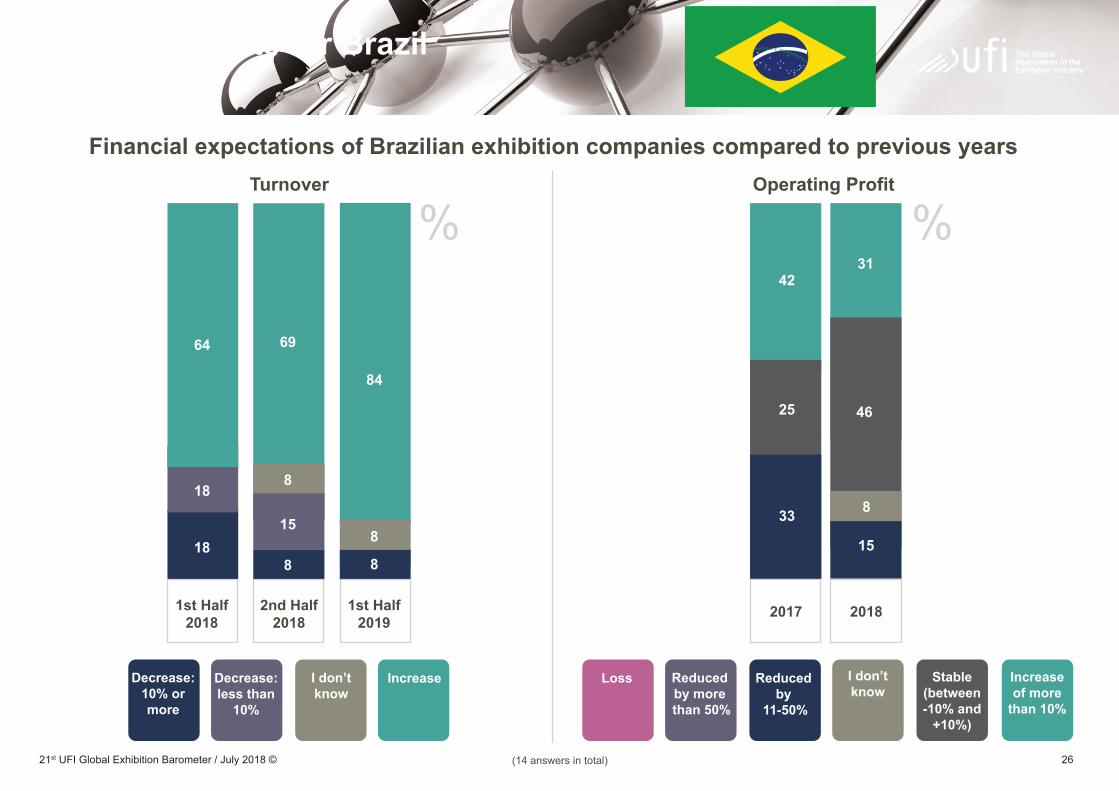
Detailed results for Brazil
18
18
64
Turnover Operating Profit
8
15
8
69
8
84
8
%%42
33
25
31
15
8
46
Financial expectations of Brazilian exhibition companies compared to previous years
Increaseof more
than 10%
Stable(between-10% and
+10%)
I don’tknow
Reduced by
11-50%
Reduced by more than 50%
LossIncreaseDecrease:less than
10%
I don’tknow
Decrease:10% ormore
1st Half2018
2nd Half2018
1st Half2019
2017 2018
(14 answers in total)
2721st UFI Global Exhibition Barometer / July 2018 ©
Detailed results for Brazil
8664
4354
5737
1423
2122
211414
9
Most important business issues in the exhibition industry in Brazil and globally
Digitisation: implementation in Brazil and globally
Added digital services / products around our existingexhibitions (like apps, digital advertising, digital signage)
Changed internal processes and workflows in ourcompany into digital processes
Developed a digital / transformation strategy for thewhole company
Created a designated function in the upper/topmanagement (like a CDO, Head of Digital, etc.)
Launched digital products not directly related toexisting exhibitions
Other
Brazil Global37%
24%18% 18%18%
8%
16% 13%17%
10%6% 5%5% 3% 2%0%
State of theeconomy in home market
Global economic
developments
Competitionfrom withinthe industry
Internalchallenges
Impact ofdigitisation
Competitionwith other
media
Regulatory /Stakeholders
issuesOther
Developed a digital transformation strategy for individualexhibitions / products
(14 answers in total)
2821st UFI Global Exhibition Barometer / July 2018 ©
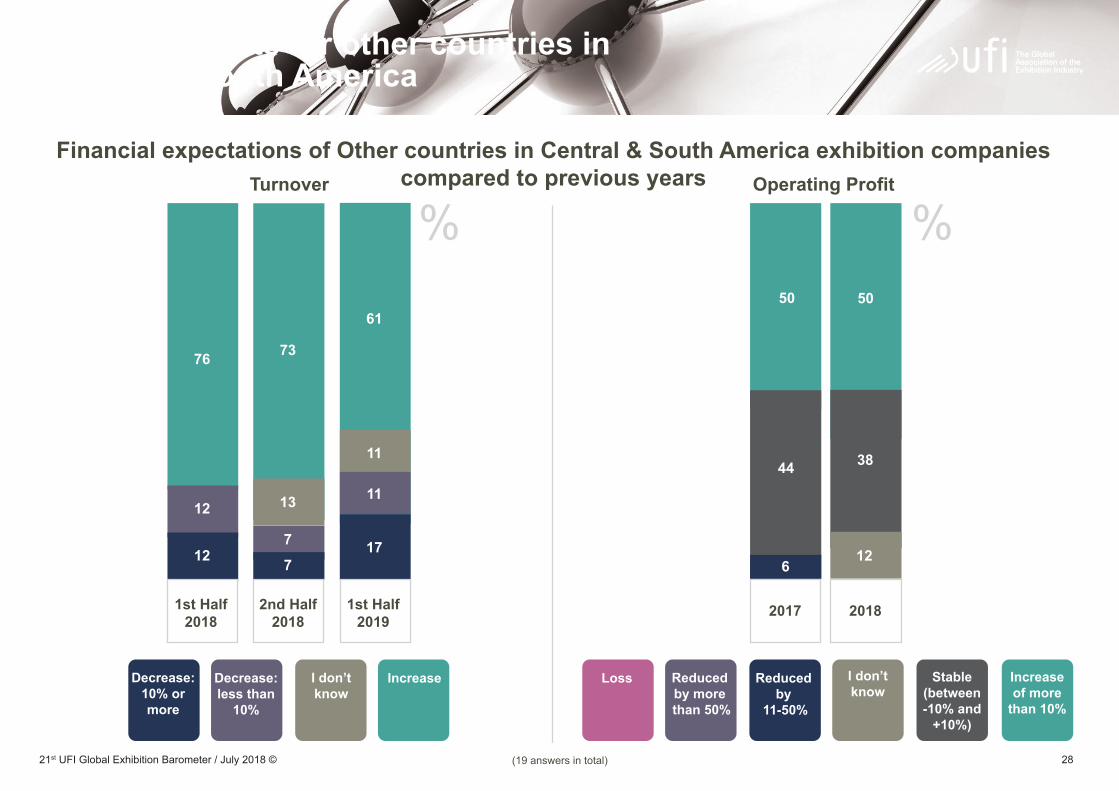
Detailed results for other countries in Central & South America
12
12
76
Turnover Operating Profit
7
7
13
73
11
11
61
17
%%50
6
44
50
12
38
Financial expectations of Other countries in Central & South America exhibition companiescompared to previous years
Increaseof more
than 10%
Stable(between-10% and
+10%)
I don’tknow
Reduced by
11-50%
Reduced by more than 50%
LossIncreaseDecrease:less than
10%
I don’tknow
Decrease:10% ormore
1st Half2018
2nd Half2018
1st Half2019
2017 2018
(19 answers in total)
2921st UFI Global Exhibition Barometer / July 2018 ©
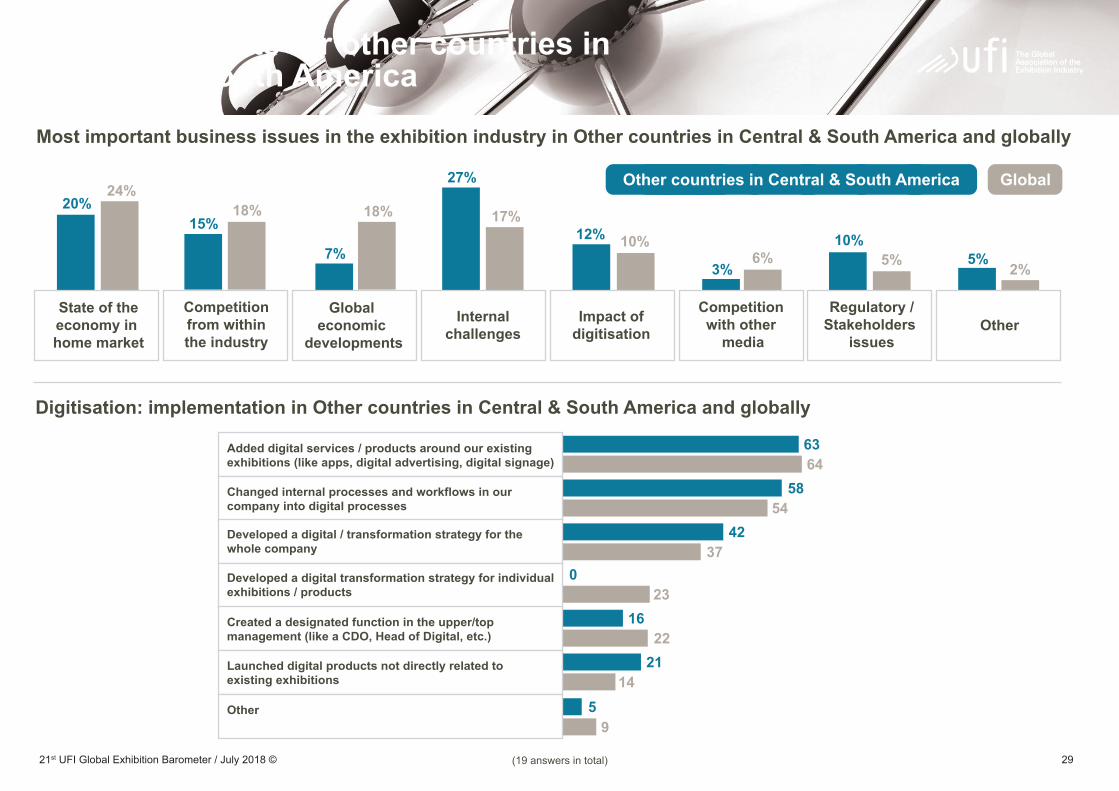
Detailed results for other countries in Central & South America
6364
5854
4237
023
1622
2114
59
Most important business issues in the exhibition industry in Other countries in Central & South America and globally
Digitisation: implementation in Other countries in Central & South America and globally
Added digital services / products around our existingexhibitions (like apps, digital advertising, digital signage)
Changed internal processes and workflows in ourcompany into digital processes
Developed a digital / transformation strategy for thewhole company
Created a designated function in the upper/topmanagement (like a CDO, Head of Digital, etc.)
Launched digital products not directly related toexisting exhibitions
Other
Other countries in Central & South America Global20%
24%18% 18%
15%
27%
7% 5%12%
17%10%
6% 5%10%
3% 2%
State of theeconomy in home market
Global economic
developments
Competitionfrom withinthe industry
Internalchallenges
Impact ofdigitisation
Competitionwith other
media
Regulatory /Stakeholders
issuesOther
Developed a digital transformation strategy for individualexhibitions / products
(19 answers in total)
3021st UFI Global Exhibition Barometer / July 2018 ©
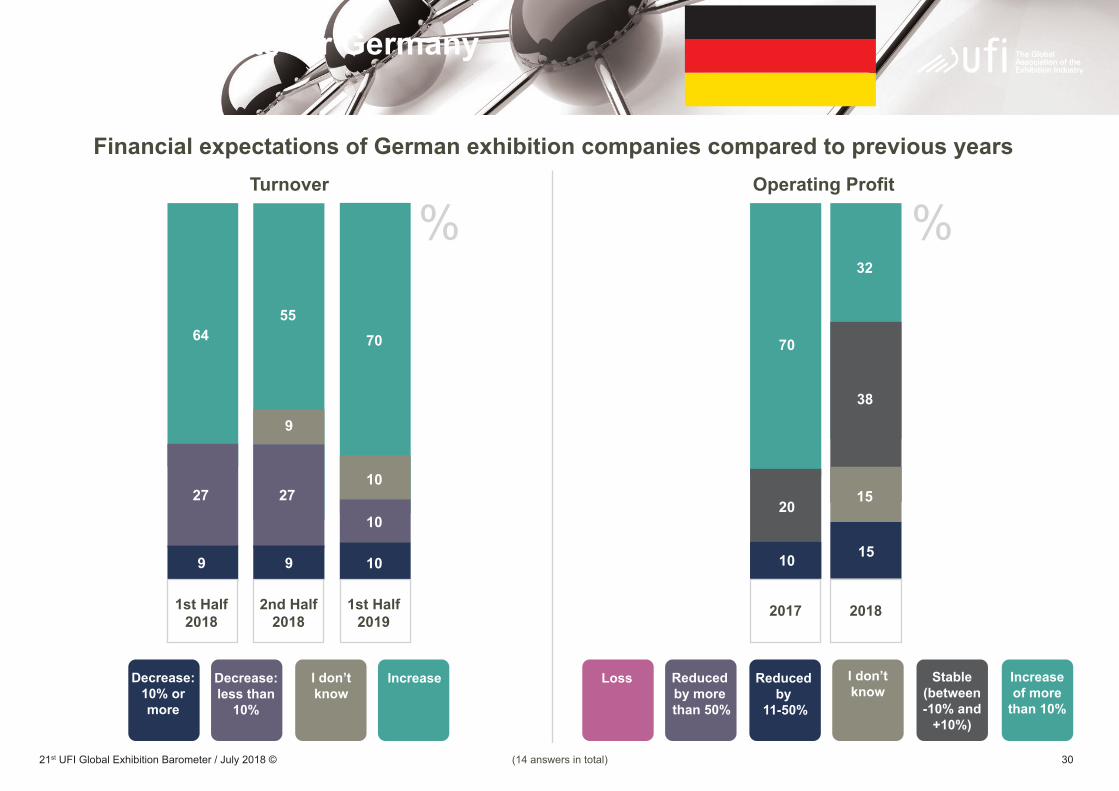
Detailed results for Germany
9
27 27
64
Turnover Operating Profit
55
10
10
10
70
%%
70
10
20
32
15
38
15
Financial expectations of German exhibition companies compared to previous years
Increaseof more
than 10%
Stable(between-10% and
+10%)
I don’tknow
Reduced by
11-50%
Reduced by more than 50%
LossIncreaseDecrease:less than
10%
I don’tknow
Decrease:10% ormore
9
9
1st Half2018
2nd Half2018
1st Half2019
2017 2018
(14 answers in total)
3121st UFI Global Exhibition Barometer / July 2018 ©
Detailed results for Germany
Most important business issues in the exhibition industry in Germany and globally
Digitisation: implementation in Germany and globally
Germany Global
8364
7554
6737
23
2225
1489
Added digital services / products around our existingexhibitions (like apps, digital advertising, digital signage)
Changed internal processes and workflows in ourcompany into digital processes
Developed a digital / transformation strategy for thewhole company
Created a designated function in the upper/topmanagement (like a CDO, Head of Digital, etc.)
Launched digital products not directly related toexisting exhibitions
Other
14% 14% 14% 14%
24%18% 18%
11%
31%
0%
17%10%
6% 5%3% 2%
State of theeconomy in home market
Global economic
developments
Competitionfrom withinthe industry
Internalchallenges
Impact ofdigitisation
Competitionwith other
media
Regulatory /Stakeholders
issuesOther
33
33
Developed a digital transformation strategy for individualexhibitions / products
(14 answers in total)
3221st UFI Global Exhibition Barometer / July 2018 ©
7
14 15
79
Turnover Operating Profit
77
7
21
72
%%50
7
43
50
36
14
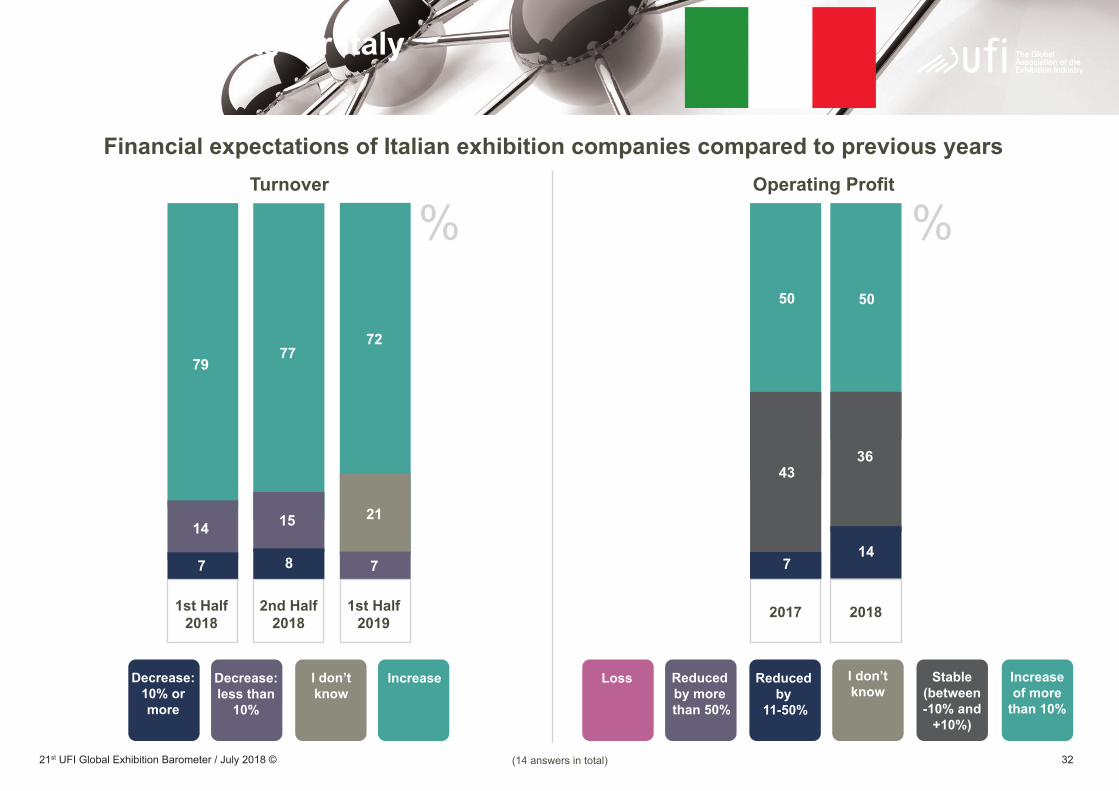
Financial expectations of Italian exhibition companies compared to previous years
Increaseof more
than 10%
Stable(between-10% and
+10%)
I don’tknow
Reduced by
11-50%
Reduced by more than 50%
LossIncreaseDecrease:less than
10%
I don’tknow
Decrease:10% ormore
8
1st Half2018
2nd Half2018
1st Half2019
2017 2018
Detailed results for Italy
(14 answers in total)
3321st UFI Global Exhibition Barometer / July 2018 ©
Detailed results for Italy
15
0
Most important business issues in the exhibition industry in Italy and globally
Digitisation: implementation in Italy and globally
Italy Global
6485
1554
3837
2323
22
14
9
Added digital services / products around our existingexhibitions (like apps, digital advertising, digital signage)
Changed internal processes and workflows in ourcompany into digital processes
Developed a digital / transformation strategy for thewhole company
Created a designated function in the upper/topmanagement (like a CDO, Head of Digital, etc.)
Launched digital products not directly related toexisting exhibitions
Other
15%20%
13%8%
3%
24%18% 18%
10% 10%
23%17%
10%6% 5% 2%
State of theeconomy in home market
Global economic
developments
Competitionfrom withinthe industry
Internalchallenges
Impact ofdigitisation
Competitionwith other
media
Regulatory /Stakeholders
issuesOther
31
Developed a digital transformation strategy for individualexhibitions / products
(14 answers in total)
3421st UFI Global Exhibition Barometer / July 2018 ©
Detailed results for Russia
8
42
50
Turnover Operating Profit
8
8
15
69
27
73
%%21
14
65
85
15
Financial expectations of Russian exhibition companies compared to previous years
Increaseof more
than 10%
Stable(between-10% and
+10%)
I don’tknow
Reduced by
11-50%
Reduced by more than 50%
LossIncreaseDecrease:less than
10%
I don’tknow
Decrease:10% ormore
1st Half2018
2nd Half2018
1st Half2019
2017 2018
(16answersintotal)
3521st UFI Global Exhibition Barometer / July 2018 ©
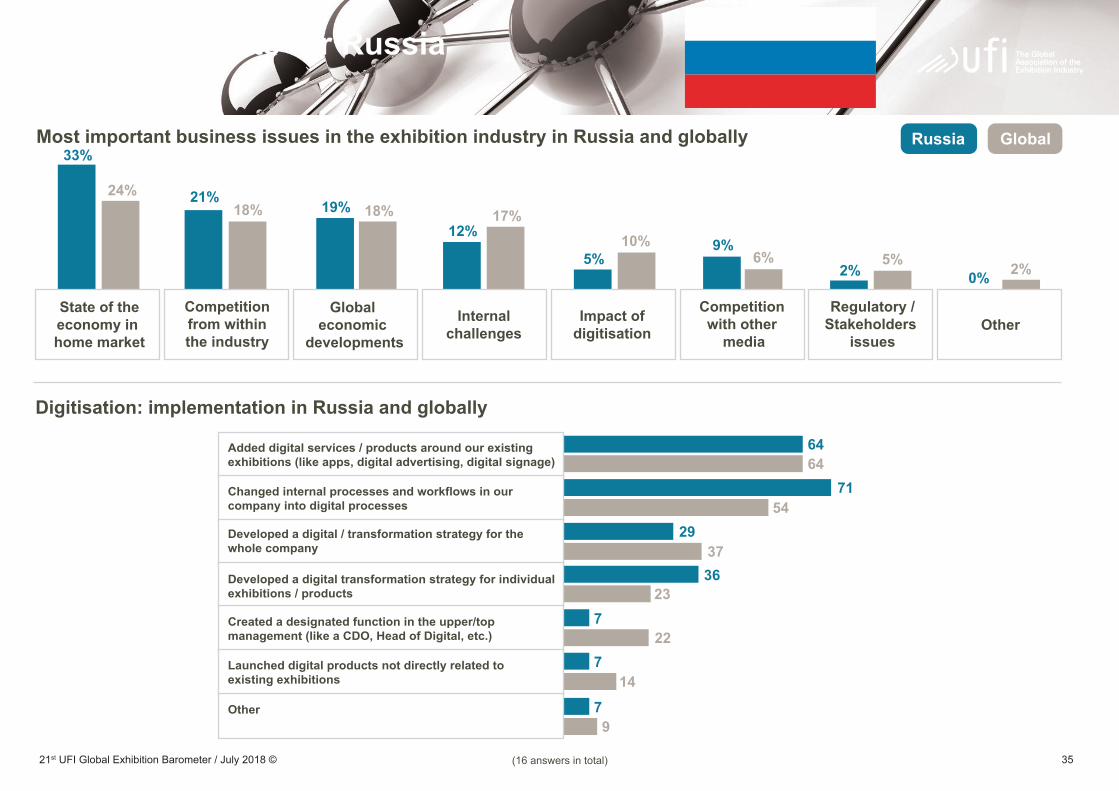
Detailed results for Russia
7
7
Most important business issues in the exhibition industry in Russia and globally
Digitisation: implementation in Russia and globally
Russia Global
6464
7154
2937
23
22
14
9
Added digital services / products around our existingexhibitions (like apps, digital advertising, digital signage)
Changed internal processes and workflows in ourcompany into digital processes
Developed a digital / transformation strategy for thewhole company
Created a designated function in the upper/topmanagement (like a CDO, Head of Digital, etc.)
Launched digital products not directly related toexisting exhibitions
Other
33%
21%
5%2%
24%18% 18%
12%19%
0%
17%10%
6% 5%9%
2%
State of theeconomy in home market
Global economic
developments
Competitionfrom withinthe industry
Internalchallenges
Impact ofdigitisation
Competitionwith other
media
Regulatory /Stakeholders
issuesOther
36
7
Developed a digital transformation strategy for individualexhibitions / products
(16answersintotal)
3621st UFI Global Exhibition Barometer / July 2018 ©
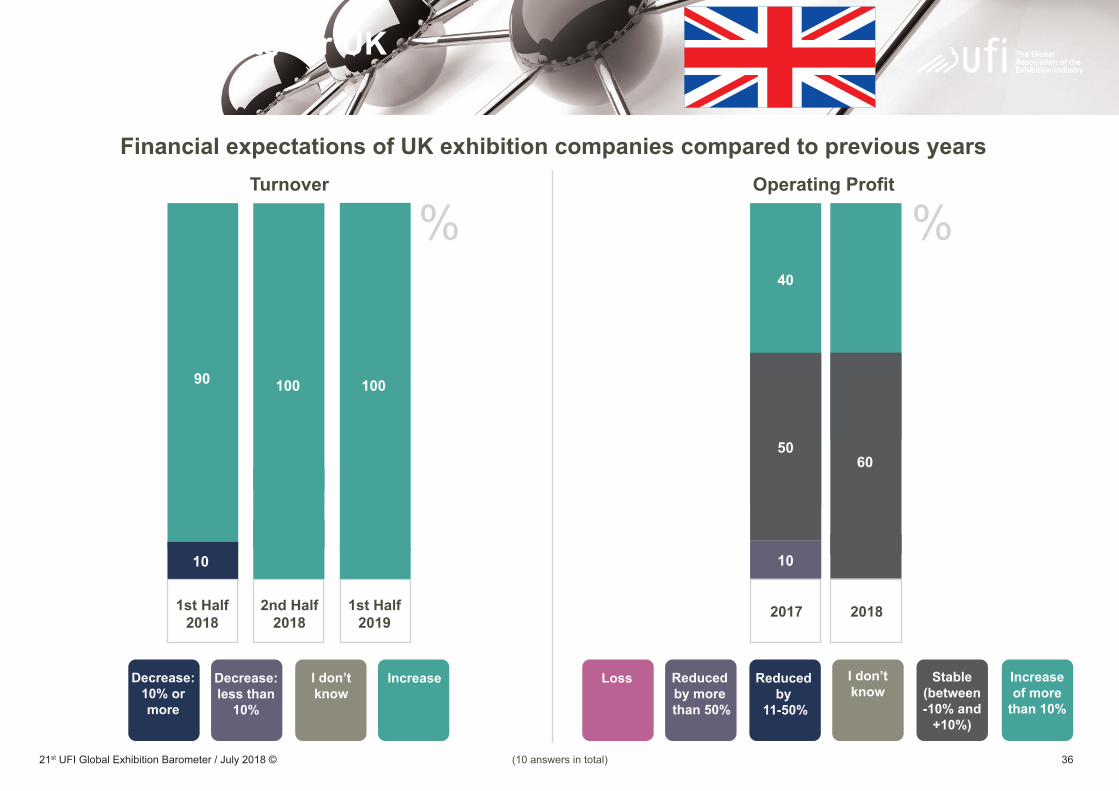
Detailed results for UK
10
90
Turnover Operating Profit
100 100
%%
10
50
40 40
60
Financial expectations of UK exhibition companies compared to previous years
Increaseof more
than 10%
Stable(between-10% and
+10%)
I don’tknow
Reduced by
11-50%
Reduced by more than 50%
LossIncreaseDecrease:less than
10%
I don’tknow
Decrease:10% ormore
1st Half2018
2nd Half2018
1st Half2019
2017 2018
(10 answers in total)
3721st UFI Global Exhibition Barometer / July 2018 ©
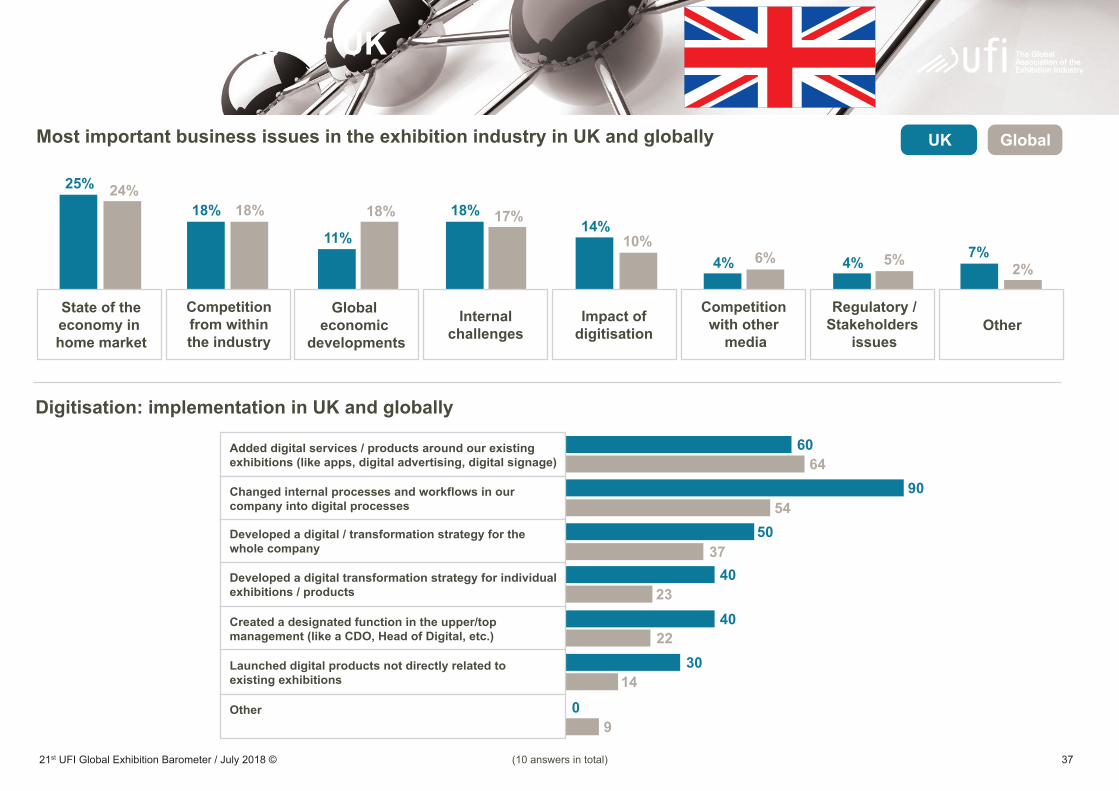
Detailed results for UK
5
Most important business issues in the exhibition industry in UK and globally
Digitisation: implementation in UK and globally
UK Global
0
6460
9054
5037
2340
40
3022
14
9
Added digital services / products around our existingexhibitions (like apps, digital advertising, digital signage)
Changed internal processes and workflows in ourcompany into digital processes
Developed a digital / transformation strategy for thewhole company
Created a designated function in the upper/topmanagement (like a CDO, Head of Digital, etc.)
Launched digital products not directly related toexisting exhibitions
Other
25%
14%
7%
24%18% 18%18% 18%
4% 4%11%
17%10%
6% 5% 2%
State of theeconomy in home market
Global economic
developments
Competitionfrom withinthe industry
Internalchallenges
Impact ofdigitisation
Competitionwith other
media
Regulatory /Stakeholders
issuesOther
Developed a digital transformation strategy for individualexhibitions / products
(10 answers in total)
3821st UFI Global Exhibition Barometer / July 2018 ©
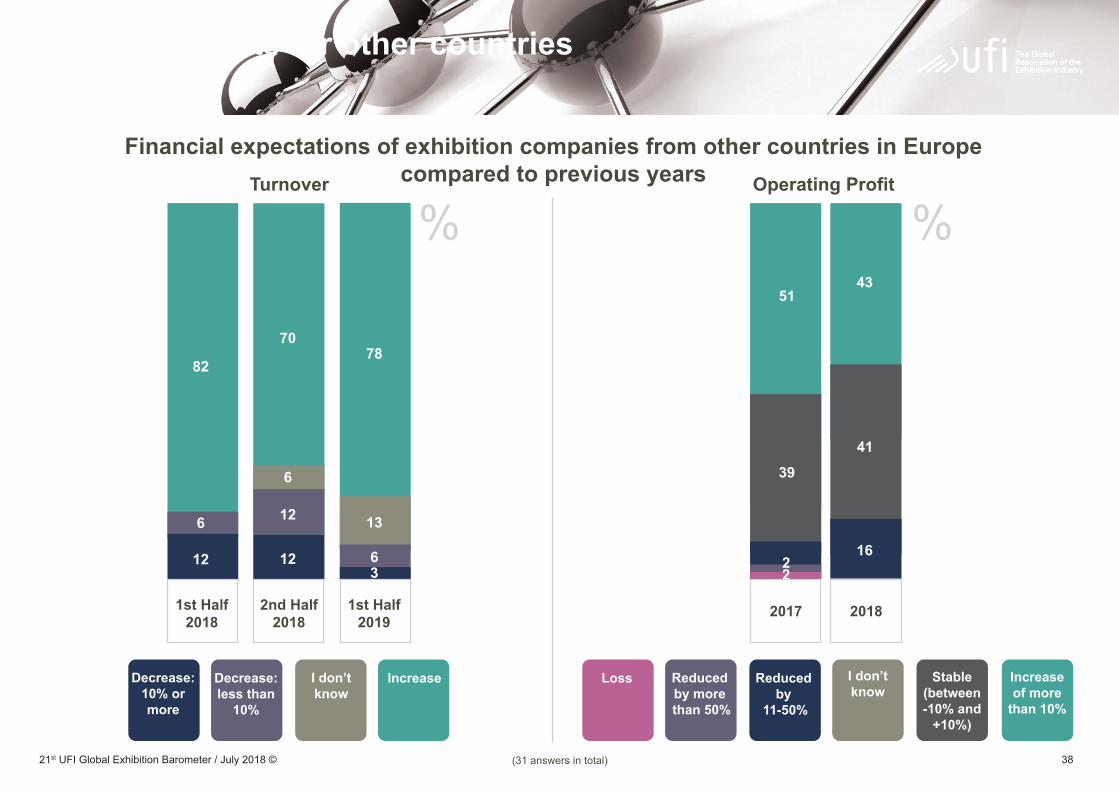
Detailed results for other countries in Europe
12
6
82
Turnover Operating Profit
12
12
6
70
6
13
3
78
%%
39
22
5143
41
16
Financial expectations of exhibition companies from other countries in Europecompared to previous years
Increaseof more
than 10%
Stable(between-10% and
+10%)
I don’tknow
Reduced by
11-50%
Reduced by more than 50%
LossIncreaseDecrease:less than
10%
I don’tknow
Decrease:10% ormore
1st Half2018
2nd Half2018
1st Half2019
2017 2018
(31 answers in total)
3921st UFI Global Exhibition Barometer / July 2018 ©
Detailed results for other countries in Europe
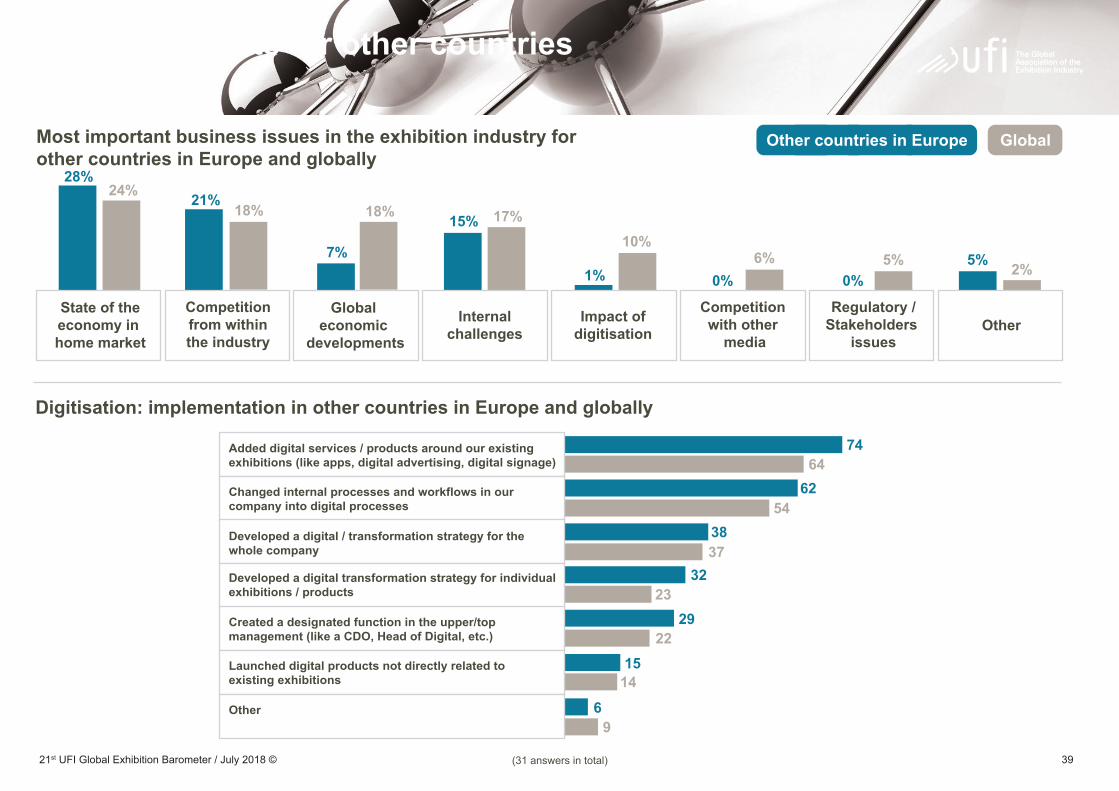
Most important business issues in the exhibition industry for other countries in Europe and globally
Digitisation: implementation in other countries in Europe and globally
Other countries in Europe Global
6
15
6474
6254
3837
2332
22
14
9
Added digital services / products around our existingexhibitions (like apps, digital advertising, digital signage)
Changed internal processes and workflows in ourcompany into digital processes
Developed a digital / transformation strategy for thewhole company
Created a designated function in the upper/topmanagement (like a CDO, Head of Digital, etc.)
Launched digital products not directly related toexisting exhibitions
Other
28%
1%
24% 21%18% 18% 15%
0% 0%
7%
17%10%
6% 5% 5% 2%
State of theeconomy in home market
Global economic
developments
Competitionfrom withinthe industry
Internalchallenges
Impact ofdigitisation
Competitionwith other
media
Regulatory /Stakeholders
issuesOther
29
Developed a digital transformation strategy for individualexhibitions / products
(31 answers in total)
4021st UFI Global Exhibition Barometer / July 2018 ©
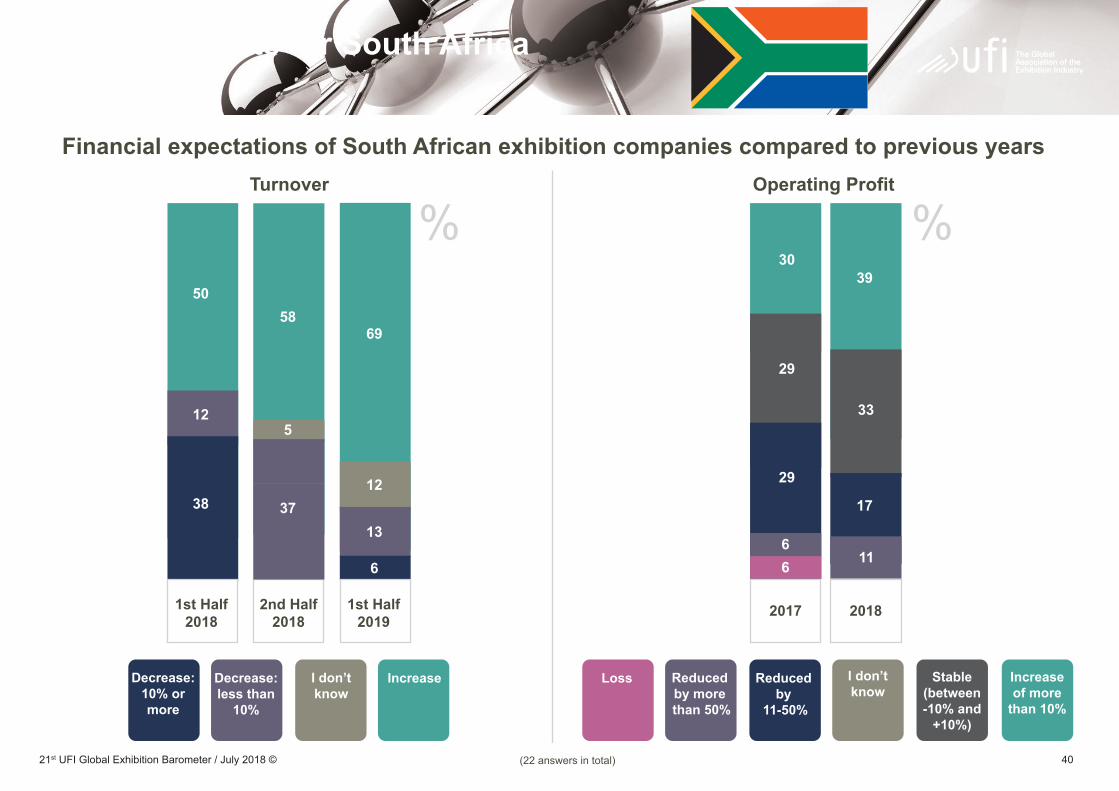
Detailed results for South Africa
38
12
50
Turnover Operating Profit
58
5
6
69
12
13
%%
66
29
29
3039
11
17
33
Financial expectations of South African exhibition companies compared to previous years
Increaseof more
than 10%
Stable(between-10% and
+10%)
I don’tknow
Reduced by
11-50%
Reduced by more than 50%
LossIncreaseDecrease:less than
10%
I don’tknow
Decrease:10% ormore
37
1st Half2018
2nd Half2018
1st Half2019
2017 2018
(22 answers in total)
4121st UFI Global Exhibition Barometer / July 2018 ©
Detailed results for South Africa
6
6
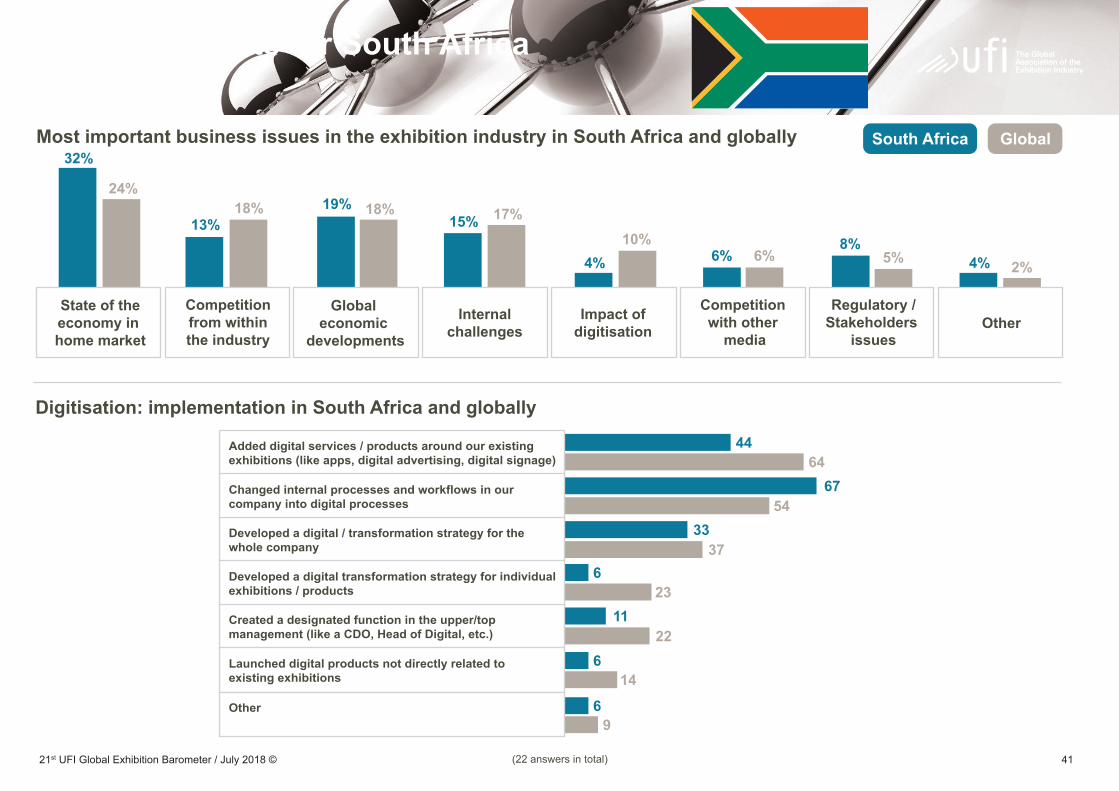
Most important business issues in the exhibition industry in South Africa and globally
Digitisation: implementation in South Africa and globally
South Africa Global
11
6444
6754
3337
236
22
14
9
Added digital services / products around our existingexhibitions (like apps, digital advertising, digital signage)
Changed internal processes and workflows in ourcompany into digital processes
Developed a digital / transformation strategy for thewhole company
Created a designated function in the upper/topmanagement (like a CDO, Head of Digital, etc.)
Launched digital products not directly related toexisting exhibitions
Other
13%
32%
4% 4%8%
24%18% 18%
15%19% 17%
10%6%6% 5% 2%
State of theeconomy in home market
Global economic
developments
Competitionfrom withinthe industry
Internalchallenges
Impact ofdigitisation
Competitionwith other
media
Regulatory /Stakeholders
issuesOther
Developed a digital transformation strategy for individualexhibitions / products
(22 answers in total)
4221st UFI Global Exhibition Barometer / July 2018 ©
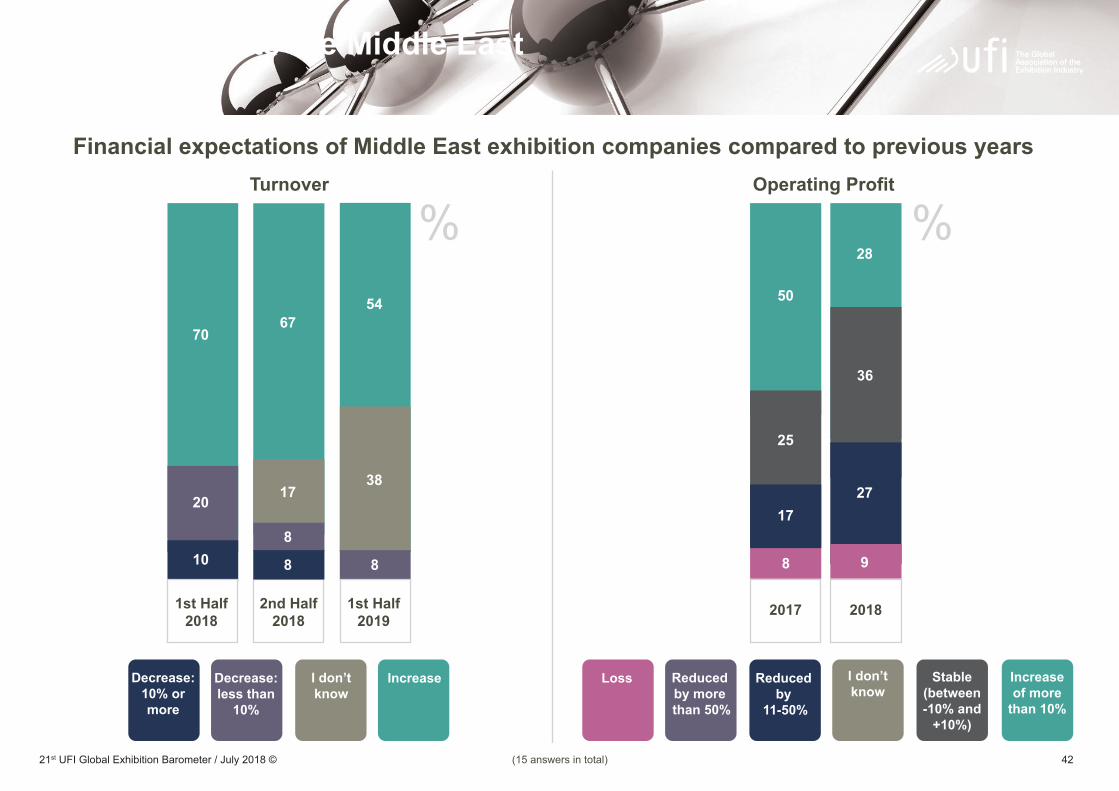
Detailed results the Middle East
10
20
70
Turnover Operating Profit
17
6754
38
%%
8
17
25
50
36
9
27
28
Financial expectations of Middle East exhibition companies compared to previous years
Increaseof more
than 10%
Stable(between-10% and
+10%)
I don’tknow
Reduced by
11-50%
Reduced by more than 50%
LossIncreaseDecrease:less than
10%
I don’tknow
Decrease:10% ormore
8 8
8
1st Half2018
2nd Half2018
1st Half2019
2017 2018
(15 answers in total)
4321st UFI Global Exhibition Barometer / July 2018 ©
Detailed results the Middle East
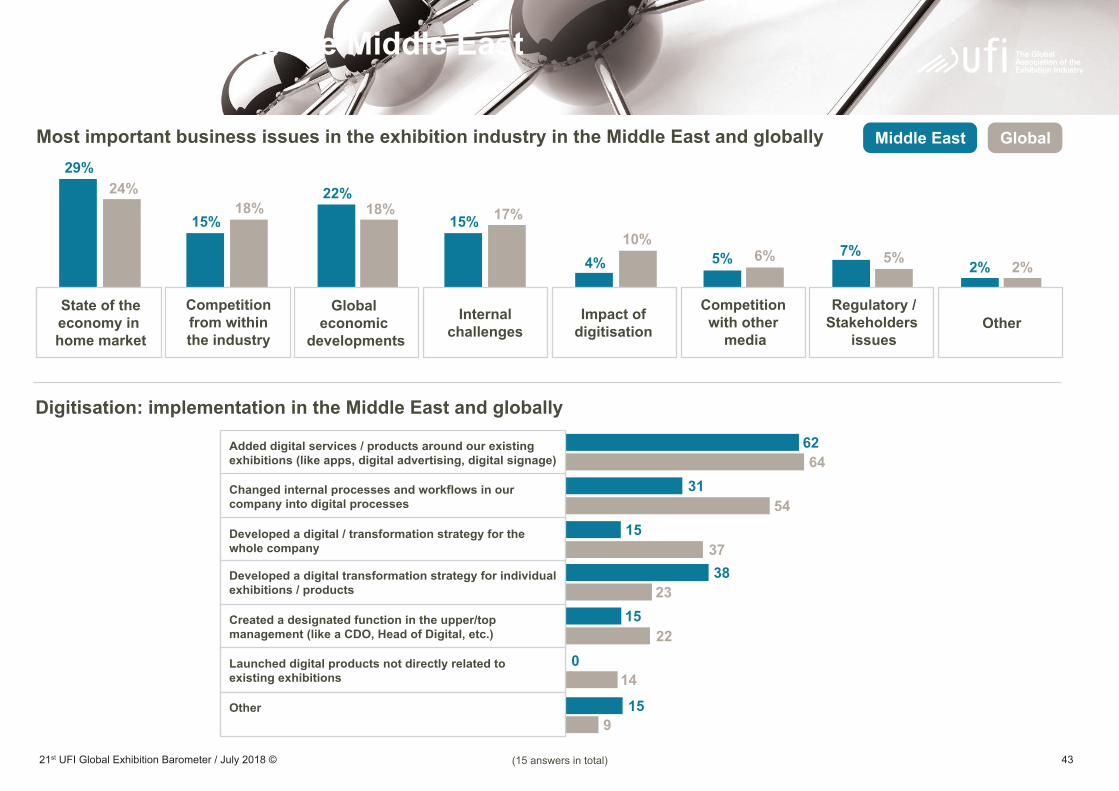
Most important business issues in the exhibition industry in the Middle East and globally
Digitisation: implementation in the Middle East and globally
Middle East Global
15
0
15
6462
3154
1537
2338
22
14
9
Added digital services / products around our existingexhibitions (like apps, digital advertising, digital signage)
Changed internal processes and workflows in ourcompany into digital processes
Developed a digital / transformation strategy for thewhole company
Created a designated function in the upper/topmanagement (like a CDO, Head of Digital, etc.)
Launched digital products not directly related toexisting exhibitions
Other
29%
4%7%
24%18% 18%
15%15%
22%17%
10%6%5% 5% 2%2%
State of theeconomy in home market
Global economic
developments
Competitionfrom withinthe industry
Internalchallenges
Impact ofdigitisation
Competitionwith other
media
Regulatory /Stakeholders
issuesOther
Developed a digital transformation strategy for individualexhibitions / products
(15 answers in total)
4421st UFI Global Exhibition Barometer / July 2018 ©
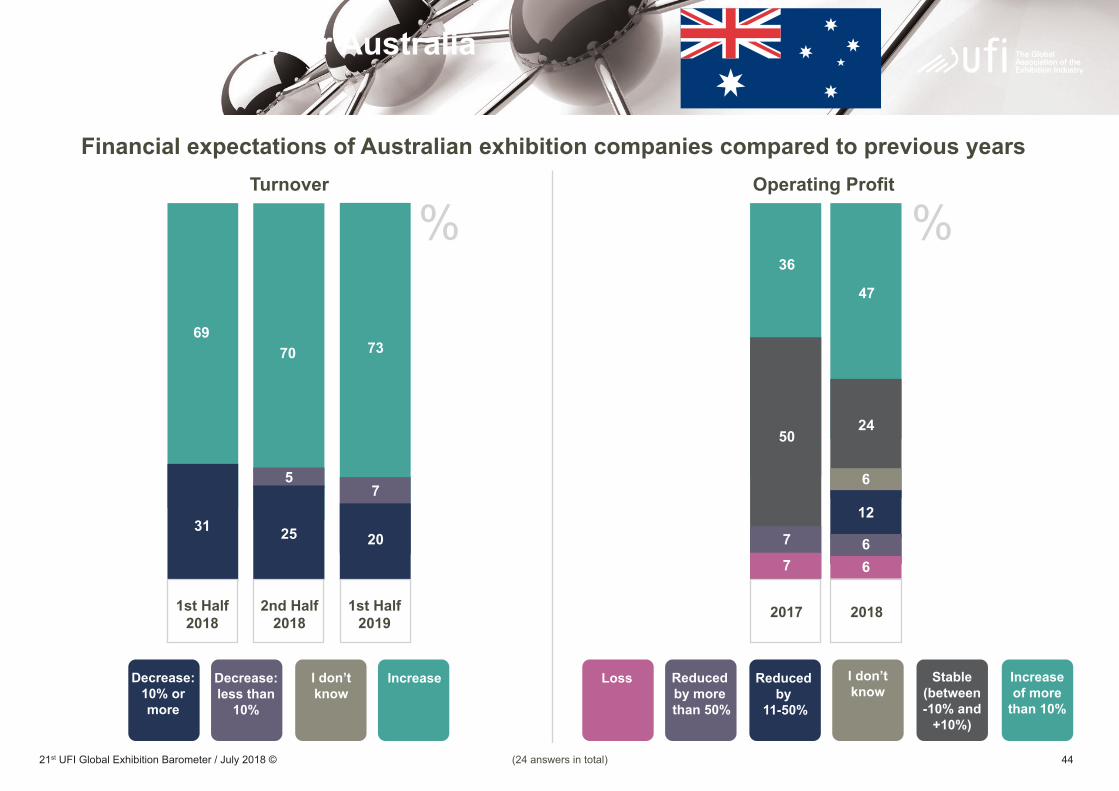
Detailed results for Australia
31 15
69
Turnover Operating Profit
70
20
7
73
%%36
7
7
50
1st Half2018
2nd Half2018
1st Half2019
2017 2018
47
24
6
12
66
Financial expectations of Australian exhibition companies compared to previous years
Increaseof more
than 10%
Stable(between-10% and
+10%)
I don’tknow
Reduced by
11-50%
Reduced by more than 50%
LossIncreaseDecrease:less than
10%
I don’tknow
Decrease:10% ormore
25
5
(24 answers in total)
4521st UFI Global Exhibition Barometer / July 2018 ©
Detailed results for Australia
21
6447
5354
11
11
37
23
22
14
9
16
0
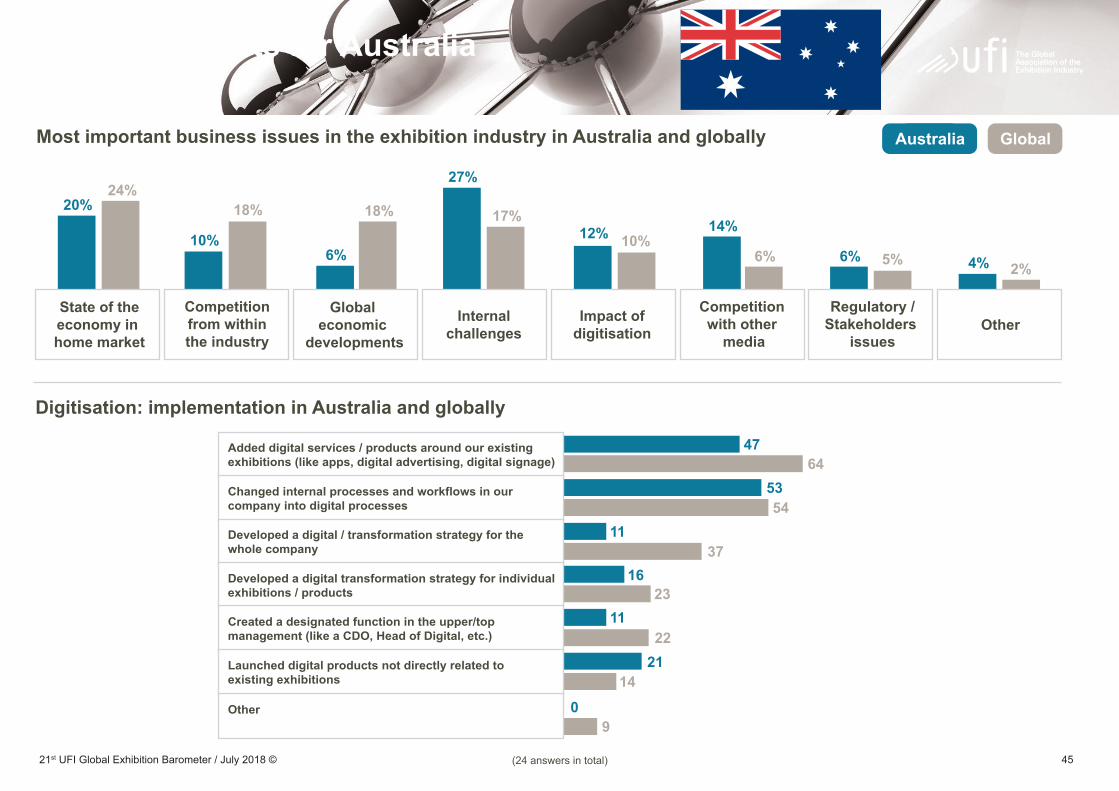
Most important business issues in the exhibition industry in Australia and globally
Digitisation: implementation in Australia and globally
Australia Global
Added digital services / products around our existingexhibitions (like apps, digital advertising, digital signage)
Changed internal processes and workflows in ourcompany into digital processes
Developed a digital / transformation strategy for thewhole company
Created a designated function in the upper/topmanagement (like a CDO, Head of Digital, etc.)
Launched digital products not directly related toexisting exhibitions
Other
20%
10% 12%6%6% 4%
24%18% 18%
27%
6%
17%10%
5%
14%
2%
State of theeconomy in home market
Global economic
developments
Competitionfrom withinthe industry
Internalchallenges
Impact ofdigitisation
Competitionwith other
media
Regulatory /Stakeholders
issuesOther
Developed a digital transformation strategy for individualexhibitions / products
(24 answers in total)
4621st UFI Global Exhibition Barometer / July 2018 ©
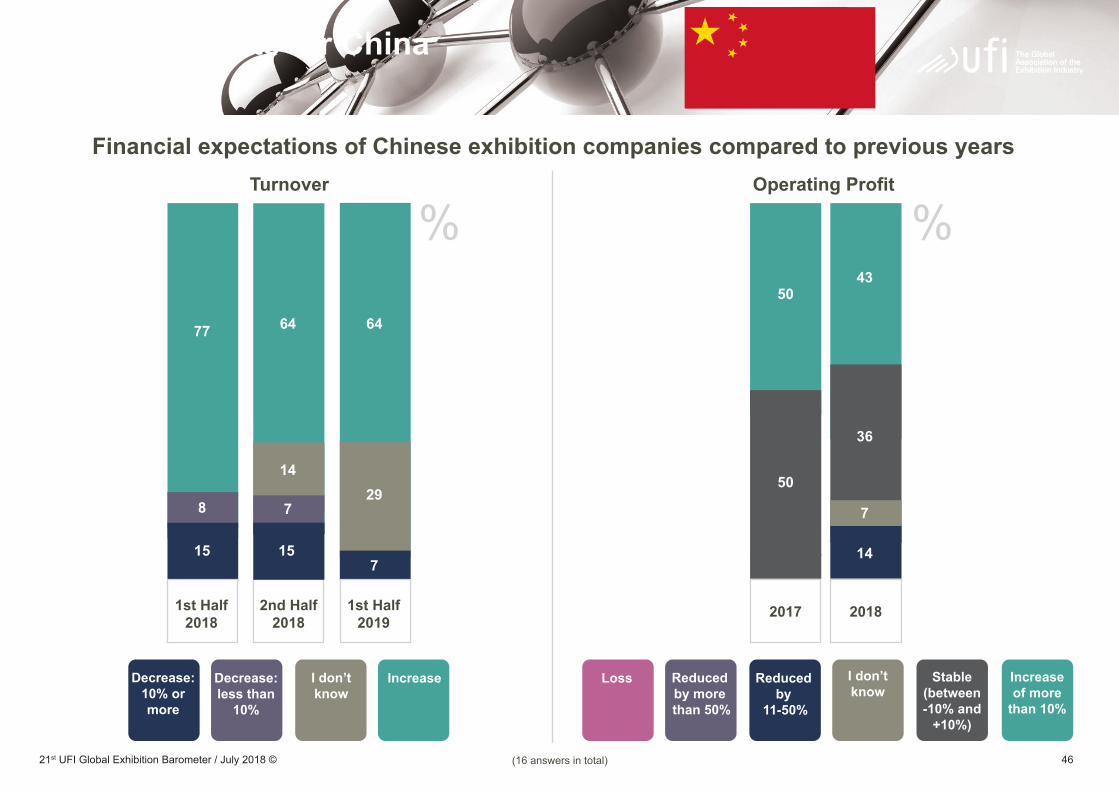
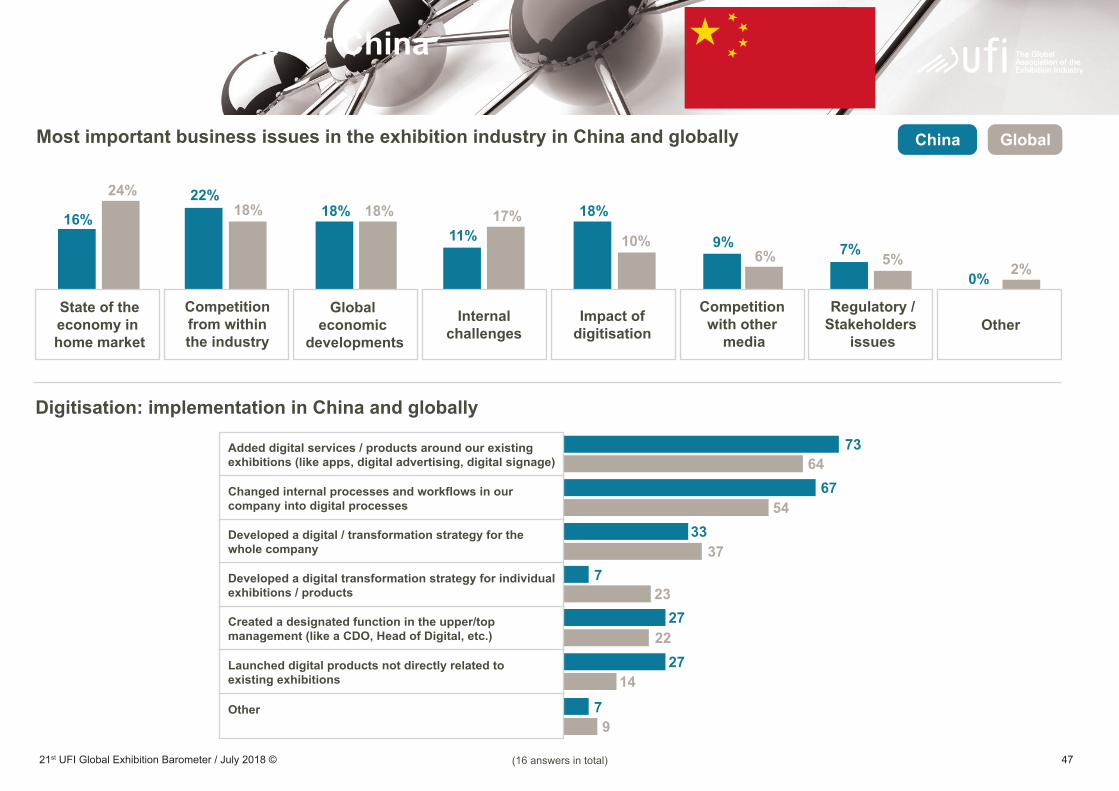
Detailed results for China
1515
8
77
Turnover Operating Profit
7
14
64 64
7
29
%%
50
50
36
43
14
7
Financial expectations of Chinese exhibition companies compared to previous years
Increaseof more
than 10%
Stable(between-10% and
+10%)
I don’tknow
Reduced by
11-50%
Reduced by more than 50%
LossIncreaseDecrease:less than
10%
I don’tknow
Decrease:10% ormore
15
1st Half2018
2nd Half2018
1st Half2019
2017 2018
(16answersintotal)
4721st UFI Global Exhibition Barometer / July 2018 ©
Detailed results for China
7
27
Most important business issues in the exhibition industry in China and globally
Digitisation: implementation in China and globally
China Global
6473
6754
33
27
37
23
22
14
9
7
Added digital services / products around our existingexhibitions (like apps, digital advertising, digital signage)
Changed internal processes and workflows in ourcompany into digital processes
Developed a digital / transformation strategy for thewhole company
Created a designated function in the upper/topmanagement (like a CDO, Head of Digital, etc.)
Launched digital products not directly related toexisting exhibitions
Other
16%22%
7%6%0%
24%18% 18%18% 18%
11%17%
10%5%
9%
2%
State of theeconomy in home market
Global economic
developments
Competitionfrom withinthe industry
Internalchallenges
Impact ofdigitisation
Competitionwith other
media
Regulatory /Stakeholders
issuesOther
Developed a digital transformation strategy for individualexhibitions / products
(16answersintotal)

4821st UFI Global Exhibition Barometer / July 2018 ©
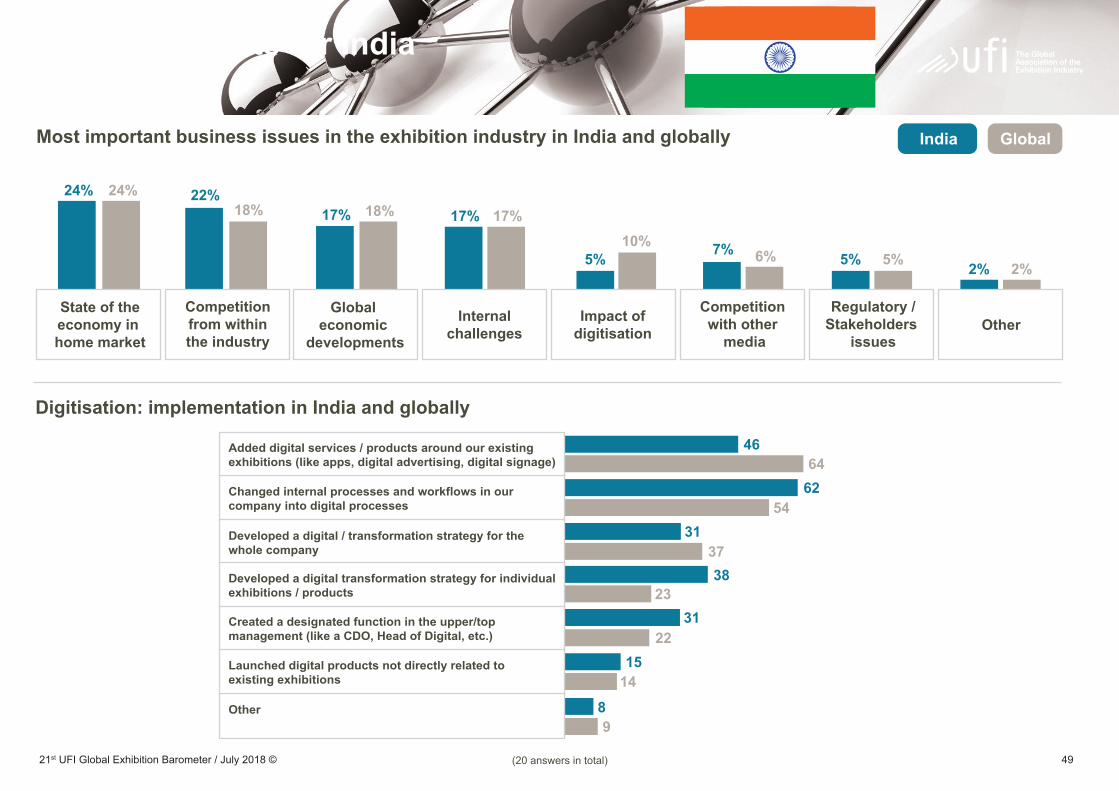
Detailed results for India
8
33
59
Turnover Operating Profit
15
77
21
72
7
%%
14
14
72
29
21
7
43
Financial expectations of Indian exhibition companies compared to previous years
Increaseof more
than 10%
Stable(between-10% and
+10%)
I don’tknow
Reduced by
11-50%
Reduced by more than 50%
LossIncreaseDecrease:less than
10%
I don’tknow
Decrease:10% ormore
8
1st Half2018
2nd Half2018
1st Half2019
2017 2018
(20 answers in total)
4921st UFI Global Exhibition Barometer / July 2018 ©
Detailed results for India
Most important business issues in the exhibition industry in India and globally
Digitisation: implementation in India and globally
India Global
8
15
6446
6254
31
31
37
23
22
14
9
38
Added digital services / products around our existingexhibitions (like apps, digital advertising, digital signage)
Changed internal processes and workflows in ourcompany into digital processes
Developed a digital / transformation strategy for thewhole company
Created a designated function in the upper/topmanagement (like a CDO, Head of Digital, etc.)
Launched digital products not directly related toexisting exhibitions
Other
22%
7% 6%
24%24%18% 18%17% 17%17%
10%5%5%5% 2%2%
State of theeconomy in home market
Global economic
developments
Competitionfrom withinthe industry
Internalchallenges
Impact ofdigitisation
Competitionwith other
media
Regulatory /Stakeholders
issuesOther
Developed a digital transformation strategy for individualexhibitions / products
(20 answers in total)
5021st UFI Global Exhibition Barometer / July 2018 ©
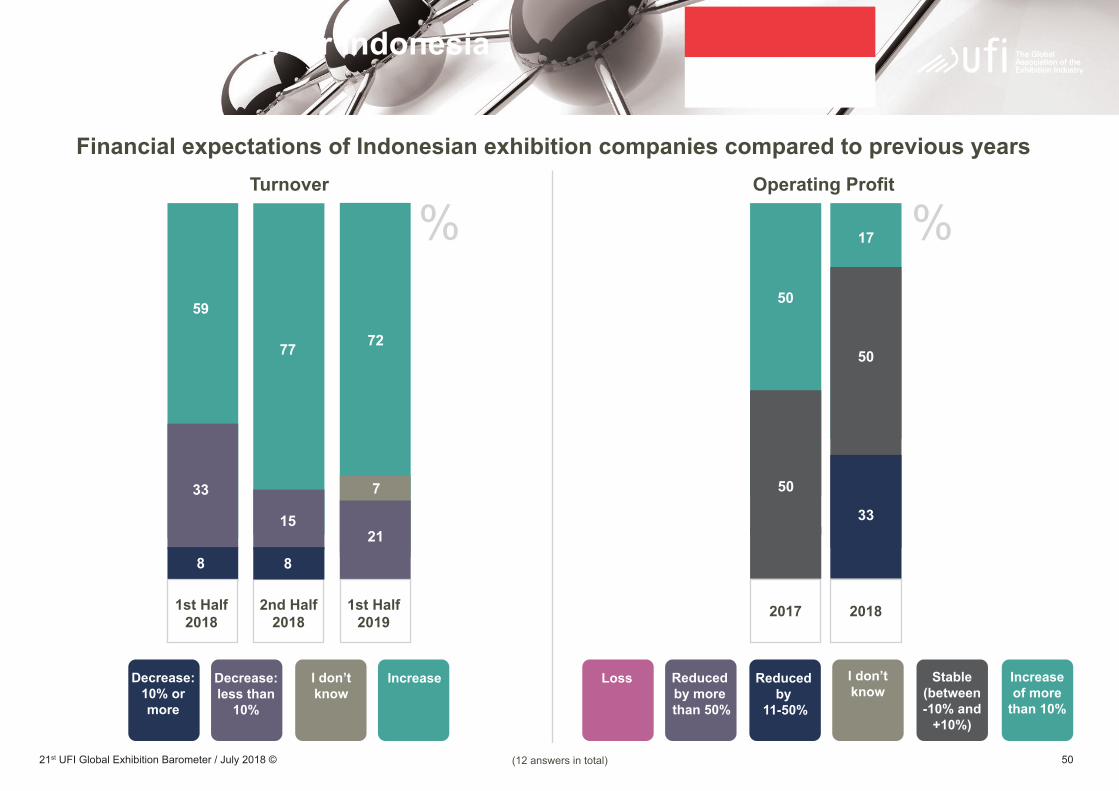
Detailed results for Indonesia
8
33
59
Turnover Operating Profit
15
77
21
72
7
%%
50
50
17
33
50
Financial expectations of Indonesian exhibition companies compared to previous years
Increaseof more
than 10%
Stable(between-10% and
+10%)
I don’tknow
Reduced by
11-50%
Reduced by more than 50%
LossIncreaseDecrease:less than
10%
I don’tknow
Decrease:10% ormore
8
1st Half2018
2nd Half2018
1st Half2019
2017 2018
(12 answers in total)
5121st UFI Global Exhibition Barometer / July 2018 ©
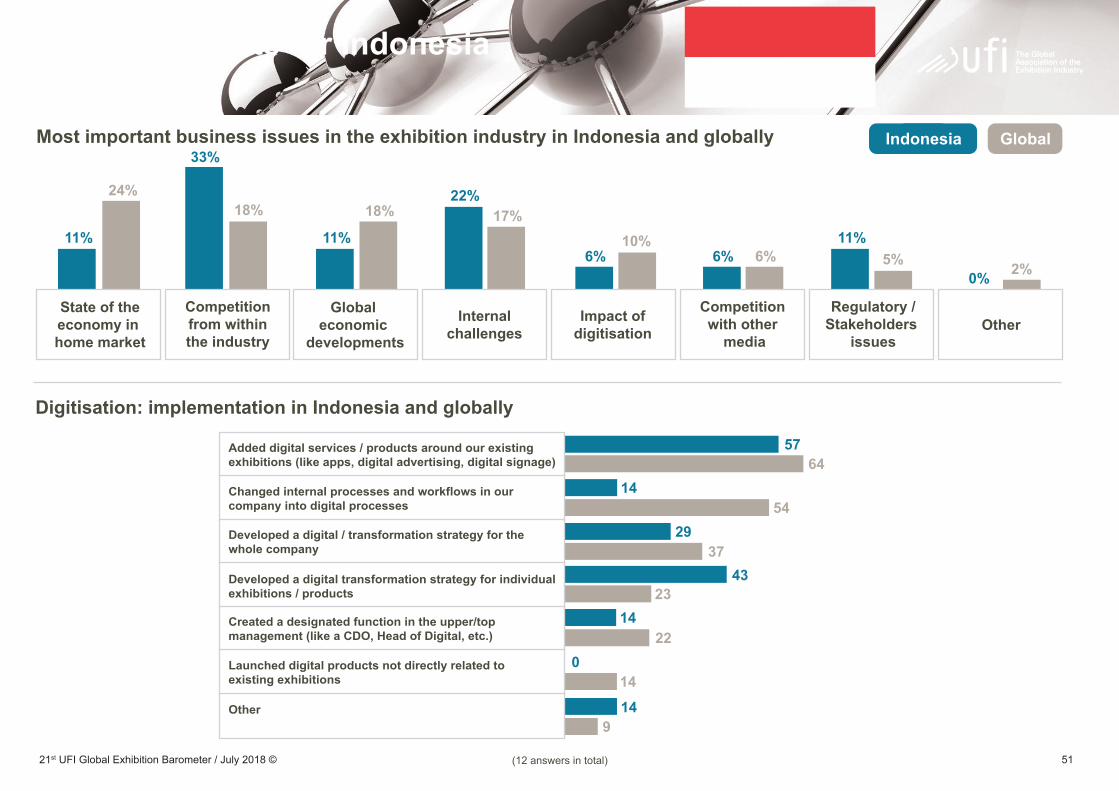
Detailed results for Indonesia
Most important business issues in the exhibition industry in Indonesia and globally
Digitisation: implementation in Indonesia and globally
Indonesia Global
14
0
6457
1454
29
14
37
23
22
14
9
43
Added digital services / products around our existingexhibitions (like apps, digital advertising, digital signage)
Changed internal processes and workflows in ourcompany into digital processes
Developed a digital / transformation strategy for thewhole company
Created a designated function in the upper/topmanagement (like a CDO, Head of Digital, etc.)
Launched digital products not directly related toexisting exhibitions
Other
33%
6%6% 6%
24%
11% 11% 11%
18% 18% 17%22%
10%5% 2%0%
State of theeconomy in home market
Global economic
developments
Competitionfrom withinthe industry
Internalchallenges
Impact ofdigitisation
Competitionwith other
media
Regulatory /Stakeholders
issuesOther
Developed a digital transformation strategy for individualexhibitions / products
(12 answers in total)
5221st UFI Global Exhibition Barometer / July 2018 ©
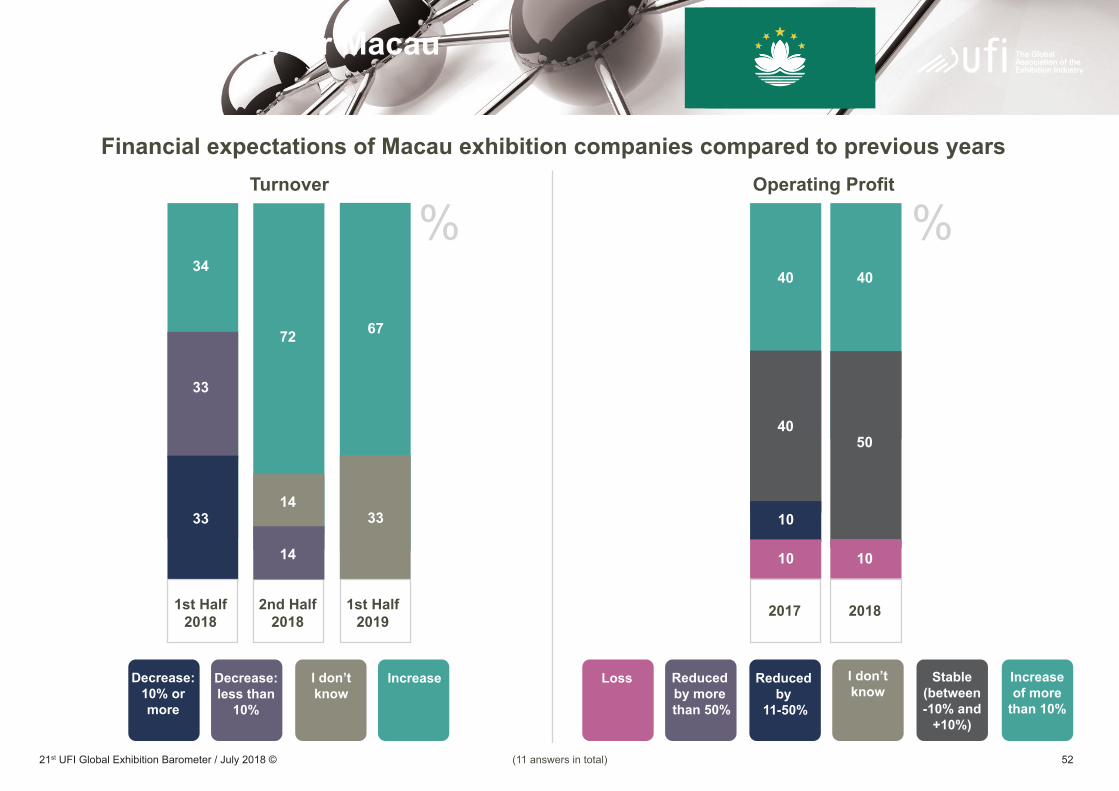
Detailed results for Macau
33
33
34
Turnover Operating Profit
14
72
33
67
%%
10 10
10
40
4050
Financial expectations of Macau exhibition companies compared to previous years
Increaseof more
than 10%
Stable(between-10% and
+10%)
I don’tknow
Reduced by
11-50%
Reduced by more than 50%
LossIncreaseDecrease:less than
10%
I don’tknow
Decrease:10% ormore
14 10
40
1st Half2018
2nd Half2018
1st Half2019
2017 2018
(11 answers in total)
5321st UFI Global Exhibition Barometer / July 2018 ©
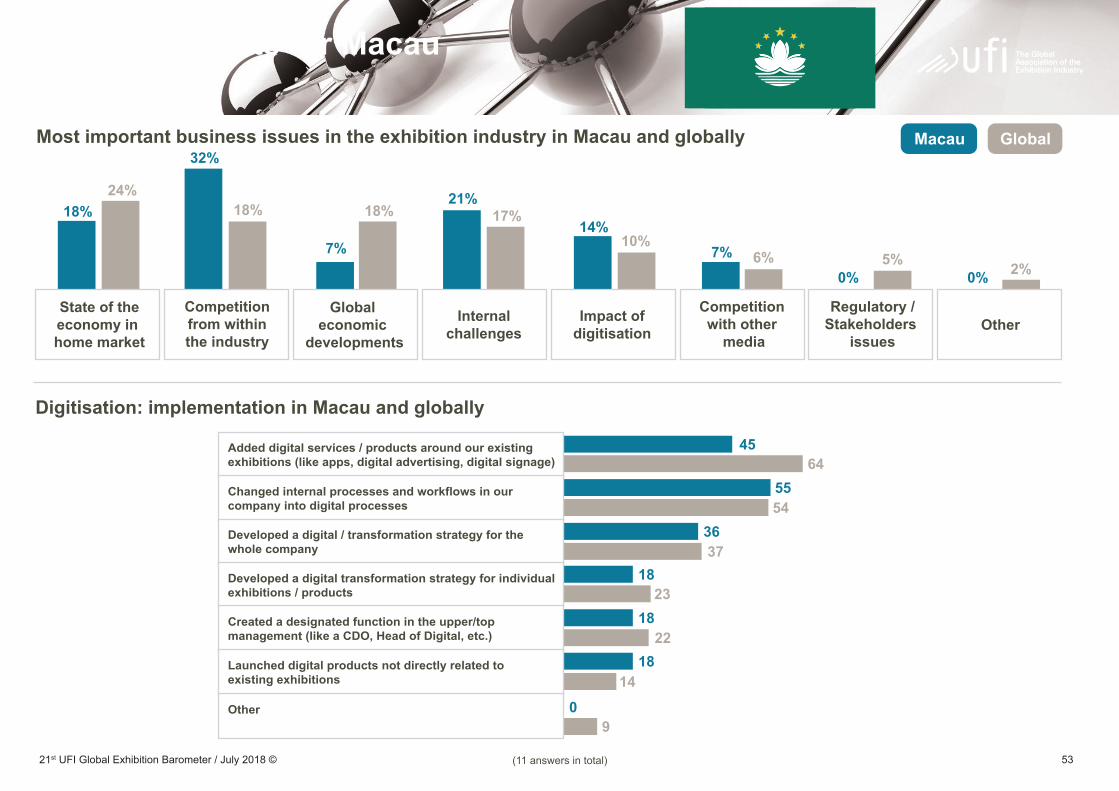
Detailed results for Macau
18
18
0
Most important business issues in the exhibition industry in Macau and globally
Digitisation: implementation in Macau and globally
Macau Global
6445
5554
3637
2318
22
14
9
Added digital services / products around our existingexhibitions (like apps, digital advertising, digital signage)
Changed internal processes and workflows in ourcompany into digital processes
Developed a digital / transformation strategy for thewhole company
Created a designated function in the upper/topmanagement (like a CDO, Head of Digital, etc.)
Launched digital products not directly related toexisting exhibitions
Other
32%
18%14%
0% 0%
24%18% 18%
21%
7%7%
17%10%
6% 5% 2%
State of theeconomy in home market
Global economic
developments
Competitionfrom withinthe industry
Internalchallenges
Impact ofdigitisation
Competitionwith other
media
Regulatory /Stakeholders
issuesOther
Developed a digital transformation strategy for individualexhibitions / products
(11 answers in total)
5421st UFI Global Exhibition Barometer / July 2018 ©
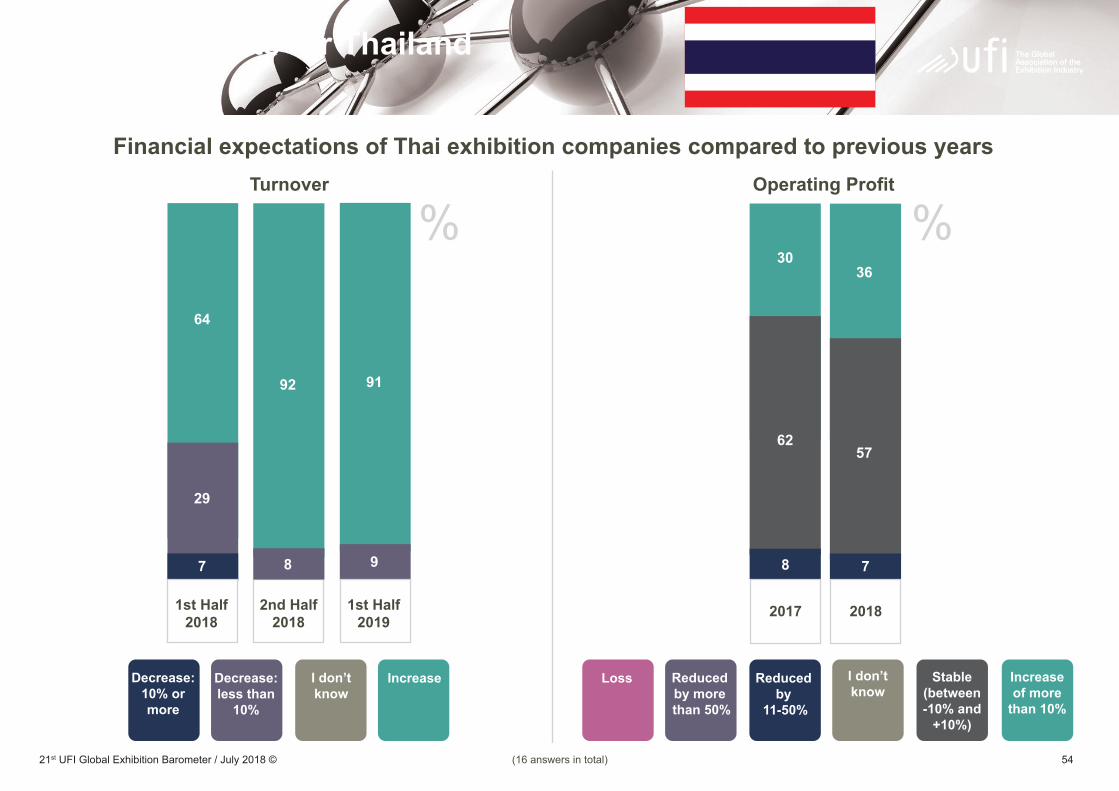
Detailed results for Thailand
29
7
64
Turnover Operating Profit
92
9
91
%%
Financial expectations of Thai exhibition companies compared to previous years
Increaseof more
than 10%
Stable(between-10% and
+10%)
I don’tknow
Reduced by
11-50%
Reduced by more than 50%
LossIncreaseDecrease:less than
10%
I don’tknow
Decrease:10% ormore
8 8
62
3036
7
57
1st Half2018
2nd Half2018
1st Half2019
2017 2018
(16answersintotal)
5521st UFI Global Exhibition Barometer / July 2018 ©
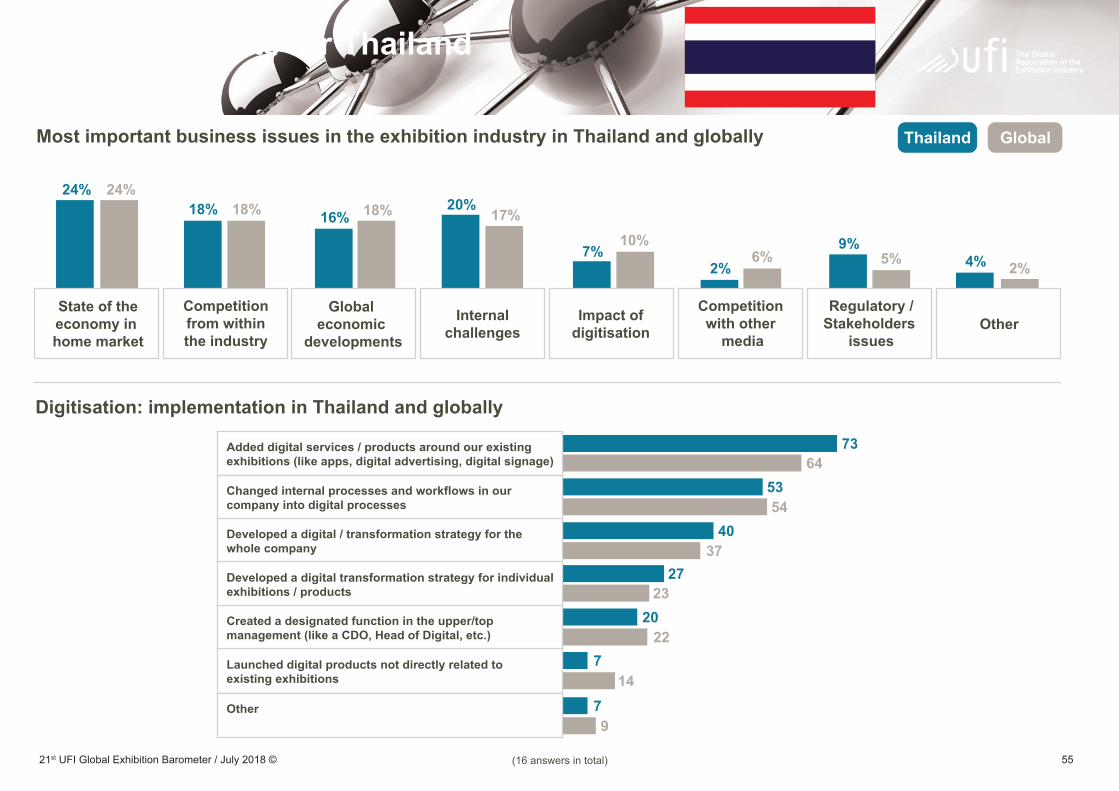
Detailed results for Thailand
7
Most important business issues in the exhibition industry in Thailand and globally
Digitisation: implementation in Thailand and globally
Thailand Global
7
20
6473
5354
4037
2327
22
14
9
Added digital services / products around our existingexhibitions (like apps, digital advertising, digital signage)
Changed internal processes and workflows in ourcompany into digital processes
Developed a digital / transformation strategy for thewhole company
Created a designated function in the upper/topmanagement (like a CDO, Head of Digital, etc.)
Launched digital products not directly related toexisting exhibitions
Other
24%24%18% 18%18% 20%
2%7% 4%
9%
16% 17%10%
6% 5% 2%
State of theeconomy in home market
Global economic
developments
Competitionfrom withinthe industry
Internalchallenges
Impact ofdigitisation
Competitionwith other
media
Regulatory /Stakeholders
issuesOther
Developed a digital transformation strategy for individualexhibitions / products
(16answersintotal)
5621st UFI Global Exhibition Barometer / July 2018 ©
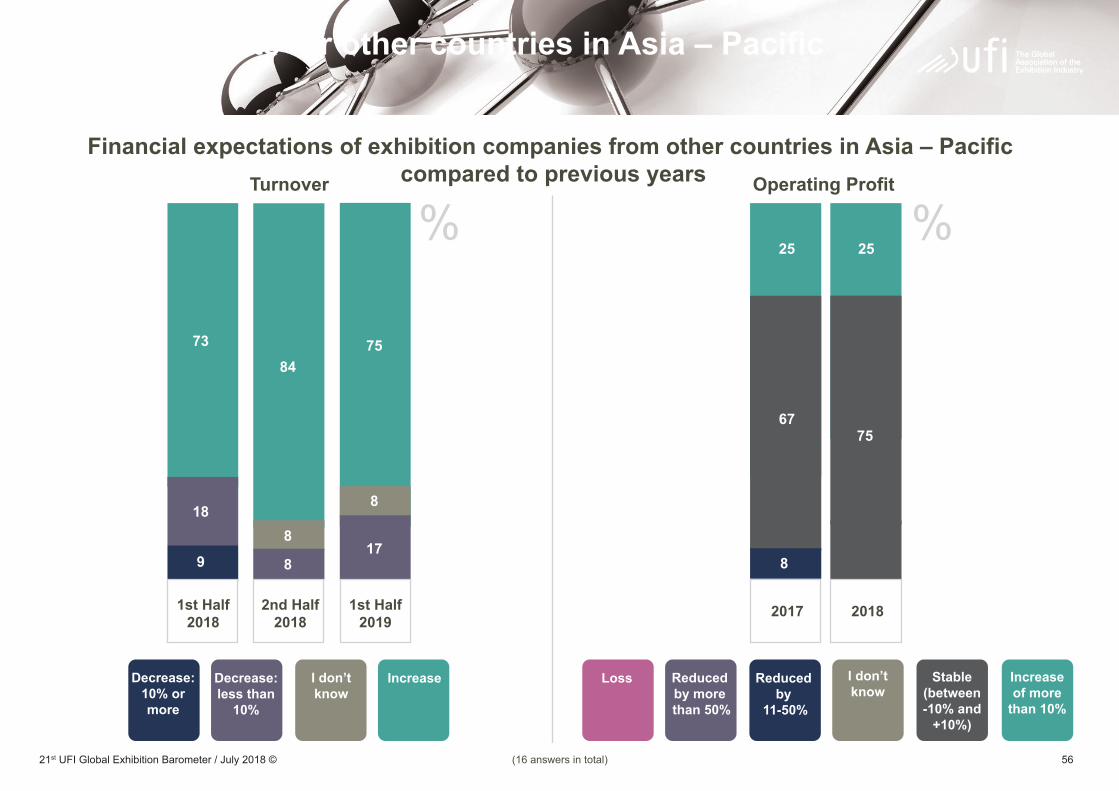
Detailed results for other countries in Asia – Pacific
25 25
67
9
18
73
Turnover Operating Profit
8
8
84
17
8
75
%%
8
75
Financial expectations of exhibition companies from other countries in Asia – Pacific compared to previous years
Increaseof more
than 10%
Stable(between-10% and
+10%)
I don’tknow
Reduced by
11-50%
Reduced by more than 50%
LossIncreaseDecrease:less than
10%
I don’tknow
Decrease:10% ormore
1st Half2018
2nd Half2018
1st Half2019
2017 2018
(16answersintotal)
5721st UFI Global Exhibition Barometer / July 2018 ©
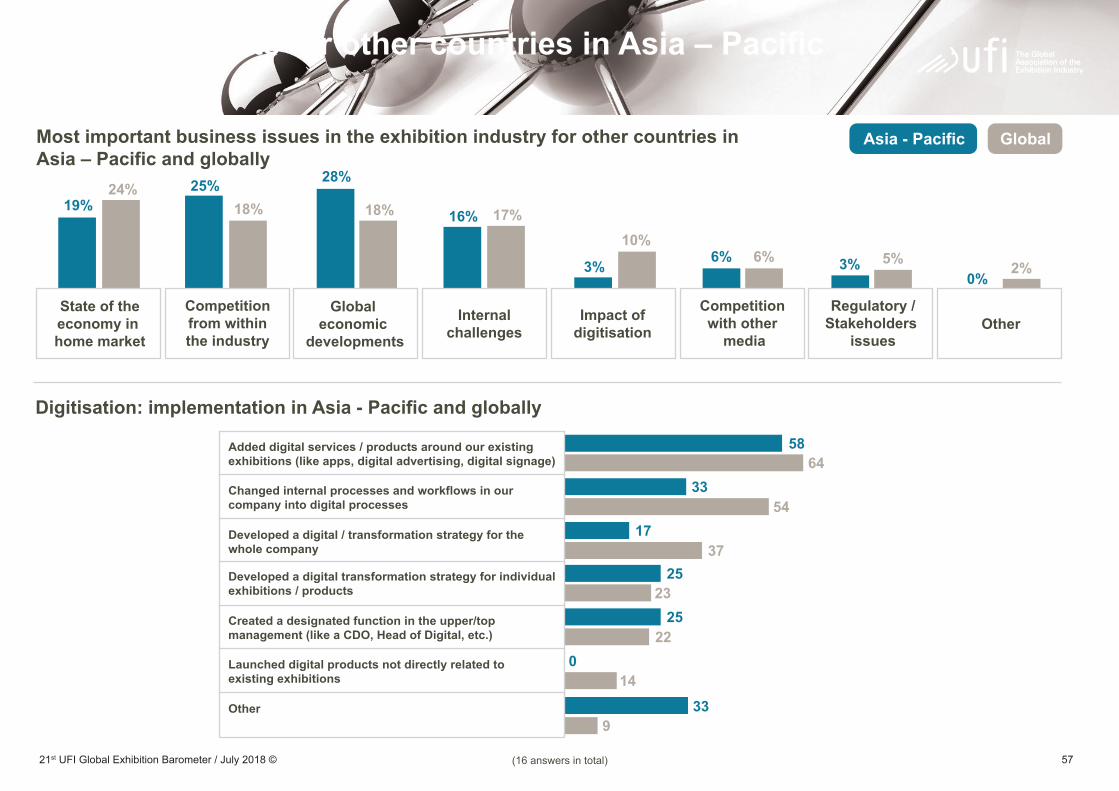
Detailed results for other countries in Asia – Pacific
25
Most important business issues in the exhibition industry for other countries in Asia – Pacific and globally
Digitisation: implementation in Asia - Pacific and globally
Asia - Pacific Global
33
0
6458
3354
1737
2325
22
14
9
Added digital services / products around our existingexhibitions (like apps, digital advertising, digital signage)
Changed internal processes and workflows in ourcompany into digital processes
Developed a digital / transformation strategy for thewhole company
Created a designated function in the upper/topmanagement (like a CDO, Head of Digital, etc.)
Launched digital products not directly related toexisting exhibitions
Other
25%19%
3%0%
3%
24%18% 18% 16%
28%
17%10%
6%6% 5% 2%
State of theeconomy in home market
Global economic
developments
Competitionfrom withinthe industry
Internalchallenges
Impact ofdigitisation
Competitionwith other
media
Regulatory /Stakeholders
issuesOther
Developed a digital transformation strategy for individualexhibitions / products
(16answersintotal)
5821st UFI Global Exhibition Barometer / July 2018 ©
Conclusion
• Finally, a majority of companies have responded to the accelerating process of digitisation in the exhibition industry. The two actions most frequently undertaken were “Added digital services/products around existing exhibitions (i.e.: apps, digital advertising, digital signage) and “Changedinternalprocessesandworkflowsinourcompanyintodigitalprocesses”withrespectively64%and54%ofrespondentshavingimplemented these actions. The “Digitisation Implementation Index” (DIX) aiming to show how far the industry has progressed towards a “full digitisation” reaches 32 globally (+1 compared to a year ago).
THANK YOU TO ALL SURVEY PARTICIPANTS FOR YOUR CONTRIBUTION!
THE NEXT GLOBAL BAROMETER SURVEY WILL BE CONDUCTED IN DECEMBER 2018 – PLEASE PARTICIPATE!
The Global Barometer survey has been measuring the pulse of the exhibition industry since 2008. The 21st survey, conducted in June 2018, was answered by a record number of 312 companies from 55 countries. The results are detailed for 18 geographical zones, including 14 major markets.
Survey results reveal very positive trends at different levels:
• Regardingturnover,forthefirsttimeintenyears,allfourglobalregionsreport a positive development simultaneously: Everywhere, the share of companies declaring an increase in turnover is going up, regarding the secondhalfof2018.Andforthefirsthalfof2019,thebarometerreportsthe highest ever share of positive expectations for Europe.
• Intermsofoperatingprofit,mostcompaniesmaintainedagoodlevelofperformance in 2017 and more than 40% of companies from all regions declaredanincreaseofmorethan10%comparedto2016.However,theperspectives for 2018 are currently lower globally, with a smaller share of companiesexpectingprofitincrease.
• When asked about their top business issues, the “state of the national/ regional economy” was considered most important, with 24% of all respondents naming this as a top business issue. “Competition from within the industry” was considered a top business issue by 18% of surveyrespondents,down3%comparedto6monthsago,andnowatthe same level as “Global economic developments” (up 2%). Regarding additional top issues, “Internal Challenges” and “Impact of digitisation” follow in the ranking.
5921st UFI Global Exhibition Barometer / July 2018 ©
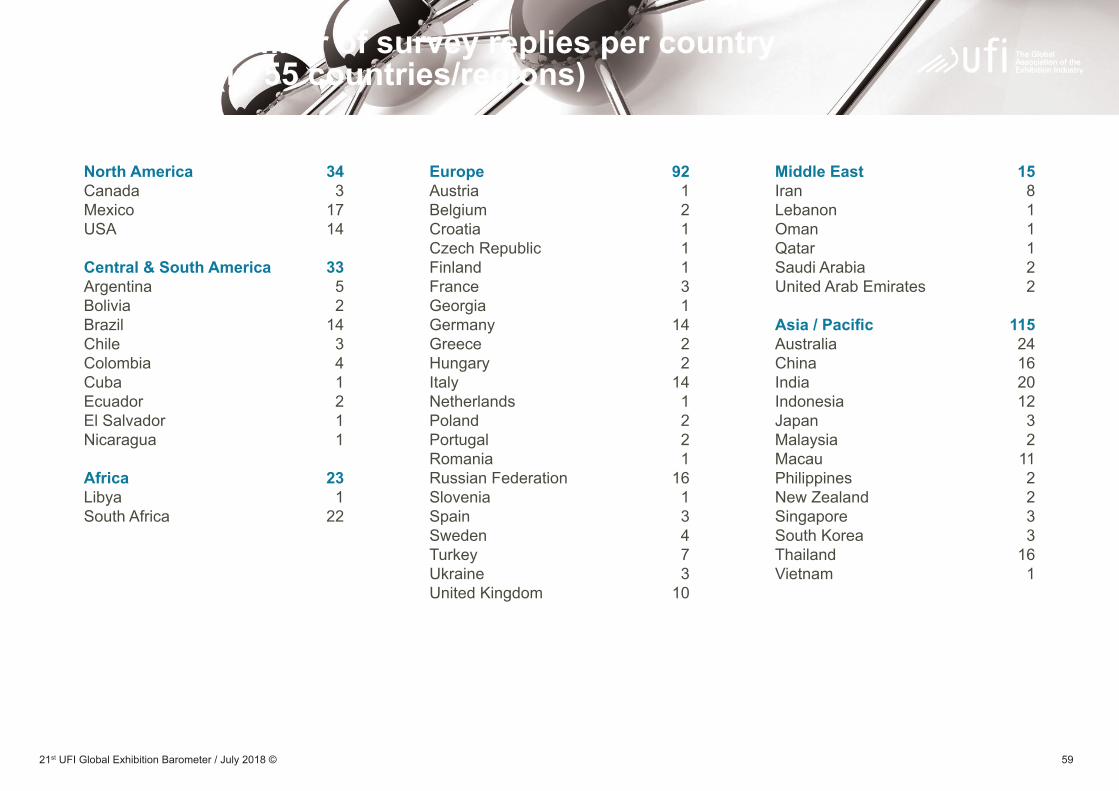
Appendix: Number of survey replies per country Total = 312 (in 55 countries/regions)
North America 34Canada 3Mexico 17USA 14
Central & South America 33Argentina 5Bolivia 2Brazil 14Chile 3Colombia 4Cuba 1Ecuador 2El Salvador 1Nicaragua 1
Africa 23Libya 1South Africa 22
Europe 92Austria 1Belgium 2Croatia 1Czech Republic 1Finland 1France 3Georgia 1Germany 14Greece 2Hungary 2Italy 14Netherlands 1Poland 2Portugal 2Romania 1RussianFederation 16Slovenia 1Spain 3Sweden 4Turkey 7Ukraine 3United Kingdom 10
Middle East 15Iran 8Lebanon 1Oman 1Qatar 1Saudi Arabia 2United Arab Emirates 2 Asia / Pacific 115Australia 24China 16India 20Indonesia 12Japan 3Malaysia 2Macau 11Philippines 2New Zealand 2Singapore 3South Korea 3Thailand 16Vietnam 1
web www.ufi.org
blog www.ufilive.org
@UFILive
www.facebook.com/ufilive
www.UFI.tv
www.linkedin.com/groups/4048434
UFI Official Account
UFI Diamond Sponsors
UFI Headquarters /European Office
17, rue Louise Michel 92300 Levallois-Perret France
T: +33 1 46 39 75 00 F: +33 1 46 39 75 01 [email protected]
UFI Asia/Pacific Regional Office
Suite 4114, Hong Kong Plaza 188 Connaught Road West Hong Kong, China
T: +852 2525 6129 F: +852 2525 6171 [email protected]
UFI Middle East/Africa Regional Office
Expo CentreSharjahUnited Arab Emirates
T / F: +971 6 5991352
UFI Latin American Regional Office
Corferias, Cra 37 # 24-67Auditorium Second FloorBogota, Colombia
T: +571 3445486