UCSB Employee Housing Surveybap.ucsb.edu/real.estate/2008.housing.survey.report.pdf · This report...
70
UCSB Employee Housing Survey Administered Spring 2008 Summary Report CHANCELLOR’S ADVISORY COMMITTEE FOR FACULTY AND STAFF HOUSING OFFICE OF INSTITUTIONAL RESEARCH AND PLANNING December 2008
Transcript of UCSB Employee Housing Surveybap.ucsb.edu/real.estate/2008.housing.survey.report.pdf · This report...

UCSB Employee Housing Survey Administered Spring 2008
Summary Report
CHANCELLOR’S ADVISORY COMMITTEE FOR FACULTY AND STAFF HOUSING OFFICE OF INSTITUTIONAL RESEARCH AND PLANNING
December 2008
UCSB EMPLOYEE HOUSING SURVEY – SPRING 2008 PAGE 2
Table of Contents
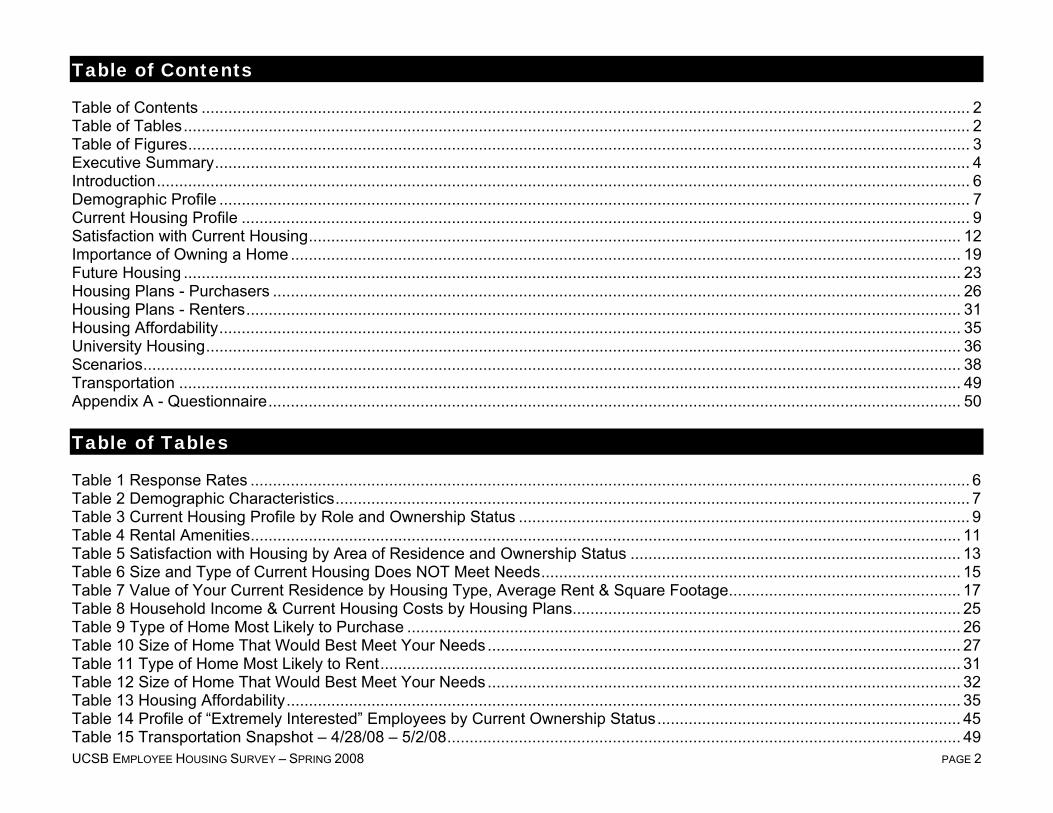
Table of Contents ............................................................................................................................................................................ 2 Table of Tables................................................................................................................................................................................ 2 Table of Figures............................................................................................................................................................................... 3 Executive Summary......................................................................................................................................................................... 4 Introduction...................................................................................................................................................................................... 6 Demographic Profile ........................................................................................................................................................................ 7 Current Housing Profile ................................................................................................................................................................... 9 Satisfaction with Current Housing.................................................................................................................................................. 12 Importance of Owning a Home ...................................................................................................................................................... 19 Future Housing .............................................................................................................................................................................. 23 Housing Plans - Purchasers .......................................................................................................................................................... 26 Housing Plans - Renters................................................................................................................................................................ 31 Housing Affordability...................................................................................................................................................................... 35 University Housing......................................................................................................................................................................... 36 Scenarios....................................................................................................................................................................................... 38 Transportation ............................................................................................................................................................................... 49 Appendix A - Questionnaire........................................................................................................................................................... 50 Table of Tables
Table 1 Response Rates ................................................................................................................................................................. 6 Table 2 Demographic Characteristics.............................................................................................................................................. 7 Table 3 Current Housing Profile by Role and Ownership Status ..................................................................................................... 9 Table 4 Rental Amenities............................................................................................................................................................... 11 Table 5 Satisfaction with Housing by Area of Residence and Ownership Status .......................................................................... 13 Table 6 Size and Type of Current Housing Does NOT Meet Needs.............................................................................................. 15 Table 7 Value of Your Current Residence by Housing Type, Average Rent & Square Footage.................................................... 17 Table 8 Household Income & Current Housing Costs by Housing Plans....................................................................................... 25 Table 9 Type of Home Most Likely to Purchase ............................................................................................................................ 26 Table 10 Size of Home That Would Best Meet Your Needs.......................................................................................................... 27 Table 11 Type of Home Most Likely to Rent.................................................................................................................................. 31 Table 12 Size of Home That Would Best Meet Your Needs.......................................................................................................... 32 Table 13 Housing Affordability....................................................................................................................................................... 35 Table 14 Profile of “Extremely Interested” Employees by Current Ownership Status.................................................................... 45 Table 15 Transportation Snapshot – 4/28/08 – 5/2/08................................................................................................................... 49
UCSB EMPLOYEE HOUSING SURVEY – SPRING 2008 PAGE 3
Table of Figures
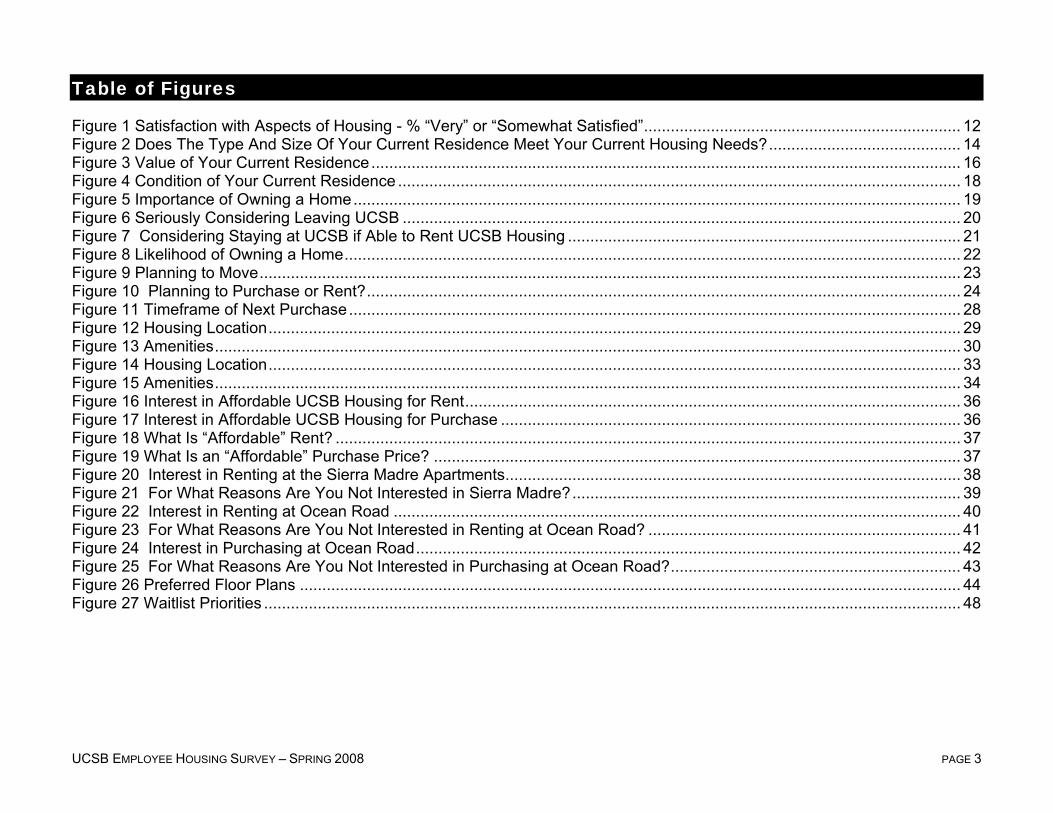
Figure 1 Satisfaction with Aspects of Housing - % “Very” or “Somewhat Satisfied”....................................................................... 12 Figure 2 Does The Type And Size Of Your Current Residence Meet Your Current Housing Needs?........................................... 14 Figure 3 Value of Your Current Residence.................................................................................................................................... 16 Figure 4 Condition of Your Current Residence .............................................................................................................................. 18 Figure 5 Importance of Owning a Home........................................................................................................................................ 19 Figure 6 Seriously Considering Leaving UCSB ............................................................................................................................. 20 Figure 7 Considering Staying at UCSB if Able to Rent UCSB Housing ........................................................................................ 21 Figure 8 Likelihood of Owning a Home.......................................................................................................................................... 22 Figure 9 Planning to Move............................................................................................................................................................. 23 Figure 10 Planning to Purchase or Rent?..................................................................................................................................... 24 Figure 11 Timeframe of Next Purchase......................................................................................................................................... 28 Figure 12 Housing Location........................................................................................................................................................... 29 Figure 13 Amenities....................................................................................................................................................................... 30 Figure 14 Housing Location........................................................................................................................................................... 33 Figure 15 Amenities....................................................................................................................................................................... 34 Figure 16 Interest in Affordable UCSB Housing for Rent............................................................................................................... 36 Figure 17 Interest in Affordable UCSB Housing for Purchase ....................................................................................................... 36 Figure 18 What Is “Affordable” Rent? ............................................................................................................................................ 37 Figure 19 What Is an “Affordable” Purchase Price? ...................................................................................................................... 37 Figure 20 Interest in Renting at the Sierra Madre Apartments...................................................................................................... 38 Figure 21 For What Reasons Are You Not Interested in Sierra Madre?....................................................................................... 39 Figure 22 Interest in Renting at Ocean Road ............................................................................................................................... 40 Figure 23 For What Reasons Are You Not Interested in Renting at Ocean Road? ...................................................................... 41 Figure 24 Interest in Purchasing at Ocean Road.......................................................................................................................... 42 Figure 25 For What Reasons Are You Not Interested in Purchasing at Ocean Road?................................................................. 43 Figure 26 Preferred Floor Plans .................................................................................................................................................... 44 Figure 27 Waitlist Priorities ............................................................................................................................................................ 48
UCSB EMPLOYEE HOUSING SURVEY – SPRING 2008 PAGE 4
Executive Summary
This report summarizes the results of the UCSB Employee Housing Survey conducted in Spring quarter 2008. The survey, sent to all non-student UCSB employees, asked a host of questions related to current housing situation, satisfaction with housing, plans for future housing, and transportation related matters. While there is still much to be learned from the data collected, analyses conducted thus far reveal the following general findings: • Survey Participation - 4,575 faculty and staff received surveys via e-mail or hard copy and 1,864 responses were
received. The response rate of 41% is considered very strong and provides confidence that the respondents are likely representative of the population of UCSB employees.
• Home Ownership - Half of all employees surveyed currently own their residence. Home ownership is more common
among faculty (75%) than staff (45%). Homeownership has declined since the 2006 survey among both faculty and staff – 83% of faculty and 50% of staff owned a home in 2006. Home ownership is considered important by 84% of employees who rent or lease their current residence, and more than half indicate home ownership is “extremely” important. All renters were also asked how likely it is that they will be able to purchase a home while employed at UCSB. Only 13% of current renters believe it’s likely that they will own a home.
• Satisfaction - 63% of all respondents are satisfied with their current housing situation overall. Satisfaction has declined
slightly since the 2006 survey, when two-thirds (66%) were satisfied with their current housing situation. Two-thirds (66%) indicate that the type and size of their current residence meets their current housing needs. Owners more clearly have their housing needs met than renters – 76% of faculty owners and 83% of staff owners say the type and size of their residence meets their needs, compared to 26% of faculty renters and 52% of staff renters. Renters were also asked how they would describe the value of their current residence for the price they are paying, and 37% believe their residence is an “above average” or “excellent” value. However, a sizeable proportion (21% of staff and 27% of faculty) believes the value of their rental is “below average” or “poor”.
• Retention - 55% of the employees who rent or lease their current residence would seriously consider leaving UCSB if they
are unable to purchase a home in the area. 81% of renters who are “definitely” considering leaving their jobs at UCSB if they are unable to purchase a home also believe they will be unlikely to do so. This translates into one out of five renters (21%), or one out of ten employees (10%), who will possibly leave the University due to the lack of affordable housing.
• Demand By Current Employees - Seven out of ten employees responding to the survey are considering moving to a
different home within 5 years (40% “yes” and 30% “maybe”). Most of the current renters responding to the survey are considering such a move (65% “yes” and 28% “maybe”). Three-fourths of current renters express interest in renting below-market-rate housing provided by UCSB. Interest in purchasing housing provided by UCSB is also high – 79% of potential buyers express interest in this option.
UCSB EMPLOYEE HOUSING SURVEY – SPRING 2008 PAGE 5
• Affordability - The average current monthly housing cost (rent + utilities) among renters who plan to purchase a home is
$1,950, which is about 29% of their gross monthly income. The majority of those who are interested in purchasing University housing would say that an “affordable” purchase price is 30% or 40% below market value. The median home price current renters are looking to purchase is about $411,000, and they believe the maximum average monthly housing cost they can afford is $2,000 per month. Those who plan to rent a new home within 5 years currently pay an average of $1,740 in monthly housing costs, which is about 38% of their gross monthly income. The majority of employees who are interested in renting housing provided by UCSB believe that “affordable” monthly rent is either 20% or 30% below market rate.
• Scenarios - In addition to the faculty housing currently being developed at North Campus, the University is in the planning
phase for building both for-sale and rental housing for UCSB employees. Survey respondents were asked to consider two potential scenarios – 1) Sierra Madre and 2) Ocean Road – to help in the planning of these future housing developments.
• Seven out of ten (70%) staff renters who expressed general interest in renting University Housing are interested in renting a unit in the Sierra Madre development. Faculty renters are much less likely to be interested in the Sierra Madre Apartments (33% interested).
• There is somewhat less interest in renting at the Ocean Road development than Sierra Madre. About two-thirds (65%) of staff renters who expressed interested in renting University housing are interested in renting a unit in the Ocean Road housing community. Again, faculty are much less interested (23% interested).
• 53% of current renters who are generally interested in purchasing University housing express a particular interest in purchasing at Ocean Road – with staff showing more interest than faculty (55% vs. 29% interested).
• Only 18% of current renters who initially expressed an interest in housing provided by UCSB do not find any of the particular scenarios presented in the survey to be attractive.
• Transportation - The typical UCSB employee commutes about 21 minutes to get to work and lives approximately 14 miles
from campus. A snapshot was taken of employee commute patterns during a specific week in time (4/28/08 – 5/2/08). While the largest number of respondents drive alone to get to campus (between 49% and 55%, depending on the day), over one-third use alternative transportation on a weekly basis – 12% to 13% carpool, 2% to 3% ride the vanpool, between 9% and 10% ride their bike, and 6% to 7% take the bus.
UCSB EMPLOYEE HOUSING SURVEY – SPRING 2008 PAGE 6
Introduction
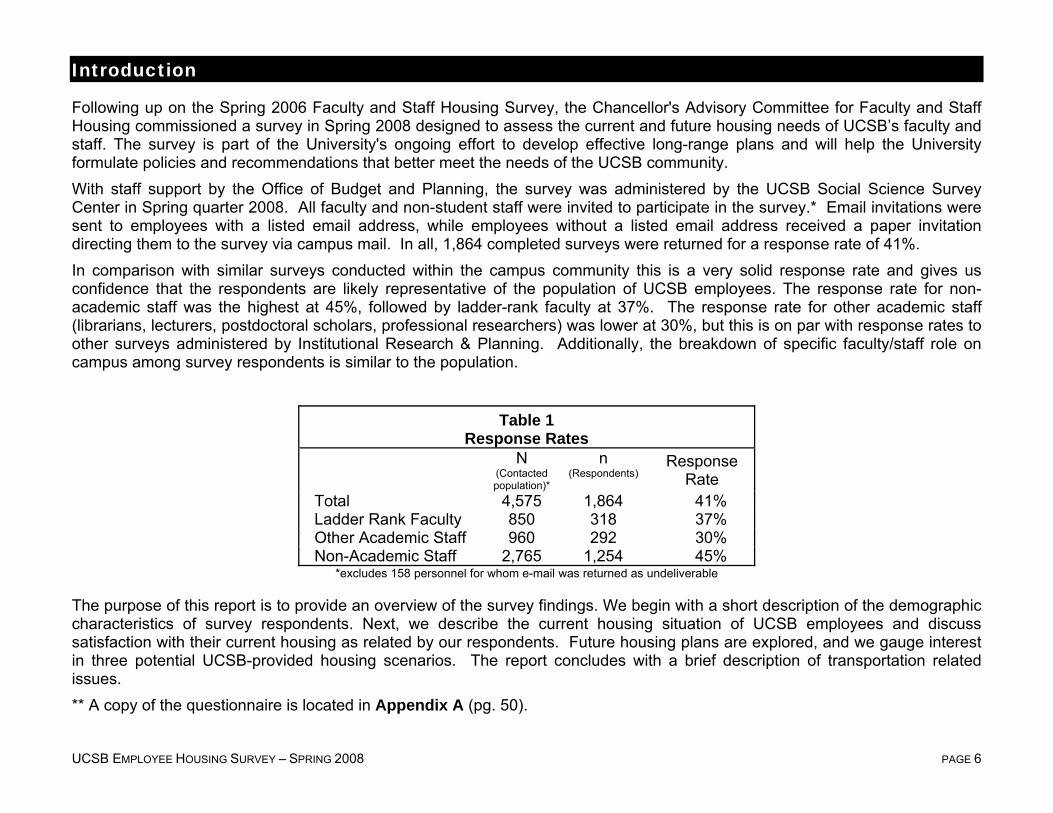
Following up on the Spring 2006 Faculty and Staff Housing Survey, the Chancellor's Advisory Committee for Faculty and Staff Housing commissioned a survey in Spring 2008 designed to assess the current and future housing needs of UCSB’s faculty and staff. The survey is part of the University's ongoing effort to develop effective long-range plans and will help the University formulate policies and recommendations that better meet the needs of the UCSB community. With staff support by the Office of Budget and Planning, the survey was administered by the UCSB Social Science Survey Center in Spring quarter 2008. All faculty and non-student staff were invited to participate in the survey.* Email invitations were sent to employees with a listed email address, while employees without a listed email address received a paper invitation directing them to the survey via campus mail. In all, 1,864 completed surveys were returned for a response rate of 41%. In comparison with similar surveys conducted within the campus community this is a very solid response rate and gives us confidence that the respondents are likely representative of the population of UCSB employees. The response rate for non-academic staff was the highest at 45%, followed by ladder-rank faculty at 37%. The response rate for other academic staff (librarians, lecturers, postdoctoral scholars, professional researchers) was lower at 30%, but this is on par with response rates to other surveys administered by Institutional Research & Planning. Additionally, the breakdown of specific faculty/staff role on campus among survey respondents is similar to the population.
Table 1 Response Rates
N (Contacted population)*
n (Respondents) Response
Rate Total 4,575 1,864 41% Ladder Rank Faculty 850 318 37% Other Academic Staff 960 292 30% Non-Academic Staff 2,765 1,254 45%
*excludes 158 personnel for whom e-mail was returned as undeliverable
The purpose of this report is to provide an overview of the survey findings. We begin with a short description of the demographic characteristics of survey respondents. Next, we describe the current housing situation of UCSB employees and discuss satisfaction with their current housing as related by our respondents. Future housing plans are explored, and we gauge interest in three potential UCSB-provided housing scenarios. The report concludes with a brief description of transportation related issues. ** A copy of the questionnaire is located in Appendix A (pg. 50).

UCSB EMPLOYEE HOUSING SURVEY – SPRING 2008 PAGE 7
Demographic Profile
The following represents a demographic profile of the faculty and staff who responded to the survey:
Table 2 Demographic Characteristics
Total (n = 1,864)
Faculty (n = 318)
Staff (n = 1,539)
Total (n = 1,864)
Faculty (n = 318)
Staff (n = 1,539)
Role on Campus Gender Ladder Rank Faculty 17% 100% Male 45% 68% 40%
Professor/Dean 10% 60% Female 55% 32% 60% Associate Professor 3% 20% Assistant Professor 4% 20% Average Age 44.6 50.4 43.3
Other Academic Staff 16% 19% Instructor/Lecturer 5% 6% Children under 18 31% 40% 29% Librarian 2% 2% Researcher 3% 3% Household Income Status Post-doctoral 4% 5% Single Income, no Partner 33% 16% 36% Other academic staff 2% 2% Single Income, with Partner 15% 29% 12%
Non-Academic Staff 67% 81% Dual Income, with Partner 53% 55% 52% MSP / SMG 13% 16% Spouse Employed by UCSB 17% 26% 15% Professional / Support staff 33% 40% Staff represented by a union 20% 25% Avg. Personal Income $65.2K $115K $54.7KOther non-academic staff 1% 1% Avg. Household Income $96.4K $154K $84.3K
Employment Status Avg. Yrs. Planned to Continue
Full-time 90% 95% 89% at UCSB 9.2 11.6 8.7 Part-time 10% 5% 11% Plan on 1-5 more yrs 29% 15% 32%
Plan on 6-15 more yrs 32% 33% 32% Avg. Yrs. Employed at UCSB 11.1 15.0 10.3 Plan on >15 more yrs 19% 31% 17%
Employed at UCSB <=3 yrs 29% 15% 32% Don’t Know 20% 22% 20% Bold numbers indicate statistically significant differences between Faculty and Staff.
UCSB EMPLOYEE HOUSING SURVEY – SPRING 2008 PAGE 8
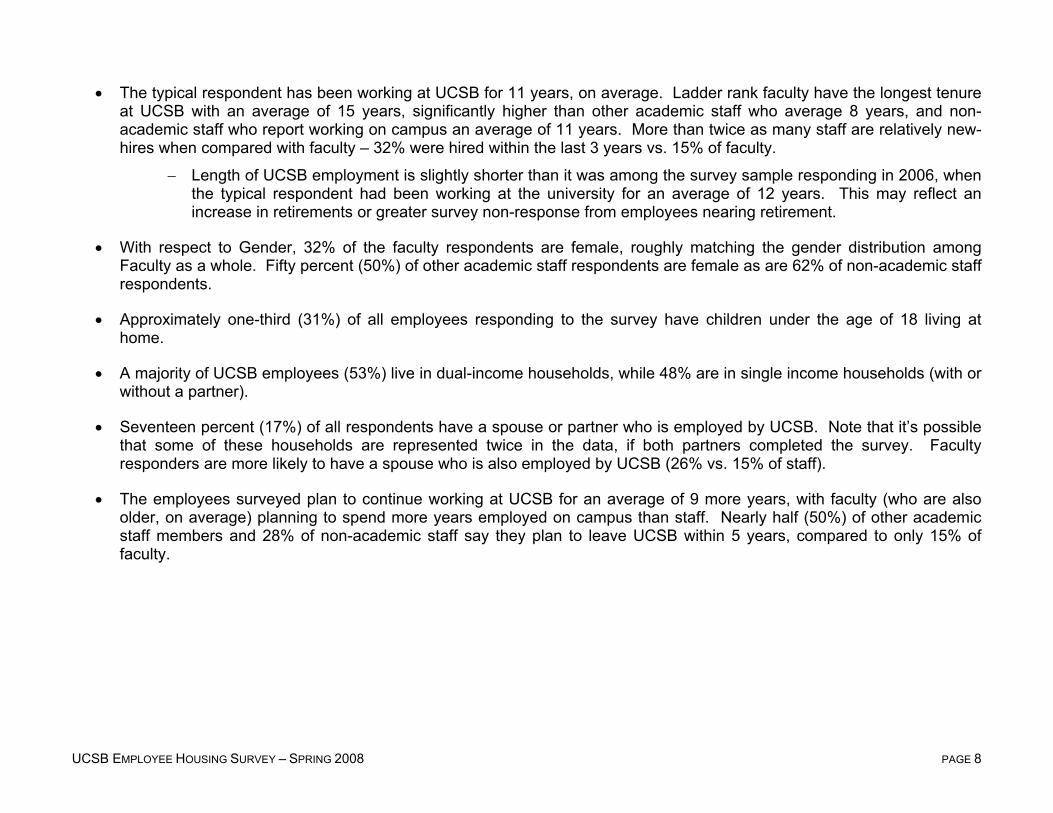
• The typical respondent has been working at UCSB for 11 years, on average. Ladder rank faculty have the longest tenure at UCSB with an average of 15 years, significantly higher than other academic staff who average 8 years, and non-academic staff who report working on campus an average of 11 years. More than twice as many staff are relatively new-hires when compared with faculty – 32% were hired within the last 3 years vs. 15% of faculty.
− Length of UCSB employment is slightly shorter than it was among the survey sample responding in 2006, when the typical respondent had been working at the university for an average of 12 years. This may reflect an increase in retirements or greater survey non-response from employees nearing retirement.
• With respect to Gender, 32% of the faculty respondents are female, roughly matching the gender distribution among Faculty as a whole. Fifty percent (50%) of other academic staff respondents are female as are 62% of non-academic staff respondents.
• Approximately one-third (31%) of all employees responding to the survey have children under the age of 18 living at home.
• A majority of UCSB employees (53%) live in dual-income households, while 48% are in single income households (with or without a partner).
• Seventeen percent (17%) of all respondents have a spouse or partner who is employed by UCSB. Note that it’s possible that some of these households are represented twice in the data, if both partners completed the survey. Faculty responders are more likely to have a spouse who is also employed by UCSB (26% vs. 15% of staff).
• The employees surveyed plan to continue working at UCSB for an average of 9 more years, with faculty (who are also older, on average) planning to spend more years employed on campus than staff. Nearly half (50%) of other academic staff members and 28% of non-academic staff say they plan to leave UCSB within 5 years, compared to only 15% of faculty.

UCSB EMPLOYEE HOUSING SURVEY – SPRING 2008 PAGE 9
Current Housing Profile The following table presents a profile of the current housing situation among UCSB faculty and staff shown by those who own their current residence (50% of respondents) and those in a rental or lease arrangement (47% of respondents).
• Three-fourths (75%) of faculty own their residence, compared with 45% of staff. Homeownership has declined since the 2006 survey among both faculty and staff – 83% of faculty and 50% of staff owned a home in 2006.
Table 3 Current Housing Profile by Role and Ownership Status
Overall* Owners (50%) Renters (47%) Total
(n = 1,864) Faculty
(n = 325) Staff
(n = 1,539) Total
(n = 941) Faculty
(n = 245) Staff
(n = 696) Total
(n = 874) Faculty (n = 74)
Staff (n = 800)
Housing Type
Single-Family Home 51% 62% 48% 77% 77% 77% 23% 18% 23% Apt./Condo/Townhouse 40% 34% 41% 21% 21% 20% 62% 78% 60% Other 10% 3% 11% 2% 2% 3% 16% 4% 17%
Avg. # of Bedrooms 2.6 3.0 2.5 3.1 3.2 3.1 2.1 2.2 2.1 Avg. # of Bathrooms 1.8 2.1 1.7 2.1 2.3 2.0 1.5 1.6 1.4 Median Sq. Footage 1,250 1,700 1,200 1,650 1,900 1,500 900 1,000 900
Under 1,000 sq. ft. 36% 18% 40% 12% 7% 14% 65% 53% 66% Under 800 sq. ft. 21% 7% 24% 4% 3% 5% 42% 22% 44%
Avg. # of Household Members 2.6 2.7 2.6 2.7 2.7 2.7 2.5 2.5 2.5 % With Kids 31% 40% 29% 36% 38% 35% 26% 46% 24%
Avg. Monthly Mortgage/Rent (Personal Share)
$2144 $2753 $2014 $2632 $3034 $2488 $1631 ($1277)
$1846 ($1811)
$1611 ($1228)
Avg. Monthly Utility Costs $259 $298 $251 $299 $326 $291 $219 $221 $219 Avg. yrs. in Current Home 8.4 10.2 8.0 12.3 12.2 12.4 4.0 3.7 4.0 Avg. yrs. on Central Coast 18.7 14.9 19.5 24.1 17.8 26.3 12.6 5.4 13.3
Area of Residence 93117, 93111 42% 47% 41% 40% 43% 39% 45% 56% 44%
Other Santa Barbara 41% 46% 41% 40% 50% 36% 44% 36% 45% North of Goleta 9% 1% 10% 12% 1% 16% 5% 1% 5%
South of Santa Barbara 6% 3% 6% 7% 4% 8% 4% 3% 5% *”Overall” columns include a small number of employees (3%) indicating non-ownership, non-rental or lease living arrangements.

UCSB EMPLOYEE HOUSING SURVEY – SPRING 2008 PAGE 10
• The most common type of housing among UCSB employees is a single-family home (51%). Forty percent (40%) live in an apartment, condo, or townhouse, and one out of ten (10%) lives in another type of housing, such as a mobile home, studio, or a single room or guesthouse. Homeowners are most likely to reside in a single-family home (77%), while the largest proportion of renters (46%) live in an apartment (another 16% of renters live in a condo or a townhouse).
• The typical employee lives in a 3-bedroom, 2-bathroom residence that is approximately 1,400 square feet. Owners have larger homes, averaging about 1,760 square feet, while renters live in 975 square feet, on average. Forty-two percent (42%) of renters live in homes that are under 800 square feet, compared to only 4% of owners. Staff renters (44%) are more likely than faculty renters (22%) to have homes under 800 square feet.
• The typical employee household size is 2 adults with no children. However, 31% do have children, with faculty renters being the most likely to have children at home (46%). Seventeen percent (17%) of employees live alone.
• Homeowners pay $2,632 per month, on average, in housing costs, while those in rental or lease arrangements pay approximately $1,631 in rent for their entire household or a personal share of $1,277. Reported housing costs have increased only slightly (not significantly) since the 2006 survey when owners paid an average of $2,520 monthly, and renters paid approximately $1,600. Utilities cost employees an average of $259 per month, similar to $253 in 2006.
• Employees have lived in their current residences for 8 years, on average. They have lived in the Central Coast area for an average of 19 years. One-third (34%) of owners purchased their homes within the last 6 years. However, over half (55%) have lived in the area for more than 20 years.
• Forty-two percent (42%) of employees live within the 93117 or 93111 zip codes. Another 41% live in other areas of Santa Barbara or Goleta. Nine percent (9%) live north of Goleta – with 3% in Lompoc, 3% in the Santa Ynez Valley, 2% in Santa Maria, and 1% in San Luis Obispo or further north. Six percent (6%) live south of Santa Barbara – with 2% in Carpinteria, and 4% in Ventura, Oxnard, Camarillo, Santa Paula, or further South. Two percent (2%) live outside the Central Coast area.
− Homeownership is more common in the areas north and south of Santa Barbara – 68% of employees who live north of Goleta and 59% of those who live south of Santa Barbara own their current homes vs. 48% of those who live within the Santa Barbara area. Staff homeowners are more likely than faculty homeowners to own outside of the Santa Barbara area.

UCSB EMPLOYEE HOUSING SURVEY – SPRING 2008 PAGE 11
The survey gathered information on the types of amenities employees have available in their current residence.
• While the majority of current renters have a stove, refrigerator, garbage disposal, private bathroom, and live within walking distance to a bus line, over one-third (36%) have neither laundry in-unit nor washer/dryer hookups, and nearly half (48%) have neither a garage nor additional storage space. Only 38% of rentals allow pets.
− Faculty renters are more likely than staff renters to have some of the basics, such as a stove and dishwasher. Because more faculty renters than staff renters live in apartments or condos, they are also more likely to have a swimming pool, clubhouse, gym, carport, and private patio/balcony. Staff renters, on the other hand, are more likely to be renting a single-family house, and are therefore more likely than faculty renters to have a private yard or pets allowed.
Table 4 Amenities
Base = All Respondents (n=1,864) Renters Owners Renters Owners
Stove 95% n/a Private Yard 35% 82% Refrigerator 92% n/a Garage 33% 82% Private Bathroom 76% n/a Carport 32% 18% Walking Distance to Bus Line 64% 60% Additional Storage Space 29% 39% Garbage Disposal 64% n/a Washer/Dryer Hook-ups 29% n/a
Private Patio/Balcony 49% 73% Fireplace 28% 78% Dishwasher 47% n/a Swimming Pool 21% 24% Washer/Dryer In-Unit 46% n/a Clubhouse 11% 8% Pets Allowed 38% 84% Gym 8% 4%
• As would be expected, homeowners are more likely than renters to have amenities like a garage (82%), a private yard (82%), and a fireplace (78%).
• Available amenities are related to overall satisfaction with housing. Dissatisfied renters are less likely to have a fireplace, a garbage disposal, additional storage space, a garage, at least some form of laundry (in-unit or hookups), a private yard, or a policy that allows pets. Similarly, dissatisfied owners are less likely to have a fireplace, additional storage space, a garage, a private yard, or a private patio/balcony. Note, however, that amenities also vary by type of housing, and satisfaction is greatest among those in single-family homes where these amenities are more likely to be available.
UCSB EMPLOYEE HOUSING SURVEY – SPRING 2008 PAGE 12
Satisfaction with Current Housing
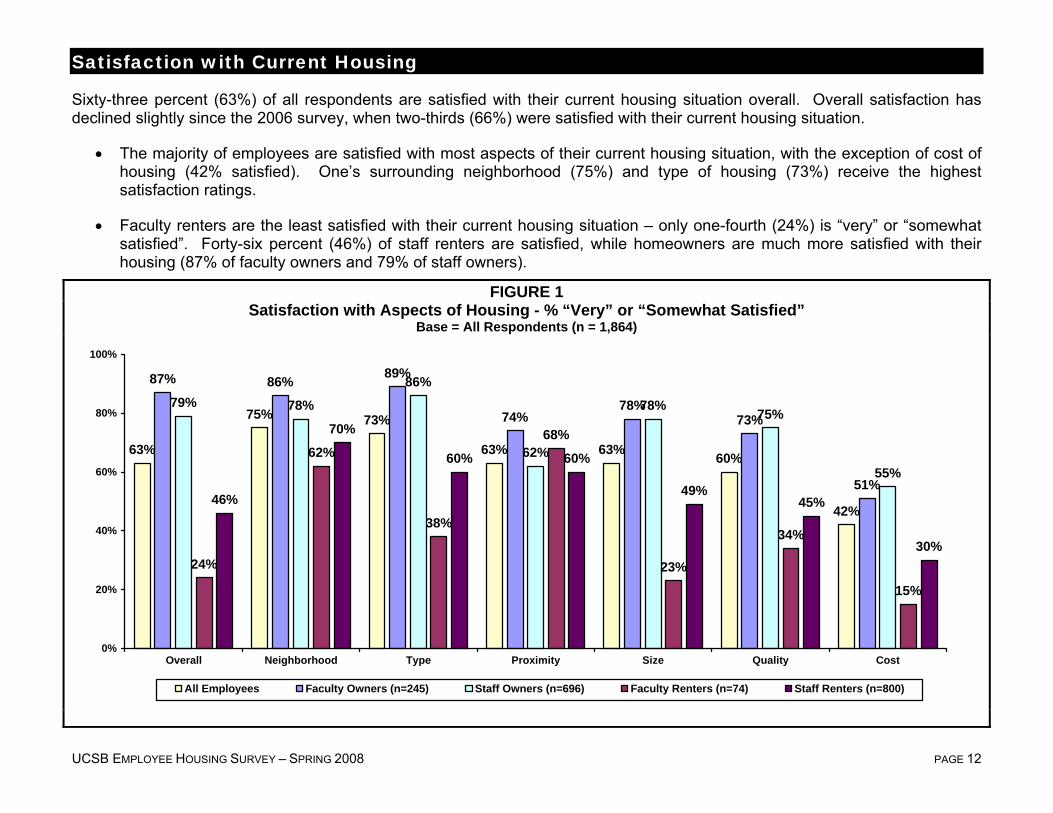
Sixty-three percent (63%) of all respondents are satisfied with their current housing situation overall. Overall satisfaction has declined slightly since the 2006 survey, when two-thirds (66%) were satisfied with their current housing situation.
• The majority of employees are satisfied with most aspects of their current housing situation, with the exception of cost of housing (42% satisfied). One’s surrounding neighborhood (75%) and type of housing (73%) receive the highest satisfaction ratings.
• Faculty renters are the least satisfied with their current housing situation – only one-fourth (24%) is “very” or “somewhat satisfied”. Forty-six percent (46%) of staff renters are satisfied, while homeowners are much more satisfied with their housing (87% of faculty owners and 79% of staff owners).
FIGURE 1 Satisfaction with Aspects of Housing - % “Very” or “Somewhat Satisfied”
Base = All Respondents (n = 1,864)
63%
75% 73%
63% 63% 60%
42%
87% 86% 89%
74%78%
73%
51%
79% 78%
86%
62%
78% 75%
55%
24%
62%
38%
68%
23%
34%
15%
46%
70%
60% 60%
49%45%
30%
0%
20%
40%
60%
80%
100%
Overall Neighborhood Type Proximity Size Quality Cost
All Employees Faculty Owners (n=245) Staff Owners (n=696) Faculty Renters (n=74) Staff Renters (n=800)
UCSB EMPLOYEE HOUSING SURVEY – SPRING 2008 PAGE 13
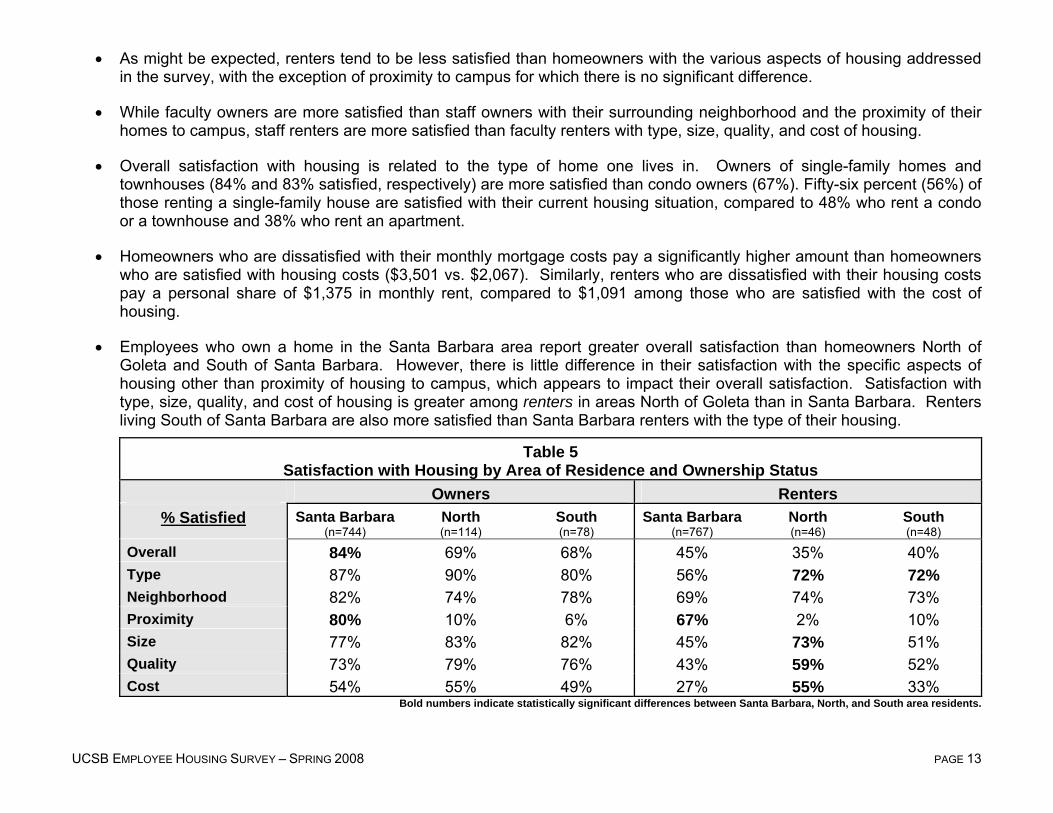
• As might be expected, renters tend to be less satisfied than homeowners with the various aspects of housing addressed in the survey, with the exception of proximity to campus for which there is no significant difference.
• While faculty owners are more satisfied than staff owners with their surrounding neighborhood and the proximity of their homes to campus, staff renters are more satisfied than faculty renters with type, size, quality, and cost of housing.
• Overall satisfaction with housing is related to the type of home one lives in. Owners of single-family homes and townhouses (84% and 83% satisfied, respectively) are more satisfied than condo owners (67%). Fifty-six percent (56%) of those renting a single-family house are satisfied with their current housing situation, compared to 48% who rent a condo or a townhouse and 38% who rent an apartment.
• Homeowners who are dissatisfied with their monthly mortgage costs pay a significantly higher amount than homeowners who are satisfied with housing costs ($3,501 vs. $2,067). Similarly, renters who are dissatisfied with their housing costs pay a personal share of $1,375 in monthly rent, compared to $1,091 among those who are satisfied with the cost of housing.
• Employees who own a home in the Santa Barbara area report greater overall satisfaction than homeowners North of Goleta and South of Santa Barbara. However, there is little difference in their satisfaction with the specific aspects of housing other than proximity of housing to campus, which appears to impact their overall satisfaction. Satisfaction with type, size, quality, and cost of housing is greater among renters in areas North of Goleta than in Santa Barbara. Renters living South of Santa Barbara are also more satisfied than Santa Barbara renters with the type of their housing.
Table 5 Satisfaction with Housing by Area of Residence and Ownership Status
Owners Renters % Satisfied Santa Barbara
(n=744) North (n=114)
South (n=78)
Santa Barbara(n=767)
North (n=46)
South (n=48)
Overall 84% 69% 68% 45% 35% 40% Type 87% 90% 80% 56% 72% 72% Neighborhood 82% 74% 78% 69% 74% 73% Proximity 80% 10% 6% 67% 2% 10% Size 77% 83% 82% 45% 73% 51% Quality 73% 79% 76% 43% 59% 52% Cost 54% 55% 49% 27% 55% 33%
Bold numbers indicate statistically significant differences between Santa Barbara, North, and South area residents.
UCSB EMPLOYEE HOUSING SURVEY – SPRING 2008 PAGE 14
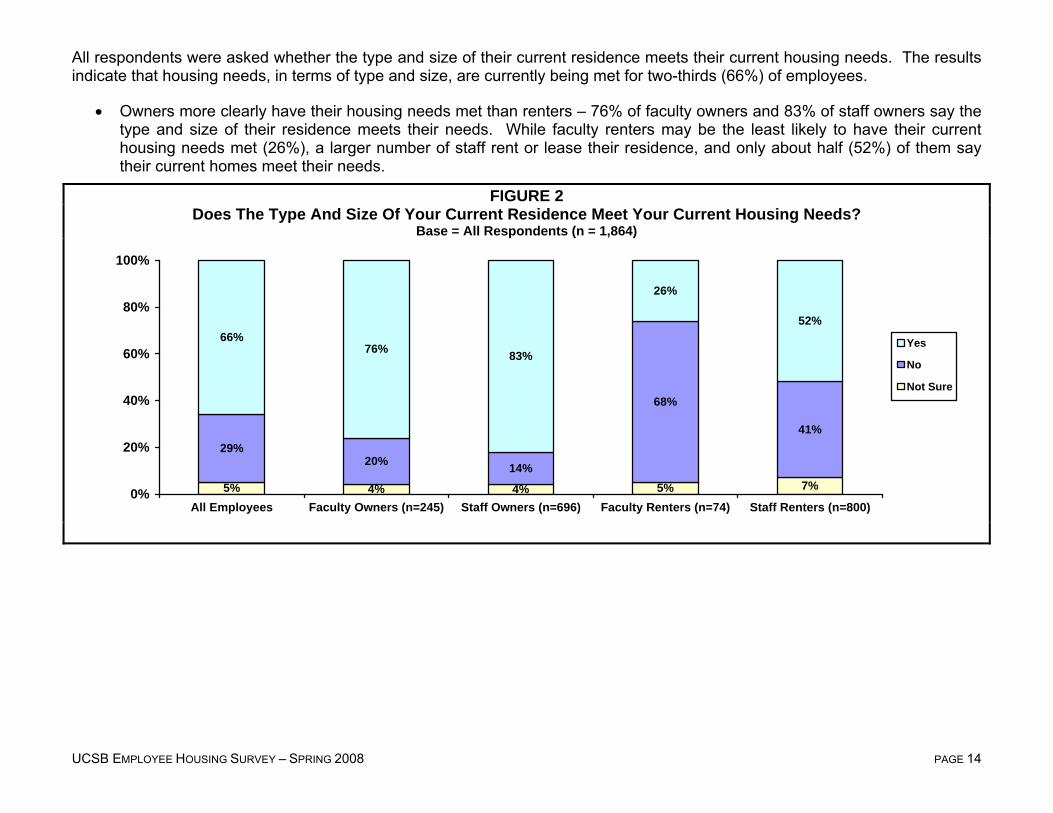
All respondents were asked whether the type and size of their current residence meets their current housing needs. The results indicate that housing needs, in terms of type and size, are currently being met for two-thirds (66%) of employees.
• Owners more clearly have their housing needs met than renters – 76% of faculty owners and 83% of staff owners say the type and size of their residence meets their needs. While faculty renters may be the least likely to have their current housing needs met (26%), a larger number of staff rent or lease their residence, and only about half (52%) of them say their current homes meet their needs.
FIGURE 2 Does The Type And Size Of Your Current Residence Meet Your Current Housing Needs?
Base = All Respondents (n = 1,864)
5% 4% 4% 5% 7%
29%20% 14%
68%
41%
66%76% 83%
26%
52%
0%
20%
40%
60%
80%
100%
All Employees Faculty Owners (n=245) Staff Owners (n=696) Faculty Renters (n=74) Staff Renters (n=800)
Yes
No
Not Sure
UCSB EMPLOYEE HOUSING SURVEY – SPRING 2008 PAGE 15
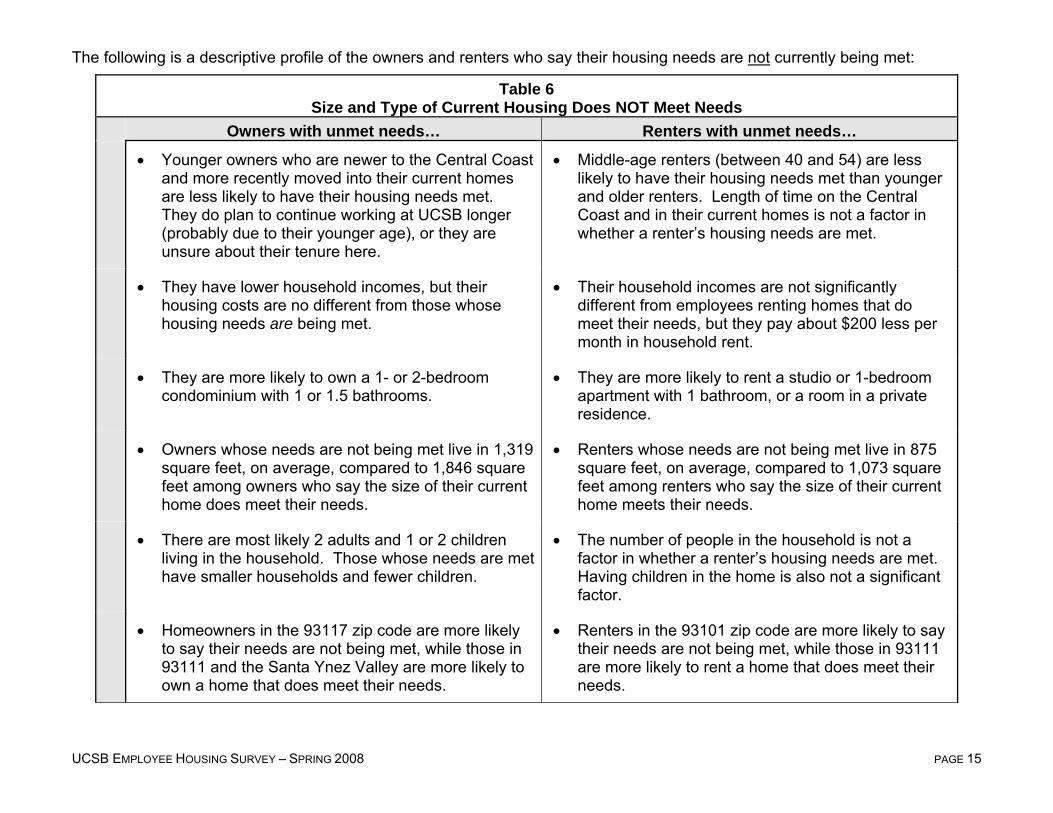
The following is a descriptive profile of the owners and renters who say their housing needs are not currently being met:
Table 6 Size and Type of Current Housing Does NOT Meet Needs
Owners with unmet needs… Renters with unmet needs… • Younger owners who are newer to the Central Coast
and more recently moved into their current homes are less likely to have their housing needs met. They do plan to continue working at UCSB longer (probably due to their younger age), or they are unsure about their tenure here.
• Middle-age renters (between 40 and 54) are less likely to have their housing needs met than younger and older renters. Length of time on the Central Coast and in their current homes is not a factor in whether a renter’s housing needs are met.
• They have lower household incomes, but their housing costs are no different from those whose housing needs are being met.
• Their household incomes are not significantly different from employees renting homes that do meet their needs, but they pay about $200 less per month in household rent.
• They are more likely to own a 1- or 2-bedroom condominium with 1 or 1.5 bathrooms.
• They are more likely to rent a studio or 1-bedroom apartment with 1 bathroom, or a room in a private residence.
• Owners whose needs are not being met live in 1,319 square feet, on average, compared to 1,846 square feet among owners who say the size of their current home does meet their needs.
• Renters whose needs are not being met live in 875 square feet, on average, compared to 1,073 square feet among renters who say the size of their current home meets their needs.
• There are most likely 2 adults and 1 or 2 children living in the household. Those whose needs are met have smaller households and fewer children.
• The number of people in the household is not a factor in whether a renter’s housing needs are met. Having children in the home is also not a significant factor.
• Homeowners in the 93117 zip code are more likely to say their needs are not being met, while those in 93111 and the Santa Ynez Valley are more likely to own a home that does meet their needs.
• Renters in the 93101 zip code are more likely to say their needs are not being met, while those in 93111 are more likely to rent a home that does meet their needs.

UCSB EMPLOYEE HOUSING SURVEY – SPRING 2008 PAGE 16
Renters were asked how they would describe the value of their current residence for the price they are paying, and 37% believe their residence is an “above average” or “excellent” value. However, a sizeable proportion (21% of staff and 27% of faculty) believes the value of their rental is “below average” or “poor”.
• Staff renters are more likely than faculty renters to feel their home is an “excellent” value (13% vs. 3%).
• Those who have been renting longer, those in single family homes with more square footage, those who split the rent with roommates, those whose homes are in above average condition, and those who live in 93111 or areas north of Goleta are more positive about the value of their rentals.
• Amenities that are more prevalent in homes that are considered an “excellent” value include a private yard, a garage, additional storage space, washer/dryer in-unit or washer/dryer hook-ups, and pets allowed.
FIGURE 3 Value of Your Current Residence
Base = Renters (n = 874) Staff Faculty (n=800) (n=74)
Excellent13%
Above Average25%
Average41%
Below Average14%
Poor7%
Excellent3%
Above Average20%
Average50%
Below Average15%
Poor12%

UCSB EMPLOYEE HOUSING SURVEY – SPRING 2008 PAGE 17
Many factors influence the assessment of the value of one’s residence, such as affordability, amenities offered, square footage, the condition of the home, the location, etc. The table below examines just a few of them and how they interact with each other.
• Looking at cost of monthly rent for the different types of housing by the perceived value of one’s home could help determine the various price points employees might be willing to pay for potential new housing. For example, the typical respondent renting a 2-bedroom apartment for $1,500 considers this an “above average” or “excellent” value, while $1,700 for the same type of residence is a “below average” or “poor” value. However, if the cost of rent does not differ much by the value assigned to one’s home (such as is the case with the studio and 1-bedroom apartment), there are most likely other factors influencing the home’s perceived value. Even still, the financial analysis may provide a guideline for price considerations.
• Square footage is also related to the perceived value of one’s home – the more space available, the greater the value. But, again, this isn’t true for all housing types. Larger units typically cost more, so this interaction may partly explain why an above average value home may be smaller than a below average value home; or why an above average value home might not be much cheaper than a below average value home.
• Finally, housing type plays a significant role, in that renters of single-family houses tend to consider them to be a better value for the price – 50% of everyone renting a single-family house would characterize it as an “above average” or “excellent” value, compared to 32% of renters in an apartment, townhouse, condo.
Table 7 Value of Your Current Residence by Housing Type, Average Rent & Square Footage
Base = Renters Above Average / Excellent
(n=321) Average
(n=365) Below Average / Poor
(n=186) Type/Size of Housing % Total Rent
(personal share) Square Footage
% Total Rent (personal share)
Square Footage
% Total Rent (personal share)
Square Footage
Studio (n=56) 30% $953 ($953)
502 36% $931 ($881)
487 34% $975 ($975)
425
1 bedroom apt/condo (n=202) 23% $1,200 ($1,120)
691 46% $1,236 ($1,115)
639 31% $1,289 ($1,198)
678
2 bedroom apt/condo (n=231) 38% $1,534 ($1,315)
946 42% $1,619 ($1,412)
917 20% $1,727 ($1,424)
956
3+ bedroom apt/condo (n=70) 39% $1,851 ($1,102)
1,305 47% $2,235 ($1,538)
1,233 14% $2,195 ($1,640)
1,230
1-2 bedroom house (n=58) 50% $1,597 ($1,299)
977 36% $1,838 ($1,537)
1,026 14% $1,937 ($1,806)
980
3 bedroom house (n=84) 46% $1,853 ($1,449)
1,507 39% $2,471 ($2,134)
1,493 14% $2,358 ($2,021)
1,589
4+ bedroom house (n=55) 56% $2,322 ($1,359)
1,739 40% $2,491 ($1,113)
1,653 4% $2,275 ($1,750)
1,475
UCSB EMPLOYEE HOUSING SURVEY – SPRING 2008 PAGE 18
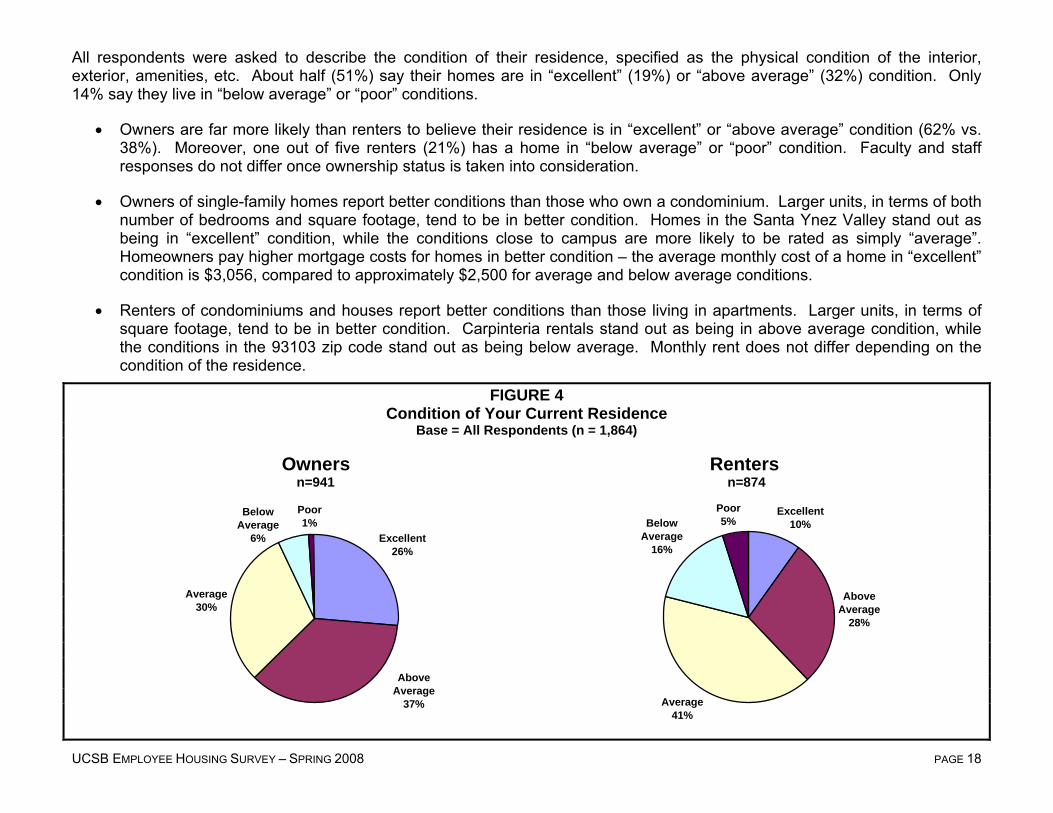
All respondents were asked to describe the condition of their residence, specified as the physical condition of the interior, exterior, amenities, etc. About half (51%) say their homes are in “excellent” (19%) or “above average” (32%) condition. Only 14% say they live in “below average” or “poor” conditions.
• Owners are far more likely than renters to believe their residence is in “excellent” or “above average” condition (62% vs. 38%). Moreover, one out of five renters (21%) has a home in “below average” or “poor” condition. Faculty and staff responses do not differ once ownership status is taken into consideration.
• Owners of single-family homes report better conditions than those who own a condominium. Larger units, in terms of both number of bedrooms and square footage, tend to be in better condition. Homes in the Santa Ynez Valley stand out as being in “excellent” condition, while the conditions close to campus are more likely to be rated as simply “average”. Homeowners pay higher mortgage costs for homes in better condition – the average monthly cost of a home in “excellent” condition is $3,056, compared to approximately $2,500 for average and below average conditions.
• Renters of condominiums and houses report better conditions than those living in apartments. Larger units, in terms of square footage, tend to be in better condition. Carpinteria rentals stand out as being in above average condition, while the conditions in the 93103 zip code stand out as being below average. Monthly rent does not differ depending on the condition of the residence.
FIGURE 4 Condition of Your Current Residence
Base = All Respondents (n = 1,864)
Owners Renters n=941 n=874
Excellent26%
Average30%
Poor1%
Above Average
37%
Below Average
6%
Excellent10%
Above Average
28%
Average41%
Below Average
16%
Poor5%

UCSB EMPLOYEE HOUSING SURVEY – SPRING 2008 PAGE 19
Importance of Owning a Home
Renters were asked how important it is for them to own their own home. Eighty-four percent (84%) of renters say that owning a home is “extremely” (52%) or “somewhat” important (32%). This is down somewhat from 2006, when 61% of renters said homeownership was “extremely important”.
• Faculty renters are the most likely to consider homeownership to be “extremely” important (77%).
• Academic staff members place less importance on owning a home – 31% “neutral” or “not important”. Academic staff also tend to be the more temporary employees, having come to UCSB more recently and planning shorter tenures here.
• The non-academic staff who find home ownership to be important are more likely than those who say it’s not important to have been at UCSB between 4 and 10 years, plan to remain at UCSB for 15 years or longer, have higher household incomes, and have children in the home.
FIGURE 5 Importance of Owning a Home
Base = Renters (n = 874)
52%
77%
34%
54%
32%
16%
36% 34%
16%
7%
31%
13%
0%
20%
40%
60%
80%
100%
All Renters Faculty (n=74) Academic Staff (n=170) Non-Academic Staff(n=630)
Extremely Important Somewhat Important Neutral / Not Important
84% Important
93% Important
83% Important
69% Important
UCSB EMPLOYEE HOUSING SURVEY – SPRING 2008 PAGE 20
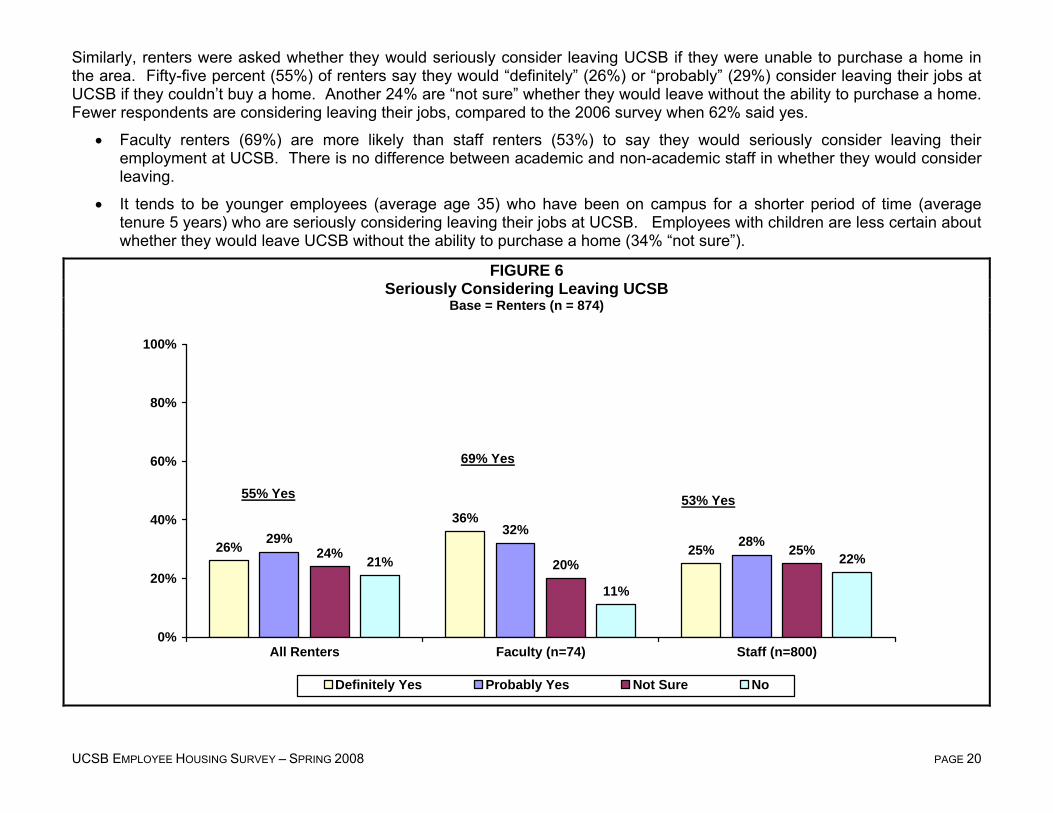
Similarly, renters were asked whether they would seriously consider leaving UCSB if they were unable to purchase a home in the area. Fifty-five percent (55%) of renters say they would “definitely” (26%) or “probably” (29%) consider leaving their jobs at UCSB if they couldn’t buy a home. Another 24% are “not sure” whether they would leave without the ability to purchase a home. Fewer respondents are considering leaving their jobs, compared to the 2006 survey when 62% said yes.
• Faculty renters (69%) are more likely than staff renters (53%) to say they would seriously consider leaving their employment at UCSB. There is no difference between academic and non-academic staff in whether they would consider leaving.
• It tends to be younger employees (average age 35) who have been on campus for a shorter period of time (average tenure 5 years) who are seriously considering leaving their jobs at UCSB. Employees with children are less certain about whether they would leave UCSB without the ability to purchase a home (34% “not sure”).
FIGURE 6 Seriously Considering Leaving UCSB
Base = Renters (n = 874)
26%
36%
25%29% 32%
28%24%
20%25%
21%
11%
22%
0%
20%
40%
60%
80%
100%
All Renters Faculty (n=74) Staff (n=800)
Definitely Yes Probably Yes Not Sure No
55% Yes
69% Yes
53% Yes

UCSB EMPLOYEE HOUSING SURVEY – SPRING 2008 PAGE 21
Those who may consider leaving UCSB if they are unable to purchase a home in the area were asked whether the opportunity to rent affordable university-owned housing close to campus would change their minds. Sixty-one percent (61%) would “definitely” (24%) or “probably” (37%) consider staying at UCSB if offered UCSB housing at affordable rents. Another 24% are “not sure”, and 15% would “probably” or “definitely not” consider this option.
• Staff renters (63%) are nearly twice as likely as faculty (33%) to consider staying if given the opportunity to rent affordable UCSB housing.
• Perhaps because they are closer to retirement, older employees are more likely to consider staying at UCSB for the option of university-owned housing – 42% of those over the age of 55 would “definitely” consider staying.
• Employees who earn higher salaries are less likely to consider staying, compared to those with lower incomes – only 13% of those earning over $100,000 would “definitely” consider staying to rent UCSB housing.
FIGURE 7 Considering Staying at UCSB if Able to Rent UCSB Housing
Base = Renters Considering Leaving UCSB / Not Sure (n = 685)
24%
9%
25%
37%
24%
38%
24% 27% 24%
15%
39%
13%
0%
20%
40%
60%
80%
100%
Total Faculty (n=66) Staff (n=619)
Definitely Yes Probably Yes Not Sure No
61% Yes
33% Yes
63% Yes
UCSB EMPLOYEE HOUSING SURVEY – SPRING 2008 PAGE 22
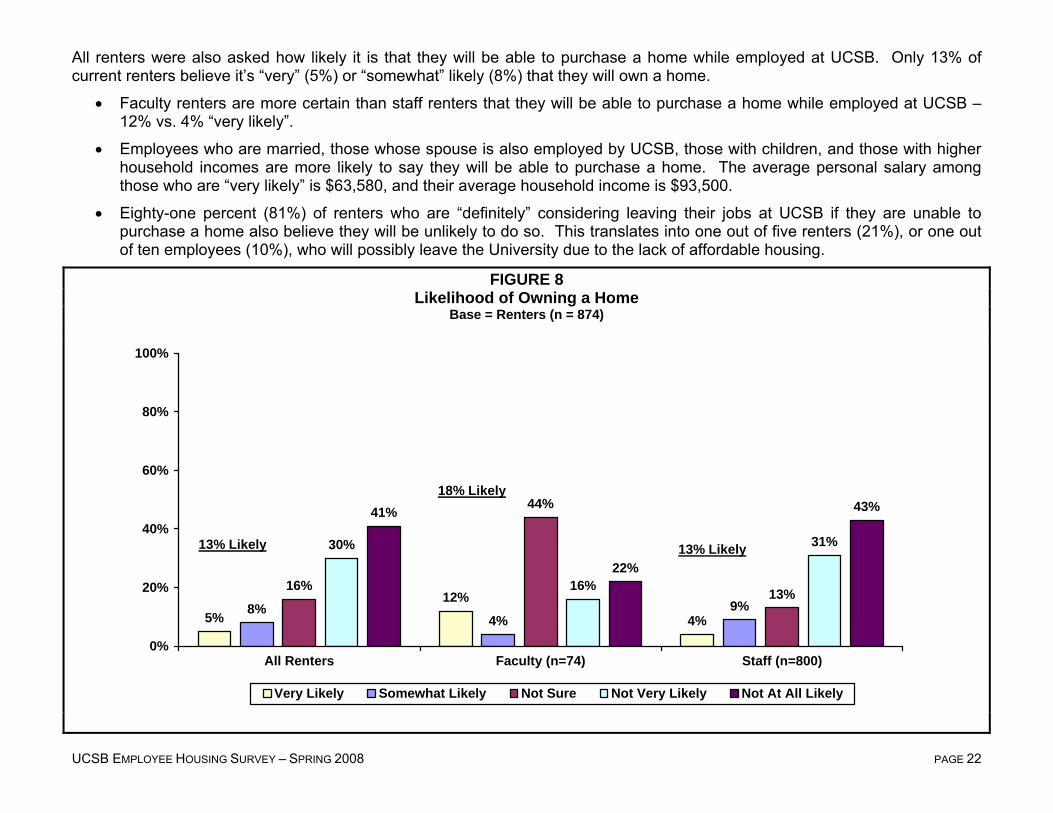
All renters were also asked how likely it is that they will be able to purchase a home while employed at UCSB. Only 13% of current renters believe it’s “very” (5%) or “somewhat” likely (8%) that they will own a home.
• Faculty renters are more certain than staff renters that they will be able to purchase a home while employed at UCSB – 12% vs. 4% “very likely”.
• Employees who are married, those whose spouse is also employed by UCSB, those with children, and those with higher household incomes are more likely to say they will be able to purchase a home. The average personal salary among those who are “very likely” is $63,580, and their average household income is $93,500.
• Eighty-one percent (81%) of renters who are “definitely” considering leaving their jobs at UCSB if they are unable to purchase a home also believe they will be unlikely to do so. This translates into one out of five renters (21%), or one out of ten employees (10%), who will possibly leave the University due to the lack of affordable housing.
FIGURE 8 Likelihood of Owning a Home
Base = Renters (n = 874)
5%12%
4%8%
4%9%
16%
44%
13%
30%
16%
31%
41%
22%
43%
0%
20%
40%
60%
80%
100%
All Renters Faculty (n=74) Staff (n=800)
Very Likely Somewhat Likely Not Sure Not Very Likely Not At All Likely
13% Likely
18% Likely
13% Likely
UCSB EMPLOYEE HOUSING SURVEY – SPRING 2008 PAGE 23
Future Housing
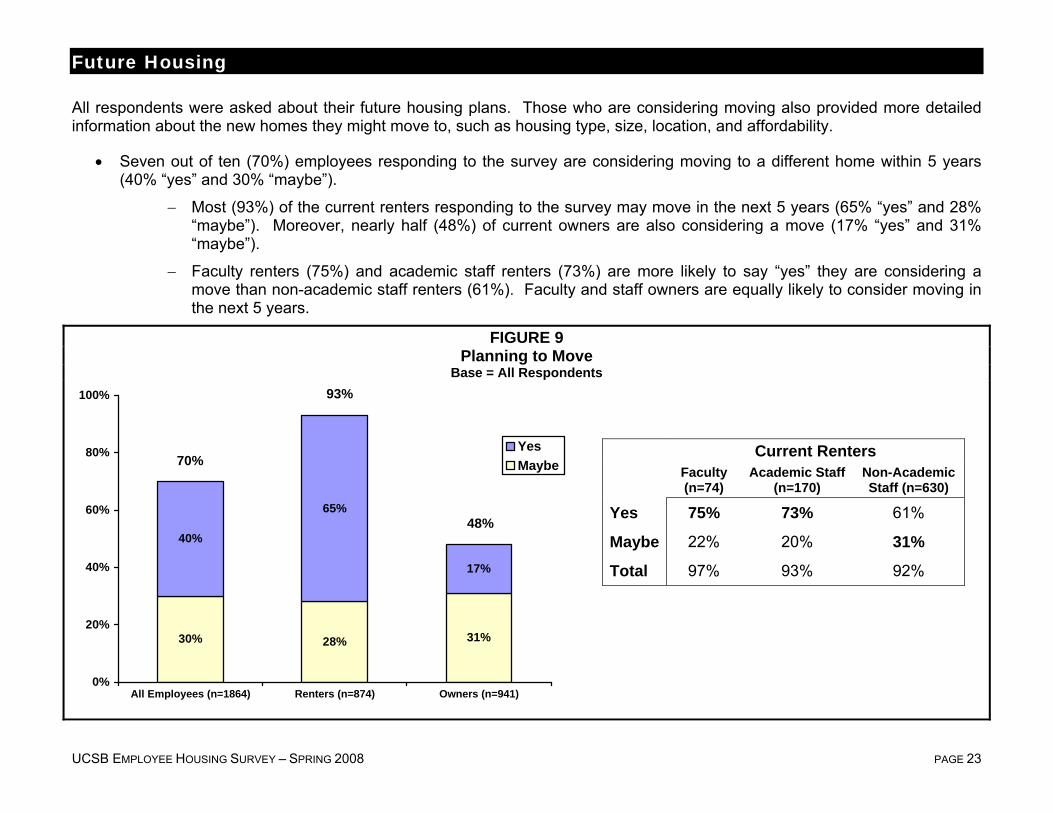
All respondents were asked about their future housing plans. Those who are considering moving also provided more detailed information about the new homes they might move to, such as housing type, size, location, and affordability.
• Seven out of ten (70%) employees responding to the survey are considering moving to a different home within 5 years (40% “yes” and 30% “maybe”).
− Most (93%) of the current renters responding to the survey may move in the next 5 years (65% “yes” and 28% “maybe”). Moreover, nearly half (48%) of current owners are also considering a move (17% “yes” and 31% “maybe”).
− Faculty renters (75%) and academic staff renters (73%) are more likely to say “yes” they are considering a move than non-academic staff renters (61%). Faculty and staff owners are equally likely to consider moving in the next 5 years.
FIGURE 9 Planning to Move
Base = All Respondents
30% 28% 31%
40%
65%
17%
0%
20%
40%
60%
80%
100%
All Employees (n=1864) Renters (n=874) Owners (n=941)
YesMaybe
70%
93%
48%
Current Renters
Faculty (n=74)
Academic Staff (n=170)
Non-Academic Staff (n=630)
Yes 75% 73% 61%
Maybe 22% 20% 31%
Total 97% 93% 92%

UCSB EMPLOYEE HOUSING SURVEY – SPRING 2008 PAGE 24
Two-thirds (66%) of those considering a move plan to purchase their next home, while one-third (34%) will rent.
• While 95% of current owners who are planning to move would purchase a home, half (50%) of current renters would also like to buy the next home they move to.
− Faculty who currently rent (83%) are more likely than staff renters (47%) to want to purchase their next home.
− As would be expected, employees with higher incomes are more likely to plan on purchasing. The average personal salary of those planning to purchase is $66,500 compared to $45,390 among those planning to rent. The average household income of those planning to purchase is $100,100 compared to $55,610 among those planning to rent their next home.
FIGURE 10 Planning to Purchase or Rent?
Base = Movers (n = 1,293)
34%50%
5% 9%17%
4%
38%53%
6%
66%50%
95% 91%83%
96%
62%47%
94%
0%
20%
40%
60%
80%
100%
All Movers Renters(n=808)
Owners(n=446)
FacultyMovers(n=190)
FacultyRenters(n=71)
FacultyOwners(n=114)
StaffMovers
(n=1103)
StaffRenters(n=737)
StaffOwners(n=332)
PurchaseRent
UCSB EMPLOYEE HOUSING SURVEY – SPRING 2008 PAGE 25
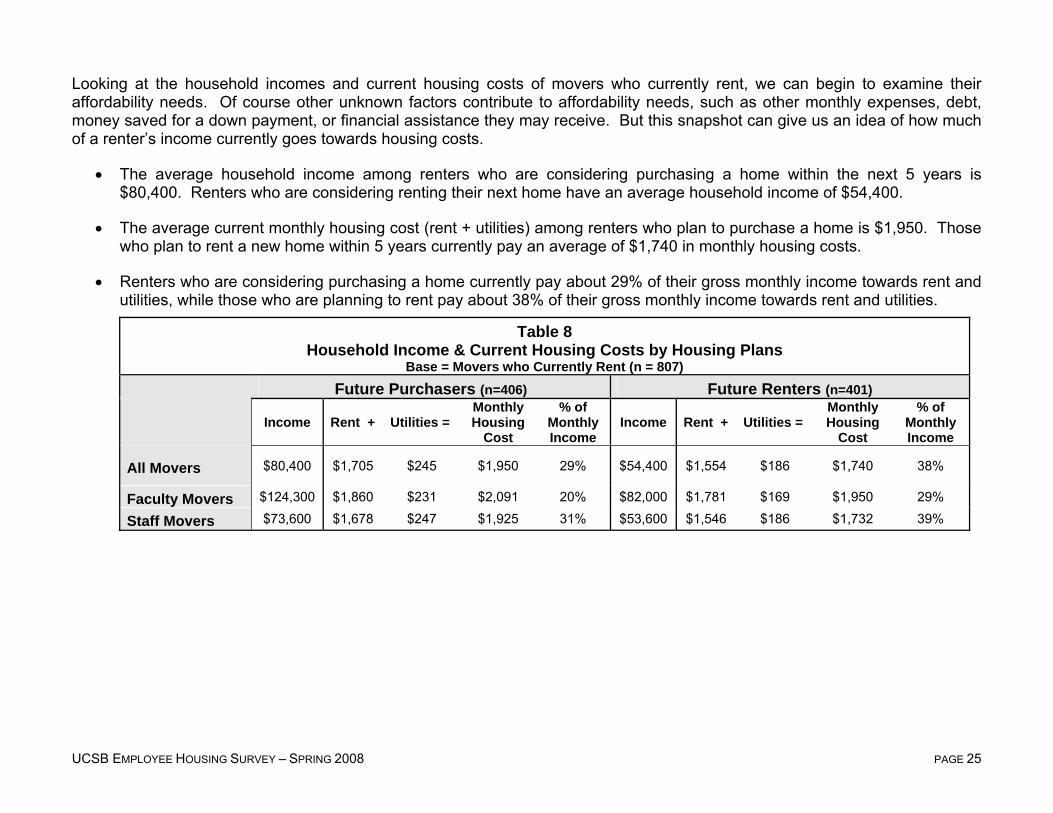
Looking at the household incomes and current housing costs of movers who currently rent, we can begin to examine their affordability needs. Of course other unknown factors contribute to affordability needs, such as other monthly expenses, debt, money saved for a down payment, or financial assistance they may receive. But this snapshot can give us an idea of how much of a renter’s income currently goes towards housing costs.
• The average household income among renters who are considering purchasing a home within the next 5 years is $80,400. Renters who are considering renting their next home have an average household income of $54,400.
• The average current monthly housing cost (rent + utilities) among renters who plan to purchase a home is $1,950. Those who plan to rent a new home within 5 years currently pay an average of $1,740 in monthly housing costs.
• Renters who are considering purchasing a home currently pay about 29% of their gross monthly income towards rent and utilities, while those who are planning to rent pay about 38% of their gross monthly income towards rent and utilities.
Table 8 Household Income & Current Housing Costs by Housing Plans
Base = Movers who Currently Rent (n = 807) Future Purchasers (n=406) Future Renters (n=401)
Income Rent + Utilities =
Monthly Housing
Cost
% of Monthly Income
Income Rent + Utilities = Monthly Housing
Cost
% of Monthly Income
All Movers $80,400 $1,705 $245 $1,950 29% $54,400 $1,554 $186 $1,740 38%
Faculty Movers $124,300 $1,860 $231 $2,091 20% $82,000 $1,781 $169 $1,950 29%
Staff Movers $73,600 $1,678 $247 $1,925 31% $53,600 $1,546 $186 $1,732 39%
UCSB EMPLOYEE HOUSING SURVEY – SPRING 2008 PAGE 26
Housing Plans - Purchasers
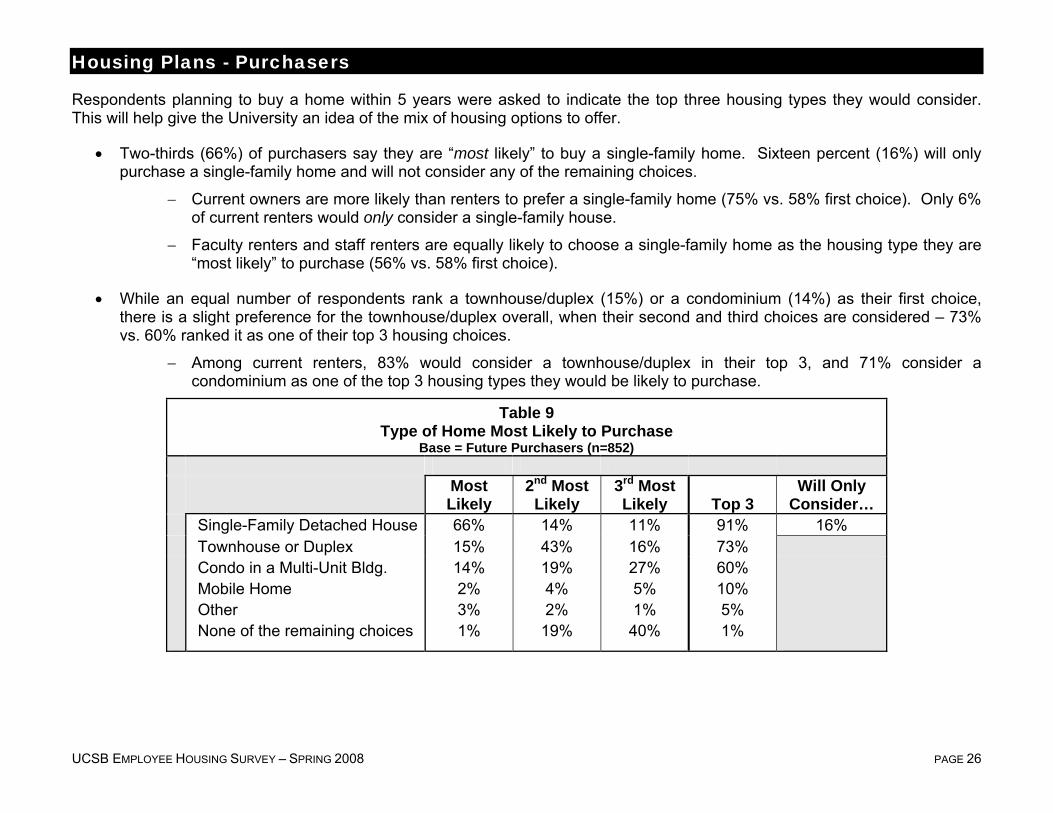
Respondents planning to buy a home within 5 years were asked to indicate the top three housing types they would consider. This will help give the University an idea of the mix of housing options to offer.
• Two-thirds (66%) of purchasers say they are “most likely” to buy a single-family home. Sixteen percent (16%) will only purchase a single-family home and will not consider any of the remaining choices.
− Current owners are more likely than renters to prefer a single-family home (75% vs. 58% first choice). Only 6% of current renters would only consider a single-family house.
− Faculty renters and staff renters are equally likely to choose a single-family home as the housing type they are “most likely” to purchase (56% vs. 58% first choice).
• While an equal number of respondents rank a townhouse/duplex (15%) or a condominium (14%) as their first choice, there is a slight preference for the townhouse/duplex overall, when their second and third choices are considered – 73% vs. 60% ranked it as one of their top 3 housing choices.
− Among current renters, 83% would consider a townhouse/duplex in their top 3, and 71% consider a condominium as one of the top 3 housing types they would be likely to purchase.
Table 9 Type of Home Most Likely to Purchase
Base = Future Purchasers (n=852) Most
Likely 2nd Most
Likely 3rd Most Likely Top 3
Will Only Consider…
Single-Family Detached House 66% 14% 11% 91% 16% Townhouse or Duplex 15% 43% 16% 73% Condo in a Multi-Unit Bldg. 14% 19% 27% 60% Mobile Home 2% 4% 5% 10% Other 3% 2% 1% 5% None of the remaining choices 1% 19% 40% 1%
UCSB EMPLOYEE HOUSING SURVEY – SPRING 2008 PAGE 27
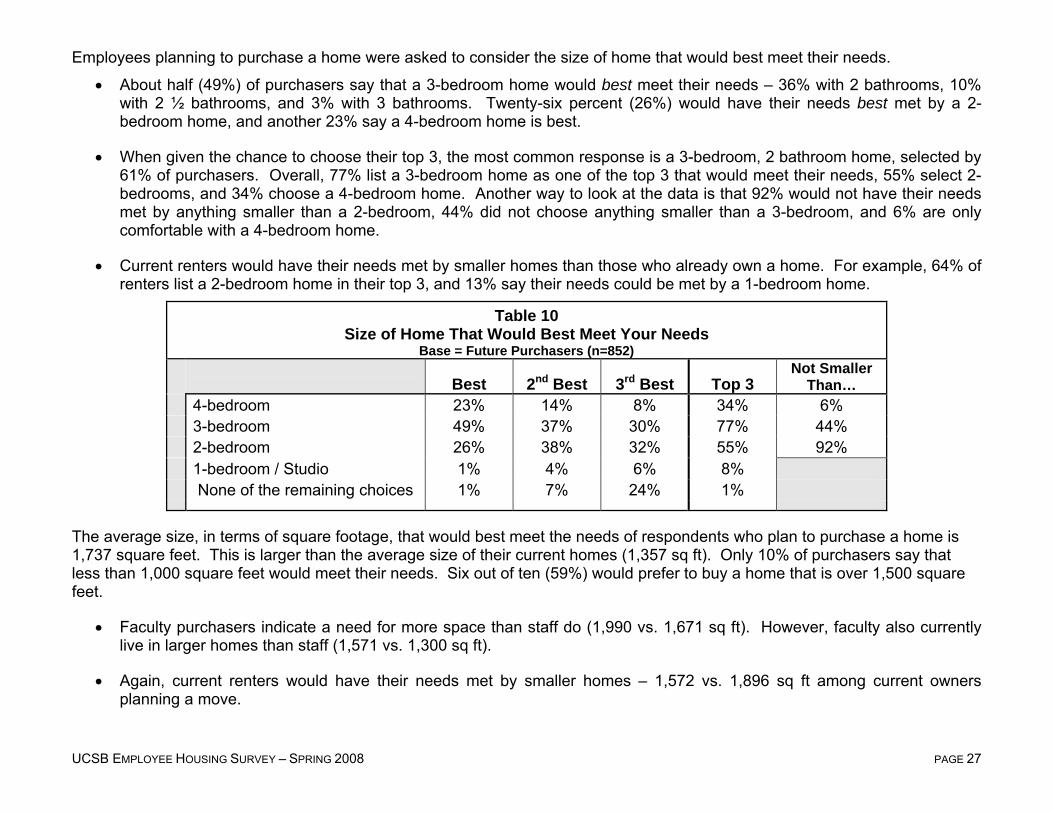
Employees planning to purchase a home were asked to consider the size of home that would best meet their needs.
• About half (49%) of purchasers say that a 3-bedroom home would best meet their needs – 36% with 2 bathrooms, 10% with 2 ½ bathrooms, and 3% with 3 bathrooms. Twenty-six percent (26%) would have their needs best met by a 2-bedroom home, and another 23% say a 4-bedroom home is best.
• When given the chance to choose their top 3, the most common response is a 3-bedroom, 2 bathroom home, selected by 61% of purchasers. Overall, 77% list a 3-bedroom home as one of the top 3 that would meet their needs, 55% select 2-bedrooms, and 34% choose a 4-bedroom home. Another way to look at the data is that 92% would not have their needs met by anything smaller than a 2-bedroom, 44% did not choose anything smaller than a 3-bedroom, and 6% are only comfortable with a 4-bedroom home.
• Current renters would have their needs met by smaller homes than those who already own a home. For example, 64% of renters list a 2-bedroom home in their top 3, and 13% say their needs could be met by a 1-bedroom home.
Table 10 Size of Home That Would Best Meet Your Needs
Base = Future Purchasers (n=852)
Best 2nd Best 3rd Best Top 3 Not Smaller
Than… 4-bedroom 23% 14% 8% 34% 6% 3-bedroom 49% 37% 30% 77% 44% 2-bedroom 26% 38% 32% 55% 92% 1-bedroom / Studio 1% 4% 6% 8% None of the remaining choices 1% 7% 24% 1%
The average size, in terms of square footage, that would best meet the needs of respondents who plan to purchase a home is 1,737 square feet. This is larger than the average size of their current homes (1,357 sq ft). Only 10% of purchasers say that less than 1,000 square feet would meet their needs. Six out of ten (59%) would prefer to buy a home that is over 1,500 square feet.
• Faculty purchasers indicate a need for more space than staff do (1,990 vs. 1,671 sq ft). However, faculty also currently live in larger homes than staff (1,571 vs. 1,300 sq ft).
• Again, current renters would have their needs met by smaller homes – 1,572 vs. 1,896 sq ft among current owners planning a move.
UCSB EMPLOYEE HOUSING SURVEY – SPRING 2008 PAGE 28
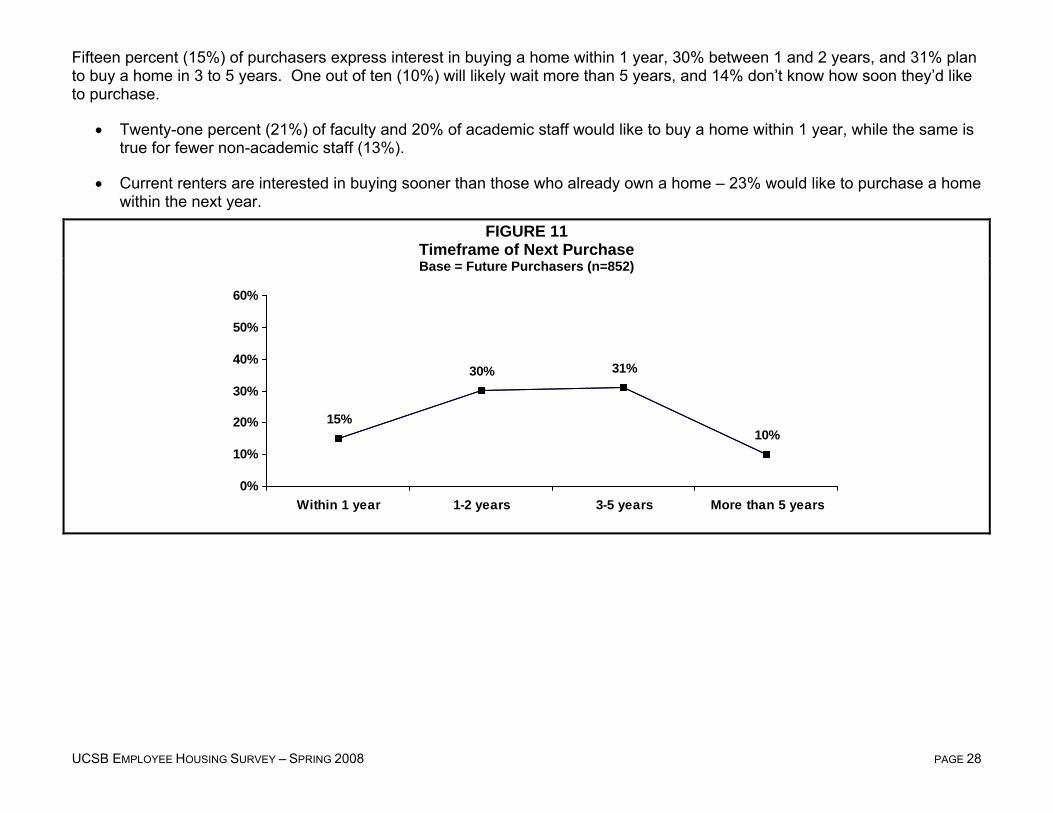
Fifteen percent (15%) of purchasers express interest in buying a home within 1 year, 30% between 1 and 2 years, and 31% plan to buy a home in 3 to 5 years. One out of ten (10%) will likely wait more than 5 years, and 14% don’t know how soon they’d like to purchase.
• Twenty-one percent (21%) of faculty and 20% of academic staff would like to buy a home within 1 year, while the same is true for fewer non-academic staff (13%).
• Current renters are interested in buying sooner than those who already own a home – 23% would like to purchase a home within the next year.
FIGURE 11 Timeframe of Next Purchase Base = Future Purchasers (n=852)
15%
30% 31%
10%
0%
10%
20%
30%
40%
50%
60%
Within 1 year 1-2 years 3-5 years More than 5 years
UCSB EMPLOYEE HOUSING SURVEY – SPRING 2008 PAGE 29
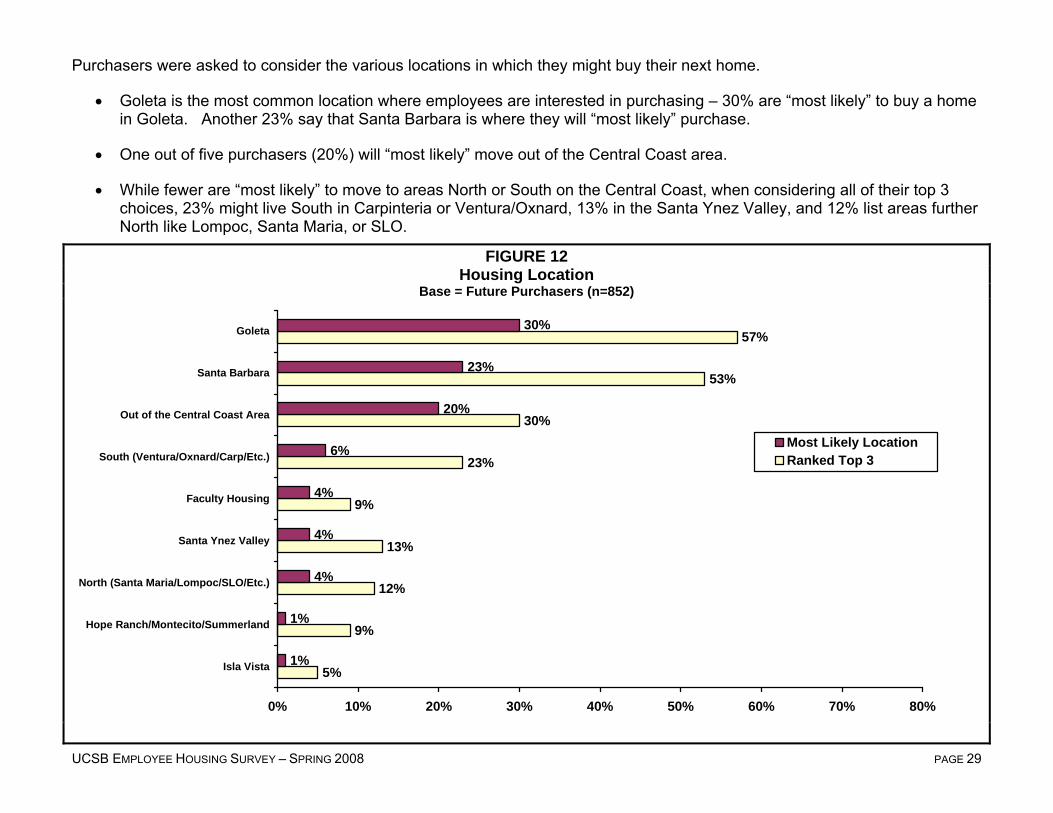
Purchasers were asked to consider the various locations in which they might buy their next home.
• Goleta is the most common location where employees are interested in purchasing – 30% are “most likely” to buy a home in Goleta. Another 23% say that Santa Barbara is where they will “most likely” purchase.
• One out of five purchasers (20%) will “most likely” move out of the Central Coast area.
• While fewer are “most likely” to move to areas North or South on the Central Coast, when considering all of their top 3 choices, 23% might live South in Carpinteria or Ventura/Oxnard, 13% in the Santa Ynez Valley, and 12% list areas further North like Lompoc, Santa Maria, or SLO.
FIGURE 12 Housing Location
Base = Future Purchasers (n=852)
5%
9%
12%
13%
9%
23%
30%
53%
57%
1%
1%
4%
4%
4%
6%
20%
23%
30%
0% 10% 20% 30% 40% 50% 60% 70% 80%
Isla Vista
Hope Ranch/Montecito/Summerland
North (Santa Maria/Lompoc/SLO/Etc.)
Santa Ynez Valley
Faculty Housing
South (Ventura/Oxnard/Carp/Etc.)
Out of the Central Coast Area
Santa Barbara
Goleta
Most Likely LocationRanked Top 3
UCSB EMPLOYEE HOUSING SURVEY – SPRING 2008 PAGE 30
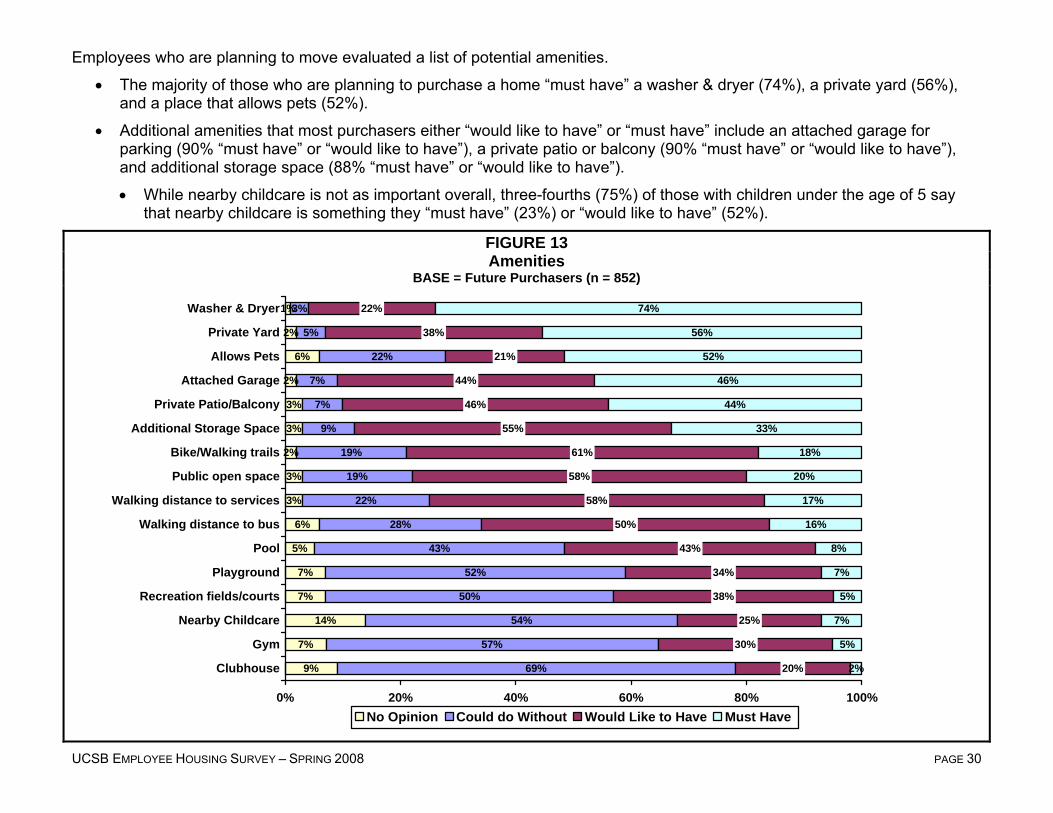
Employees who are planning to move evaluated a list of potential amenities.
• The majority of those who are planning to purchase a home “must have” a washer & dryer (74%), a private yard (56%), and a place that allows pets (52%).
• Additional amenities that most purchasers either “would like to have” or “must have” include an attached garage for parking (90% “must have” or “would like to have”), a private patio or balcony (90% “must have” or “would like to have”), and additional storage space (88% “must have” or “would like to have”).
• While nearby childcare is not as important overall, three-fourths (75%) of those with children under the age of 5 say that nearby childcare is something they “must have” (23%) or “would like to have” (52%).
FIGURE 13 Amenities
BASE = Future Purchasers (n = 852)
9%
7%
14%
7%
7%
5%
6%
3%
3%
2%
3%
3%
2%
6%
2%
1%
69%
57%
54%
50%
52%
43%
28%
22%
19%
19%
9%
7%
7%
22%
5%
3%
20%
30%
25%
38%
34%
43%
50%
58%
58%
61%
55%
46%
44%
21%
38%
22%
2%
5%
7%
5%
7%
8%
16%
17%
20%
18%
33%
44%
46%
52%
56%
74%
0% 20% 40% 60% 80% 100%
Clubhouse
Gym
Nearby Childcare
Recreation fields/courts
Playground
Pool
Walking distance to bus
Walking distance to services
Public open space
Bike/Walking trails
Additional Storage Space
Private Patio/Balcony
Attached Garage
Allows Pets
Private Yard
Washer & Dryer
No Opinion Could do Without Would Like to Have Must Have
UCSB EMPLOYEE HOUSING SURVEY – SPRING 2008 PAGE 31
Housing Plans - Renters
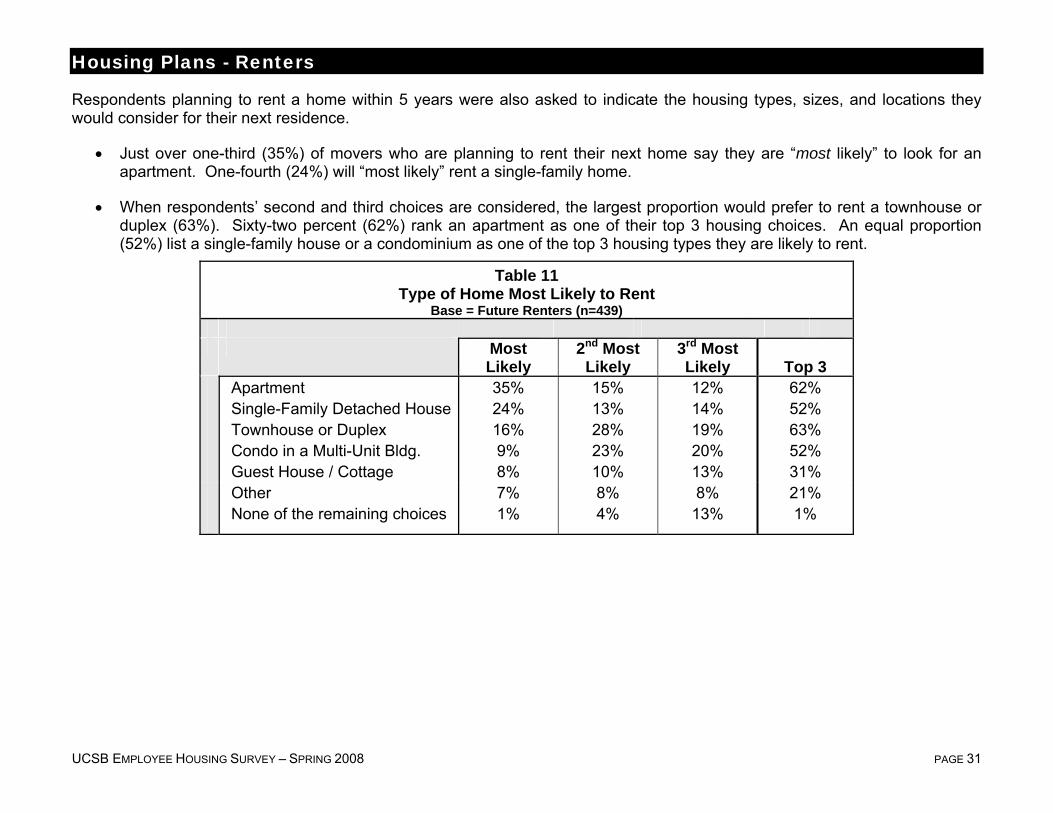
Respondents planning to rent a home within 5 years were also asked to indicate the housing types, sizes, and locations they would consider for their next residence.
• Just over one-third (35%) of movers who are planning to rent their next home say they are “most likely” to look for an apartment. One-fourth (24%) will “most likely” rent a single-family home.
• When respondents’ second and third choices are considered, the largest proportion would prefer to rent a townhouse or duplex (63%). Sixty-two percent (62%) rank an apartment as one of their top 3 housing choices. An equal proportion (52%) list a single-family house or a condominium as one of the top 3 housing types they are likely to rent.
Table 11 Type of Home Most Likely to Rent
Base = Future Renters (n=439) Most
Likely 2nd Most
Likely 3rd Most Likely Top 3
Apartment 35% 15% 12% 62% Single-Family Detached House 24% 13% 14% 52% Townhouse or Duplex 16% 28% 19% 63% Condo in a Multi-Unit Bldg. 9% 23% 20% 52% Guest House / Cottage 8% 10% 13% 31% Other 7% 8% 8% 21% None of the remaining choices 1% 4% 13% 1%
UCSB EMPLOYEE HOUSING SURVEY – SPRING 2008 PAGE 32
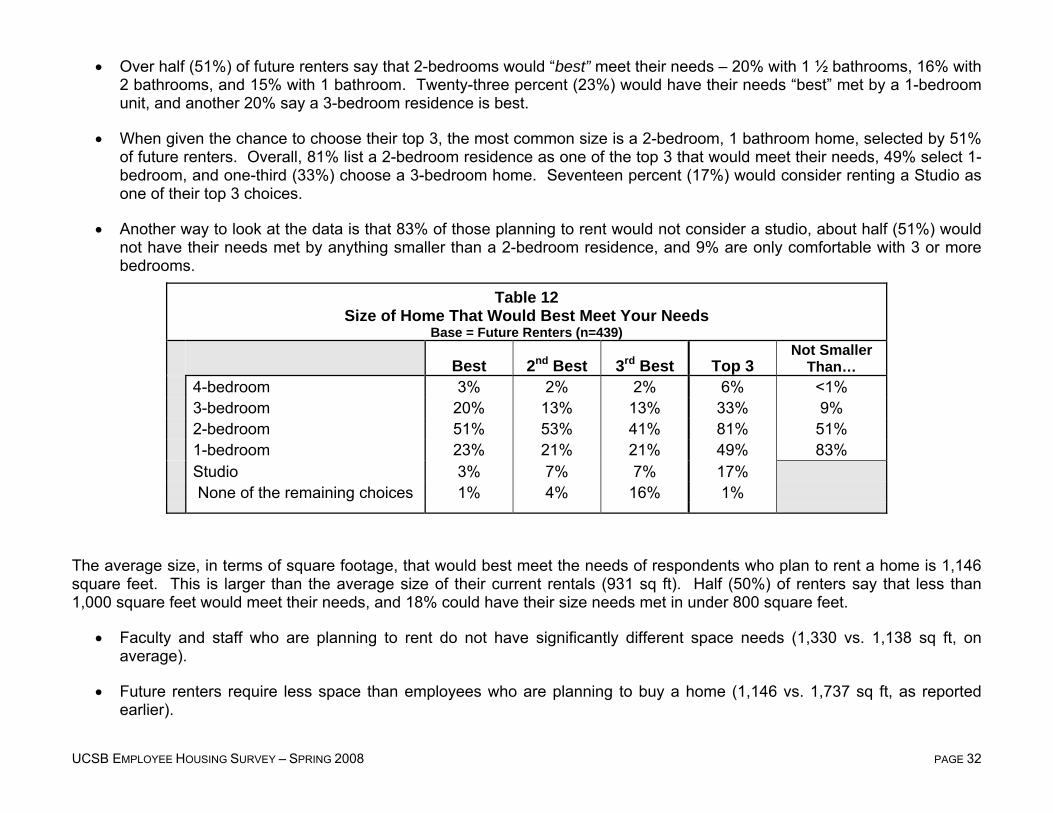
• Over half (51%) of future renters say that 2-bedrooms would “best” meet their needs – 20% with 1 ½ bathrooms, 16% with 2 bathrooms, and 15% with 1 bathroom. Twenty-three percent (23%) would have their needs “best” met by a 1-bedroom unit, and another 20% say a 3-bedroom residence is best.
• When given the chance to choose their top 3, the most common size is a 2-bedroom, 1 bathroom home, selected by 51% of future renters. Overall, 81% list a 2-bedroom residence as one of the top 3 that would meet their needs, 49% select 1-bedroom, and one-third (33%) choose a 3-bedroom home. Seventeen percent (17%) would consider renting a Studio as one of their top 3 choices.
• Another way to look at the data is that 83% of those planning to rent would not consider a studio, about half (51%) would not have their needs met by anything smaller than a 2-bedroom residence, and 9% are only comfortable with 3 or more bedrooms.
Table 12 Size of Home That Would Best Meet Your Needs
Base = Future Renters (n=439)
Best 2nd Best 3rd Best Top 3 Not Smaller
Than… 4-bedroom 3% 2% 2% 6% <1% 3-bedroom 20% 13% 13% 33% 9% 2-bedroom 51% 53% 41% 81% 51% 1-bedroom 23% 21% 21% 49% 83% Studio 3% 7% 7% 17% None of the remaining choices 1% 4% 16% 1%
The average size, in terms of square footage, that would best meet the needs of respondents who plan to rent a home is 1,146 square feet. This is larger than the average size of their current rentals (931 sq ft). Half (50%) of renters say that less than 1,000 square feet would meet their needs, and 18% could have their size needs met in under 800 square feet.
• Faculty and staff who are planning to rent do not have significantly different space needs (1,330 vs. 1,138 sq ft, on average).
• Future renters require less space than employees who are planning to buy a home (1,146 vs. 1,737 sq ft, as reported earlier).
UCSB EMPLOYEE HOUSING SURVEY – SPRING 2008 PAGE 33
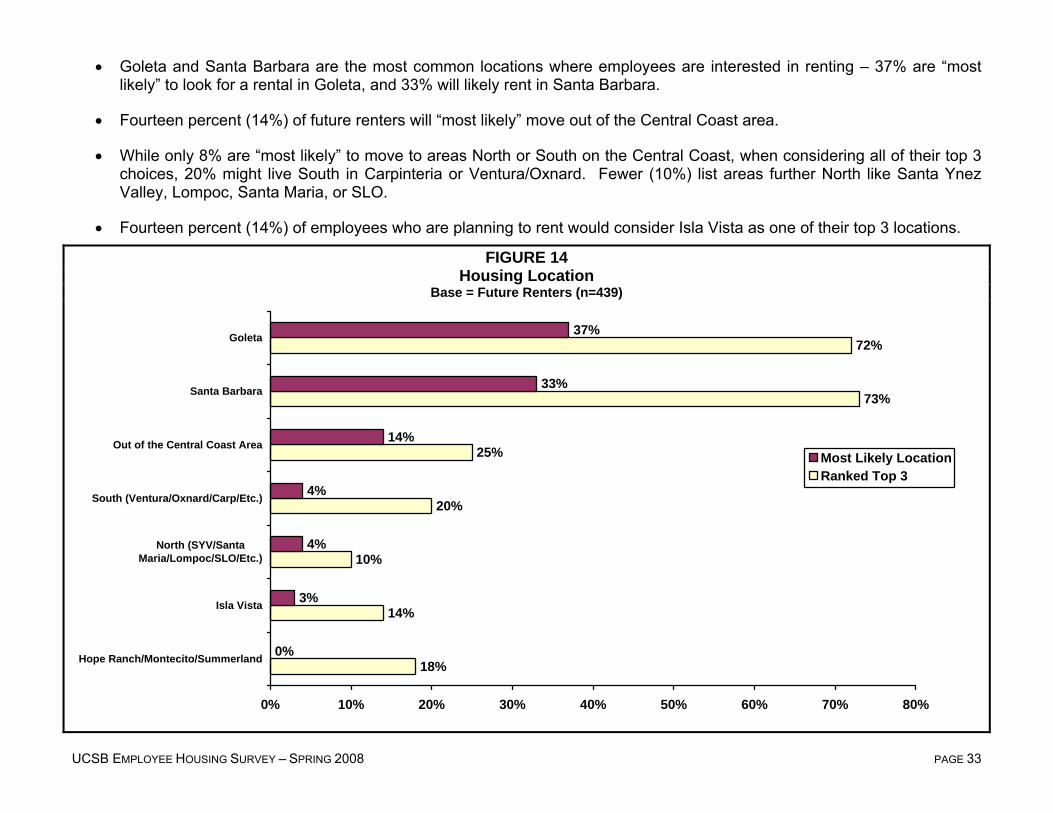
• Goleta and Santa Barbara are the most common locations where employees are interested in renting – 37% are “most likely” to look for a rental in Goleta, and 33% will likely rent in Santa Barbara.
• Fourteen percent (14%) of future renters will “most likely” move out of the Central Coast area.
• While only 8% are “most likely” to move to areas North or South on the Central Coast, when considering all of their top 3 choices, 20% might live South in Carpinteria or Ventura/Oxnard. Fewer (10%) list areas further North like Santa Ynez Valley, Lompoc, Santa Maria, or SLO.
• Fourteen percent (14%) of employees who are planning to rent would consider Isla Vista as one of their top 3 locations.
FIGURE 14 Housing Location
Base = Future Renters (n=439)
18%
14%
10%
20%
25%
73%
72%
0%
3%
4%
4%
14%
33%
37%
0% 10% 20% 30% 40% 50% 60% 70% 80%
Hope Ranch/Montecito/Summerland
Isla Vista
North (SYV/SantaMaria/Lompoc/SLO/Etc.)
South (Ventura/Oxnard/Carp/Etc.)
Out of the Central Coast Area
Santa Barbara
Goleta
Most Likely LocationRanked Top 3
UCSB EMPLOYEE HOUSING SURVEY – SPRING 2008 PAGE 34
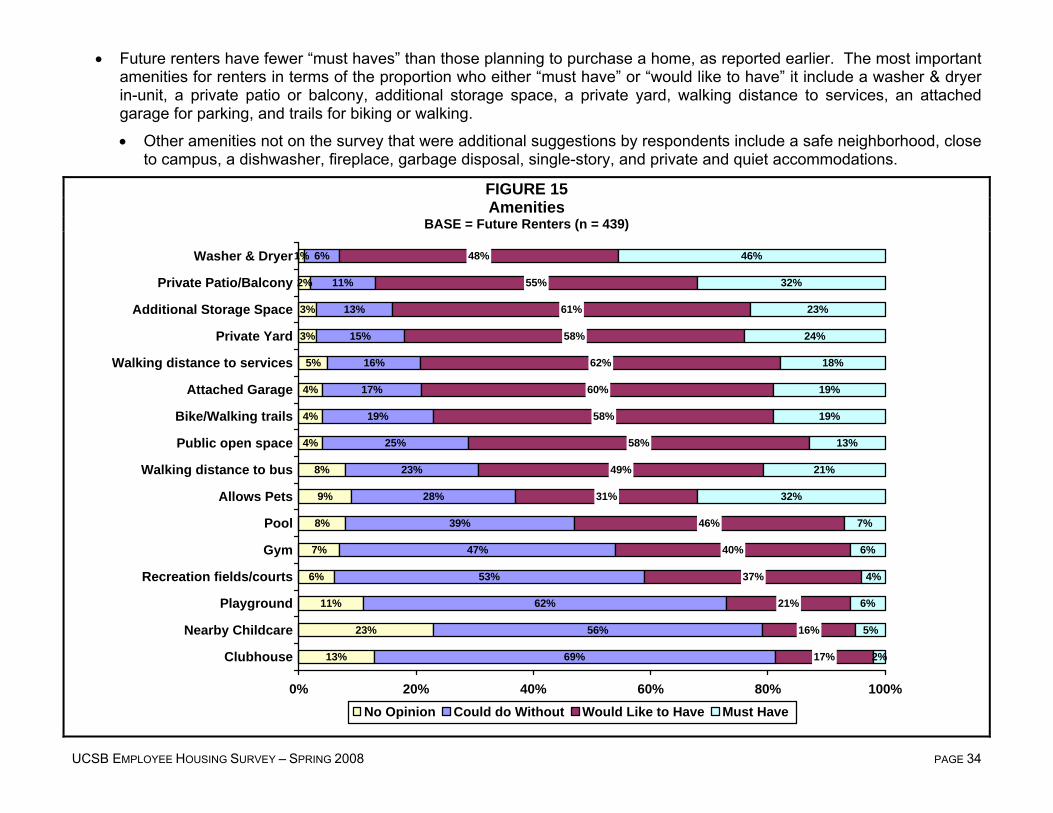
• Future renters have fewer “must haves” than those planning to purchase a home, as reported earlier. The most important amenities for renters in terms of the proportion who either “must have” or “would like to have” it include a washer & dryer in-unit, a private patio or balcony, additional storage space, a private yard, walking distance to services, an attached garage for parking, and trails for biking or walking.
• Other amenities not on the survey that were additional suggestions by respondents include a safe neighborhood, close to campus, a dishwasher, fireplace, garbage disposal, single-story, and private and quiet accommodations.
FIGURE 15 Amenities
BASE = Future Renters (n = 439)
13%
23%
11%
6%
7%
8%
9%
8%
4%
4%
4%
5%
3%
3%
2%
1%
69%
56%
62%
53%
47%
39%
28%
23%
25%
19%
17%
16%
15%
13%
11%
6%
17%
16%
21%
37%
40%
46%
31%
49%
58%
58%
60%
62%
58%
61%
55%
48%
2%
5%
6%
4%
6%
7%
32%
21%
13%
19%
19%
18%
24%
23%
32%
46%
0% 20% 40% 60% 80% 100%
Clubhouse
Nearby Childcare
Playground
Recreation fields/courts
Gym
Pool
Allows Pets
Walking distance to bus
Public open space
Bike/Walking trails
Attached Garage
Walking distance to services
Private Yard
Additional Storage Space
Private Patio/Balcony
Washer & Dryer
No Opinion Could do Without Would Like to Have Must Have

UCSB EMPLOYEE HOUSING SURVEY – SPRING 2008 PAGE 35
Housing Affordability
The survey sought to understand and measure the cost of housing that UCSB employees believe they can realistically afford. Affordability varies considerably by current ownership status. Not surprisingly, homeowners say they can afford much higher down payments, home prices, and monthly housing costs, compared to renters.
• On average, employees indicate that the largest down payment they can realistically afford is about $53,800. While current owners believe they can afford a down payment of nearly $124,000, current renters believe they can only provide a down payment in the amount of about $34,000.
• The median home price employees are likely to purchase is about $503,000. Fifty-four percent (54%) are most likely to purchase a home under $600,000, while 29% say they will buy a home between $600,000 and $1 million, and 11% say they can afford a home over $1 million. Owners say they can afford a median purchase price of $660,000, while current renters will more likely look for homes around $411,000.
• The maximum average monthly housing cost employees say they can afford is $2,228. Again, current owners indicate they can afford slightly higher monthly housing costs than renters – about $2,400 vs. $2,000 per month.
• Faculty owners are able to afford larger down payments, higher priced homes, and higher monthly housing costs than staff owners. Faculty who currently rent can also afford to spend more on housing than staff renters.
Table 13 Housing Affordability Base = Future Purchasers
All Purchasers Current Owners Current Renters/Other
Total (n = 852)
Faculty (n = 172)
Staff (n = 680)
Total (n = 421)
Faculty (n = 110)
Staff (n = 311)
Total (n = 431)
Faculty (n = 62)
Staff (n = 369)
Median Down Payment $53,797 $114,706 $43,478 $123,810 $231,250 $103,125 $33,714 $68,750 $27,619Median Price of Home $503,261 $730,000 $480,208 $660,227 $1.01M $604,000 $411,194 $529,167 $396,703Median Monthly Housing Cost $2,228 $2,831 $2,105 $2,443 $3,141 $2,293 $2,045 $2,528 $1,952
UCSB EMPLOYEE HOUSING SURVEY – SPRING 2008 PAGE 36
University Housing
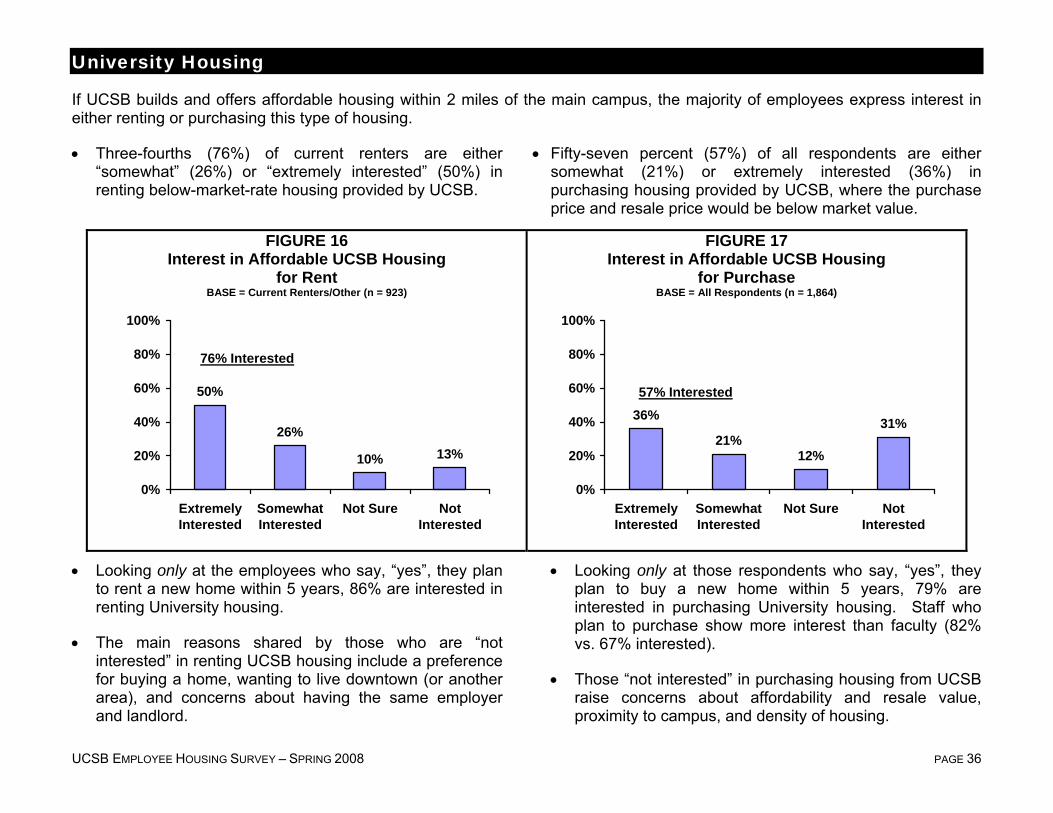
If UCSB builds and offers affordable housing within 2 miles of the main campus, the majority of employees express interest in either renting or purchasing this type of housing.
• Three-fourths (76%) of current renters are either “somewhat” (26%) or “extremely interested” (50%) in renting below-market-rate housing provided by UCSB.
• Fifty-seven percent (57%) of all respondents are either somewhat (21%) or extremely interested (36%) in purchasing housing provided by UCSB, where the purchase price and resale price would be below market value.
FIGURE 16 Interest in Affordable UCSB Housing
for Rent BASE = Current Renters/Other (n = 923)
50%
26%
10% 13%
0%
20%
40%
60%
80%
100%
ExtremelyInterested
SomewhatInterested
Not Sure NotInterested
FIGURE 17 Interest in Affordable UCSB Housing
for Purchase BASE = All Respondents (n = 1,864)
36%
21%12%
31%
0%
20%
40%
60%
80%
100%
ExtremelyInterested
SomewhatInterested
Not Sure NotInterested
• Looking only at the employees who say, “yes”, they plan
to rent a new home within 5 years, 86% are interested in renting University housing.
• The main reasons shared by those who are “not interested” in renting UCSB housing include a preference for buying a home, wanting to live downtown (or another area), and concerns about having the same employer and landlord.
• Looking only at those respondents who say, “yes”, they plan to buy a new home within 5 years, 79% are interested in purchasing University housing. Staff who plan to purchase show more interest than faculty (82% vs. 67% interested).
• Those “not interested” in purchasing housing from UCSB raise concerns about affordability and resale value, proximity to campus, and density of housing.
76% Interested
57% Interested
UCSB EMPLOYEE HOUSING SURVEY – SPRING 2008 PAGE 37
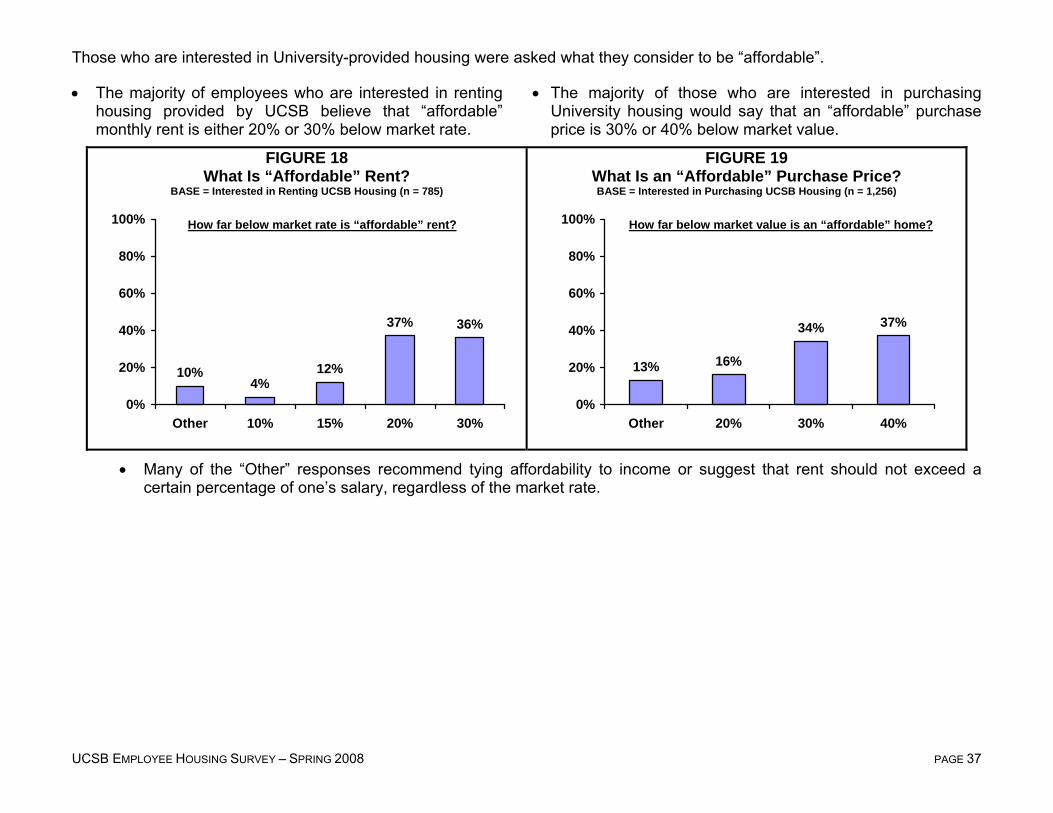
Those who are interested in University-provided housing were asked what they consider to be “affordable”.
• The majority of employees who are interested in renting housing provided by UCSB believe that “affordable” monthly rent is either 20% or 30% below market rate.
• The majority of those who are interested in purchasing University housing would say that an “affordable” purchase price is 30% or 40% below market value.
FIGURE 18 What Is “Affordable” Rent?
BASE = Interested in Renting UCSB Housing (n = 785)
10%4%
12%
37% 36%
0%
20%
40%
60%
80%
100%
Other 10% 15% 20% 30%
FIGURE 19 What Is an “Affordable” Purchase Price? BASE = Interested in Purchasing UCSB Housing (n = 1,256)
13% 16%
34% 37%
0%
20%
40%
60%
80%
100%
Other 20% 30% 40%
• Many of the “Other” responses recommend tying affordability to income or suggest that rent should not exceed a certain percentage of one’s salary, regardless of the market rate.
How far below market rate is “affordable” rent? How far below market value is an “affordable” home?
UCSB EMPLOYEE HOUSING SURVEY – SPRING 2008 PAGE 38
Scenarios
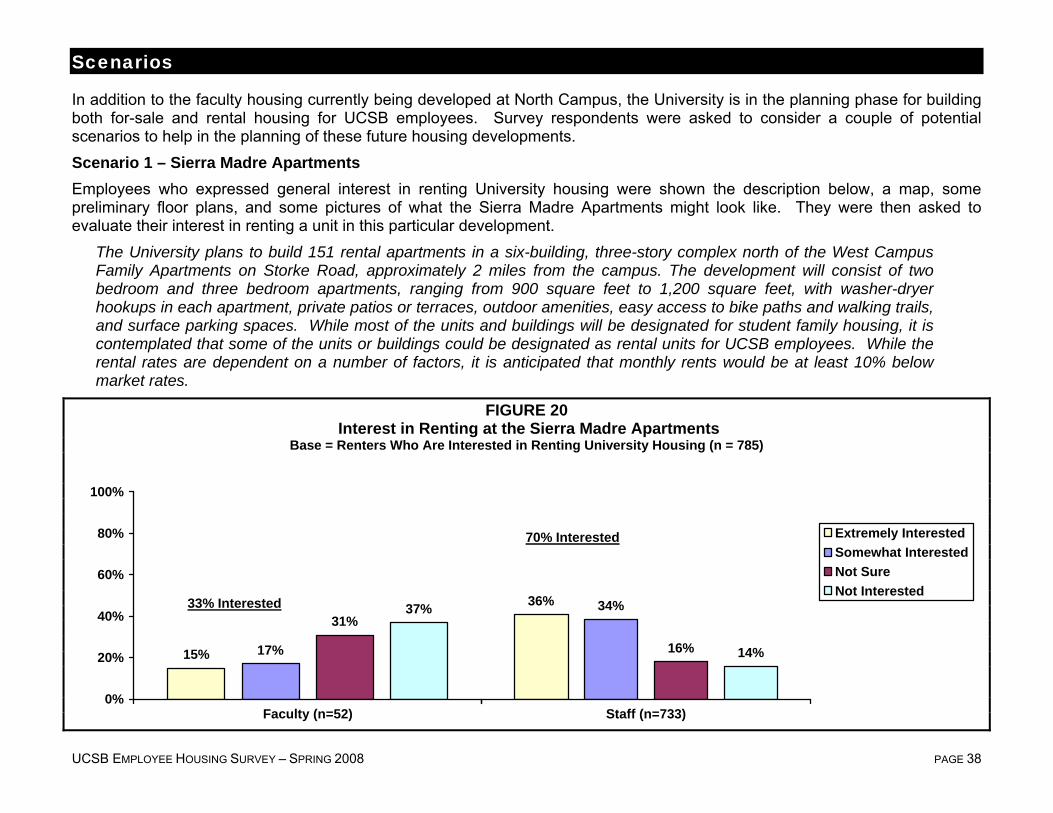
In addition to the faculty housing currently being developed at North Campus, the University is in the planning phase for building both for-sale and rental housing for UCSB employees. Survey respondents were asked to consider a couple of potential scenarios to help in the planning of these future housing developments. Scenario 1 – Sierra Madre Apartments Employees who expressed general interest in renting University housing were shown the description below, a map, some preliminary floor plans, and some pictures of what the Sierra Madre Apartments might look like. They were then asked to evaluate their interest in renting a unit in this particular development.
The University plans to build 151 rental apartments in a six-building, three-story complex north of the West Campus Family Apartments on Storke Road, approximately 2 miles from the campus. The development will consist of two bedroom and three bedroom apartments, ranging from 900 square feet to 1,200 square feet, with washer-dryer hookups in each apartment, private patios or terraces, outdoor amenities, easy access to bike paths and walking trails, and surface parking spaces. While most of the units and buildings will be designated for student family housing, it is contemplated that some of the units or buildings could be designated as rental units for UCSB employees. While the rental rates are dependent on a number of factors, it is anticipated that monthly rents would be at least 10% below market rates.
FIGURE 20 Interest in Renting at the Sierra Madre Apartments
Base = Renters Who Are Interested in Renting University Housing (n = 785)
15% 17%
31%37%
0%
20%
40%
60%
80%
100%
Faculty (n=52)
33% Interested
70% Interested
36% 34%
16% 14%
Staff (n=733)
Extremely InterestedSomewhat InterestedNot SureNot Interested
UCSB EMPLOYEE HOUSING SURVEY – SPRING 2008 PAGE 39
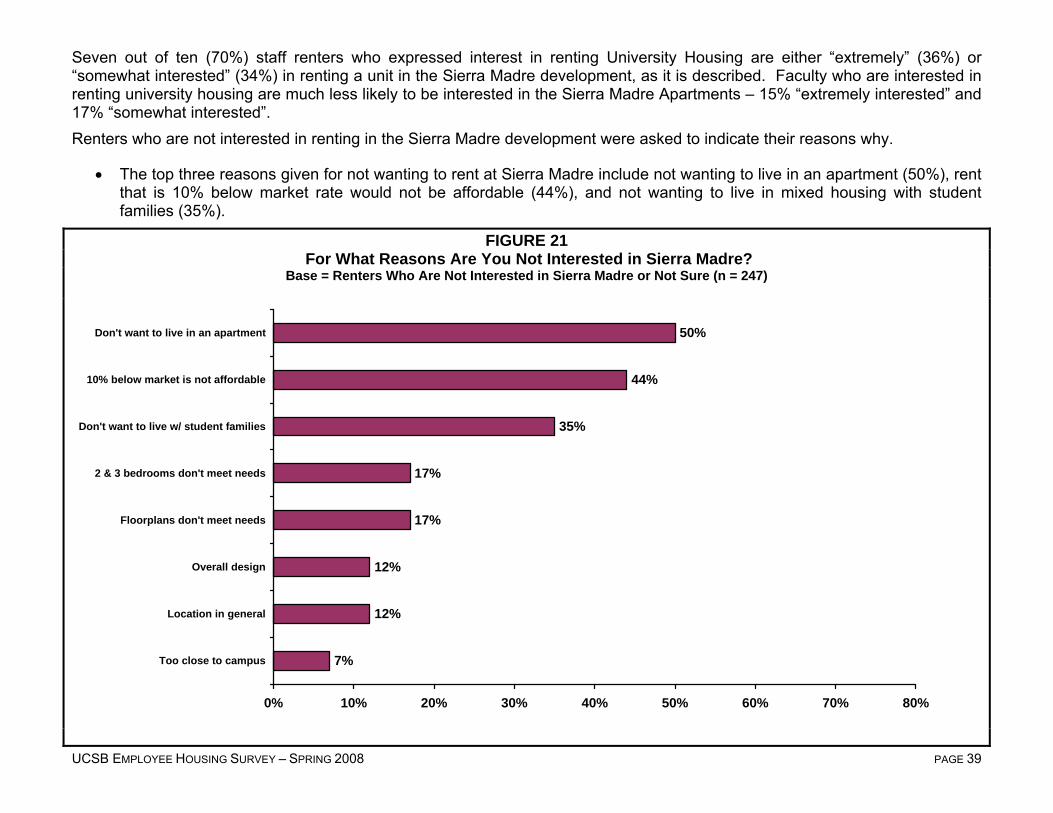
Seven out of ten (70%) staff renters who expressed interest in renting University Housing are either “extremely” (36%) or “somewhat interested” (34%) in renting a unit in the Sierra Madre development, as it is described. Faculty who are interested in renting university housing are much less likely to be interested in the Sierra Madre Apartments – 15% “extremely interested” and 17% “somewhat interested”. Renters who are not interested in renting in the Sierra Madre development were asked to indicate their reasons why.
• The top three reasons given for not wanting to rent at Sierra Madre include not wanting to live in an apartment (50%), rent that is 10% below market rate would not be affordable (44%), and not wanting to live in mixed housing with student families (35%).
FIGURE 21 For What Reasons Are You Not Interested in Sierra Madre?
Base = Renters Who Are Not Interested in Sierra Madre or Not Sure (n = 247)
7%
12%
12%
17%
17%
35%
44%
50%
0% 10% 20% 30% 40% 50% 60% 70% 80%
Too close to campus
Location in general
Overall design
Floorplans don't meet needs
2 & 3 bedrooms don't meet needs
Don't want to live w/ student families
10% below market is not affordable
Don't want to live in an apartment

UCSB EMPLOYEE HOUSING SURVEY – SPRING 2008 PAGE 40
Scenario 2 – Ocean Road Housing Employees who expressed interest in renting or purchasing University housing were shown the description below, a map, some preliminary floor plans, and some pictures of what the housing along Ocean Road might look like. Those interested in renting were then asked to evaluate their interest in renting a unit in this particular development, and those interested in purchasing were asked to evaluate their interest in purchasing a unit.
The campus is planning to develop a residential community along the western edge of the campus by Ocean Road next to Isla Vista. (see map) A series of 4 and 5 story buildings would be developed, with a mix of rental apartments and lofts, and for-sale condominiums and townhouses, creating a community of over 500 housing units. Ocean Road, currently a 4-lane road, would become a 2-lane road, with sidewalks and bicycle paths connecting Isla Vista to the campus. The ground floors of these buildings could offer a mix of residential community space, courtyards and gardens, with active public use spaces. The majority of parking for these units would be accommodated in two parking structures located across the street. It is anticipated that monthly rents for UCSB employees would be at least 10% below market rates, while the purchase prices of for-sale units would be at least 30% below market prices. It is anticipated that this development would have a mix of studio apartments, and 1-, 2-, and 3 bedrooms apartments, lofts and townhouses style units. The units will range in size from a 400 square foot studio apartment to a 1,000 square foot three-bedroom townhouse.
FIGURE 22 Interest in Renting at Ocean Road
Base = Renters Who Are Interested in Renting University Housing (n = 785)
33% 32%
14%20%
Staff (n=733)
Extremely InterestedSomewhat InterestedNot SureNot Interested
10% 13%
27%
50%
0%
20%
40%
60%
80%
100%
Faculty (n=52)
23% Interested
65% Interested

UCSB EMPLOYEE HOUSING SURVEY – SPRING 2008 PAGE 41
There is somewhat less interest in renting at Ocean Road than Sierra Madre. About two-thirds (65%) of staff renters who expressed interested in renting University housing are either “extremely” (33%) or “somewhat interested” (32%) in renting a unit in the Ocean Road housing community, as it is described. Again, faculty are much less interested – 10% “extremely interested” and 13% “somewhat interested”. Renters who are not interested in renting at Ocean Road were asked to indicate their reasons why.
• The prevailing reason given for not wanting to rent at Ocean Road is its proximity to Isla Vista – 56% are concerned about living so close to IV. Other reasons given for not wanting to rent at Ocean Road include the size of the units (31%), rent that is 10% below market rate would not be affordable (29%), location in general (28%), lack of adjacent parking (28%), the types of units offered won’t meet their needs (26%), and proximity to campus (24%).
FIGURE 23 For What Reasons Are You Not Interested in Renting at Ocean Road?
Base = Not Interested in Renting at Ocean Road or Not Sure (n = 288)
16%
16%
24%
26%
28%
28%
29%
31%
56%
0% 10% 20% 30% 40% 50% 60% 70% 80%
Overall design
Floorplans don't meet needs
Too close to campus
Unit types don't meet needs
Lack of adjacent parking
Location, in general
10% below market is not affordable
Size of units doesn't meet meeds
Don't want to live this close to IV

UCSB EMPLOYEE HOUSING SURVEY – SPRING 2008 PAGE 42
Fifty-three percent (53%) of current renters who are generally interested in purchasing University housing express a particular interest in purchasing at Ocean Road – with staff showing more interest than faculty (55% vs. 29% “very” or “somewhat interested”). Similarly, among current owners, 44% are interested in purchasing a unit at Ocean Road (47% of staff owners vs. 31% of faculty owners).
• Only 18% of current renters who initially expressed an interest in housing provided by UCSB do not find any of the particular scenarios presented in the survey to be attractive.
FIGURE 24 Interest in Purchasing at Ocean Road
28% 27%21% 24%
Staff (n=696)
Extremely InterestedSomewhat InterestedNot SureNot Interested
12%17% 18%
52%
0%
20%
40%
60%
80%
100%
Faculty (n=65)
29% Interested
55% Interested
23% 23%18%
35%
Staff (n=374)
Extremely InterestedSomewhat InterestedNot SureNot Interested
13%19%
25%
44%
0%
20%
40%
60%
80%
100%
Faculty (n=82)
31% Interested
47% Interested
Base = Renters Who Are Interested In Purchasing University Housing (n = 761)
Base = Owners Who Are Interested In Purchasing University Housing (n = 456)

UCSB EMPLOYEE HOUSING SURVEY – SPRING 2008 PAGE 43
Employees who are not interested in purchasing at Ocean Road were asked to indicate their reasons why.
• Similar to the concerns expressed about renting at Ocean Road, the prevailing reason given for not wanting to purchase a unit in this community is its proximity to Isla Vista – 59% don’t want to live this close to IV.
• Other common reasons given for not wanting to purchase at Ocean Road include the type (36%) and size (35%) of the units described, the lack of adjacent parking (32%), and location in general (31%).
FIGURE 25 For What Reasons Are You Not Interested in Purchasing at Ocean Road?
Base = Not Interested in Purchasing at Ocean Road or Not Sure (n = 619)
18%
21%
26%
31%
32%
35%
36%
59%
0% 10% 20% 30% 40% 50% 60% 70% 80%
30% below market is not affordable
Overall design
Too close to campus
Location, in general
Lack of adjacent parking
Size of units doesn't meet meeds
Unit types don't meet needs
Don't want to live this close to IV
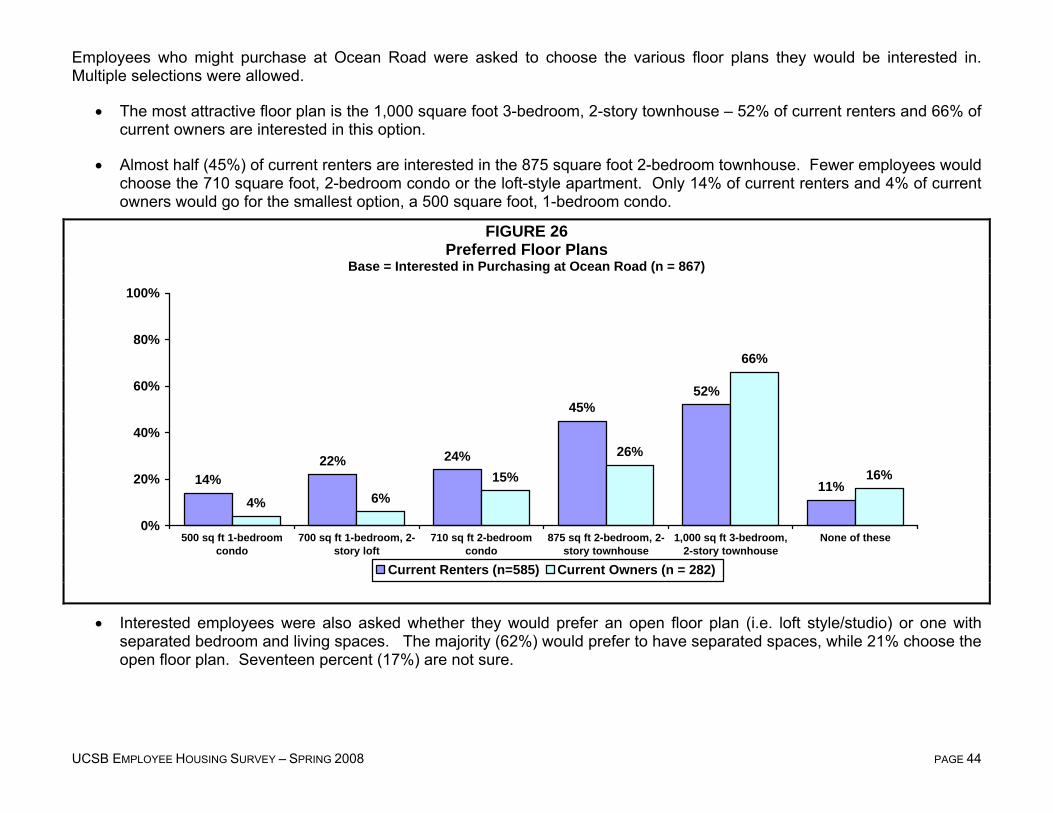
UCSB EMPLOYEE HOUSING SURVEY – SPRING 2008 PAGE 44
Employees who might purchase at Ocean Road were asked to choose the various floor plans they would be interested in. Multiple selections were allowed.
• The most attractive floor plan is the 1,000 square foot 3-bedroom, 2-story townhouse – 52% of current renters and 66% of current owners are interested in this option.
• Almost half (45%) of current renters are interested in the 875 square foot 2-bedroom townhouse. Fewer employees would choose the 710 square foot, 2-bedroom condo or the loft-style apartment. Only 14% of current renters and 4% of current owners would go for the smallest option, a 500 square foot, 1-bedroom condo.
FIGURE 26 Preferred Floor Plans
Base = Interested in Purchasing at Ocean Road (n = 867)
• Interested employees were also asked whether they would prefer an open floor plan (i.e. loft style/studio) or one with separated bedroom and living spaces. The majority (62%) would prefer to have separated spaces, while 21% choose the open floor plan. Seventeen percent (17%) are not sure.
14%22% 24%
45%52%
11%4% 6%
15%
26%
66%
16%
0%
20%
40%
60%
80%
100%
500 sq ft 1-bedroomcondo
700 sq ft 1-bedroom, 2-story loft
710 sq ft 2-bedroomcondo
875 sq ft 2-bedroom, 2-story townhouse
1,000 sq ft 3-bedroom,2-story townhouse
None of these
Current Renters (n=585) Current Owners (n = 282)

UCSB EMPLOYEE HOUSING SURVEY – SPRING 2008 PAGE 45
Looking at the demographic profile and current housing situation of employees who are “extremely interested” in the University housing options at Sierra Madre or Ocean Road reveals the following information that might help understand how to meet the needs of this group:
Table 14 Profile of “Extremely Interested” Employees by Current Ownership Status
Current Renters (n = 389) Current Owners (n = 96) • They are more likely to be single – 55% do not have
a spouse or partner. Only 24% have children at home, and 22% are in one-person households.
• They are more likely to have families – only 24% do not have a spouse or partner. 40% have children in the home, and only 10% live alone. Half (50%) have 3 or 4 household members.
• They have lower incomes – average salary is $46,350 and average household income is $57,780.
• They have moderate incomes – average salary is $61,940 and average household income is $95,530.
• They are newer employees – their average tenure is 5 ½ years on campus, and 55% have been at UCSB for 3 years or less. Their plans for the future vary - 32% are more temporary employees, planning to work on campus for no more than 5 years. On the other hand, 22% intend to continue at UCSB for over 15 years. On average, they plan to remain at UCSB for another 9 years.
• They are more settled into their jobs. They have been employed at UCSB for an average of 12 years and plan to continue working here for another 11 years, on average.
• They pay an average of $1,583 in monthly rent for their entire household, and a personal share of approximately $1,209. Utilities cost them an average of $205 per month.
• They pay an average of $2,661 in monthly housing costs. Six out of ten (60%) pay over $2,000 per month. They pay approximately $294 per month in utilities.
• About half (48%) already live relatively near campus (93117 or 93111), and another 40% live in other areas of Goleta or Santa Barbara. Only one out of ten (10%) lives in an area further North or South.
• 43% live in an area outside of Santa Barbara, such as Ventura, etc. to the South or Lompoc, etc. to the North. 30% live relatively near campus (93117 or 93111), and 24% live in other areas of Goleta or Santa Barbara.
Continued on the next page
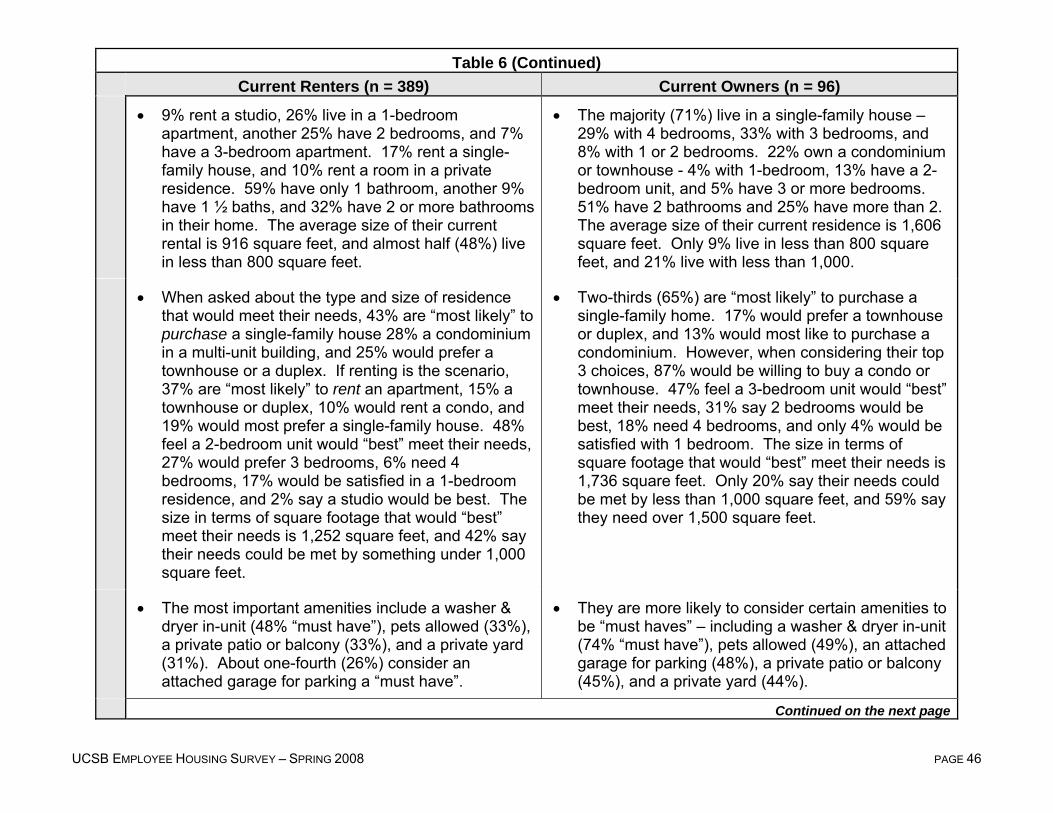
UCSB EMPLOYEE HOUSING SURVEY – SPRING 2008 PAGE 46
Table 6 (Continued) Current Renters (n = 389) Current Owners (n = 96)
• 9% rent a studio, 26% live in a 1-bedroom apartment, another 25% have 2 bedrooms, and 7% have a 3-bedroom apartment. 17% rent a single-family house, and 10% rent a room in a private residence. 59% have only 1 bathroom, another 9% have 1 ½ baths, and 32% have 2 or more bathrooms in their home. The average size of their current rental is 916 square feet, and almost half (48%) live in less than 800 square feet.
• The majority (71%) live in a single-family house – 29% with 4 bedrooms, 33% with 3 bedrooms, and 8% with 1 or 2 bedrooms. 22% own a condominium or townhouse - 4% with 1-bedroom, 13% have a 2-bedroom unit, and 5% have 3 or more bedrooms. 51% have 2 bathrooms and 25% have more than 2. The average size of their current residence is 1,606 square feet. Only 9% live in less than 800 square feet, and 21% live with less than 1,000.
• When asked about the type and size of residence that would meet their needs, 43% are “most likely” to purchase a single-family house 28% a condominium in a multi-unit building, and 25% would prefer a townhouse or a duplex. If renting is the scenario, 37% are “most likely” to rent an apartment, 15% a townhouse or duplex, 10% would rent a condo, and 19% would most prefer a single-family house. 48% feel a 2-bedroom unit would “best” meet their needs, 27% would prefer 3 bedrooms, 6% need 4 bedrooms, 17% would be satisfied in a 1-bedroom residence, and 2% say a studio would be best. The size in terms of square footage that would “best” meet their needs is 1,252 square feet, and 42% say their needs could be met by something under 1,000 square feet.
• Two-thirds (65%) are “most likely” to purchase a single-family home. 17% would prefer a townhouse or duplex, and 13% would most like to purchase a condominium. However, when considering their top 3 choices, 87% would be willing to buy a condo or townhouse. 47% feel a 3-bedroom unit would “best” meet their needs, 31% say 2 bedrooms would be best, 18% need 4 bedrooms, and only 4% would be satisfied with 1 bedroom. The size in terms of square footage that would “best” meet their needs is 1,736 square feet. Only 20% say their needs could be met by less than 1,000 square feet, and 59% say they need over 1,500 square feet.
• The most important amenities include a washer & dryer in-unit (48% “must have”), pets allowed (33%), a private patio or balcony (33%), and a private yard (31%). About one-fourth (26%) consider an attached garage for parking a “must have”.
• They are more likely to consider certain amenities to be “must haves” – including a washer & dryer in-unit (74% “must have”), pets allowed (49%), an attached garage for parking (48%), a private patio or balcony (45%), and a private yard (44%).
Continued on the next page
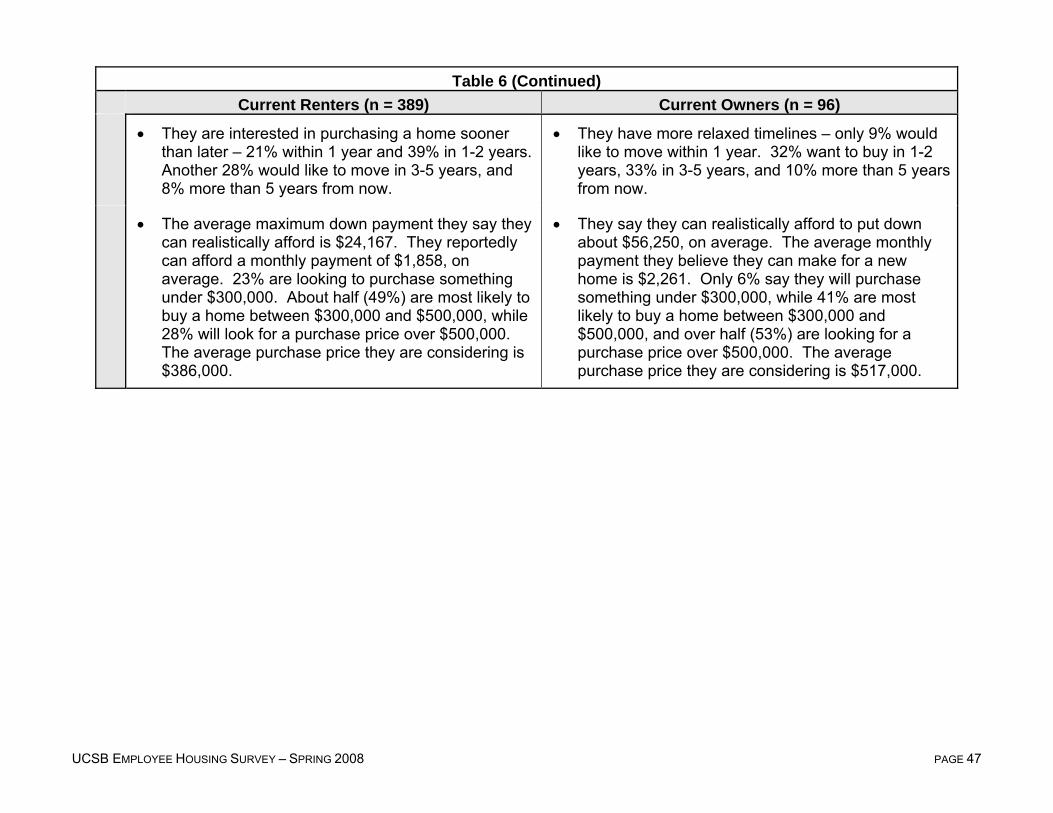
UCSB EMPLOYEE HOUSING SURVEY – SPRING 2008 PAGE 47
Table 6 (Continued)
Current Renters (n = 389) Current Owners (n = 96) • They are interested in purchasing a home sooner
than later – 21% within 1 year and 39% in 1-2 years. Another 28% would like to move in 3-5 years, and 8% more than 5 years from now.
• They have more relaxed timelines – only 9% would like to move within 1 year. 32% want to buy in 1-2 years, 33% in 3-5 years, and 10% more than 5 years from now.
• The average maximum down payment they say they can realistically afford is $24,167. They reportedly can afford a monthly payment of $1,858, on average. 23% are looking to purchase something under $300,000. About half (49%) are most likely to buy a home between $300,000 and $500,000, while 28% will look for a purchase price over $500,000. The average purchase price they are considering is $386,000.
• They say they can realistically afford to put down about $56,250, on average. The average monthly payment they believe they can make for a new home is $2,261. Only 6% say they will purchase something under $300,000, while 41% are most likely to buy a home between $300,000 and $500,000, and over half (53%) are looking for a purchase price over $500,000. The average purchase price they are considering is $517,000.
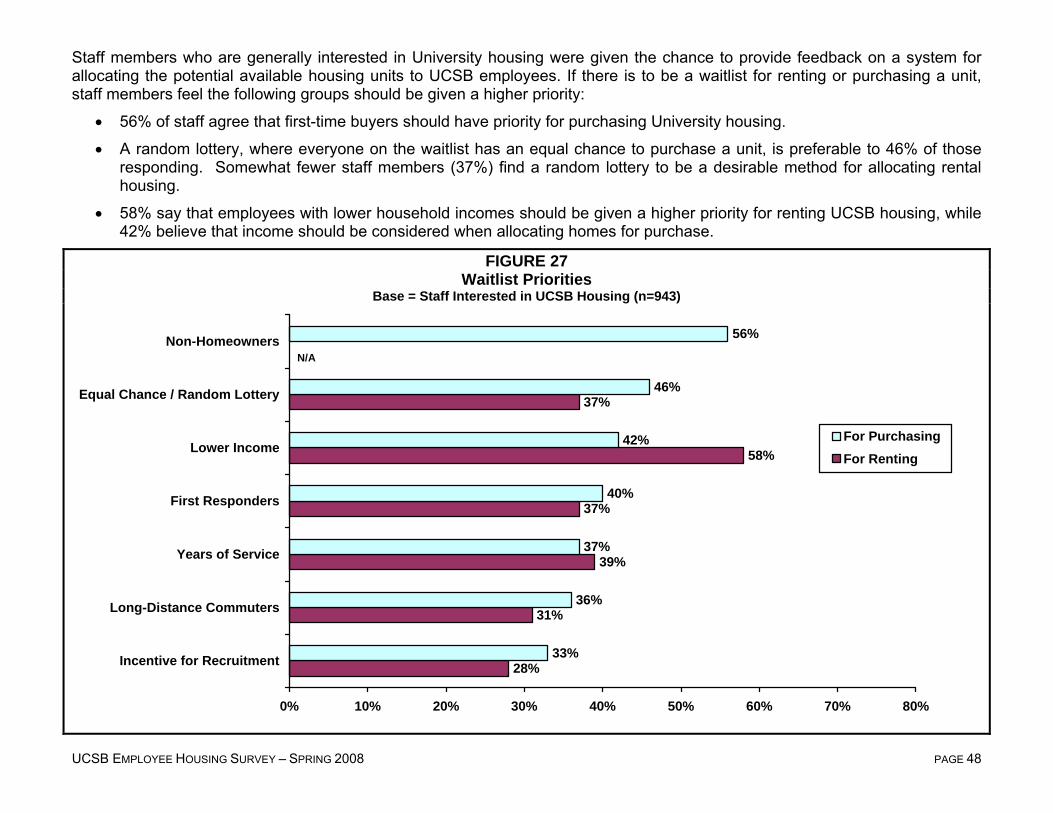
UCSB EMPLOYEE HOUSING SURVEY – SPRING 2008 PAGE 48
Staff members who are generally interested in University housing were given the chance to provide feedback on a system for allocating the potential available housing units to UCSB employees. If there is to be a waitlist for renting or purchasing a unit, staff members feel the following groups should be given a higher priority:
• 56% of staff agree that first-time buyers should have priority for purchasing University housing.
• A random lottery, where everyone on the waitlist has an equal chance to purchase a unit, is preferable to 46% of those responding. Somewhat fewer staff members (37%) find a random lottery to be a desirable method for allocating rental housing.
• 58% say that employees with lower household incomes should be given a higher priority for renting UCSB housing, while 42% believe that income should be considered when allocating homes for purchase.
FIGURE 27 Waitlist Priorities
Base = Staff Interested in UCSB Housing (n=943)
28%
31%
39%
37%
58%
37%
33%
36%
37%
40%
42%
46%
56%
0% 10% 20% 30% 40% 50% 60% 70% 80%
Incentive for Recruitment
Long-Distance Commuters
Years of Service
First Responders
Lower Income
Equal Chance / Random Lottery
Non-Homeowners
For PurchasingFor Renting
N/A
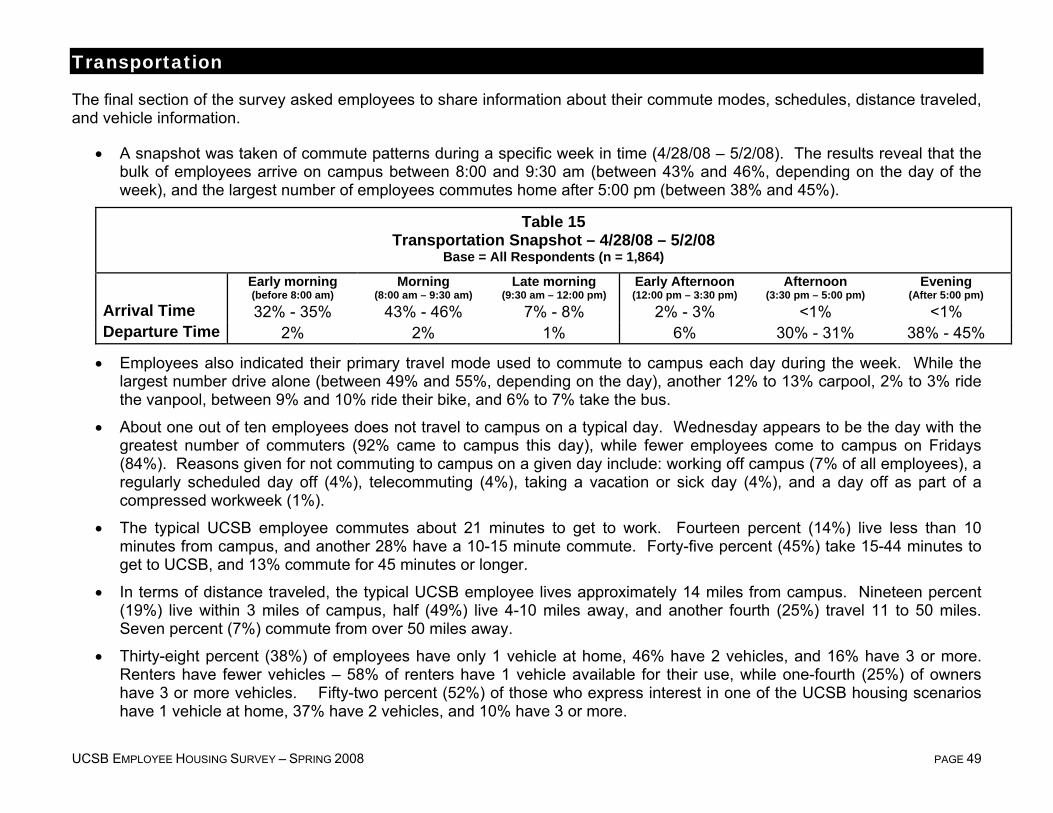
UCSB EMPLOYEE HOUSING SURVEY – SPRING 2008 PAGE 49
Transportation
The final section of the survey asked employees to share information about their commute modes, schedules, distance traveled, and vehicle information.
• A snapshot was taken of commute patterns during a specific week in time (4/28/08 – 5/2/08). The results reveal that the bulk of employees arrive on campus between 8:00 and 9:30 am (between 43% and 46%, depending on the day of the week), and the largest number of employees commutes home after 5:00 pm (between 38% and 45%).
Table 15 Transportation Snapshot – 4/28/08 – 5/2/08
Base = All Respondents (n = 1,864) Early morning
(before 8:00 am) Morning
(8:00 am – 9:30 am) Late morning
(9:30 am – 12:00 pm) Early Afternoon (12:00 pm – 3:30 pm)
Afternoon (3:30 pm – 5:00 pm)
Evening (After 5:00 pm)
Arrival Time 32% - 35% 43% - 46% 7% - 8% 2% - 3% <1% <1% Departure Time 2% 2% 1% 6% 30% - 31% 38% - 45%
• Employees also indicated their primary travel mode used to commute to campus each day during the week. While the largest number drive alone (between 49% and 55%, depending on the day), another 12% to 13% carpool, 2% to 3% ride the vanpool, between 9% and 10% ride their bike, and 6% to 7% take the bus.
• About one out of ten employees does not travel to campus on a typical day. Wednesday appears to be the day with the greatest number of commuters (92% came to campus this day), while fewer employees come to campus on Fridays (84%). Reasons given for not commuting to campus on a given day include: working off campus (7% of all employees), a regularly scheduled day off (4%), telecommuting (4%), taking a vacation or sick day (4%), and a day off as part of a compressed workweek (1%).
• The typical UCSB employee commutes about 21 minutes to get to work. Fourteen percent (14%) live less than 10 minutes from campus, and another 28% have a 10-15 minute commute. Forty-five percent (45%) take 15-44 minutes to get to UCSB, and 13% commute for 45 minutes or longer.
• In terms of distance traveled, the typical UCSB employee lives approximately 14 miles from campus. Nineteen percent (19%) live within 3 miles of campus, half (49%) live 4-10 miles away, and another fourth (25%) travel 11 to 50 miles. Seven percent (7%) commute from over 50 miles away.
• Thirty-eight percent (38%) of employees have only 1 vehicle at home, 46% have 2 vehicles, and 16% have 3 or more. Renters have fewer vehicles – 58% of renters have 1 vehicle available for their use, while one-fourth (25%) of owners have 3 or more vehicles. Fifty-two percent (52%) of those who express interest in one of the UCSB housing scenarios have 1 vehicle at home, 37% have 2 vehicles, and 10% have 3 or more.
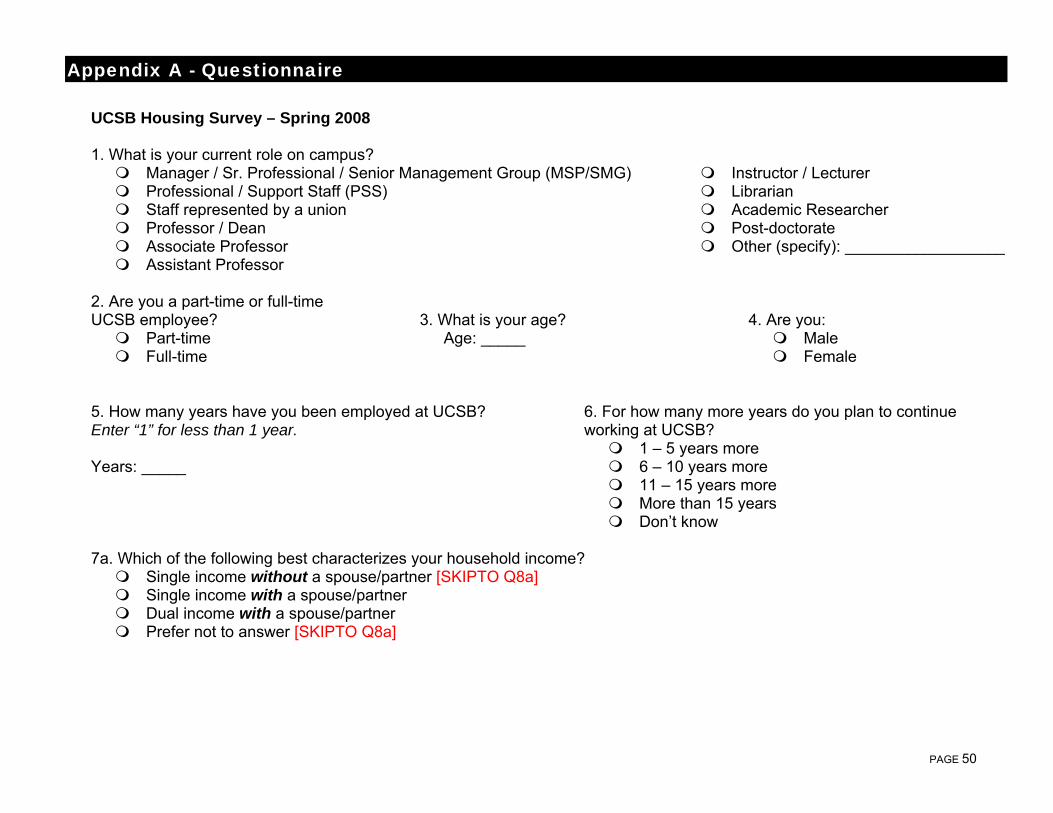
PAGE 50
Appendix A - Questionnaire
UCSB Housing Survey – Spring 2008 1. What is your current role on campus?
Manager / Sr. Professional / Senior Management Group (MSP/SMG) Professional / Support Staff (PSS) Staff represented by a union Professor / Dean Associate Professor Assistant Professor
Instructor / Lecturer Librarian
Academic Researcher Post-doctorate
Other (specify): __________________
2. Are you a part-time or full-time UCSB employee? Part-time Full-time
3. What is your age? Age: _____
4. Are you: Male Female
5. How many years have you been employed at UCSB? Enter “1” for less than 1 year. Years: _____
6. For how many more years do you plan to continue working at UCSB?
1 – 5 years more 6 – 10 years more 11 – 15 years more More than 15 years Don’t know
7a. Which of the following best characterizes your household income? Single income without a spouse/partner [SKIPTO Q8a] Single income with a spouse/partner
Dual income with a spouse/partner Prefer not to answer [SKIPTO Q8a]

PAGE 51
[IF Q7a = 2,3] 7b. Is your spouse/partner either employed by UCSB or a student at UCSB? (Mark all that apply) Yes, employed by UCSB Yes, a student at UCSB No
8a. What is your estimated annual gross personal salary, including summer salary, if applicable, per your employment with the University? Less than $30,000 $30,000 - $34,999 $35,000 - $39,999
$40,000 - $44,999 $45,000 - $49,999
$50,000 - $54,999 $55,000 - $59,999
$60,000 - $64,999 $65,000 - $69,999
$70,000 - $74,999 $75,000 - $79,999 $80,000 - $89,999 $90,000 - $99,999
$100,000 - $124,999 $125,000 - $149,999 $150,000 - $199,999 $200,000 or more Prefer not to answer
8b. What is your estimated annual gross household income, from all sources? (i.e. income for yourself, spouse/partner, and any live-in children, but not including roommate income)
Less than $30,000 $30,000 - $34,999 $35,000 - $39,999
$40,000 - $44,999 $45,000 - $49,999
$50,000 - $54,999 $55,000 - $59,999
$60,000 - $64,999 $65,000 - $69,999
$70,000 - $74,999 $75,000 - $79,999 $80,000 - $89,999 $90,000 - $99,999
$100,000 - $124,999 $125,000 - $149,999 $150,000 - $199,999 $200,000 or more Prefer not to answer
PAGE 52
Current Housing
9. Which of the following best describes your current housing status? Own Rent or lease Other (specify): ___________________________________
10. What type of housing best describes your current housing?
West Campus Point Faculty Housing Single-family detached house Apartment Condominium Townhouse Mobile home / Manufactured home Guest house / Cottage Room in a private residence Other (specify): ___________________________________
11a. How many bedrooms are there in your current residence?
Studio 1 bedroom 2 bedrooms 3 bedrooms 4 bedrooms 5 bedrooms or more
11b. And how many bathrooms?
1 1 ½ 2 2 ½ 3 or more
12. What is the approximate square footage of your current residence? sq ft: ____
Don’t Know [IF Q12 = Don’t Know]
12a. If you are not sure about the exact square footage, which of these square footage ranges best describes your current residence?
Under 600 sq ft. 600 – 800 sq ft. 801 – 1,000 sq ft. 1,001 – 1,200 sq ft. 1,201 – 1,500 sq ft.
1,501 – 1,800 sq ft. 1,801 – 2,000 sq ft. Over 2,000 sq ft. Don’t Know

PAGE 53
13. What is the total number of adults (18 or older), including yourself, living in your current residence? # of Adults: ____
[IF Q13 > 1] 14a. What is the total number of children under the age of 18 living in your current residence? # of children: ____
[IF Q14a > 0]
14b. How many are: Under 2 years old? _____ Between 2 years and 5 years old? _____ Between 5 years and 10 years old? ____ Between 11 years and 15 years old? _____ Over 15 years old? ____
14c. Which of the following early childhood care and education programs do you currently use for your family? (mark all that apply)
UCSB infant/toddler care (Orfalea Family Children's Center or University Children's Center) UCSB preschool (Orfalea Family Children's Center) UCSB After School Program Other infant/toddler care Other preschool Other after school care None of the above
14d. Which of the following early childhood care and education programs do you currently need but do not use? (mark all that apply)
Infant/Toddler care: Why not? ___________________ Preschool: Why not? ___________________ After school care: Why not? ___________________ None of the above
14e. Are any of your children currently on the waitlist for UCSB’s childcare centers? Yes: Child’s age and length of time on waitlist? _______________ No 14f. Which of the following early childhood care and education programs would you be likely to use if a spot was currently available at UCSB’s childcare centers? (mark all that apply)
UCSB infant/toddler care UCSB preschool UCSB After School Program None of the above
PAGE 54
[RENTERS, Q9=2] 15a. What is the estimated monthly rent for your entire household? $ ______ 15b. Do you split the cost of rent with roommates? Yes No [SKIP TO Q17]
[IF Q15b = Yes]
15c. What is your personal share of the monthly rent? $ ______
[OWNERS, Q9=1] 16. What is your current household’s monthly housing cost (for you, your spouse/partner, and children, but not including additional roommates)? Monthly housing cost would include mortgage payment, property taxes, property insurance, and association dues, but not utilities. $ ______ 17. What is your current household’s estimated average monthly cost for utilities? $ ______ 18a. How many years have you lived in your current residence? Enter “1” for less than 1 year.
Years: ____ 18b. How many years have you lived in the Santa Barbara/Central Coast area? Enter “1” for less than 1 year. Years: ____ 19. What is the ZIP code at your current residence? ZIP code _________ 20. How satisfied are you with your current housing situation overall? Very satisfied Somewhat satisfied Neutral Somewhat dissatisfied Very dissatisfied
PAGE 55
21. How satisfied are you with the following aspects of your current residence?
Very satisfied
Somewhat satisfied
Neutral Somewhat dissatisfied
Very dissatisfied
a. Type of housing b. Size of housing c. Cost of housing d. Quality of housing e. Surrounding neighborhood
f. Proximity of housing to campus
22. Does the type and size of your current residence meet your current housing needs? Yes
No Not sure
23. Which of the following amenities are provided at your current residence? (mark all that apply)
Washer/dryer in-residence Washer/dryer hook-ups Dishwasher Garbage disposal
Stove Refrigerator Private bathroom Fireplace Private patio/balcony
Private yard Garage Carport Additional storage space Swimming pool Gym Clubhouse
Walking distance to bus line Pets allowed
[RENTERS, Q9=2] 24. How would you describe the value of your current residence for the price you are paying? Excellent value
Above average value Average value Below average value Poor value
PAGE 56
25. How would you describe the condition of your current residence (physical condition of the interior, exterior, amenities, etc.)? Excellent condition
Above average condition Average condition Below average condition Poor condition
26. Is there anything else you would like to share or describe about your current housing situation? ______________________________________________________________ ______________________________________________________________ [RENTERS, Q9=2] 27. How important is it to you to own your own home/condo/etc.? Extremely important Somewhat important Neutral Not very important Not at all important
[RENTERS, Q9=2] 28. How likely is it that you will be able to purchase a home/condo/etc. while you are employed at UCSB? Very likely Somewhat likely Not sure Not very likely Not at all likely
[RENTERS, Q9=2] 29. Are you seriously considering leaving your job at UCSB if you are unable to purchase a home/condo/etc. in the area? Definitely yes Probably yes Not sure Probably no Definitely no
[CONSIDERING LEAVING, Q29=1,2,3] 30. If you are unable to purchase a home/condo/etc. in the area, would you consider staying at UCSB if given the opportunity to rent university-owned housing close to campus at affordable (below market) rents? Definitely yes Probably yes Not sure
Probably no Definitely no
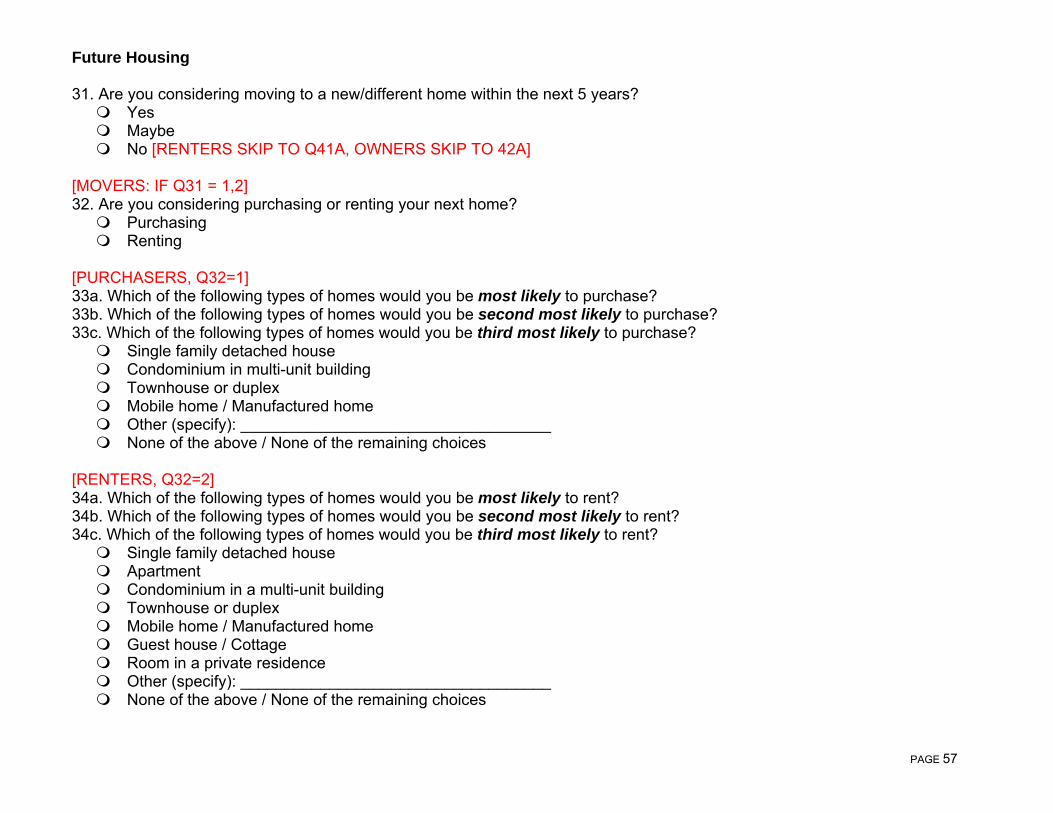
PAGE 57
Future Housing 31. Are you considering moving to a new/different home within the next 5 years?
Yes Maybe
No [RENTERS SKIP TO Q41A, OWNERS SKIP TO 42A] [MOVERS: IF Q31 = 1,2] 32. Are you considering purchasing or renting your next home? Purchasing Renting [PURCHASERS, Q32=1] 33a. Which of the following types of homes would you be most likely to purchase? 33b. Which of the following types of homes would you be second most likely to purchase? 33c. Which of the following types of homes would you be third most likely to purchase?
Single family detached house Condominium in multi-unit building Townhouse or duplex Mobile home / Manufactured home Other (specify): ___________________________________ None of the above / None of the remaining choices
[RENTERS, Q32=2] 34a. Which of the following types of homes would you be most likely to rent?
34b. Which of the following types of homes would you be second most likely to rent? 34c. Which of the following types of homes would you be third most likely to rent?
Single family detached house Apartment Condominium in a multi-unit building Townhouse or duplex Mobile home / Manufactured home Guest house / Cottage Room in a private residence Other (specify): ___________________________________ None of the above / None of the remaining choices
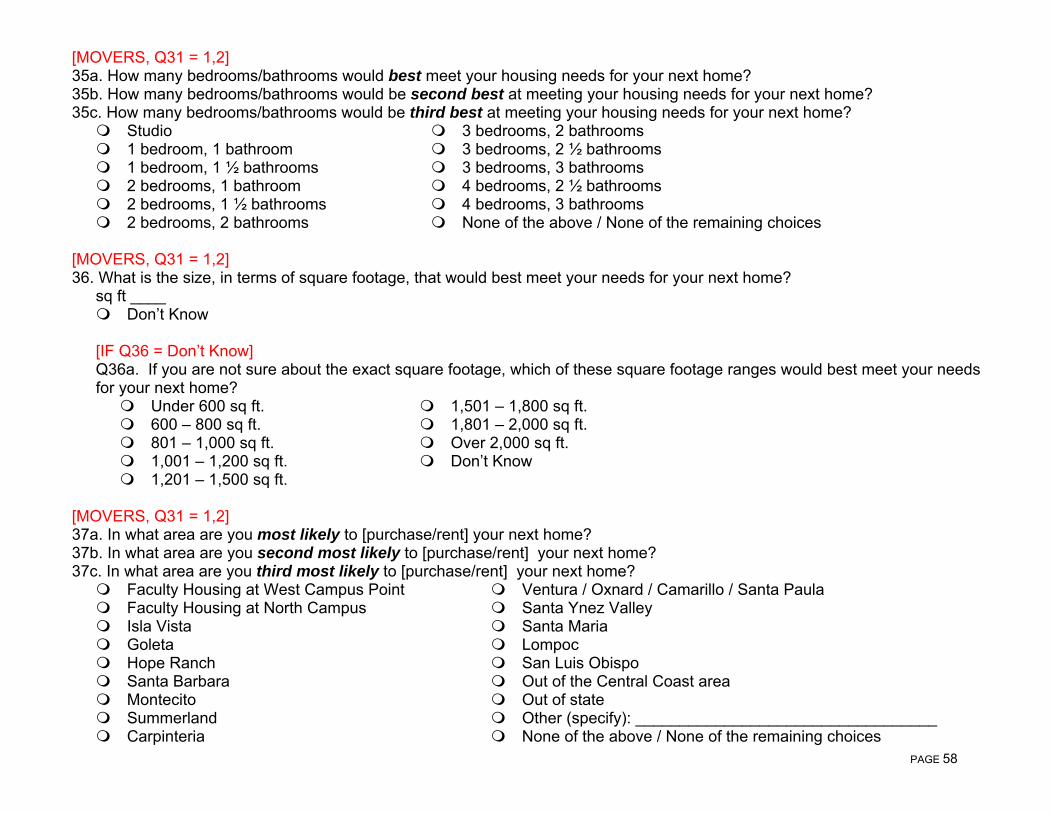
PAGE 58
[MOVERS, Q31 = 1,2] 35a. How many bedrooms/bathrooms would best meet your housing needs for your next home? 35b. How many bedrooms/bathrooms would be second best at meeting your housing needs for your next home? 35c. How many bedrooms/bathrooms would be third best at meeting your housing needs for your next home?
Studio 1 bedroom, 1 bathroom 1 bedroom, 1 ½ bathrooms 2 bedrooms, 1 bathroom 2 bedrooms, 1 ½ bathrooms 2 bedrooms, 2 bathrooms
3 bedrooms, 2 bathrooms 3 bedrooms, 2 ½ bathrooms 3 bedrooms, 3 bathrooms 4 bedrooms, 2 ½ bathrooms 4 bedrooms, 3 bathrooms None of the above / None of the remaining choices
[MOVERS, Q31 = 1,2] 36. What is the size, in terms of square footage, that would best meet your needs for your next home? sq ft ____
Don’t Know [IF Q36 = Don’t Know]
Q36a. If you are not sure about the exact square footage, which of these square footage ranges would best meet your needs for your next home?
Under 600 sq ft. 600 – 800 sq ft. 801 – 1,000 sq ft. 1,001 – 1,200 sq ft. 1,201 – 1,500 sq ft.
1,501 – 1,800 sq ft. 1,801 – 2,000 sq ft. Over 2,000 sq ft. Don’t Know
[MOVERS, Q31 = 1,2] 37a. In what area are you most likely to [purchase/rent] your next home? 37b. In what area are you second most likely to [purchase/rent] your next home? 37c. In what area are you third most likely to [purchase/rent] your next home?
Faculty Housing at West Campus Point Faculty Housing at North Campus Isla Vista Goleta Hope Ranch Santa Barbara Montecito Summerland Carpinteria
Ventura / Oxnard / Camarillo / Santa Paula Santa Ynez Valley Santa Maria Lompoc San Luis Obispo Out of the Central Coast area Out of state Other (specify): __________________________________ None of the above / None of the remaining choices

PAGE 59
[PURCHASERS, Q32=1] 38. Ideally, how soon would you like to purchase a home? Within 1 year In 1-2 years In 3-5 years More than 5 years from now Don’t Know [PURCHASERS, Q32=1] 39a. What is the maximum amount that you could realistically afford to spend on a down payment for your next home? Less than $5,000 $5,000 - $9,999 $10,000 - $19,999 $20,000 - $29,999 $30,000 - $39,999 $40,000 - $49,999 $50,000 - $74,999
$75,000 - $99,999 $100,000 - $149,999 $150,000 - $199,999 $200,000 - $249,999 $250,000 or more Don’t know
[PURCHASERS, Q32=1] 39b. What is the maximum amount, per month, that you could realistically afford to spend on your next home? (Monthly housing costs would include mortgage payments, property taxes, property insurance, association dues, etc., but excluding utilities) Less than $1,000 $1,000 - $1,499 $1,500 - $1,999 $2,000 - $2,499
$2,500 - $2,999 $3,000 - $3,499 $3,500 or more Don’t know
[PURCHASERS, Q32=1] 39c. In which of the following price ranges are you most likely to purchase a home? Less than $300,000 $300,000-$399,999 $400,000-$499,999 $500,000-$549,999 $550,000 - $599,999 $600,000 - $649,999
$650,000 - $699,999 $700,000 - $799,999 $800,000 - $899,999 $900,000 - $999,999 $1,000,000 or more
Don’t know
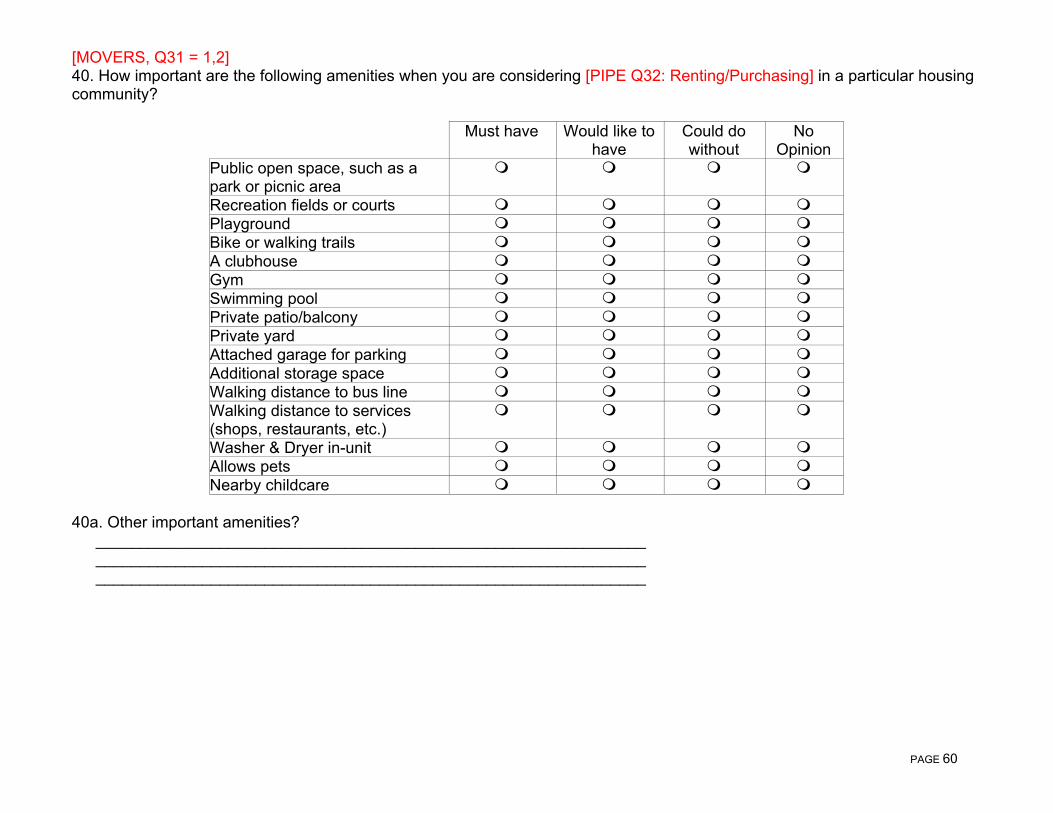
PAGE 60
[MOVERS, Q31 = 1,2] 40. How important are the following amenities when you are considering [PIPE Q32: Renting/Purchasing] in a particular housing community?
Must have Would like to have
Could do without
No Opinion
Public open space, such as a park or picnic area
Recreation fields or courts Playground Bike or walking trails A clubhouse Gym Swimming pool Private patio/balcony Private yard Attached garage for parking Additional storage space Walking distance to bus line Walking distance to services (shops, restaurants, etc.)
Washer & Dryer in-unit Allows pets Nearby childcare
40a. Other important amenities? ______________________________________________________________ ______________________________________________________________ ______________________________________________________________

PAGE 61
[RENTERS, Q9=2] 41a. If UCSB were to build and offer various affordable housing options (i.e. where rent would be below the market rate) within 2 miles of the main campus, how interested would you be in renting this type of housing? Extremely interested Somewhat interested Not sure Not very interested Not at all interested [IF INTERESTED, Q41a = 1,2,3] 41b. What does “affordable housing” mean to you in terms of how far the monthly rent is below market rate for a similar unit? At least . . .
10% below market rate 15% below market rate 20% below market rate 30% below market rate Other: specify _________________________
[IF NOT INTERESTED, Q41a = 3,4,5] 41c. For what reasons are you not interested in renting this type of housing? (optional) _______________________________________________________________ [ALL RESPONDENTS] 42a. If UCSB were to build and offer various affordable housing options (i.e. where the purchase price and resale price would be below market value) within 2 miles of the main campus, how interested would you be in purchasing this type of housing? Extremely interested Somewhat interested Not sure Not very interested Not at all interested
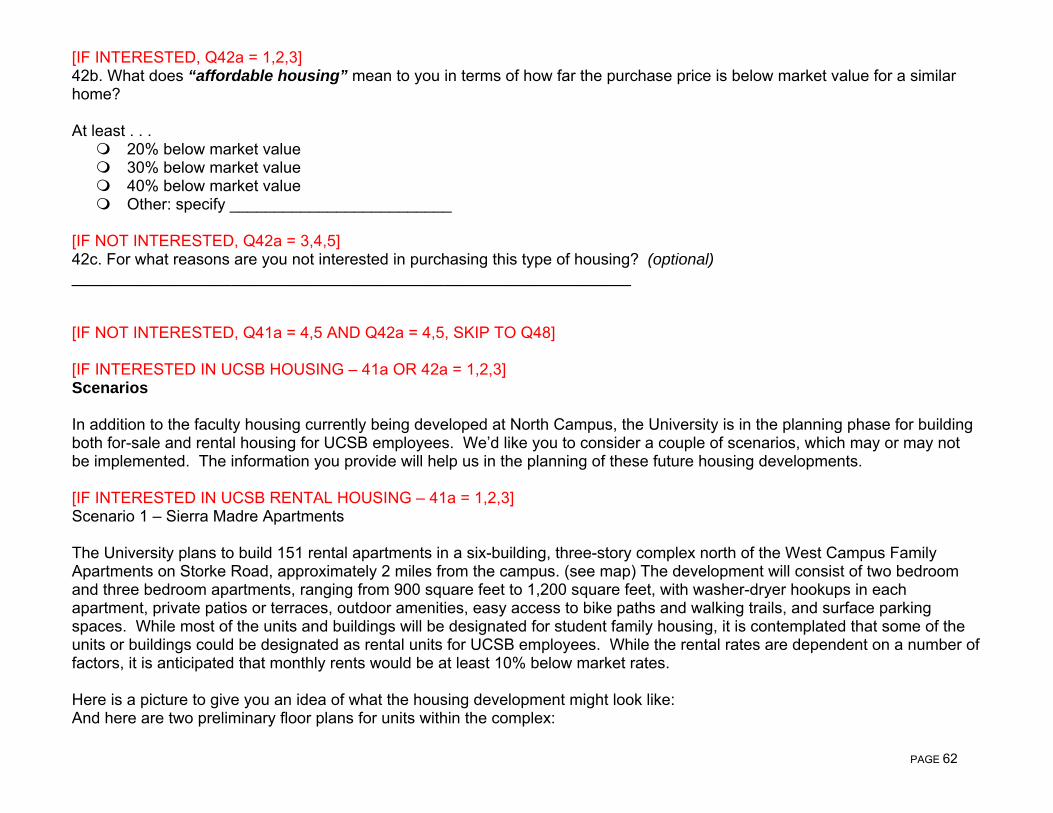
PAGE 62
[IF INTERESTED, Q42a = 1,2,3] 42b. What does “affordable housing” mean to you in terms of how far the purchase price is below market value for a similar home? At least . . .
20% below market value 30% below market value 40% below market value Other: specify _________________________
[IF NOT INTERESTED, Q42a = 3,4,5] 42c. For what reasons are you not interested in purchasing this type of housing? (optional) _______________________________________________________________ [IF NOT INTERESTED, Q41a = 4,5 AND Q42a = 4,5, SKIP TO Q48] [IF INTERESTED IN UCSB HOUSING – 41a OR 42a = 1,2,3] Scenarios In addition to the faculty housing currently being developed at North Campus, the University is in the planning phase for building both for-sale and rental housing for UCSB employees. We’d like you to consider a couple of scenarios, which may or may not be implemented. The information you provide will help us in the planning of these future housing developments. [IF INTERESTED IN UCSB RENTAL HOUSING – 41a = 1,2,3] Scenario 1 – Sierra Madre Apartments The University plans to build 151 rental apartments in a six-building, three-story complex north of the West Campus Family Apartments on Storke Road, approximately 2 miles from the campus. (see map) The development will consist of two bedroom and three bedroom apartments, ranging from 900 square feet to 1,200 square feet, with washer-dryer hookups in each apartment, private patios or terraces, outdoor amenities, easy access to bike paths and walking trails, and surface parking spaces. While most of the units and buildings will be designated for student family housing, it is contemplated that some of the units or buildings could be designated as rental units for UCSB employees. While the rental rates are dependent on a number of factors, it is anticipated that monthly rents would be at least 10% below market rates. Here is a picture to give you an idea of what the housing development might look like: And here are two preliminary floor plans for units within the complex:
PAGE 63
43a. If the University were to develop this type of housing, how interested would you be in renting a unit in this development? Extremely interested Somewhat interested Not sure Not very interested Not at all interested [IF NOT INTERESTED IN SIERRA MADRE, Q43a = 3,4,5] 43b. For what reasons are you not interested in renting a unit in this housing complex? (mark all that apply)
Don’t want to live this close to campus Don’t want to live in an apartment complex Don’t want to live in mixed housing with student families 2 and 3 bedroom units don’t meet my needs Location is not desirable/doesn’t meet my needs Overall design of the community pictured/described Floorplans don’t meet my needs Rent that is 10% below market rate is not affordable to me Other: specify _____________________
[IF INTERESTED IN UCSB HOUSING – 41a OR 42a = 1,2,3] Scenario 2 – Ocean Road Housing The campus is planning to develop a residential community along the western edge of the campus by Ocean Road next to Isla Vista. (see map) A series of 4 and 5 story buildings would be developed, with a mix of rental apartments and lofts, and for-sale condominiums and townhouses, creating a community of over 500 housing units. Ocean Road, currently a 4-lane road, would become a 2-lane road, with sidewalks and bicycle paths connecting Isla Vista to the campus. The ground floors of these buildings could offer a mix of residential community space, courtyards and gardens, with active public use spaces. The majority of parking for these units would be accommodated in two parking structures located across the street. It is anticipated that monthly rents for UCSB employees would be at least 10% below market rates, while the purchase prices of for-sale units would be at least 30% below market prices. It is anticipated that this development would have a mix of studio apartments, and 1-, 2-, and 3 bedrooms apartments, lofts and townhouses style units. The units will range in size from a 400 square foot studio apartment to a 1,000 square foot three-bedroom townhouse. Here is a picture to give you an idea of what the potential housing complex might look like: And here are several possible floor plans for units within the development:
PAGE 64
44a. If the University were to develop this type of housing along Ocean Road, how interested would you be in renting a unit in this housing development? Extremely interested Somewhat interested Not sure Not very interested Not at all interested [IF NOT INTERESTED IN OCEAN ROAD RENTAL HOUSING, Q44a = 3,4,5] 44b. For what reasons are you not interested in renting a unit in this housing community? (mark all that apply)
Don’t want to live this close to campus Don’t want to live this close to Isla Vista Location, in general Overall design of the community pictured/described The types of housing units described don’t meet my needs The size of the units described don’t meet my needs Floorplans don’t meet my needs Lack of adjacent parking Rent that is 10% below market rate is not affordable to me Other: specify _____________________
[IF NOT INTERESTED IN OCEAN ROAD RENTAL HOUSING, Q44a = 3,4,5, SKIP TO Q46] [IF INTERESTED IN UCSB FOR-SALE HOUSING – 42a = 1,2,3] 45a. If the University were to develop this type of housing along Ocean Road, how interested would you be in purchasing a unit in this development? Extremely interested Somewhat interested Not sure Not very interested Not at all interested

PAGE 65
[IF NOT INTERESTED IN OCEAN ROAD FOR-SALE HOUSING, Q45a = 3,4,5] 45b. For what reasons are you not interested in purchasing a unit in this housing community? (mark all that apply)
Don’t want to live this close to campus Don’t want to live this close to Isla Vista Location, in general Overall design of the community pictured/described The types of housing units described don’t meet my needs The size of the units described don’t meet my needs Floorplans don’t meet my needs Lack of adjacent parking Purchase price that is 30% below market value is not affordable to me Other: specify _____________________
[IF NOT INTERESTED IN OCEAN ROAD FOR-SALE HOUSING, Q45a = 3,4,5, SKIP TO Q46] [IF INTERESTED IN OCEAN ROAD FOR-SALE HOUSING, 45A = 1,2,3] Here are five possible floor plans for units within the Ocean Road housing development: 45c. Which of the units depicted above would you be interested in purchasing? Please select all that apply.
A) 500 square foot one-bedroom condominium B) 700 square foot, two-story, one bedroom, loft style unit C) 710 square foot two-bedroom condominium D) 875 square foot two-bedroom, two-story townhouse style unit E) 1,000 square foot three-bedroom, two-story townhouse style unit None of the above [SKIP TO 46]
[IF Q45c = 1-5] 45d. If you were to purchase a unit under 1,000 square feet, would you prefer an open floor plan (i.e. loft style/studio) or one with separated bedroom and living spaces? Open floor plan Separated bedroom and living spaces Not sure Not interested in purchasing a unit under 1,000 square feet 46. Do you have any additional comments about housing plans for UCSB employees? ______________________________________________________________
PAGE 66
[STAFF ONLY] [INTERESTED IN RENTING/PURCHASING – 42a = 1,2,3 OR 42b = 1,2,3] 47. If there was a waitlist for [PIPE Q32: renting/purchasing] university-owned housing, and the university had to come up with a system for deciding how to allocate the available housing units to UCSB employees, how would you feel about the following priorities? [RANDOMIZE ROWS] Yes No Not Surea. Do you think UCSB First Responders (UCSB police, firefighters, emergency medical technicians) should have a higher priority?
b. Do you think those with lower household incomes should have a higher priority? c. Do you think those with the most years of UCSB service should have a higher priority? d. Do you think everyone on the waitlist should have an equal chance, i.e. completely random selection?
e. Do you think current long-distance commuters should have a higher priority? f. Do you think priority for housing should be used as an incentive to recruit employees (to become eligible after passing one’s probation period)?
g. Do you think employees who do not already own a home should have a higher priority? 47h. Do you have any additional comments about a priority system for employee housing? ______________________________________________________________ Transportation 48. How many motor vehicles do you have available for your family's use at your current residence? vehicles ____ 49. What is your usual one-way travel time in minutes from your residence to UCSB? minutes ____ 50. Approximately how many miles do you commute one-way from your residence to UCSB? miles ____
PAGE 67
When answering the following questions about your commute, please think specifically about your commute during the week of April 28th – May 2nd 2008. 51a. What time did you arrive at work each day the week of 04/28/08 – 05/02/08? Mark one for each day of the week.
Monday Tuesday Wednesday Thursday Friday Early morning (before 8:00 a.m.) Morning (8:00 a.m. – 9:30 a.m.) Late morning (9:30 a.m. – 12:00 p.m.)
Early afternoon (12:00 p.m. – 3:30 p.m.)
Afternoon (3:30 p.m. – 5:00 p.m.)
Evening (After 5:00 p.m.) Did not travel to campus / did not work
51b. What time did you leave work each day the week of 04/28/08 – 05/02/08? Mark one for each day of the week.
Monday Tuesday Wednesday Thursday Friday Early morning (before 8:00 a.m.) Morning (8:00 a.m. – 9:30 a.m.) Late morning (9:30 a.m. – 12:00 p.m.)
Early afternoon (12:00 p.m. – 3:30 p.m.)
Afternoon (3:30 p.m. – 5:00 p.m.)
Evening (After 5:00 p.m.) Did not travel to campus / did not work
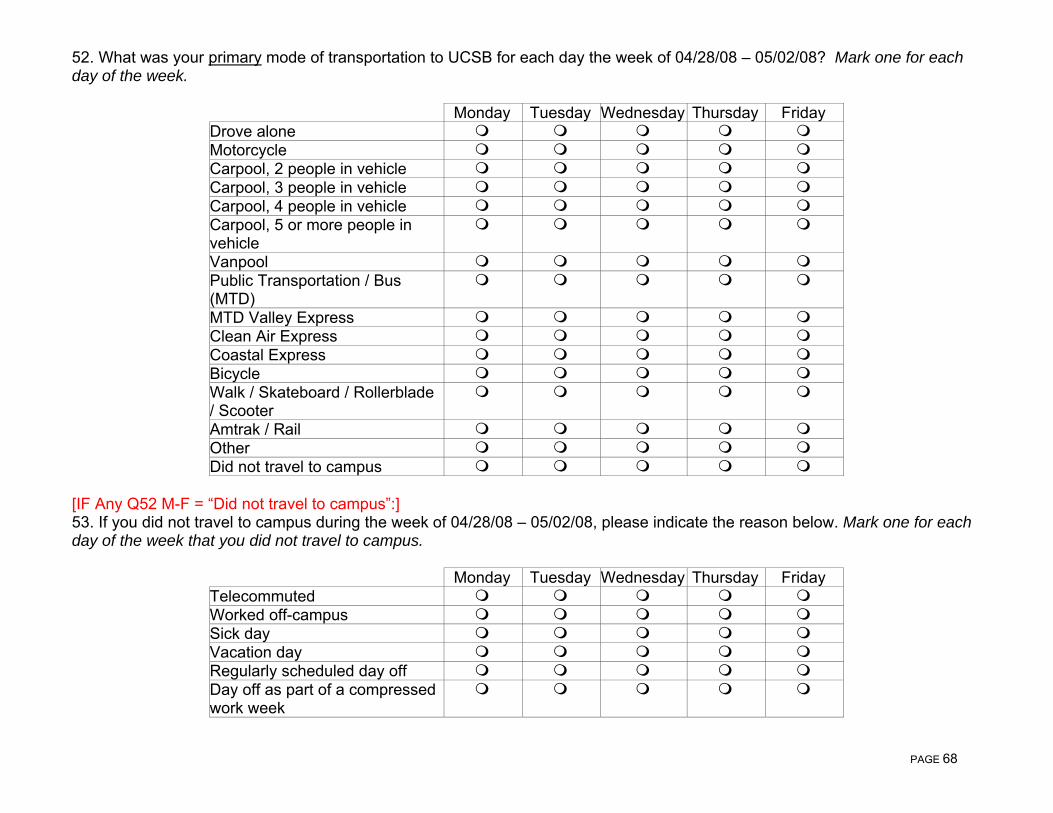
PAGE 68
52. What was your primary mode of transportation to UCSB for each day the week of 04/28/08 – 05/02/08? Mark one for each day of the week.
Monday Tuesday Wednesday Thursday Friday Drove alone Motorcycle Carpool, 2 people in vehicle Carpool, 3 people in vehicle Carpool, 4 people in vehicle Carpool, 5 or more people in vehicle
Vanpool Public Transportation / Bus (MTD)
MTD Valley Express Clean Air Express Coastal Express Bicycle Walk / Skateboard / Rollerblade / Scooter
Amtrak / Rail Other Did not travel to campus
[IF Any Q52 M-F = “Did not travel to campus”:] 53. If you did not travel to campus during the week of 04/28/08 – 05/02/08, please indicate the reason below. Mark one for each day of the week that you did not travel to campus.
Monday Tuesday Wednesday Thursday Friday Telecommuted Worked off-campus Sick day Vacation day Regularly scheduled day off Day off as part of a compressed work week
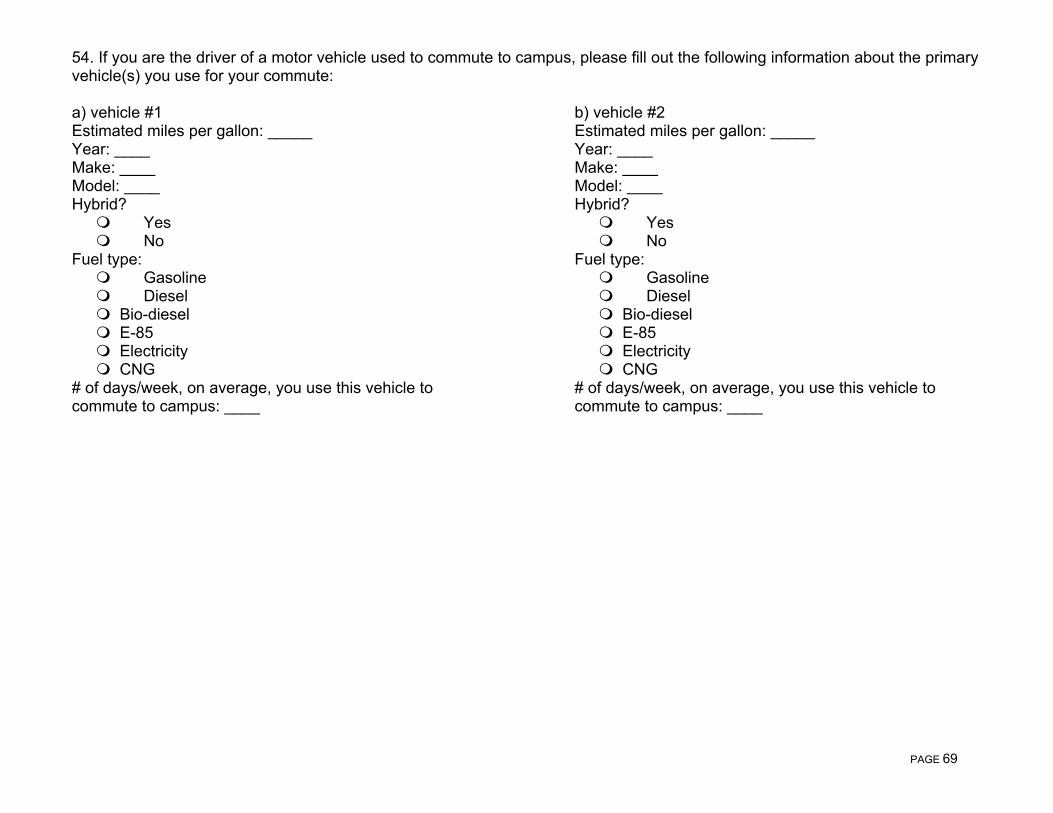
PAGE 69
54. If you are the driver of a motor vehicle used to commute to campus, please fill out the following information about the primary vehicle(s) you use for your commute: a) vehicle #1 Estimated miles per gallon: _____ Year: ____ Make: ____ Model: ____ Hybrid? Yes No Fuel type: Gasoline Diesel
Bio-diesel E-85 Electricity CNG
# of days/week, on average, you use this vehicle to commute to campus: ____
b) vehicle #2 Estimated miles per gallon: _____ Year: ____ Make: ____ Model: ____ Hybrid? Yes No Fuel type: Gasoline Diesel
Bio-diesel E-85 Electricity CNG
# of days/week, on average, you use this vehicle to commute to campus: ____

PAGE 70