hwbdocuments.env.nm.gov Isolation Pil… · Web viewhwbdocuments.env.nm.gov

•
~ .. -...
UCRi..-10- 110051
Possible Differences in Biological Availability of Isotopes of
Plutonium: Report of a Workshop
Edited by J.R. Kercher
G.M. Gallegos
Contributions by: LR. Anspaugh, LR. Bauer, E.H. Essington, R.O. Gilbert, T.E. Hakanson, W.C H.mson,
S. lbt~ J.R. Kerchrr, CA. Little and R.G. Schreckhise
Thla paper wu pnpand for Nevada Op~tionJ Office, U.S. Department of EnUJY, La V~u, NV, Workshop 28-29 AUC 1990.
September 1993
Tht. t. an informal ~ l•tndl4 pri .. riJy fer lntfl'UI or llalted e•tft'ftai dittribution. The opinioN au condualoN 1U1ted an th- of the author and
atay or may not be th- of the t..bontory. Work pt'rformed under Lite ••ptC'II of liM U.S. tnpanment of En"'TY by the t...w~nc• linrmo~ Natioul t.abontory undn Contract W-7WS.E.nn-4&.
\ \11\1\ \\U\ 1\U\ 11\\1\\11\ 1\\\\11\ 11525
~ ..
-
. ·tt\'ttv medtan stokes dti'..meter 1 :\~1SD ''! r, l :-:>:T' •.. t:r. .1 .... 'eumt:>trtc standard .l..... ~
Jevtation \GSD) ot 1.3. 6" .. l)t the acu·ttv r .. 1..:1 .1r .. ·\\1SD ,): ; ·:3 mrr. :GSD =:: 7), and
:ne rematntng 0.1': .. passed through .1 L) l·mm tJ!ter
The relattve plant uptake ni ~)QPu ,11 the r,;t~.1tt' ::-eatment ~.1mpies were
,:,"\tiStiC'Illy htsher (:\ = \) 015. n = :,) th,"\n trw ox:dc :r.:.itment rl.H\!5 The mtrate
~reiltment plant uptake values \vert a t.1ctor or ll.' t,) :.>::: greate~ than the oxtde
~reatment plant uptake vaiues tor the three growml; ~easons that the expenment
~:u1 . The plant uptake values tor both chemtcal forms ·.-..ere h1ghest the itrst growmg
~eason and reduced by tactors of ::: :o 50 dunng the ~econd and thtrd harvests.
Brown and Mcfarlane (1978) conducted exper1menrs w1th alialfa. lettuce. and
radtshes that were grown m sod that had been .1mended with monodispersed
:J8Pu02 parttcles (GMD = 0.32 mm) Thetr uptake \','\lues v.:ere stmtlar to those tn
w·hlch more soluble forms of plutomum te g . .:helate-complexed plutomum) had
been cldded to the sot!. These results are contrarv to the Ctne and Schreckhise (1987)
;'.:'SUits tor ::J9puo~ However. the rots .ust'd. II"\ tr.e Brown nnd ~1cFarlane (1978)
~tudv mav have enhanced the upt.ike \','\lues Or. :r .. ~ r:11~ht :nd1cJtP a d1fference 1n
:::-:e phyto~vadnbtlity oi ~~~~PuO:: vs ~~9p~•O:: Adams et ,11 (1975) ,,mended \'Mious tvpt>'> t11 ..,,)tl '' tth l'tlht•r 1(10-mm-dtameter
:.11\Pu02 mtcrosphere!> 0r ,1 2 J~Pu(:'\J01)4 :>ul·Jttun -.;lHnt• ,l: the ~J 4 Pu(N03)4
amended sods were hented to JOO or 'l00°C :o rom"rt tht> plutontum to the oxide
torm Analyses of lettuce. oats. and barlev brown 1n thl? .1mended sotls showed that
the relat1ve plant uptake values were L' nhea ted .· 100"C > 400°C > ~3RPu02
m1crospheres Simply heat1n~ the sot! m.1y not h.we converted the plutontum to
the oxtde form .1nd may have affected the soli \vh1ch mav h.n·e 1n turn affected the
plant uptake values The 100 .. 1-!m microspheres Me much l.uger th;m used tn other
-studtes and mav have also affected the pl.1nt upt.ih '.1ItH'
Revtew of Nevetda TE·st Site Studies
E.H. Essmgton Llrtd R 0 Cll/1crt
Environmental Setting at the Nevada Test Site
Sources of plutoruum on the Nevada Test S1te 1\:TS) mclude both nuclear event
explosiOns and nonnucleu, high-explostve safetv <>hots The expenment that
dtspersed plutomum tn Area-13 of !\.'TS was " s1ngle. non-nuclear exploston of a
nuclear dev1ce. Pluton1um was dispersed over .1 l1mtted .1re,1 w1th lcuger pieces of
tlte dev1ce betn~ depO!>Ited clost> to tht.> ~round Z.l'ro (~~Zi ,1nd :,n·all parttclt!s bemg
depostted Luther .Hv<w lnvestJgatJOn ot the comtruct10n and components of the
devtce tndicated that maten.,ls d1spersed from thP devtet> would likely exhibit a
smgle ~39pu;23Rpu rat1o Generallv. plutomum used 1n safetv tests of nuclear
Jev1ces wi\s ot one 1sotop1c dtstnbut1on <Hid the \'Mious 1sotopes were mtimately
m1xed throughout the matenal It IS i'llso ltkely :h.1t th-.·re was nn 0ther source uf
plutor.1um exhtbttlflg ,, dtfferent tsowptc r:ltto tn ~he .-\re<.-13 d·:'Vtce Based on
11
-

1()/6;93
d1scuss1ons w1th weapon en~u1eers i\r.d LICllo;:r.t..'mt!:>tS ;1: LA0:L .-md LL:--.:L and on
the testing literature. there ~~. no !Cdt.::a~;or. tna: ,:dcittlonal c1mounts ot :: 1 RPu had
been addea to the expenmrnral (<lnrt~ur.lt;o:~ n.scus~:on ot the dl'ta!ls oi the.
nuclear dev1ce used m the t\rea-13 t..''-per:ment :~ -::.1sstttt!d and cannot be related
here. However. as 1nd1Cllted above. therl' ·~ no r1.'.l~Lln w h·lteve th"t the expenment
,:aused anything but <I umtorm dlstnbut;on <11 rluton.um l!:>otOpes presumably In all
parucle s1zes. The _::J9pu I 2JHpu r.1t1o .1ttrtbuteC1 :o the Area-13 matenal was
me.:tsured by the Nevada Applied Ecology (~roup \: .A.EGI tn sod anti \·egetatlon
samples and hild an average value ot .1bout ·lb
If the Area-13 dev1ce contamed plutomLm mlltt:f1,11S 01 d!flenng tsotop1c rauos.
one m1ght expect those ratiOS to be seen m n·.e dtspt:rst:'d matenals on a spat1al bas1s.
Dunng the explos1on. the ~~otoptc r.1t:o \\ ould bt• -.:h;"~n~ed d neutron act1vat1on
occurred. There was no nuclear V1eld tram the :\reA-13 explOSIOn. thus no neutron
act1vat1on of any s1gmflcance oc:urrl'd tt'.a: could aiter :he 1sotop1c d1stnbut10n oi
the dispersed matenals.
There are sources ot piutomum nut .1~so.:t.Hed \'> ith the :\rea- 1:1 explos10n that
may have mfluenced the resultant dtstnbutiL'n ,,r plutonium 15otopes 111 the area of
deposition. World-wtde i.11lout r1as depos1~ed ~m.1ll cut meosurable <~mounts of
pluton1um havmg a well-documented tsot0ptc r.1t10 ut .1bout 4~. wh1ch 1S not very
different from the ratlo of the Arei\-13 m.1ten;'ll ot ,,bout 4b Along w1th fallout from
atmosphenc testmg ts the tmpos1t10n c,f ~'liPu tram the ,\tmosphenc destruction of
the SNAP-9A reactor burnup 111 1964 lf ~uritctent = 1 ~Pu tmm the S!'\JAP were to be
deposited on the Area-13 !:lite. the : 1 '~Pu, : 1 ~Pu r.1t1o would be iowered Finally.
atmosphenc testtng of nuclear devtces · \.,·,1s conducted on NTS proper m Yucca
Ve~lley ildjacent to Arei\-13 Fallout 01 ... q.;nttiC.1nt it!Vf'h ~ .. ·,,s renodlcally depOSited
on Area-13. IsotOpiC r."\tiOS ot the rlutontum !:-om those exploSIOns were very
dtfferent than for the Area-13 pluton1um due to the m.1tenals used tn the dev1ces.
neutron acttvatton reactions creatm~ ::;~Pu . .u•d burnup ot 2:'19Pu.
Because the Area-13 dat<" suggest t!' .. 1t .1n on'rl.1v rniW be present. charactenstics
vf poss1ble overlay mater1ili .ue d1scussed The mator overlay source IS thought to
be the iltmosphenc nucleilr explos1ons conducted 1n Y~1cca V.1lley Figure 5 is a map
of NTS showmg the locatiOn of Area 13. the large cratermg event SEDAN. and a
corndor of fallout patterns from ,, numbt~r or events known to have depos1ted
fallout on the Area-13 site. Those events or the ~ene~ m wtuch one or more events
sent fallout over Area 13 .ue hsted. Several oi tho~e events caused the h1ghest
concentration of fallout to depos1t d1rectly over the Area-13 Site
The 239pu;238pu rat1os for ,, number of events conducted 111 Yucca valley are
shown m TJble 4. These r;1t1os were determ1ned from !lOti sampl•:>s collected dunng
:he RIDP study m 1986 For compclrtS\.Jn. the LillO tor Area- n (-lo) dati\ determmed
In 1973 is decay corrected to l')fl,h ,jQ) The llr!>t r,-,rt uf the liSt I~ tor nuclear
e~perlments Ylt:>ldtnh r;'ltiO!'- trom :.: : ILl i ) The ~t'(Ond r.lrt 01 tht• ltst I'> f0r ~afety
expt'rlments exh1btt1ng nn nuclL'M ,om~'OIH'nt v•eld'nh r.1t10s of 4:' to 52. An
mtermedli\te sample trom i\re.1 i 5 1 Samplt~ #ll i l \\ rlS collected bv RIDP from

NTS
Buster- Jangle Tumbler- Snapper Upshot - Knothole Rio Arriba Socorro Wrangell Otero Diablo Hood Wilson
~,
J
Area-13
Sample 11 ()
0 Sedan
Figure 5. Map of the Nevada Test Site ~howing Area-13.
Table 4. Selected 2.39PuJ238pu source ratios tor NTS.
Source
Kepler Whitney 01ablo Smoky Sedan Sample #lll
Oberon Plutonium Valley GMX Area 1::.•
Rat1o
3.0 3 1 :' 1
10 55 5 3
s:: 42 51 46150)
:0/6/93
• Dati\ from NAEC dil"' Bil~. () de<iiV cnrre<ted lrnm \'17:- t" l'iKn All11th~r dil"' trorn RIDP
(McArthur ilnd M~.ld liJR'Jl
13

10/tJ/Y3
between the SEDAN t'\ent "no Arl'o ::; ,111 !i.l' .-\rL':l- :~: ,,Je ~)! ,1 :nount.1lfl range
separatmg the two Sltl'S ()ne coulC '-·on.::i~,_:t_' th.l.t ,1 ::ortL)I~ ,:r tne overlav r1t Area 13
mav be from the SEDA~ event known r() nave ;-,ent :,1ilout ;:1 the dHeCtlOn or Area-
13
Analysis ot Physical Data
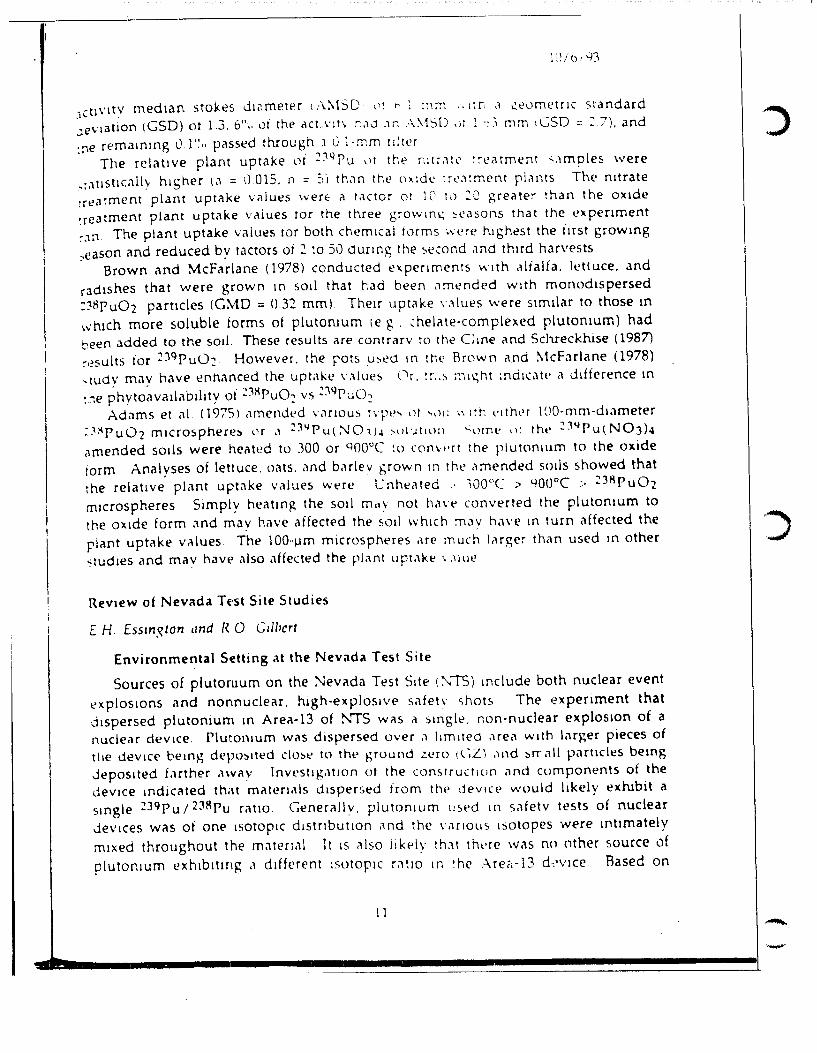
NAEG Transects. Data collected alan~ ltne trarbl.'Cts -.....-ere evaluated tor poss1ble
rat10 differences with dtstance If smaller particles e'-ntbltl'd a decreased ~JYPut :JBpu
rat10. then samples contatnmg a rugher proport1or. ,11 the :::-maller p;ut1cles would
exhibit a lower ratio. Sml from a long tran.sec. ;vh~ch r.1n south to north from the
more contaminated reg10n to the reg1on or lew levels ot contam1m.tton trom the
Area-13 explos10n was collected m 1972. Sod from ,1 shurt transect JUSt southwest of
CZ was collected m 1988 Mld was dEstgnPd to ev.1lu.11e the spi\tlal Vi\rtabtl.ity ot
pluton1um tn ;1 small MC'i1 ftgurl' n ~~ ,, pot llt thl· pluton1um tsotop1c rat1os
relative to d1stance .1w,1 v r rom thl' A rl'<l-13 CZ The 't'getat1on samples were
(OIIected m October 1978 ,1!"\d .1nalvzed bv r1 Jltlerent l.1boratory than the soil
samples. wh1ch were collected 1n :\iovemtJe · 197~ trom .1 loc:lt!On 1mmediately
adJacent to the vegetatiOn samples Onlv one v·~get.1tH.m ~ample was collected and
analyzed from each locotlOn on the transect. whereas tvvo repllcate "ltquots were
analvzed for the sotls. The south-to-north transect data show a deoded decrease m
the iJ9pu;238Pu rat10 w1th distance
Figure 7 is a plot of the rlutonlum ISOtcptc r.1tiOS relative to distance on the
short (east-to-west) transect. Soil from t?ach ocatlon on the transect was analyzed
twice, i\nd all data Me plotted tn Fig 7 Although .1 ltneM ieast-squ<ue fit of the data
shows a slight decrease 111 ratto w1th d1stC1nce from west to the t•,1st. th1s d1fference 1s
not s1gruficant. There seems to be no mforrr ,1t1on 1n th1s d.1til :,ct suggesung ratio
differences Th.ts observation IS mtu1t1ve bee?. use the samples were collected from a
much smaller area than the south-to-north transect and were \·ery dose to GZ.
where the mfluence of the Area-13 explosiOn ..vas lnrge
Microplot Studies. A small-scale sampitng stud\ was conducted by NAEG in
\1arch 1972 to test sampling methods for surface ~oil. soli depth profiles, and
vegetation. The microplot was ,1 small ilrea L'nclosed 1n a temporary bullding to
prov1de protect;on from the wtnd ;tnd amrr <1l 1ntrus10n .1nd "~lowed investigators
to collect s.1mples of sod .1nd veget<ltton that were not tmpilcted w1th plutonium
..:ont,1m1n.1t1on from the surround1ng Mea Thts ITHcroplot study ~nelded profile
data from which plutomum ISOtoptc ratios were calculated Small particles with a
ratio different from that of larger particles may penetrate the soli profile more easily
than the larger p;utlcles Figure 8 summM1zes the tour profiles collected in the
m1croplot study. The datn represent the me ~ns and stclnd.ud devtatwns (50) of the
data for each depth 1ncrement from the tc ur prattles Tht? top three mcrements
represent four data pmnts each and the deeper mcrements .ue for fewer data points.
The average profile does mdicate a substantial decrease 1n the ratiO w1th depth that
suggests smaller. less fdterable. prtrtlcles h.1ve mq;ratl'd vertically farther than the
.9 -; a:
100! \ i I I
so r-1 I i
..__ __ Soil
:.:::r-----:"1 Vegttlat1on
---1
I
~-----~
2000 4000 Distance (ft)
6000
Figure 6. Ratio ot 239pu to D8pu tor Area-13, S·N tr;w~ect.
I 8000
10/6/93
larger. more tllterable p<1rt1cles. Tho~e 5rnalier p.ut1clc~ presumablY cxh1b1t ,, lower
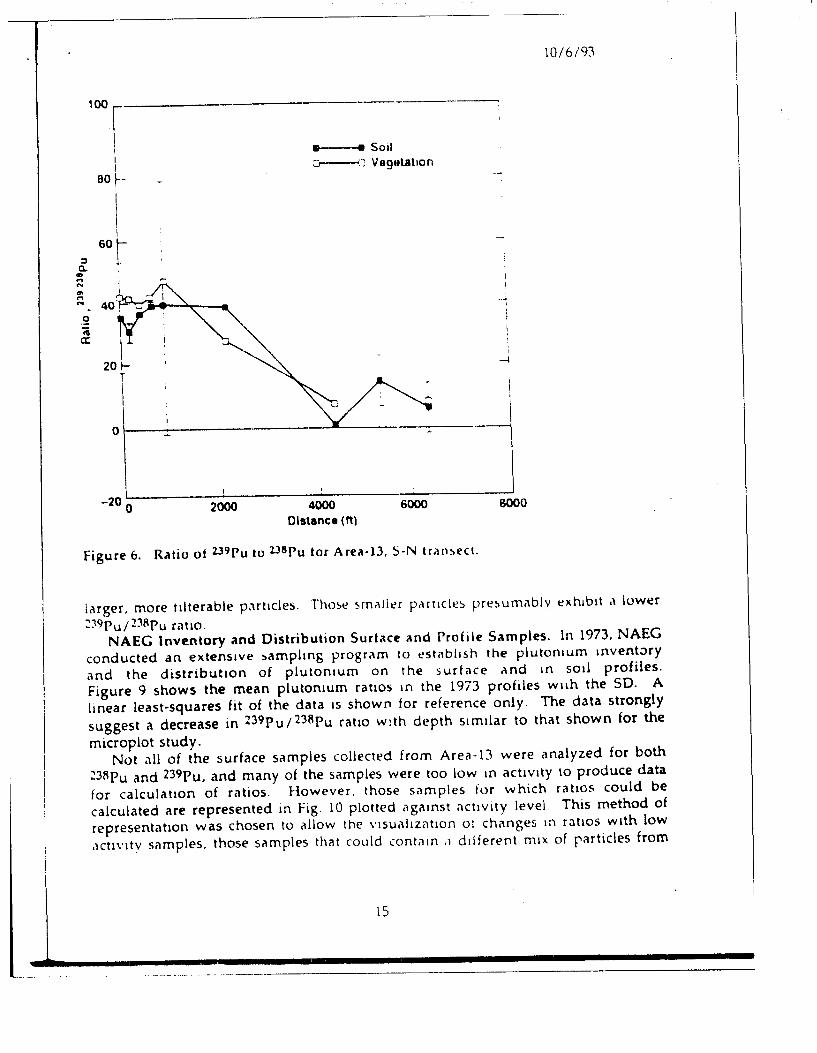
~:\9pu;2:1Rpu ratio. NAEG Inventory and Distribution Surface and Profile Samples. ln 1973. NAEG
conducted an extens1ve sampling progrc'\m to estilblish the pluton1um 1nventory
and the distributiOn of plutoniUm on the surface c'\nd 1n sod profiles.
Figure 9 shows the mean plutomum rat1os 1n the 1973 profiles wnh the SO. A
linear least-squares fit of the data IS shown for reference only. The data strongly
suggest a decrease in 239pu f238pu rauo w1th depth S1m1lar to that shown for the
microplot study. Not all of the surface samples collected from Areil-13 were analyzed for both
~38pu and 239Pu. and many of the samples were too low m act1v1ty to produce data
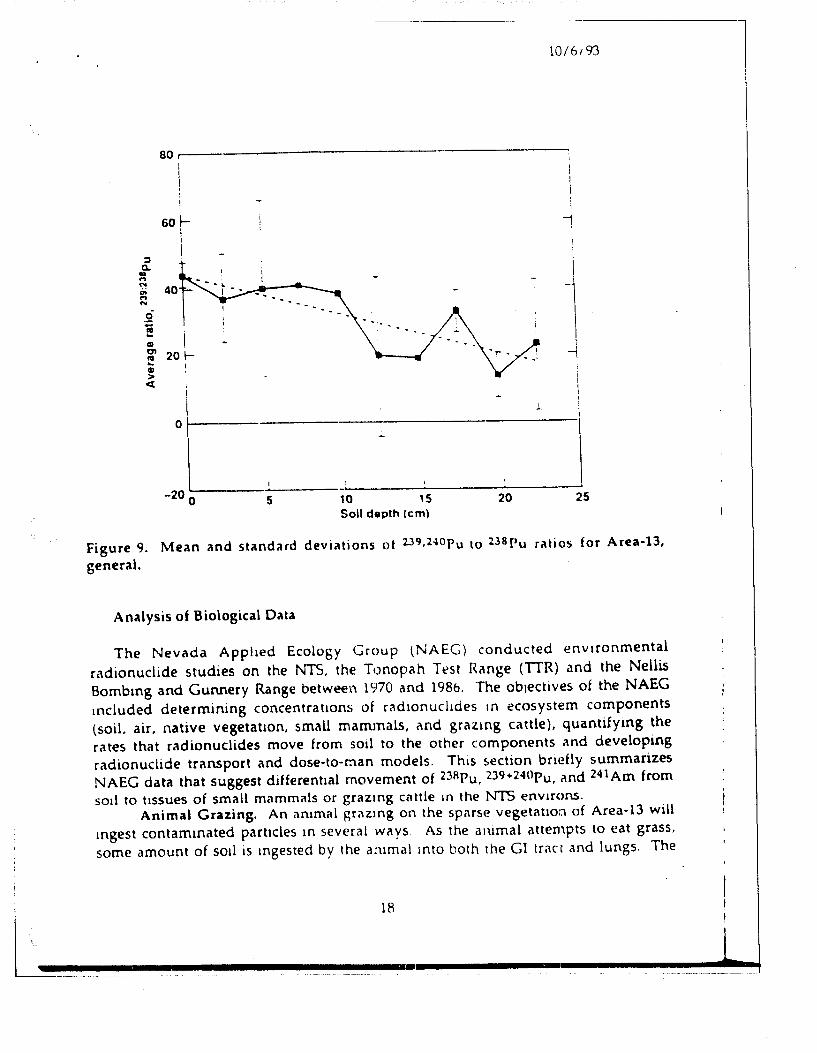
for calculation of ratios. However. those samples for which ratws could be
calculated are represented in Fig. 10 plotted ilgamst actiVity level This method of
representation was chosen to ollow the VISUillizatlOn oi changes 1n ratios w1th low
act1v1ty samples. those samples thilt could cont.11n ,, different m1x of particles from
15

10/6/93
100~------------------------
;:) 6() + ~ + .. + .... ... "! + ... + + ± +- + ... + t +
.._ ~ I
"' + -r - ~
.2 + ..... ..,.. -r I iii
+I a: +
\ I I
-1
0 I
0 20 40 &0
Ol~tance I H)
Figure 7. Ratio of 239pu to 238pu for Area-13, W-E transect (1~'89).
multlple sources. If a single source of pCHt:cles was depos1ted on Area-13. the data of
Fig. 10 should show a constant ratio w1th rad1oact1V1ty level.
There 1s a wide vanatwn in plutoruum 1SOtop1c r;~t1os shown m F1g. 10, but the
data do suggest three regtons of interest. The first ~~ the very large ratlos that are.
unexplainable at this time. The second is the regton of ratios located above about
10 pCi/g and that center on a ratio value of about 46, which is the average ratio
value established for Area-13. The horizontal line shown in Fig. 10 represents the
ratio for worl ·1-wide fallout (42) and suggests that Area-13 ratios would probably be
indistinguishable from world-wide fallout ratios. The third region of interest is
below about 10 pCi/ g. ln this region the ratios <lppeM to decrease with radioactiv1ty
level. This observation would be consistent wtth a decH!;"ISlllg mflu~nce of the Area-
13 plutonium source and i\n mcreasing 1nfluence of the overlay exhibiting a lower
239Puf238Pu ratio. In fact, that contention 1s consistent wlth i\11 of the ratio data of
Fig. 10 except for the very large ratios.
Solubility Data. There is some data on solubility of isotopes of plutonium from
nuclear event source~. published by Larson (1966). for particles from balloon and
tower events as shown in Table 5 These events were conducted in 1957 and several
16

100~-----------------------------
• en
! i i I
80 ~
~ !
~ ! 4 201-
~ i
10/6/93
I i i
0~--------------------------~------------------~
4 8 12 Soil depth (em)
16 20
Figure 8. Mean otnd stotndotrd devi;ttions of 23 9 .HOpu to 238pu ratio for Area-13,
microplot profiles.
of each type sent f:1llout over the Area-13 Site ')olubiiitY 1s expressed relattve to
water or dilute acid for piUttcles l;uger or srn;,ller thon 44 mtcrons. Part&cles
origmating from tower events show limited solubilitY In water and substantia.!
solubility m dilute i\Ctd. Partlclt.>s tram the bi\lloon events show cons1derable
solubility in both media. In both cases. the· smaller pMtlcles were more soluble than.
the larger particles. The tmpact of this data 1s that the smaller parttcles are the ones
presumed to have been deposited on the Area-i3 and are the ones predominating
the lower acuvtty samples. In addttiOn. the parttcles dtspersed by the Area-13
explosion are fired oxides. which are typtcallv very msoluble compared to the
balloon and tower f~ilrtiCies th:lt are predornmantly siiiCC\te 111 ni\ture
17
'I
10/6193
80~--------------------------------------------~
~ ~ ... ..
60 f-1
I
~ 40 .. N
.2 -e Gl I g' 20 f-.. Gl > <
OL - 20 0 ~5----,0 15
Soil depth (em)
---1 I
1
-1
\ I
l. I
i
I 20 25
Figure 9. Mean and standard deviations ot 2J9,HOpu to 2J8pu ratios for Area-13,
general.
Analysis of Biological Data
The Nevada Apphed Ecology Group (NAEG) conducted envtronmental
radionuclide studies on the NTS. the Tonopah Tt>st Range (ITR) and the Nellis
Bombmg and Gunnery Range between 1970 and 1986. The ob,ectlves of the NAEG
mcluded determining concentrations of rad1onucl1des tn ecosystem components
{soil. air, native vegetat10n, small mammals, and grazmg cattle), quantifymg the
rates that radionuclides move from soil to the other components and developing
radionudide transport and dose-to-r::lan models. This section briefly summarizes
NAEG data that suggest differential movement of 23flpu, 2J9+240Pu, ond 241 Am from
sod to t1ssues of smoll mammals or grazmg cattle m the NTS env1rons.
Animal Grazing. An ammal grazmg on the sparse vegetat10::1 of Area-13 will
mgest contammated particles 10 several ways As the ammal attempts to eat grass,
some amount of soli is wgested by the a:·umal 1nto both the Gl trac[ and lungs. The
18
L·--·······
10/6/93
300
I 250 ~ --i
I
+ I 200 I
I
:::1 I
l Q. + • ,., N .;;
150 ++ ,., ... . 2 + + + 'ii cr. + l .fi"
100 - + + I + + + +
Figure 10. Ratio dependence on i\Ctivity level.
ilntmal w1ll also mgest soli particles that are tri1pped .;.m the surface of the vegetat1on
due to resuspension of contam1nated soli (Wtucker <1nd Schultz. 1982).
Incorporation ot r>lutomum mto the plant structure after uptake through the
roots is known to be very small compared to the measured amounts of plutonium
on the plant surfaces. Thus. the graz.mg <lmmals wlll obtam little plutonium
through that route even though that pluton1um may be more available biologically.
Kangaroo Rats. Gilbert et al. (1988) reported data suggestmg increased movement of
238pu relative to 239•24\lpu and of 241Am relauve to 239•24llpu m kangaroo rats at
Nuclear Site 201. These data suggested that the b1oavn:lability of radionuclides t•> the carcass of kangaroo rilts was 1n the order 23Rpu > 24 tAm > 2JIJ•240Pu. The data
mdicated a possible three-fold (on the average) enhanced bioavailability of 238pu to
the carcass of kangaroo rats relat1ve to 239•240pu ilnd a two-fold enhanced
bioavailability of 241Am to the carcass relative to 239•240Pu. These conclusions were
based on computed carcetss/GI ratio:~ for these radionuclides for mdividual kangarco
rats that resided al: Nuclear S1te 201 The reported data were (reported <.s
19

10/6!93
Table :i. Solubility of isotopes of plutomum trom nuclear event sources. --Support Particle Solubd1ty (":.) (micron) \Vater (0.1N HCl)
Tower >44 < i ,])
•,44 . -, <.- 1l4to36J
Balloon >44 ':.1 \>901
<44 :4 (>60)
Note: D.1ta from L..uson t't .11. ( 196(.).
radionuclide, geometnc mean. £eometnc sc.mdard error. number ot kangaroo rats):
238Pu, 0.032. 1.2, 52; 241Am. 0.018, 1.~. 56; ilnd 239•240Pu. 0.012, 1.2. 59. There was a
statistically stgnificant difference (p < 0.05) between the geometnc-mean rattos for
238pu and 239+240Pu, but not between thf' geometnc·meiln-riltiOS tor ~~lAm and
239+240Pu. The data used to compute the geometnc means were tor ammals wtth
positive concentration measurements reported by the analvtiCi\l l<\boratory (negative
measurements were reported for some tissue samples) That 1s. ammals with
negative measurements were not used In computmg the geometnc means. This
data analysis procedurE' 1s not expected to result m biased geometnc-mean ratios
unless the ilrumals with neg<'ltlve measurements tend to have a different carcass/Gl
ratio than animals with posttive measurements. The tests were wnducted using
Bonferroru t tests (Miller 1981) on the loganthrns of the ri\tios.
Gilbert et ill. ( 1988, Figure 8) also computed 2 ~9 • 241lp u 1 238pu and
239+240pu;241Am rahos for pelt. Gland carcass tissues of the Si\cnficed kangaroo rats
from Nuclear Site 201, again, usmg onlv positive measurements The data reported
for the 239•240pu;23Rpu ratws were (11ssue. geometnc mean, geometnc standard
error. number of rats): pelt. 38. 1.1. 58; GL 30, 1.1. 57. and carcass. 9.5, 1.2. 54. There·
was a statistically significant difference In the geometnc-meiln riltio for pelt and
carcass and for Gl and Cilrcass, but not for pelt 01nd Cl. The dilta rt!ported for the
239+240Puf241Am ratios were: pelt, 9.3, 1.2. 41; Gl. 6.6. 1.1, 59; and carcass. 4.8, 1.1, 56.
There was a statistically s1gnificant difference between the geometnc-mean ratio for
pelt and carcass. but not between the geometnc-mean riltio for pelt and GI or Gl and
carcass (Sonferroni t tests on the loganthms of the ratios) Grazing Cattle. ln Area 13 on the Nellis Bombmg and Gunnery Range
adjacent to the NTS, a nuclear device was explos1vely destroyed Clt ground level in
1957. This test contammated the surrounding soil and vegetat10n with plutonium
and amencium. Between 1973 and 1976. " reproducmg herd of beef cattle were
grazed within two fenced enclosures m Area 13 for up to 1064 days under natural
conditions (no supplemental feed. unlimtted water) (Barth 1979). The cattle were
killed and their tissues were analyzed for radionuclides. including 239+240Pu, 238Pu.
and 241Am. The data for 17 of the 20 cattle were SUltable for esumatmg fractional
20
l0/6/93
1000 1000
Flatulated BHI
StMt'a Canle
Rlmen contents
+ + 100
:l Q. .. ... 3
+ t I + . - +
* +
I :t * l • t t - + - t t t • - -+ + + • - + - • + - • - -- -
100
Q. 0 10 .. N . ...
• + - t -t ' ., 10
... "' + - t -
+ • t • - -
Maximum + + • 75th ~'-lie -Meal.., 25th "Y.IIe + Minimum
t f
0.1 (31)" t'3 '} (56) (58) !'9/ (14/ I 73/ :91 I l4J I !J) 9> '61 ~' I I , 5) 7) !51 7} 0.1
SoU V!Hl VlliJ Flu Sed Ru- Ru- Ret- Hide LunoTBLN Uver Vert Kid Muse 81· Fem
V89 Flu Sed Ser
Sample type
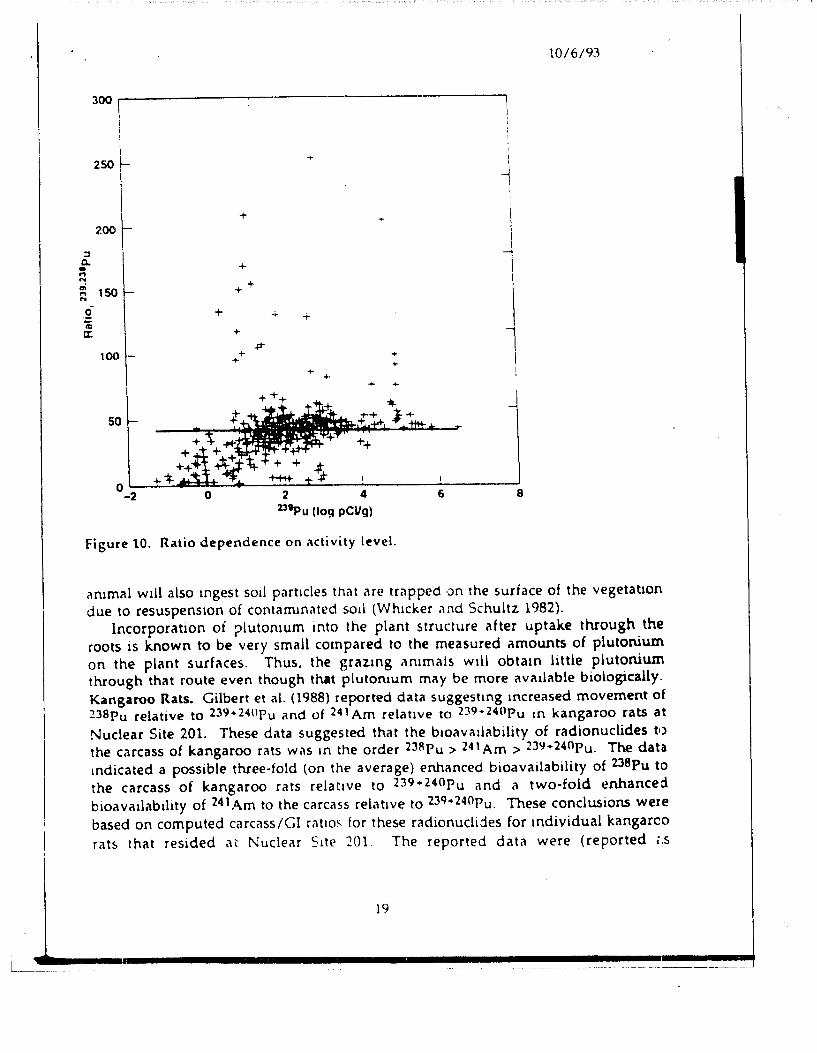
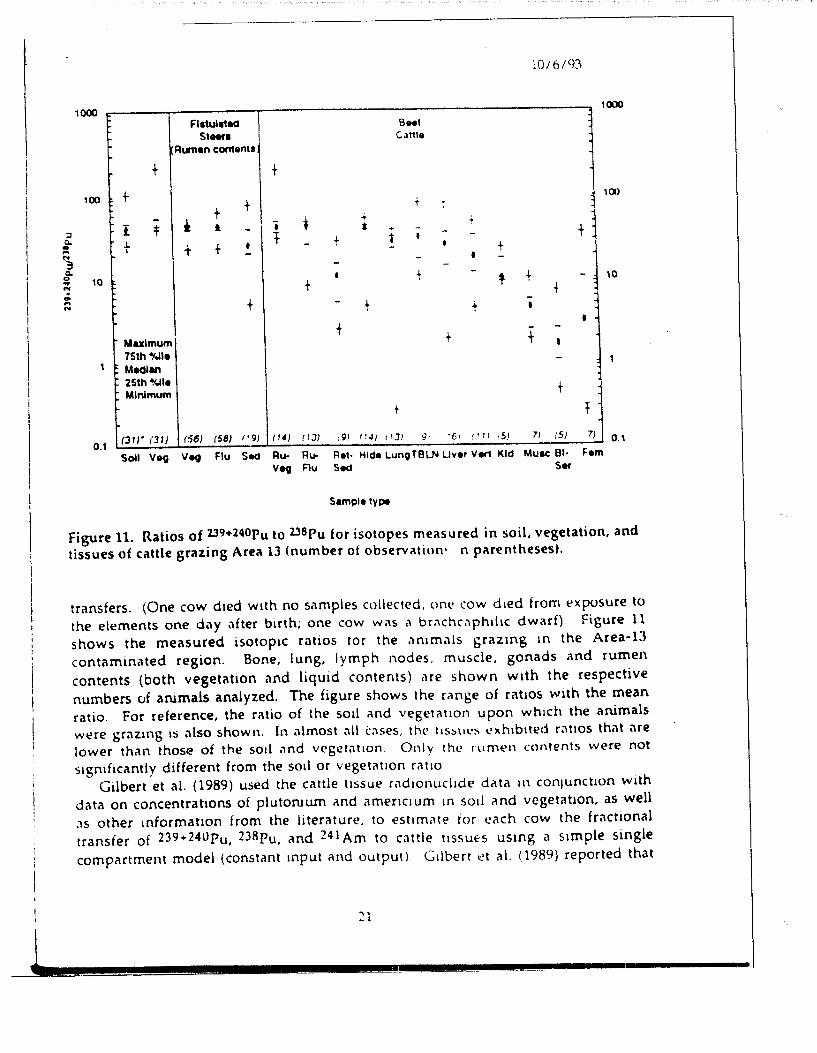
Figure 11. Ratios of 239+240Pu to 238pu for isotopes measured in soil. vegetation, and
tissues of cattle grazing Area 13 (number of observation• n parentheses).
transfers. (One cow died wsth no Silmples collected. ont> cow d1ed from exposure to
the elements one day i'lfter b1rth; one cow was i\ br<1chc.1philic dwarf) Figure 11
shows the measured isotop1c ratios tor the i'lmmills grazmg m the Area·13
contaminated region. Bone, lung, lymph nodes. muscle, gonads and rumen
contents (both vegetation nnd liquid contents) are shown w1th the respective
numbers of animals analyzed. The figure shows the range of rauos with the mean
ratio. For reference, the ratio of the soli and vegetatiOn upon whsch the animals
w~re grazmg IS i\lso shown. In illmost illl c;,ses. tht• tLS!>lll'S l'xhsbsted ri\tiOS that are
lower than those of the sotl ilnd vegetnt10n Only thl' rumen contents were not
sLgmficantly different from the sod or vegetatton r<Hto
Gilbert et al. (1989) used the cattle t1ssue rndionucltde data tn conJunction with
data on concentrations of plutonium and amencLUm 1n soli i\nd vegetatlon, as well
.1s other 1nformatton from the literature, to esttmnte for each cow the frilctlonal
transfer of 239+240Pu, 2JRPu, ilnd 241 Am to cattle t1ssuE·s usmg a s1mple single
compilrtment model (constant snput C\nd output) Gilbert et al. (1989) reported that
10/6/9~
statistical tests (sign tests) lndlcatecl Slgruflcantly \;) < u.OS) ldrger Gl-tO-tiSSUe
transfers (1) of 238pu as compared to 239 • 24 1Pu for all t :ssue exammed (blood serum.
muscle, ilver. femur, vertebra. and kidney'.(~) or DRpu as compared to 241Am for
muscle, liver, femur. and vertebra. and i3) ot ~41 Am .1~. compared to 239•24Dpu tor
blood serum, femur. and kidney StatiStical s1gn tests -::ould not be conducted to
compare 238pu w1th 241Am tor biood serum and k1dnev because only::: or 3 cows had
data for both tts:;ues. The s1gn test comparmg : ~ 1 Am anj 239 • 240pu were
nonsignificant for muscle (p = ll09), liver 1 p = l) 15). nne vertebra IP = d 7)
The GI-to-blood fractional transfer of 2JRpu (u OOCil \ was about 20 times larger
than the estimated transfer of 239•240pu (1).000005). \vhde the est1mated transfer of
241Am (0.00001) was about 2 times larger than that or :Jq .. Hnpu. ~1ed1an geometric
mean 238PuJ239+240Pu ratios were (ttssue, Meometnc meiln. number of cattle (rattos)):
blood serum, 28. 5; femur, 16, 7, muscle, 10, 7. kldnev, 5. 5; vertebra, 3, 11; and liver,
2, 16. The med1an geometnc mean 241 Am 1239+240p~ ratios were blood ·'rum, 4, 5;
femur, 2, 12; muscle. 3, 9; kidney. 4, 8; vertebri'l. 1. 15; and hver. 1. 15).
The estimated fractiOnal transfers depend for then valaditv on assuming the
selected model and model parameter values <He appropnate The etfect ot mode·l
parameter uncertamty on the uncer':ilmtv ot the estimated fract1onal transfers IS
currently being assessed us1ng uncertamtv i\nalyses (Monte Carlo stmuliltJOns). The·
possibility that a mon' complex and realistic model m1ght have gtven different
conclusions cannot be d1sm1ssed lightly The model that we used considered only gut absorptton. A more realistiC model would wclude tnhillatlOn ilnd absorption of
Pu in the lungs of the cattle. Rumen contents of fistulated steers (<Hld a non-hstulated steer sampled at the
ume of slaughter) grazing Areil-13 were collected dunng the year and analyzed for
plutonium isotopes. Table 6 is a summary of the 1sotop1c ratios of the contents of
four components of the bovme GI tract for severill grazing penods. The designation
"shrub," "g!'ass," and "mtx'' m Table o 1s a verv crude 1nterpretilt10n of the general
nature of the vegetation grazed, .md IS shown onlv .1s ."'n Indtcatlon of what the
animals mtght have been grazmg. The dat<l show that dunng the wmter months,
when the animals browse shrub materials, the plutomum ratios are closer to that
determined for the soil materials. Dunng the spnng nnd early summer months, the
ratios are lower, perhaps associated w1th grazmg on the grasses. One can postulate
two plant·spedes-dependent effects that may influence ~he ingE?Stion and ultimate
i\Ssimilation of plutomum: ( 1) the nature of the leaf surfilce relative to its ability to
trap and .hold particles; and (2) the part1ally dtgestE:·d plant mi\tenal in the GI tract of
the grazing animal may create a diffc~ent chem1cal cond1t10n thnt can alter the
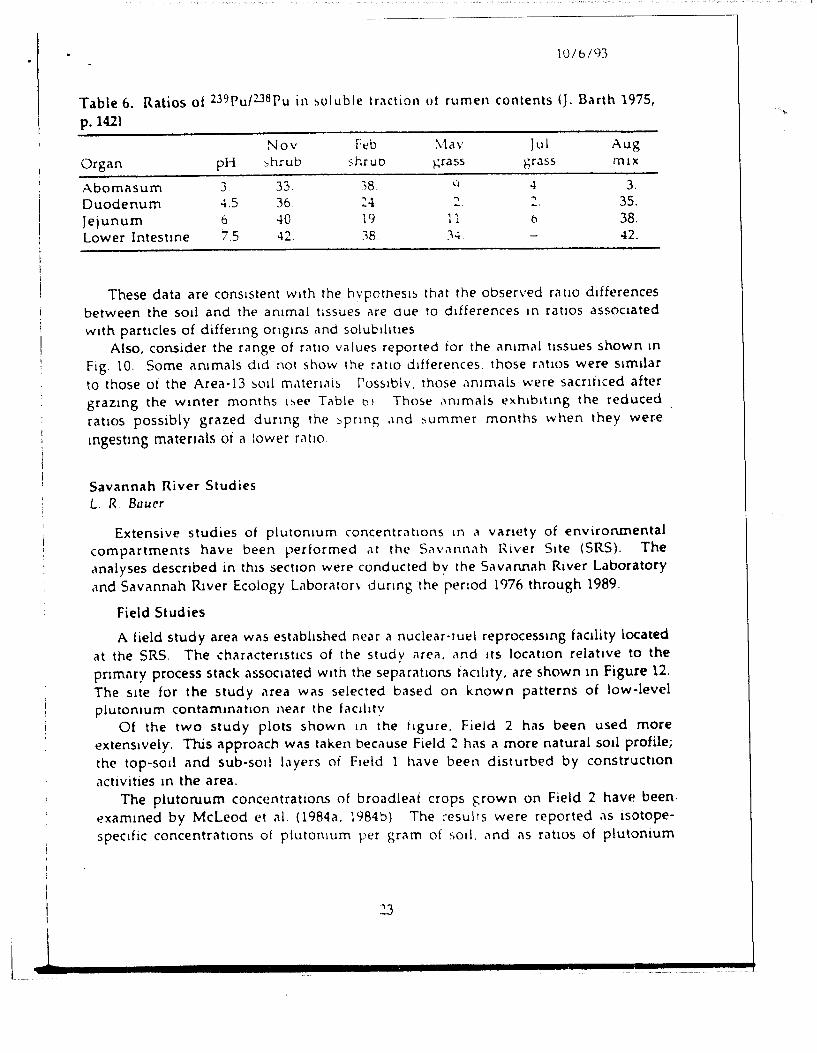
solubility of the plutoruum contammg i. ·tcles. Based on the data m Tilb.le 6, 1t is f~~o..l')Sible that the brazing cattle have mgested
particles of considerably lower .sotop1c ratios at l~ast dunng a portion of their stay m
Area 13. The Yucca Y.lllev source ratto or : t•J It) and the rat1o of the ilssimilated matenal of 2 to 24 are consistent wtth the observed :~nm1al tissue rat1os of 2 to 25.
10/6193
Table 6. Ratios of 239Puf23Bpu in ~oluble fraction ot rumen contents (j. Barth 1975,
p. 141)
Nov hb \1av jul Aug
Organ pH ::.hrub shruo hrass grass ffilX
Abomasum 3 33. ~8 q -l 3.
Duodenum 4.5 36 :-t ... .., 35. -
Jejunum b. 40 19 1l b 38.
Lower lntestme 7.5 42 38 ~.; 42.
These data are consistent w1th the hvpotnes1~ that the observed rat10 d1fferences
between the sod and the ammal ttssues Me due to d1fferences m rat1os assoe1ated
w1th particles of diffenng ong1ns and solub1llt1es
Also, cons1der the range of r<1t1o values reported tor the ilmmal t1ssues shown m
Ftg. 10. Some ilmmals dtd not show the ratto differences. those r.1t1os were s1milar
to those oi the Area-13 soli matena1s Poss1blv. those an1mals were sacnhced after
graz.mg the wmter months bee Table b 1 Those ;m1mals exh1b1tmg the reduced
ratios possibly grazed dunng the ~prmg ,1nd summer months when they were
mgestmg matenals of i\ lower ratto.
Savannah River Studies L. R Bauer
Extensive studies of plutomum concentratiOns tn a vanety of environmental
compartments have been ~.1erformed ,11 the S<1v.1nnah Hiver Site (SRS). The
,malyses descnbed in th1s sect1on were conducted by the S;wanni\h R1ver Laboratory
,1nd Savannah Rlver Ecology Laboratorv dunng the penod 1976 through 1989.
Field Studies
A field study area was established near a nuclear·tuel reprocessmg facility located
at the SRS. The charactensucs of the study area, ,1nd Its locatiOn relat1ve to the
pnmnry process stack assoCiated w1th the separi\tlons ti\Cihty, are shown m Figure 12.
The s1te for the study .uea was selected based on known patterns of low·level
plutomum contammnt1on near the filCihty
Of the two study plots shown 1n the figure. Field 2 has been used more
extensively. This approach was ti\ken bec,,use Field ~ hi\S a more natural soli profile;
the top-soil and sub-soli layers of F1eld 1 h;we been disturbed by construction
activities m the area.
The plutoruum concentrations of broadleat crops ~rown on Field 2 havl~ been.
exi\mtned by McLeod et ill. (1984o. 1984b) The ~esulrs were reported .1s isotope
specific concentratiOns of pluton1um per gram of <;Oil. and ns rat1os of plutonium
l __ ........ ----------................ ~~

l0/6/93
30 ·300
t ;1~ 240pu
i 1\ t I I
25 i-· I \ 1250 I I \
J~ I I I \
\ \
I \ l200
\
i I
I I
I ~
i·~ ~
~ 0 0 \ I \ en en ' \ I
CD
"t \ :::..
CD ~ ~ \ I \ ~ \ I \ :I a. :I
\ \ 0 a. I ~ .. ..
~ \ I "" ...
- I ~ .,; "' \ ...
' ...
10 f. ' I ·- ... j ... +oo 1
""'- 1 1
s - so 2l8pu
0 ~--------------------------------------------------~0 67 69 71 73 75 n 79
Year
Figure 14. Annual variation in 2J8 Pu and 239 •240pu concentrations in Alaska lichen samples during the period 1967 to 1979.
Possibility of Experimental Artifacts in Existing Data
Sample Collection, Preparation, and Analysis Problems that May Cause Variation in 239puf238pu Ratios E..H. £ss~n~tor1 11nd S l/1rulum
There .ue severill poss1ble reasons v-.·hv the -:;tlcul.1ted ~:lllpu / 2JHpu ratiO for a
g1ven sample may not accurately represent the true rat1o for th~ svstem sampled.
31

:'\lon-representat1ve rat10~ rnav c._J..:..:~r .1~ ,1 resu:t ut :n~FCrt~prtetJe~ ur errors 1n (1) the·
des1gn ot sampl~ coliect!Or1. \~i :'-,!mple :'rl?r'M~ItlO:l_ '.' :'J,'lrnpie d:SSOIUt!On/chemtCal
punficatlOn. (4) alpha spectrometr1.:: -:,;.u~:::~~.; ~ ~-~zy, ·otng tor cnemtcai ytelc
determmatwns. and (6) quail tv control These ~·omrs Me d1scussed betow ";th il'~.l!'C :,, rr.e methodoiLJ~Y Lsed 1n
.::ollectwn. prep<Hatlon. ,1nd ,1natvS1S ot c,.1mptes :c•r LJ.:termmat1on ut piutoruum
.::oncentratlons 1n so1ls. plants. :md an:rnal Lssues \'.'e .ue iooklng tor b1ases that
mav cause the :JRpu results to be h1gher thar expectec resultmg n low 2.39pu 1 238pu
rilt;os. In these d1scusstons <239 Pu" .::. used to r.1ean : 1 "·2·Wp~ because the two
1sotopes can not be d1stm~u1shed bv ·,pt•.::trometrv ~.s;n~ ·-urt.\ce L•.uner dett.>ctors.
Sample Collection
Sample collectiOn 1s ~eneralh Jes1.,;:ned to c._Jt::>t.Hn r. .. 'lterJ.ll representative of the
..:ontamtnant dtstnbut1on m tne ft>.Hurl' t1 e1n~ ~.,,fT'.~':eJ .. l' . ~oil. \ e~etatwn. rumen
..:ontents. ,H an1mal tl-,sul'l :\~ ;,1,-h ,;:. :r<l' ~ :~ton1um 1:->lHopes .ue eveniv
d1stnbuted among the 'oH1ous -,.,mpleJ (Umponent~ '' t' • :1ot tractwnated), one
would not expect the .let ot sampl!n~ to :nduct' .1 "t'!JoH.ltlOn of the 1sotopes. The
sampling procedures used .It :\rea- i 3 tor ~urtace -,od .1nd profile tncrements
mcluded the use of a template ,,nd collectiOn l)t the toti\l sample wtthin that
template w1th no furtr.er mantpulatton oi t:.e :,.,mple CollectiOn of \·egetation
samples was accomplished b:-r· cllpptng exposed br,'lnches or gri\ss blades hm1tmg the
choice of matenals to the current ~ears growth .\g<Hn. there vvas no further
mampulat10n of the vegetatton sc1mples Ruml'n ,ontents \,·en' L)bt;Hned so that
nearly all of the veget<ltlOn. ~od solids. ,1nd l•quta 'ontents nt the rumen were
collected e1tr.er from flstulated steers or upon .,,,cr1f1ce l)f the ,,ntmal. Tissue
',amples were collected c15 entire l!nllS ,'\\'Oidm~:; ,·~n~s-,·ont;)mln;'ltiOn Usmg these
teChniqUeS, 1! IS bl:'llt'\'t'd !h,"\t the '-,1mpl1ng r'fOCl'dUrf:''> were '>OUnd .H\d no
unexpected mampulat10n dunnh the .,,,mp::n~ ~'f\1\t'uures nccurred th;lt could have
caused 1Sotop1c fractlO!liltlon.
However. If the dtstobut!On ot the Fluton:~,.;m 1sotopes h.1d vaned among
dtfferent system components or ."'t d1fferent locatiOns 1e g, washes or d1fferent plant
speCies), appltcatJOn ot M\ 1mproper s.1mpl1ng i-'rocedure rni\y produce samples of
dtfferent 1sotop1c rat1o~ An ex;m1ple m1ght be the .,,,mplmg ot soil for purposes of
determmmg mventory but usmg the same datil to determme 1SOtop1c ratiOS among
umque 'eatures. such a:;, 1n dramage channels. Larger or more dense put1cles can be
separated from smaller or less dense piHttcles bv smttn~ ,1nd redeposttton dunng
eros10n ep1sodes gtv1n1; r1se to Isotopic rat1os dltferent th<m those of the source
mf\terlc'll.
Another example rmght mv~)l\l' :~e :-n.1ruwr :n \vh1ch vegetatiOn ,,.._-cumulates
-:ontamtnf\ted putJcles \'egetat1on :n th.> Mtd :'<TS 1.:nv1ronment can ,,.:cumulate
pluton1um :n two \\,1\S !l) rl1l)! l•t't.li-.1.' '.1t dJ::.'.ul,t>d f'lutoni;Jm .. \nd (2) d!fect
.................................... __________________________ ._ __
., >i. t/ <J]
depm1t10n and capture nt resuspenaed ;·.~rtJC.t'~ ,·_,r,t.>Inin~ f-~lutomum lt 1s believed that the ISOtopt>~ nr pi~tO~I~JrT. \\ :ii :·.-:t : ~.\.~L<'n.>te tlnce d1ssoi .-~·d and dunng the uptake process Ho>vt'\t'r r:.•.:t.,,i~.;:Iun ,.~n tlCCur ;: the ~,1urce ot plutoruum parttdes 1mpact1n~ the ~~I.HH \ .H:e~ 11~ '~''tt1~':.: ~;\tto w1th siz.c dens1tv. or solub!litv
Another exampie mvolves the po~.s1t:ie ~t>paratJOn t)l part:cles 111 the oovme rumen. Larger or more d.mse part1cles ot one 1sotop1c rJtlo may settle and not be t!asilv dtssolved whereas smaller or less dense p.ut:c!es -. ... ·1th a dtfferent 1sotop1c rano wtll be more eastly m1xed w1th the rumen l!qutds ·~amplmg ot rumen contents that does not accommodate those several components could Introduce b1ases tn
ratios. Sampling of ammal tissues at var.ous t1mes dunng the life of the animal may introduce d1fferences 1n Isotoptc ratJ,)S li the depos1t1on of the plutomum In vanous tissues zs dependent on tzme or ~tage t'f tt~sue ~rowth .1nd the .1mmal 1s exposed to source maten.1ls ut dtffertn~ ~.•t:os .1: d1fiert.':1t t1mes
Sample Preparation
Certam steps 111 ~"1mpit.> prep.u.1twn :; .. )'. -.:.1u~t' :r.~t:tiOn<Hton ot m~tenals of differing !SOtoptc ratto ln the case ot soil prep.uat1on. hr1ndmg ana s1evmg are two steps that alter the prtrttcle SIZe clnd distribUtiOn tn the Frepored sample If small particles are ennched 1n nne plutontum t~otope .HHl :hP l.uger puttcles .ue erutched in another plutomum tsotope, the resulti'lnt ":>tevt>d <..1mple could rdlect .1 bias relative to the tsotoptc d1stnbut10n tn the totcli ":>l)tl ~.1mple
VegetatiOn samples usually .1re not mantpulatt:>d bv phvstcal means except for direct ashing before dtssolut!On There .1ppeus to be no meam. oi tsotoptc separation dunng the preparatiOn ot vegetation samples for .1nalys1s.
Deposttlon of Ingested plutontum In c1ntmal !iSSues tn the broad sense IS
umform. Dtfferenttal depos1tton 111 org.1ns. :,uch "~ bone. does occur on a m1cro scale. Sampling of ."'mm<\1 t1ssues lor .1n.1lvs1~ gener.1llv uses large port1ons of the t1ssue so that spattal depos1t10n ot d1iferent ISotopes henerally would not be detected.
Chemical Purification
Proper analysts for pluton1urn 111 en\ lrtHHnei\t.ll "·'mple:, requtres (Ornplete dissolutiOn of the ~.,mple rnatrtx ,,nd :urwers1on ui the plutontum to an appropnate ox1dat10n state. For soils .1nd geolobtc :natenals, the sample 1s dtssolved 1n hydrofluonc-nttrtc·hydrochlonc <ICtds For veget,>ttOn, the same procedure follows a prelimm.uy .1sh1ng step lf d1ssolut1on ::-. tncomplete. so that mor~ refractory parttcles ennched m one ~~otope Me not completelv d1ssolved. the resultmg ,,nalyttcal results wtll retlect more ot the less retractorv matenal (more soluble) and thus b1.1s the resultant ~~otoptc ~.1t1o tor the qmple
Dissolved plutontum 1::. sc.1n:onged on :ron hH1rox.de. converted to Pu• 4 , and separated from the matrtx ,1nd ,·nntamln,H'.b h <iliOn t.>xchange nr solvent extr.<ctton lncomplt?te :-,ep.or;tlton or diSSOi\ ~·u m •-,)ltd nLHrtx m.uen.<ls produces .1

i0/6/93
thiCk ·!iectrodepOSlt. whiCh CJn degr;1l1t' nw .upna ~pt'Ctrum \uiSCUSSed below)
Incomplete separatiOn c.:~n .1lso allow tne retent1on m the sample ot rad10nuclides.
wtth alpha energ1es SlmticU to those or tne i-'lutomum botopes anc thus mtertere in
the quantlficat10n ot those pluwntum .sotopes .1lso \.ltscussed below).
Rad10nuclldes that c<1n tntertere .He hsted :n T.)ble • ; <lnd tnc!L.de natura~ly
occurnng ISotopes as well as r.1d1onucildes added a~ '-teid tracers :\menClurn-243
and 232U may be added to the .:mgmal sam?le as tracer~ tor 2~1Am tand cunum) and
the uramum ISOtopes, respecuvelv. tn a sequentlai separat;on of plutomum .
. 1menc1um lcunum), and urar.1um
·weapons plutomum contams stgnlficant levels oi :4\Pu. Th1s plutomum
decays w1th a 13.2-y h;~lf-life mto :4\Am. If the amertctum 1s not quantitat1vely
removed dunng the chem1cal ckanup. : 4 : Am (an contnbute alpha counts to the
:38pu peak reg10n. If the punfled plutoruum ')ep<Hated irom the sample lS not alpha
.:ounted w1th1n a week or twu. measurJb•e ,,mounts ot ~4\Am wdl grow mto the
sample, adding counts to the ~JRpu peak re~1on The amount ot both ~41pu and
~3Rpu were determmed .1nd the .1mount ot ::'-ll Am tr.~rowth w<\S c.1lculated as a
fraction (Relative A(tlVltv) or the :JHpu r·resent tn the ~.1mple For Area-13
plutomum, the eifect l)t 241Am tnpowth on ~~HPu ~~,,bout 1'\, 1n JO days and
reaches ;1 maximum m .1bout 70 ve.us Ingrowth ot ~ 4 1 Am ;'PP('i\rS to be " negllg1ble
problem tn most labor<~:ones
Alpha Spectrum Analysis .tnd l.1boratory Procedure~
Plutomum measurements bv .1lph;1 <.pectrometrv us1ng surface barner
detectors mvolve several problems :v1ost .1lphll em1tter5 ()!ten encountered in
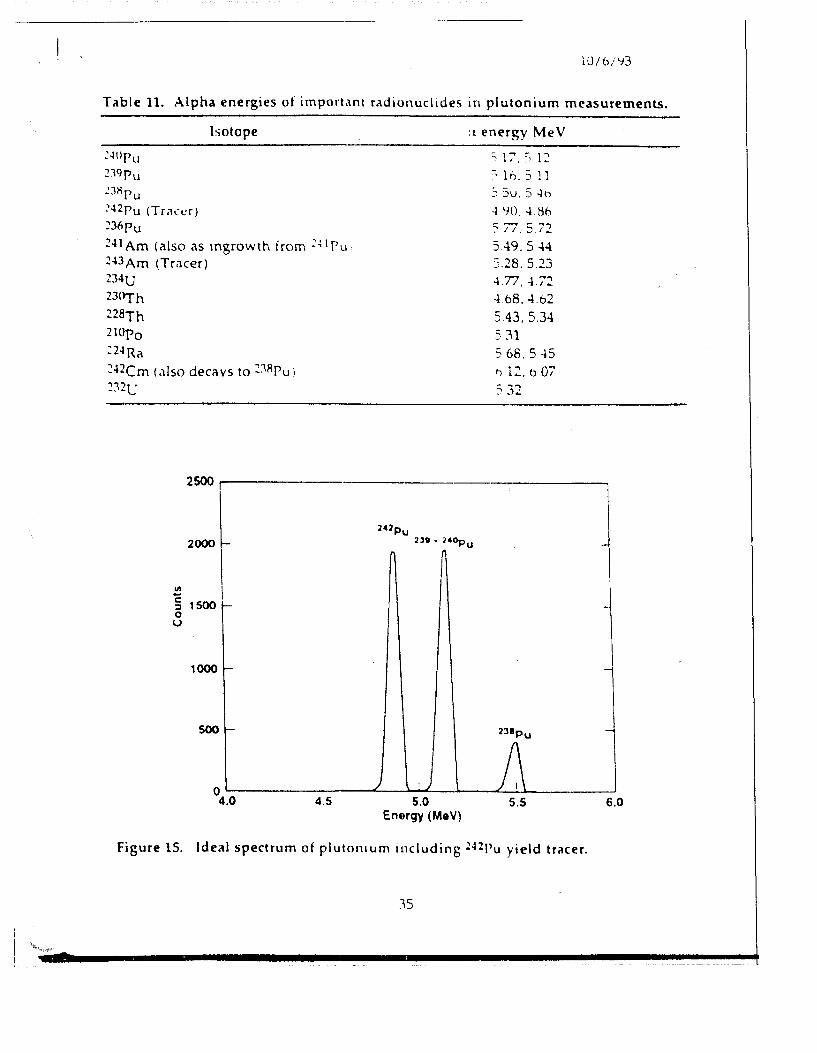
environmental samples Me tn the r<1nge of 4 to o MeV. as md1c<1ted in Table 11.
Thus, 1n the extraction oi plutomum It 1s 1mport<1nt to remove other interfering
r<ldionuclldes. Figure 15 shows ,, typ1cal. clean ,1lpha spectrum that the analyst
.utempts to obtam. Th1s type of spectrum 1s obta1ned 1f the chem1cal purification
steps ue conducted properlv .1nd rt?mov.:tl t)f tnterf('rtng rildtonuchdes IS effective.
However. -:ontamm.1t1on from ~41 Am would not De detected 1n th1s type of
spectrum Poloruum-210 can be m1smterpreted ,1s DRpu d the i\nalyst does not properly
l'Valuate the alpha spectrum A clean spectrum 1ncludmg 210po 1s shown 1n Fig. 16.
The mtederence due to 210Po 1s most llkely to occur w1th a less clean spectrum with
lew 238pu counts; m such cases. the pos1t10n of both the ~ l!lpo <'lnd 2:\Rpu alpha peaks
.ue not ,1 wavs well defined \-1tslnterprPtl1tlon mav .11so occur tf peilk sei\rching
routmes ,,re used to extr<~ct .1lpha spectrum J,1tl1. :1nd the .1nl1lvsts h.we difficulty
rE~cogmzmg the 2:\Rpu energy reg1on w1th Il)w numbers of counts Polomum-210, 1f
present. can mterfere w1th :!J'/•2-lllpu energy bv t.11llng Polontum contammat10n
mav <HlSe from tncomplete ·hemtc.11 .,epariltlcn .1nd/or from detector
cont.lmtnatlon bUildup over t!ldenC:Pd u-.e :ncomptete sepruat1on ut 2lllPo can occur
lU/6/':13
Table 11. Alpha energies of import.uH radionuclides in plutonium measurements.
2·Wru z:wru ~ 3"ru
Isotope
~~2Pu CTra.:t:r) ~36Pu
2~1Am (also as mgrowth from 2~1Pu 243Am (Trilcer) 234U
23C'r'fh 22BTh 2lllp0 ::2~Ra
~~2Cm (,llso decavs to 2lRpu 1
::~2L:
2500
2~J Ill
c :I 1500 -0 u
1000 r-
242pu
:1 energy MeV
n11. <•Opu
~
c,J7.'l]~
'~ lh. 511 S5u.54tJ
-- ,... ~., ') I I. ':J.I-
5 49. 544 5.28. 5.23 4.77. -1.72 4 68. 4.b2
5 43, 5.34 5 31 568.545 t") 1::. () 07 - ~.,
) .J ...
I
\
I
I I
I 1
~~~----------------~/~-~~'---~---~L2J-I~~~u-----------~ 4.0 4.5 5.0
Energy (MeV) 5.5
Figure 15. Ideal spectrum of plutomum including 2Upu yield tracer.
::15
6.0

10/6/93
3000 I
i I
' I '
I I
I 2500 1- -1
i ' I I l \
239pu I
2J&pu !
2~l _.
I
Ul \ c: I
1500 I
::J l 0 u i
i
1000 f- I I -1
I ::Japu i I I
500 f- I 210p0 1 I I
) I
' l) I 0 4.0 4.5 5.0 5.5 6.0
Energy (MeV)
Figure 16. Spectrum of plutonium and 210Po with l36pu tracer.
m the sample or 210po can occur as iln 1mpursty 1n reagents (e g., phosphoric acid
used to polish the electrodepos1t1on plates) The removal of 210po contamination is
possible by self-plating on mckel or copper from dilute HCl pnor to plutonium
electroplating. When 242Pu tracer 1s used for v1eld determination. sample
decontamination from natural uramum should be complete due to the possible
mterference of 234lJ into 242pu energy regton ( .1lthough this m.ay not affect the
239•240Pu/ 238pu ratio, 1t will result m an over estlmote chem1ci\l yteld). Sample
decontamm<~tion from nllturlll thonum should be also complete because some
232Th progeny may mterfere w1th the plutomum peaks. If 23llpu tracer is used for
chemtcal yield determinatton, peak tatltng of 23opu 1nto the DRpu regiOn must be
considered. Americium-241, if present m h1gh concentrilttons and not completely
elimtnated from the pluton1um tract1un. wtll uHcrft:'rt' w1th ::!:'\Xpu
It is also Important for .1lpha spectroscopy to produce very th111 plutomum
depostts pnor to counting to prov1de mcll(lmum resolutiOn. With the mcrease cf
36
\
'
i I I
I i
I
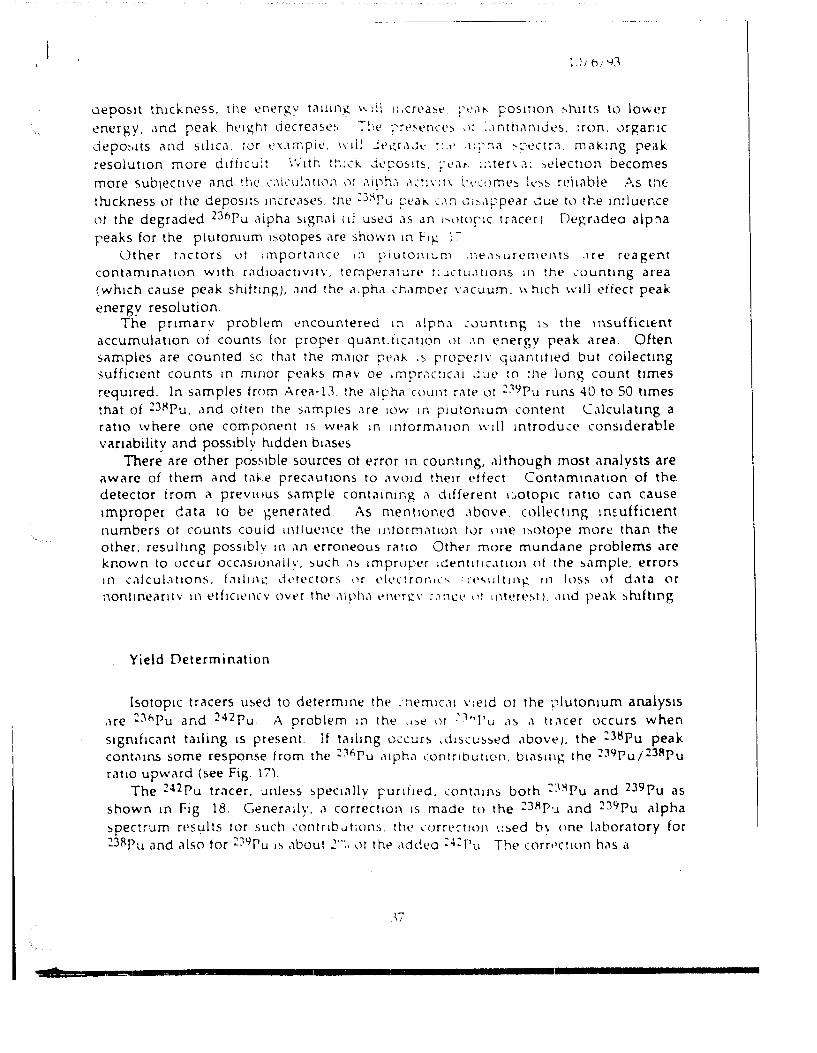
depo51t th1ckness. the energv t.1111111:, '' :i\ J:.Cfl'J!'>t' ;'t.'•"'-· f'OSitlon :-.h11ts to lower
energy, .u1d peak he1ght decrease~. T!-,e ~,~t'~t·nu•:-. ,,: :.•ntn;1n1Jes. :ron. "ugar:1c
Jepo~.tts ,u1d sdtc.1. :or eompie. \\ d! Je~r.1.Jt· ~:.t• .l:~'na ~~~·ect~;~. makmg peak
resolutiOn more d1iflc.J:t \'hth t!".:ck. .Jq.;os1ts. ~-t~<tt. ::'.ten .1 • ..,dect1on becomes
more sub1ect1VC i'lnd the ,·;ilcui;HI(':I ,,t iliph:; ;1c~1\ :t\ L'•.'CtJme::, it·ss relli'lble As t:1e:
thlckness or the depos1ts JncrL'ases. the 23:-ipu peal>- .:.1n l;;:-,,!Fpeor c:ue Ill the tntluence
or the degraded 236pu alpha Slgn.'ll ( d U!>t?d .15 an i'Lltupc tracer 1 Degrildea alp!1a
reaks for the plutomum I!>OtOpeS ilfl' shmvn In fl.: ; -:-(_)the r t.l c tors ll t 1 m port" n c e ' :< p 1 u ton 1 " m ; ne ,, :-. u r e 11\ en t s . 1 r e rea gent
contammat1on w1th r<ldtOaCtiVIt\'. ter:'lper.1ture r:·...~ctu.ltlOns 111 the .:ount1ng area 1wh1ch cause peak shdtmg) .. 1nd the a.pha .:hamoer \'ilCuum. \\ h1ch will dfect peak
energy resolution. The prtmarv problem encountered 1n .1tpn:~ :0unt1ng 1s the 1nsufficu:-nt
accumulatton of counts for proper que~nLflc,ltlOn l1t .m energy peak area. Often se~mples are counted sc that the mator pt'<tk .~ rropert\· quant1t1ed but coilectmg suffioent counts 1n mn10r pertks milv oe 1 mpr.<C:IC.11 J ~e :o :he lung count t1mes
reqUlred. In samples from Area-!l. the alphil count r.1te ot ~.1<:1pu runs 40 to 50 times
that of 23HPu. and often the ~.1mp1es .He 10w 1n piuton1um content C.1lculat1ng a ratio where one component IS wpak :n 1ntorm.1t1on wdl mtroduce constderable Vi'lnabillty and poss1bly hidden b1ases
There are other posstble sources ot error m countmg, .1lthough most ,1nalysts are awcue of them and t;~ke precautiOns to .wmd the1r etiect Contammat10n of the. detector irom '' prev1uus sample cont;:11nmg ,, dtffPrent 1:,otop1c rC\tlo ciln cause 1mproper data to be generi\ted r\s mentiOned .1bove. collectmg msuffiClent numbers ot counts could 111tluence the lnlorm."'tlon tur une ~~otope more than the other. resultmg poss1blv 1n ;1n erroneous r<HIO Other more mundane problems are known to uccur occ.151UIIc1llv. ::.uch .!!> lmprtlper .dentttiC.Itlon ot the ::.ample. errors 1 n .;: .11 c u L1 11 o n s . f.11 I 1 11 ;.:: d l't e c to r s , ) r l'l~.· ct r o n ,,. " • ,- • · '>~; l t 1 n ~: 1 n loss o t d .1 t a o r nonllneantv 111 t:.>lfiCit'IKv Llver the .11ph.1 l'lwr~::_v ;.ln(l' \lt 111ll'fl'St) .. 11\d peak !>hlfhng
Yield Determin<ltion
lsotop1c tracers used to determ1ne the . nem1c.11 v1e1d ot the ~1lutomum analys1s .~re 2:H'Pu and 242pu A problem 1n tht• .~:,e ,11 :'''Pu .1s ,, tr.1cer occurs when
s1gmf1cant talling IS present. If tiHilng occurs , dtscu!>!>t'd .1bovt> ), the :3HPu peak cont.11ns some response from the ~:lt;pu .11ph.1 ~.:ontrtbutwn. bl<ISII\h the ~:wru;23Rpu rat1o upw.ud (see Fig. 17)
The 2·i2Pu trilcer ... mless spec1Jlly (-'unfled. cont."'lns both ~J~Pu and 239pu as
shown 10 Fig 18. Generally .• 1 correctiOn 1s made to the 2JRp.J and :!39pu alpha
spectrum rest,.~lts tor such ~.:ontnb.;t:ons. the d.Hrl'Ctton t:sed b\ nne L1boratory for 23Rpu and also tor ~~'lPu 1::. .1bout 2":. lH the .1ddea :.;:ru Tht> corr•'Ctlon h<~s a
3~~----------------
I I
2500 I! I
\ I
2000 t!
Ill j c L :s 1500 I
8 I
1000
Summation
spectrum~
4.5
',
2311pu
5.0 Energy (MeV)
5.5
Figure 17. Spectrum of plutonium from "thick" ~lectrodepof>it.
10/6;93
i I .....
! -1
\ I
_j \ i !
l 6.0
proportionately greater miluence tor the =•l'\ru <llph;~ penk than for 239pu alpha peak;
for samples wtth low 23!\pu, th.ls correctiOn may be a very I<Hge proportion of the
.1lpha counts thus masktn£ the DXpu peilk 1nform.1t1on
Quality Assurance/Control
Lack of appropriate quality control may <lllow 1ncorrect results to be generated.
Blanks, spikes, ;md replicates are usual'y mcluded 1n the s.1mple stream. Rev1ews of
the results from blanks, spikes. and replicates illong w1th logtci\1 ,,ssessments of the
sample results Me used to assure thilt gross errors e1ther 1n the whole data set or in
38

10/6/93
3000
\
i ;:42pu
I i 2500 f- I
I ! I
I : i
2000 ~ I
-1 I
i
Ill I
c 1500 ~
:I 0 I u
1000 ~ ~ !
\ ~ SOOL 239. ~40pu 2J&pu I
6 ./1\.._ l 0 6.0 4.0 4.5 5.0 5.5
Energy (MeV)
Figure 18. Spectrum of H2pu showing DCJpu and l38pu contamination.
mdividual analyses c"tre mm1m1zed In the case of plutomum analys1s. often the
~38pu act1v1ty levels ore low compared to ::J9pu oS noted obove. and the tendency lS
to concentrate on 239pu analysts for qu.11ltv control. th1s may leave 238pu data at risk
.1nd thus b1ases m the calculated tsotoptc r.lttos
Counting Statistics and Censored Data Sets
R.O. Gilbert
The use of ratlos of concentratiOns or actlVttleS of radionuclides is an 1mportant
top1c in environmental studies of radioactivity Statistical considerations in the
generation and use of such ratios have been reviewed (Doctor et al. 1980). Apparent
differences tn bioavaililbility of 23Mpu and 239pu cC\n be C\n ;utifact of different
amounts of CE!nsoring of data sets fer these two tsotopes A data set IS sa1d to be
"censored" if a known proportion of the data set 1s mtss1ng. For many data sets, a
measurement below the detectton llm1t 1s reported ;-1s "not detected" (NO). "below
39

tne aetectton hm1t."' ~H 'less than· iLT: t:1c uL'tt•c:wn :::n1: Tren tr.l' datil 5et 15
"censored on the !eit" because vaild r7H~asurements .1re not .1vt11lable tor :1 known
proporttor, of the samples Data ~t>ts or 21 ~Pu trequt>t'.t>' :--..>ve a :'.reater degree oi
ceruonng than those oi 23<Jpu because en\·tronmer.tal -:oncentr<'tto 1s ot 23!lpu tend
to be lower thi\n those ior : 39 Pu Th;s ,•rrect -:.-:n lL'.hJ t() ~pu.xous (onclusLons
r~gi\fdtng dtfferentlul biOi\\'illiabdlt~ .
The effect of a differenual amount of censorxni; nn estxmated biOov<ulabtilty
depends on how the data are statlsttcall•· analvzed. One method of analysts ts to
d1vide the mean 2JRpu concentratiOn bv the mean ::.9pu concPntrat!On. For
example. suppose for a gtven medta. sav soil. \'lie\ 1) compute the mean of the 23Bpu
data that are above the 238pu detecuon hmtt. t2) compute the mean of the 2J9pu data
that are above the 239pu detection hmtt. and 13) dtvtde the :3Hpu mean bv the 239pu
mean. ~ow, tf the 23Rpu data set 1s more heav:iv censored than the a :39pu data set.
1 e .. a greater proportion ot the smallest :JRpu ..::oncentri\ttons ;ue mtssm~. then the
computed ratiO of means will be l<Hger than d no censonn~ h,"'d occurred. If 238pu
data sets become progresstvelv more cen~.ored on the 1eft .1~ we go up the rood cham
te.g. m the order sod. vegetat1on .. uthropods. -;mall r:1ilmm<~ls l. then the rauo of
means also becomes progresstvelv more b1.1sed h1~h Hence. thts type of analysts
td1v1dmg the lJRpu n,ean by the ~39Pu mean\ could result 111 ,, spunous conclus1on
that the true (unknown) 23Rpu over 2:'19pt: riltlO mcrc•<~ses wtth mcreasmg trophic
level. i.e .. that differential movement of DRpu and D 11 Pu has occurred. Of course. tf
the1r true ratio does mdeed 1ncrease w1th trophtc !evel. th1s statiStical estlmatlon
b1as wlil exaggerate the true tncrease. Some :.tattsttcal methods for obtammg valid
est1mates of means from censored data sets Me d1scu~~ed 1n Helsel (1990) and GLlbert
(19~7) If some measureml'nts bl>low the dctect1on l1mxt .~re reported ils zero. these
zeros should not be used as real measurements L'smg these zeros as tf they are
vahd data will result m means that .ue b1ased low T~erefore. spunous conclustons
regarding differential movement could occur 11 ~he number nf 111d1cator zero
measurements ts larger tor the htgher trophtc levets
Often. both 238Pu ;md 23'JPu measurements .ue made on each t~nvtronmental
sample of sod. "veget<Hton. etc In th1s case. lor e;\o.:h sample. we can divtde the 238Pu
measurement by the ~J'lpu measuremet'< ro obt;Hn ,, r.1110 tor the 1ndtv1dual sample.
Then we can compute the mean or the geomt:>tr1c rr.e,,n ,11 the 1nd1vtdual ratiOS for
each enVIronmental medi,1 Of COUr~e. the mei\n filtlO IS COmputed USing
measurements only for those medta samplts \ ... here both :lHpu and 231Jp u
measurements .ire above thetr detect1on hm1ts Hence. the value of the computed
mean ratto will be dtfferent from the nxe;ln r<'ltto th;'lt v.-ould have been computed 1f
:neasurements for all samples are above the delect1on l:mtt If the 238pu data sets
become progressively more censored on the left as we ;o up the food chain, the
mean ratio may or may not tend to 1ncre<~se .1r decr('ose Certamly. a spurious
1ncrease •Jr decrease could occur d mdt\'ld'Jal ~amples wtth ~~RPu or 239p u
measurements below the detectHm llm1t h.w( .1 concentr.1t1on ratto that 1s different
40
'I
:rom sa:npieS tor WhiCh both lSOtOpt:~ :· .. nt' ~~:t_>,~~urements clbO\'(' the deteCtlOn
:neasurement ,1nd countmg t'rrors· .lr.lon~ ~.~rn~'.t':, ...:.>l'~ ::.Jt
t:1.1n rro::n rZ~ndom
-:,t't'm ~~laus1ble. the
-:omputat10n or mean r.HIOS St't?ms pereraote t<' -:DrnFu::ng r.ltlOS l11 means as
.::ilscussed Ill the lrnmedlatelv preceding r.~rapapn :\n :r..port(lnt ;·.spect of the etfect
oi censonng 1s the correlation ben .. :een .::onccnrrJt:ons or ~3llpu Jnd ~38Pu. If
perrectly correlated (r = 1.0). w1th some cunstant rat1o. then censonr.g or the data sets
'.vlll have no erfect on the mean of the r."'tiOS or the r .1110 ,n the meiins However. at
~ess than perfect correlatiOn. the effect or censor1ng w:ll be as descnbed above. In the
Section "Expenmental Tests" below. '' cornputer :-:lmUii\tlon studv IS suggested for
exam1mng the magn1tude of b1as for the two estimators the ratio oi means and the
mean ratio. The effect of censored dJta sets on the \'.'llldlt\' of the data summanes
discussed m the sectiOn 'Utl'r(lture Rent>\'\'· :s .1ddre~~ed bv each author of that
sect1on.
Hypotheses
E H [sszn~ron
The observc1t10n th<H organ.~ or .m1m."~ nrut':tl'() .1 lllV"l'r :·wru; ::~HPu r.1t10 than
that of the sod or plants upon wh1ch thev brazed h.1s r.11::.ed the que::,tlOn of possible
differences 1n 1sotoplc preference 1n btOiog1cal mcorpori\t1on It 1s poss1ble that the
aruma! can absorb the 1sotopes dlfferent1allv, LH that llnce .1bsorbed the 1sotopes can
bf' depos1ted 1n organs m rJtlOS d1fferent trom the ~ource m.1tenal Other possible
~ources for the observed rat1o d1fference rn;n- be the n.1ture of the source material
;md subsequent .jlfferentl.'ltlOn due to t•nvlrcnml'nt.1l L1ctors. mechamsrns of
1ngest1on. and mechantsrns of .1SSlffill.ltlon For t•xi\mple. 1ngest1on mto the
gastromtestmal (Gl) tract bv grazmg and 1ngest10n 1nto the lungs by inhalation are
two d1fferent pathways for mgest1on Poss1ble d1fference~ can also be mterpreted
from errors 1n analys1s llr problems 1n ISOtope qu.1nt1flc.1•1on cons1denng the lower
concentrations of DRpu .md greater d1ff1cultv :n quantification compored to that of
::l9P;;. The tollowmg d1scuss1on pesents hvpotrH.>St>s lll1 poss1hle iZ~ctors that relate
to the marufestatlon 1n organs oi ;>;rumals or '2~ 9 Pu: ~,HpJ I:':.Otoplc r:1t1os appearing to
be lower than those of the source m.1tPnal
D1fferences m biolog1c,,l uptake h.1ve been obsened v.:hen !>mgle 1sotope sources
were stud1ed For ell.<lmple. b1010g1c.1l asSilnd.ltlon l)t ~'"Pu trom ·' ~olut1on of 238Pu
hils been shown to d1ffer from th.lt ot .1 s1mllar solut1on oi :2~ 4 Pu. In one case. the
two ISotopes 111 the ::,,1me ,:hem1c.1l ..:.__,n~t.>r.tr;~t:on \'1. ill h.1ve n•rv different alpha
,1Ctl\.'ltles. ~JIIpu (ilalt-l:te = ~b 4 v; 1mp.1:ts ,, l11rger ,,mount ot .1lphil energy to the.
:-\stem. pos::.1blv (JUSlng the ~\~tl'm t.l ~'l' 1;anrl' r··.1Ct.>t> thc1n th(lt of the 239pu
41
~----------------------------~~~~~~~