UCLA Math REU 2013: Epilepsy and EEG/fMRIbertozzi/WORKFORCE/REU 2013/Epilepsy/final... · Temporal...
44
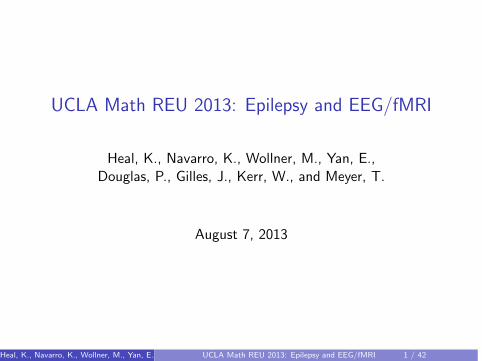
UCLA Math REU 2013: Epilepsy and EEG/fMRI Heal, K., Navarro, K., Wollner, M., Yan, E., Douglas, P., Gilles, J., Kerr, W., and Meyer, T. August 7, 2013 Heal, K., Navarro, K., Wollner, M., Yan, E., UCLA Math REU 2013: Epilepsy and EEG/fMRI 1 / 42
Transcript of UCLA Math REU 2013: Epilepsy and EEG/fMRIbertozzi/WORKFORCE/REU 2013/Epilepsy/final... · Temporal...
UCLA Math REU 2013: Epilepsy and EEG/fMRI
Heal, K., Navarro, K., Wollner, M., Yan, E.,Douglas, P., Gilles, J., Kerr, W., and Meyer, T.
August 7, 2013
Heal, K., Navarro, K., Wollner, M., Yan, E., Douglas, P., Gilles, J., Kerr, W., and Meyer, T.UCLA Math REU 2013: Epilepsy and EEG/fMRI 1 / 42
Part One
Epilepsy Classification Using Positron Emission Tomography (PET) Data
Heal, K., Navarro, K., Wollner, M., Yan, E., Douglas, P., Gilles, J., Kerr, W., and Meyer, T.UCLA Math REU 2013: Epilepsy and EEG/fMRI 2 / 42
Temporal Lobe Epilepsy (TLE)
Most common of localized epilepsies
Patients with Non-Epileptic Seizures (NES), Left Temporal LobeEpilepsy (LTLE), Right Temporal Lobe Epilepsy (RTLE), andBilateral Temporal Lobe Epilepsy (BTLE)
Early detection and treatment are important
Heal, K., Navarro, K., Wollner, M., Yan, E., Douglas, P., Gilles, J., Kerr, W., and Meyer, T.UCLA Math REU 2013: Epilepsy and EEG/fMRI 3 / 42
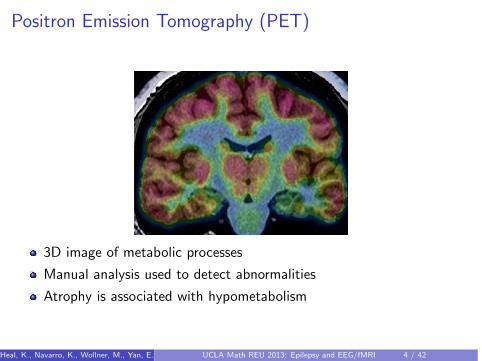
Positron Emission Tomography (PET)
3D image of metabolic processes
Manual analysis used to detect abnormalities
Atrophy is associated with hypometabolism
Heal, K., Navarro, K., Wollner, M., Yan, E., Douglas, P., Gilles, J., Kerr, W., and Meyer, T.UCLA Math REU 2013: Epilepsy and EEG/fMRI 4 / 42
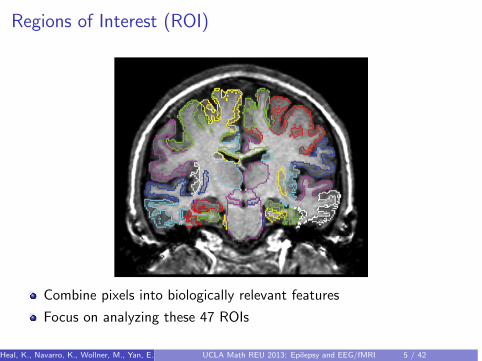
Regions of Interest (ROI)
Combine pixels into biologically relevant features
Focus on analyzing these 47 ROIs
Heal, K., Navarro, K., Wollner, M., Yan, E., Douglas, P., Gilles, J., Kerr, W., and Meyer, T.UCLA Math REU 2013: Epilepsy and EEG/fMRI 5 / 42
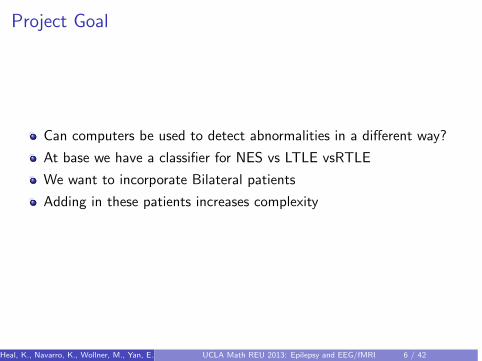
Project Goal
Can computers be used to detect abnormalities in a different way?
At base we have a classifier for NES vs LTLE vsRTLE
We want to incorporate Bilateral patients
Adding in these patients increases complexity
Heal, K., Navarro, K., Wollner, M., Yan, E., Douglas, P., Gilles, J., Kerr, W., and Meyer, T.UCLA Math REU 2013: Epilepsy and EEG/fMRI 6 / 42
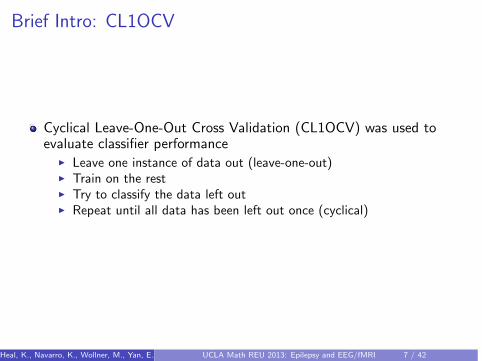
Brief Intro: CL1OCV
Cyclical Leave-One-Out Cross Validation (CL1OCV) was used toevaluate classifier performance
I Leave one instance of data out (leave-one-out)I Train on the restI Try to classify the data left outI Repeat until all data has been left out once (cyclical)
Heal, K., Navarro, K., Wollner, M., Yan, E., Douglas, P., Gilles, J., Kerr, W., and Meyer, T.UCLA Math REU 2013: Epilepsy and EEG/fMRI 7 / 42
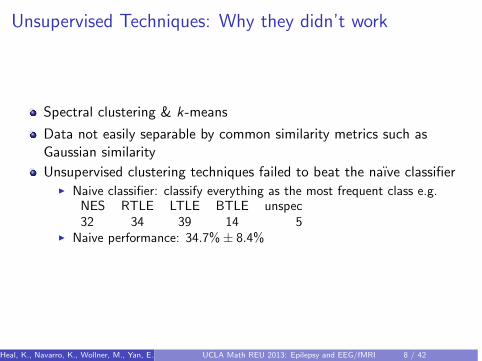
Unsupervised Techniques: Why they didn’t work
Spectral clustering & k-means
Data not easily separable by common similarity metrics such asGaussian similarity
Unsupervised clustering techniques failed to beat the naıve classifierI Naive classifier: classify everything as the most frequent class e.g.
NES RTLE LTLE BTLE unspec32 34 39 14 5
I Naive performance: 34.7% ± 8.4%
Heal, K., Navarro, K., Wollner, M., Yan, E., Douglas, P., Gilles, J., Kerr, W., and Meyer, T.UCLA Math REU 2013: Epilepsy and EEG/fMRI 8 / 42
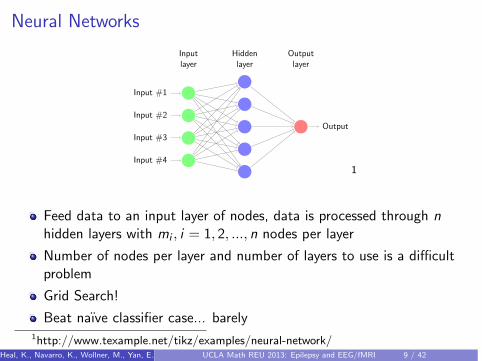
Neural Networks
Input #1
Input #2
Input #3
Input #4
Output
Hiddenlayer
Inputlayer
Outputlayer
1
Feed data to an input layer of nodes, data is processed through nhidden layers with mi , i = 1, 2, ..., n nodes per layer
Number of nodes per layer and number of layers to use is a difficultproblem
Grid Search!
Beat naıve classifier case... barely1http://www.texample.net/tikz/examples/neural-network/
Heal, K., Navarro, K., Wollner, M., Yan, E., Douglas, P., Gilles, J., Kerr, W., and Meyer, T.UCLA Math REU 2013: Epilepsy and EEG/fMRI 9 / 42
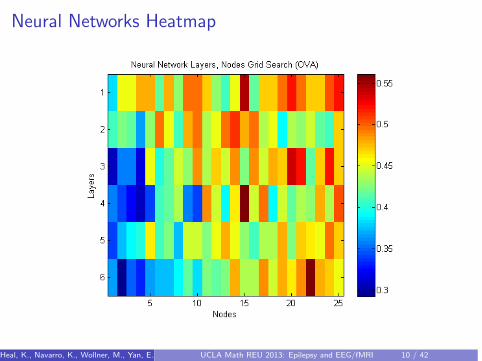
Neural Networks Heatmap
Heal, K., Navarro, K., Wollner, M., Yan, E., Douglas, P., Gilles, J., Kerr, W., and Meyer, T.UCLA Math REU 2013: Epilepsy and EEG/fMRI 10 / 42
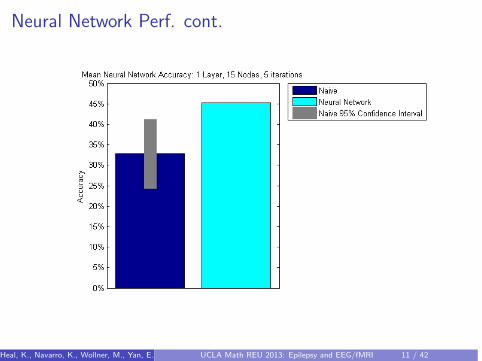
Neural Network Perf. cont.
Heal, K., Navarro, K., Wollner, M., Yan, E., Douglas, P., Gilles, J., Kerr, W., and Meyer, T.UCLA Math REU 2013: Epilepsy and EEG/fMRI 11 / 42
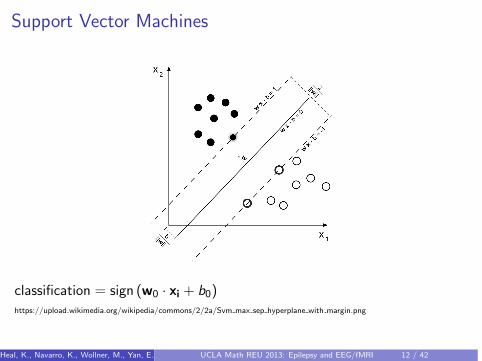
Support Vector Machines
classification = sign (w0 · xi + b0)https://upload.wikimedia.org/wikipedia/commons/2/2a/Svm max sep hyperplane with margin.png
Heal, K., Navarro, K., Wollner, M., Yan, E., Douglas, P., Gilles, J., Kerr, W., and Meyer, T.UCLA Math REU 2013: Epilepsy and EEG/fMRI 12 / 42
Support Vector Machines cont.
Many datasets, however are not linearly separable
In 1995, Cortes et al. introduced the soft margin hyperplane
described by the objective function 12w
2 + CF
(l∑
i=1ξi
)subject to the
constraints yi (w · xi + b) ≥ 1 − ξi ,
ξi ≥ 0, wherel∑
i=1ξi is the sum of training errors, F is a monotonic
convex function, and C is a constant
Allows classification of non-linearly separable data, but introducesadditional parameters to the problem (C , F )
Heal, K., Navarro, K., Wollner, M., Yan, E., Douglas, P., Gilles, J., Kerr, W., and Meyer, T.UCLA Math REU 2013: Epilepsy and EEG/fMRI 13 / 42
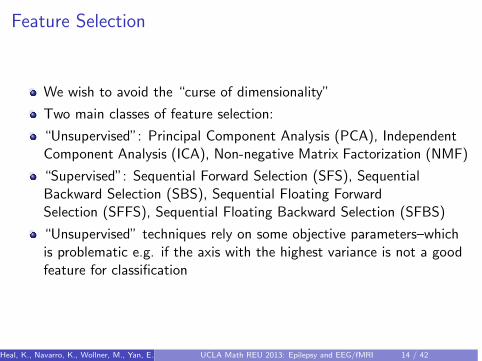
Feature Selection
We wish to avoid the “curse of dimensionality”
Two main classes of feature selection:
“Unsupervised”: Principal Component Analysis (PCA), IndependentComponent Analysis (ICA), Non-negative Matrix Factorization (NMF)
“Supervised”: Sequential Forward Selection (SFS), SequentialBackward Selection (SBS), Sequential Floating ForwardSelection (SFFS), Sequential Floating Backward Selection (SFBS)
“Unsupervised” techniques rely on some objective parameters–whichis problematic e.g. if the axis with the highest variance is not a goodfeature for classification
Heal, K., Navarro, K., Wollner, M., Yan, E., Douglas, P., Gilles, J., Kerr, W., and Meyer, T.UCLA Math REU 2013: Epilepsy and EEG/fMRI 14 / 42
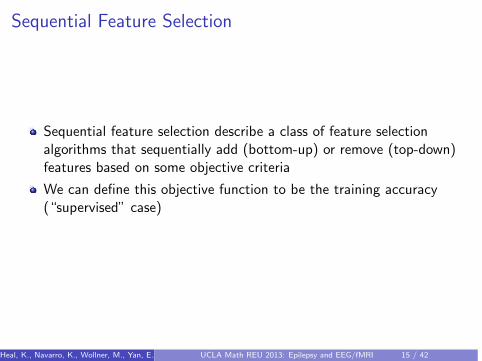
Sequential Feature Selection
Sequential feature selection describe a class of feature selectionalgorithms that sequentially add (bottom-up) or remove (top-down)features based on some objective criteria
We can define this objective function to be the training accuracy(“supervised” case)
Heal, K., Navarro, K., Wollner, M., Yan, E., Douglas, P., Gilles, J., Kerr, W., and Meyer, T.UCLA Math REU 2013: Epilepsy and EEG/fMRI 15 / 42
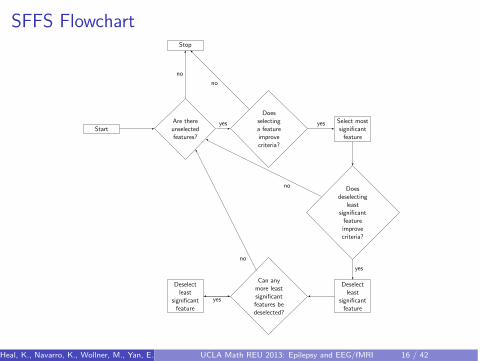
SFFS Flowchart
StartAre thereunselectedfeatures?
Doesselectinga featureimprovecriteria?
Select mostsignificant
feature
Doesdeselecting
leastsignificant
featureimprovecriteria?
Deselectleast
significantfeature
Can anymore leastsignificantfeatures bedeselected?
Stop
Deselectleast
significantfeature
yes
no
yes
no
yes
no
yes
no
Heal, K., Navarro, K., Wollner, M., Yan, E., Douglas, P., Gilles, J., Kerr, W., and Meyer, T.UCLA Math REU 2013: Epilepsy and EEG/fMRI 16 / 42
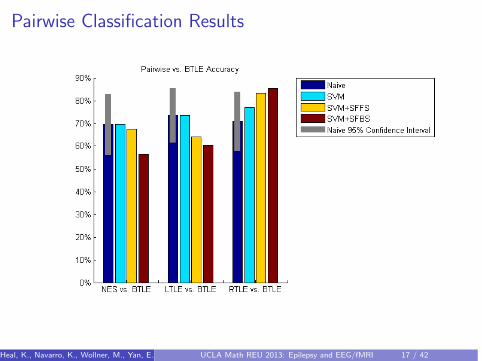
Pairwise Classification Results
Heal, K., Navarro, K., Wollner, M., Yan, E., Douglas, P., Gilles, J., Kerr, W., and Meyer, T.UCLA Math REU 2013: Epilepsy and EEG/fMRI 17 / 42
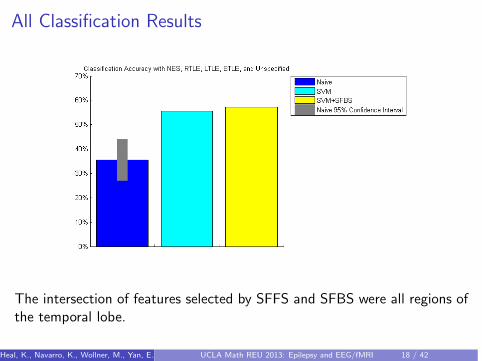
All Classification Results
The intersection of features selected by SFFS and SFBS were all regions ofthe temporal lobe.
Heal, K., Navarro, K., Wollner, M., Yan, E., Douglas, P., Gilles, J., Kerr, W., and Meyer, T.UCLA Math REU 2013: Epilepsy and EEG/fMRI 18 / 42
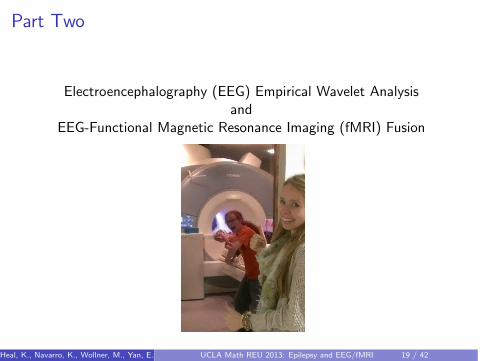
Part Two
Electroencephalography (EEG) Empirical Wavelet Analysisand
EEG-Functional Magnetic Resonance Imaging (fMRI) Fusion
Heal, K., Navarro, K., Wollner, M., Yan, E., Douglas, P., Gilles, J., Kerr, W., and Meyer, T.UCLA Math REU 2013: Epilepsy and EEG/fMRI 19 / 42
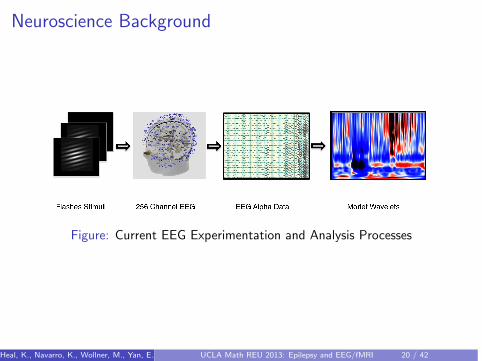
Neuroscience Background
Figure: Current EEG Experimentation and Analysis Processes
Heal, K., Navarro, K., Wollner, M., Yan, E., Douglas, P., Gilles, J., Kerr, W., and Meyer, T.UCLA Math REU 2013: Epilepsy and EEG/fMRI 20 / 42
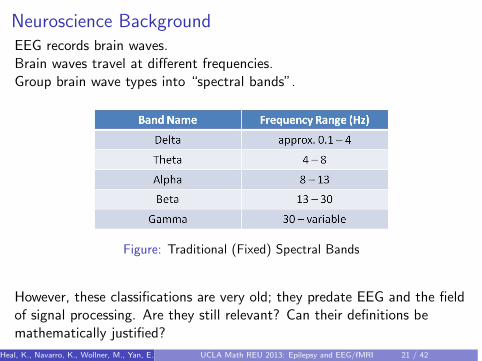
Neuroscience BackgroundEEG records brain waves.Brain waves travel at different frequencies.Group brain wave types into “spectral bands”.
Figure: Traditional (Fixed) Spectral Bands
However, these classifications are very old; they predate EEG and the fieldof signal processing. Are they still relevant? Can their definitions bemathematically justified?
Heal, K., Navarro, K., Wollner, M., Yan, E., Douglas, P., Gilles, J., Kerr, W., and Meyer, T.UCLA Math REU 2013: Epilepsy and EEG/fMRI 21 / 42
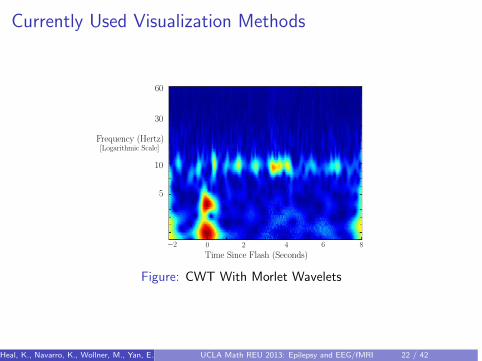
Currently Used Visualization Methods
Time Since Flash (Seconds)
60
10
5
30
Frequency (Hertz)[Logarithmic Scale]
−2 0 2 4 6 8
Figure: CWT With Morlet Wavelets
Heal, K., Navarro, K., Wollner, M., Yan, E., Douglas, P., Gilles, J., Kerr, W., and Meyer, T.UCLA Math REU 2013: Epilepsy and EEG/fMRI 22 / 42
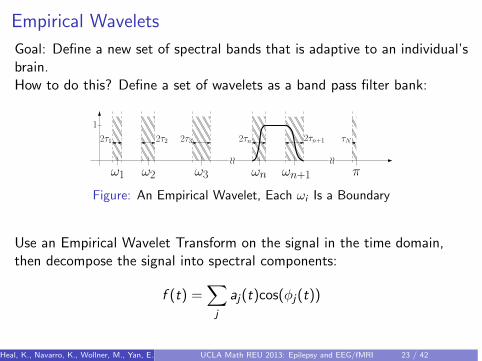
Empirical Wavelets
Goal: Define a new set of spectral bands that is adaptive to an individual’sbrain.How to do this? Define a set of wavelets as a band pass filter bank:
πω1 ω2 ω3 ωn ωn+1oo
2τ1 2τ2 2τ3 2τn 2τn+1 τN
1
oo
Figure: An Empirical Wavelet, Each ωi Is a Boundary
Use an Empirical Wavelet Transform on the signal in the time domain,then decompose the signal into spectral components:
f (t) =∑j
aj(t)cos(φj(t))
Heal, K., Navarro, K., Wollner, M., Yan, E., Douglas, P., Gilles, J., Kerr, W., and Meyer, T.UCLA Math REU 2013: Epilepsy and EEG/fMRI 23 / 42
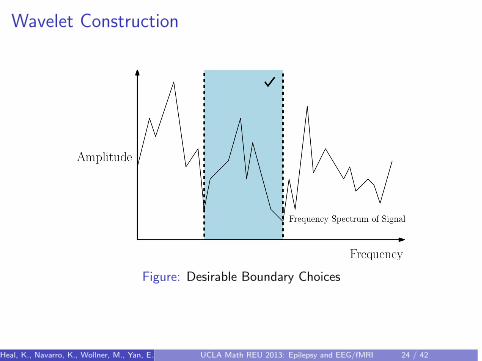
Wavelet Construction
Figure: Desirable Boundary Choices
Heal, K., Navarro, K., Wollner, M., Yan, E., Douglas, P., Gilles, J., Kerr, W., and Meyer, T.UCLA Math REU 2013: Epilepsy and EEG/fMRI 24 / 42
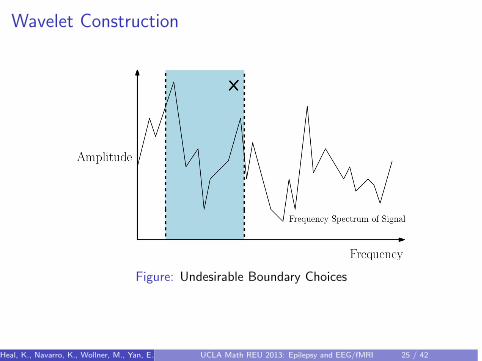
Wavelet Construction
Figure: Undesirable Boundary Choices
Heal, K., Navarro, K., Wollner, M., Yan, E., Douglas, P., Gilles, J., Kerr, W., and Meyer, T.UCLA Math REU 2013: Epilepsy and EEG/fMRI 25 / 42
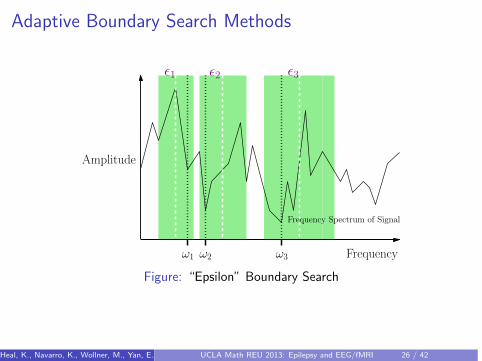
Adaptive Boundary Search Methods
Frequency Spectrum of Signal
ǫ2ǫ1 ǫ3
ω1 ω2 ω3 Frequency
Amplitude
Figure: “Epsilon” Boundary Search
Heal, K., Navarro, K., Wollner, M., Yan, E., Douglas, P., Gilles, J., Kerr, W., and Meyer, T.UCLA Math REU 2013: Epilepsy and EEG/fMRI 26 / 42
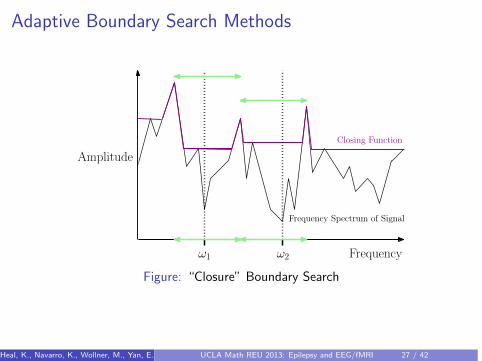
Adaptive Boundary Search Methods
Frequency Spectrum of Signal
Frequency
Amplitude
Closing Function
ω1 ω2
Figure: “Closure” Boundary Search
Heal, K., Navarro, K., Wollner, M., Yan, E., Douglas, P., Gilles, J., Kerr, W., and Meyer, T.UCLA Math REU 2013: Epilepsy and EEG/fMRI 27 / 42
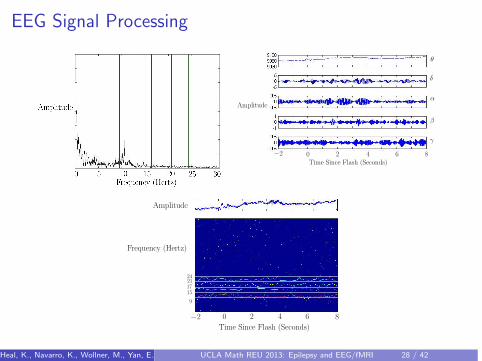
EEG Signal Processing
Amplitude
Time Since Flash (Seconds)
θ
δ
α
β
γ
0 2 4 6−2 8
0 2 4 6 8−2
2421
15
9
17
Time Since Flash (Seconds)
Frequency (Hertz)
Amplitude
Heal, K., Navarro, K., Wollner, M., Yan, E., Douglas, P., Gilles, J., Kerr, W., and Meyer, T.UCLA Math REU 2013: Epilepsy and EEG/fMRI 28 / 42
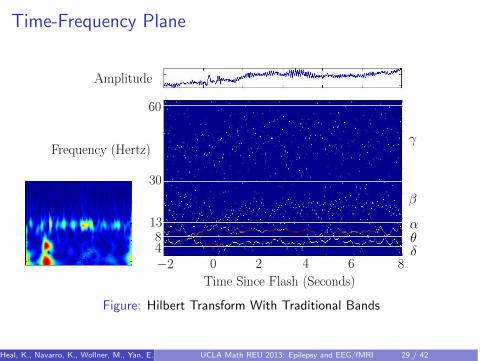
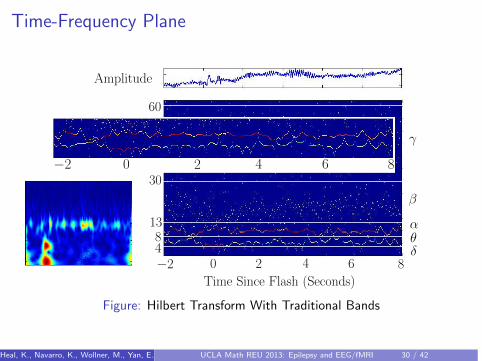
Time-Frequency Plane
0 2 4 6 8−2
γ
β
αθδ
60
30
1384
Time Since Flash (Seconds)
Frequency (Hertz)
Amplitude
Figure: Hilbert Transform With Traditional Bands
Heal, K., Navarro, K., Wollner, M., Yan, E., Douglas, P., Gilles, J., Kerr, W., and Meyer, T.UCLA Math REU 2013: Epilepsy and EEG/fMRI 29 / 42
Time-Frequency Plane
0 2 4 6 8−2
γ
β
αθδ
60
30
1384
Time Since Flash (Seconds)
Frequency (Hertz)
Amplitude
Figure: Hilbert Transform With Traditional Bands
Heal, K., Navarro, K., Wollner, M., Yan, E., Douglas, P., Gilles, J., Kerr, W., and Meyer, T.UCLA Math REU 2013: Epilepsy and EEG/fMRI 30 / 42
−2 0 2 4 6 8
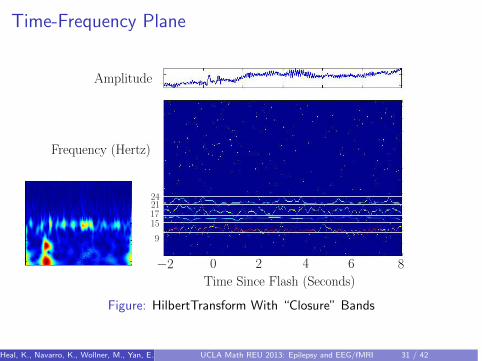
Time-Frequency Plane
0 2 4 6 8−2
2421
15
9
17
Time Since Flash (Seconds)
Frequency (Hertz)
Amplitude
Figure: HilbertTransform With “Closure” Bands
Heal, K., Navarro, K., Wollner, M., Yan, E., Douglas, P., Gilles, J., Kerr, W., and Meyer, T.UCLA Math REU 2013: Epilepsy and EEG/fMRI 31 / 42
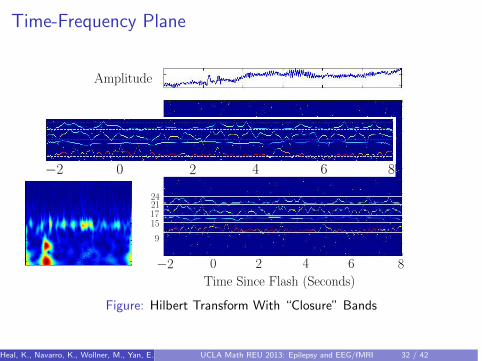
Time-Frequency Plane
0 2 4 6 8−2
2421
15
9
17
Time Since Flash (Seconds)
Frequency (Hertz)
Amplitude
Figure: Hilbert Transform With “Closure” Bands
Heal, K., Navarro, K., Wollner, M., Yan, E., Douglas, P., Gilles, J., Kerr, W., and Meyer, T.UCLA Math REU 2013: Epilepsy and EEG/fMRI 32 / 42
−2 0 2 4 6 8
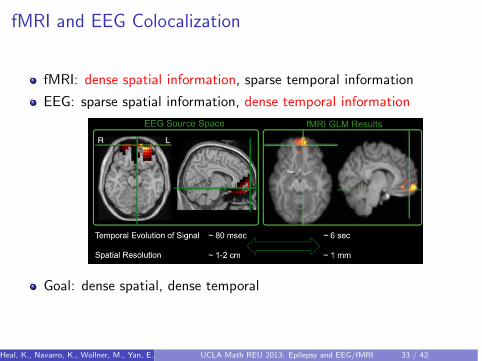
fMRI and EEG Colocalization
fMRI: dense spatial information, sparse temporal information
EEG: sparse spatial information, dense temporal information
Goal: dense spatial, dense temporal
Heal, K., Navarro, K., Wollner, M., Yan, E., Douglas, P., Gilles, J., Kerr, W., and Meyer, T.UCLA Math REU 2013: Epilepsy and EEG/fMRI 33 / 42
Standardized Low Resolution Brain ElectromagneticTomography
Solution to the inverse problem for EEG: localizing the exact sourcesof the neural activity measured as scalp electric potentials
Standardized Low Resolution Brain ElectromagneticTomography (sLORETA):
I Fairly good accuracy for deep sources (other methods misplace theseon outer cortex)
I Gives a smoothed result
Heal, K., Navarro, K., Wollner, M., Yan, E., Douglas, P., Gilles, J., Kerr, W., and Meyer, T.UCLA Math REU 2013: Epilepsy and EEG/fMRI 34 / 42

0.28 seconds before stimulus
time of stimulus
0.5 seconds after stimulus
Heal, K., Navarro, K., Wollner, M., Yan, E., Douglas, P., Gilles, J., Kerr, W., and Meyer, T.UCLA Math REU 2013: Epilepsy and EEG/fMRI 35 / 42
Temporal Kernel Canonical Correlation Analysis
Goal: find the maximal correlation between simultaneous EEG-fMRI,both spatially and temporally
Method: Temporal Kernel Canonical Correlation Analysis (tkCCA)
I Canonical Correlation Analysis (CCA): multivariate correlation betweentwo data sets (X and Y )
F finds the maximally correlated features of X and YF CCA uses covariance matrices (covariance of X and Y , variance X ,
variance of Y )
I Kernel Canonical Correlation Analysis (kCCA): reduces the dimensionsof CCA by using linear kernel matrices in place of covariance matrices
I tkCCA: allows non-instantaneous couplingF Use shifted X = multiple stacked copies of X with incremental
time-shifts of size τ
Idea: tkCCA on voxel-space EEG (after transformation fromtime-frequency) and voxel-space fMRI
Heal, K., Navarro, K., Wollner, M., Yan, E., Douglas, P., Gilles, J., Kerr, W., and Meyer, T.UCLA Math REU 2013: Epilepsy and EEG/fMRI 36 / 42
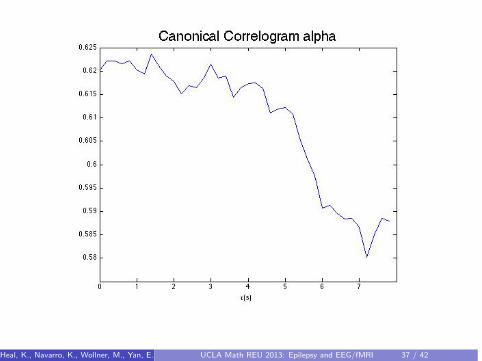
Heal, K., Navarro, K., Wollner, M., Yan, E., Douglas, P., Gilles, J., Kerr, W., and Meyer, T.UCLA Math REU 2013: Epilepsy and EEG/fMRI 37 / 42
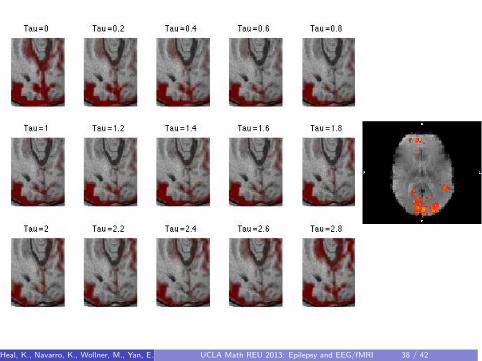
Heal, K., Navarro, K., Wollner, M., Yan, E., Douglas, P., Gilles, J., Kerr, W., and Meyer, T.UCLA Math REU 2013: Epilepsy and EEG/fMRI 38 / 42
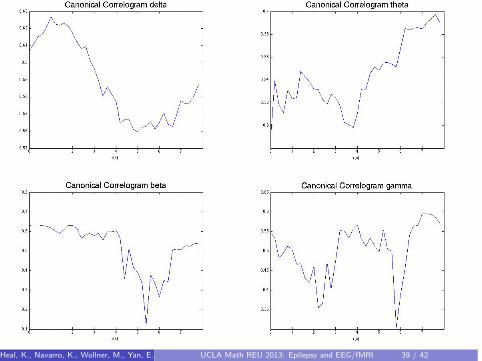
Heal, K., Navarro, K., Wollner, M., Yan, E., Douglas, P., Gilles, J., Kerr, W., and Meyer, T.UCLA Math REU 2013: Epilepsy and EEG/fMRI 39 / 42
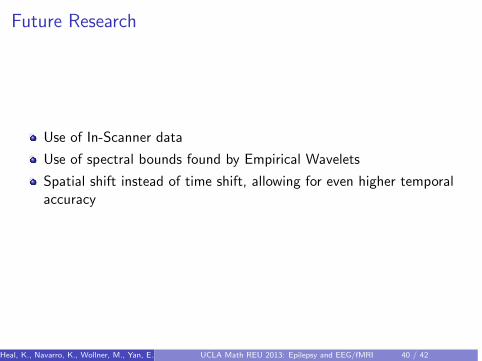
Future Research
Use of In-Scanner data
Use of spectral bounds found by Empirical Wavelets
Spatial shift instead of time shift, allowing for even higher temporalaccuracy
Heal, K., Navarro, K., Wollner, M., Yan, E., Douglas, P., Gilles, J., Kerr, W., and Meyer, T.UCLA Math REU 2013: Epilepsy and EEG/fMRI 40 / 42
References I
Felix Bießmann, Frank C. Meinecke, Arthur Gretton, AlexanderRauch, Gregor Rainer, Nikos K. Logothetis, and Klaus-Robert Muller,Temporal kernel cca and its application in multimodal neuronal dataanalysis, Machine Learning 79 (2010), no. 1-2, 5–27 (English).
Jerome Gilles, Empirical Wavelet Transform, IEEE Transactions onSignal Processing 2013 (2013), 3999–4010.
Aapo Hyvarinen and Erkki Oja, Independent component analysis:algorithms and applications, Neural Networks 13 (2000), 411–430.
Wesley T. Kerr, Stefan T. Nguyen, Andrew Y. Cho, Edward P Lau,Daniel H. Silverman, Pamela K. Douglas, Navya M. Reddy, ArianaAnderson, Jennifer Bramen, and Noriko Salamon, Computer-aideddiagnosis and localization of lateralized temporal lobe epilepsy usinginterictal FDG-PET, Frontiers in Neurology (2013).
Heal, K., Navarro, K., Wollner, M., Yan, E., Douglas, P., Gilles, J., Kerr, W., and Meyer, T.UCLA Math REU 2013: Epilepsy and EEG/fMRI 41 / 42
References II
RD Pascual-Marqui, Standardized low-resolution brain electromagnetictomography (sLORETA): Technical details, Methods and Findings inExperimental and Clinical Pharmacology 24 (2002), no. D, 5–12, 12thMeeting of the International-Pharmaco-EEG-Group, Barcelona, Spain,NOV 21-24, 2002.
Pavel Pudil, Jana Novovicova, and Josef Kittler, Floating searchmethods in feature selection, Pattern recognition letters 15 (1994),no. 11, 1119–1125.
Jonathon Shlens, A tutorial on principal component analysis, SystemsNeurobiology Laboratory, Salk Institute for Biological Studies, 2005.
F Tadel, S Baillet, JC Mosher, D Pantazis, and RM Leahy,Brainstorm: A user-friendly application for meg/eeg analysis,Computational Intelligence and Neuroscience 2011 (2011).
Heal, K., Navarro, K., Wollner, M., Yan, E., Douglas, P., Gilles, J., Kerr, W., and Meyer, T.UCLA Math REU 2013: Epilepsy and EEG/fMRI 42 / 42
References III
Ulrike von Luxburg, A tutorial on spectral clustering, CoRRabs/0711.0189 (2007).
Heal, K., Navarro, K., Wollner, M., Yan, E., Douglas, P., Gilles, J., Kerr, W., and Meyer, T.UCLA Math REU 2013: Epilepsy and EEG/fMRI 43 / 42
Thank you
Any questions?
Heal, K., Navarro, K., Wollner, M., Yan, E., Douglas, P., Gilles, J., Kerr, W., and Meyer, T.UCLA Math REU 2013: Epilepsy and EEG/fMRI 44 / 42