
UCL CHEM2601 Imaging L5-6 (Radiotracers)
53
Chem 2601/2012 Molecular Imaging Lecture 5 and 6: Radiotracers and applications for diagnostic imaging Dr. Erik Årstad, KLB room 2.11 ([email protected] )
Transcript of UCL CHEM2601 Imaging L5-6 (Radiotracers)

Chem 2601/2012
Molecular Imaging
Lecture 5 and 6: Radiotracers and applications for diagnostic imaging
Dr. Erik Årstad, KLB room 2.11 ([email protected])
Overview (lecture 5 and 6):
1) Radiotracers – key principles
2) Properties of radiotracers
3) Interactions of tracers with biological targets
4) Nuclear imaging of cancer
5) Nuclear imaging of brain diseases
6) Nuclear imaging in research and drug discovery
2
Radiotracers – key principles:
1) Principles of imaging with radiotracers 2) Properties of radiotracers 3) Interactions of radiotracers with biological targets
3

4
After two years on non-successful work: “. . . .I failed completely. In order to make the best of this depressing situation, I decided to use Radium-D as an indicator of lead. . . “ Later it was found that Radium-D is 210Pb. A radiotracer (also known as a tracer or radiopharmaceutical) is a chemical compound that allows investigation of a biochemical process without influencing the process.
George De Hevesy (1911): “My boy, if you are worth your salt, you try to separate Radium-D from all that lead.”
5
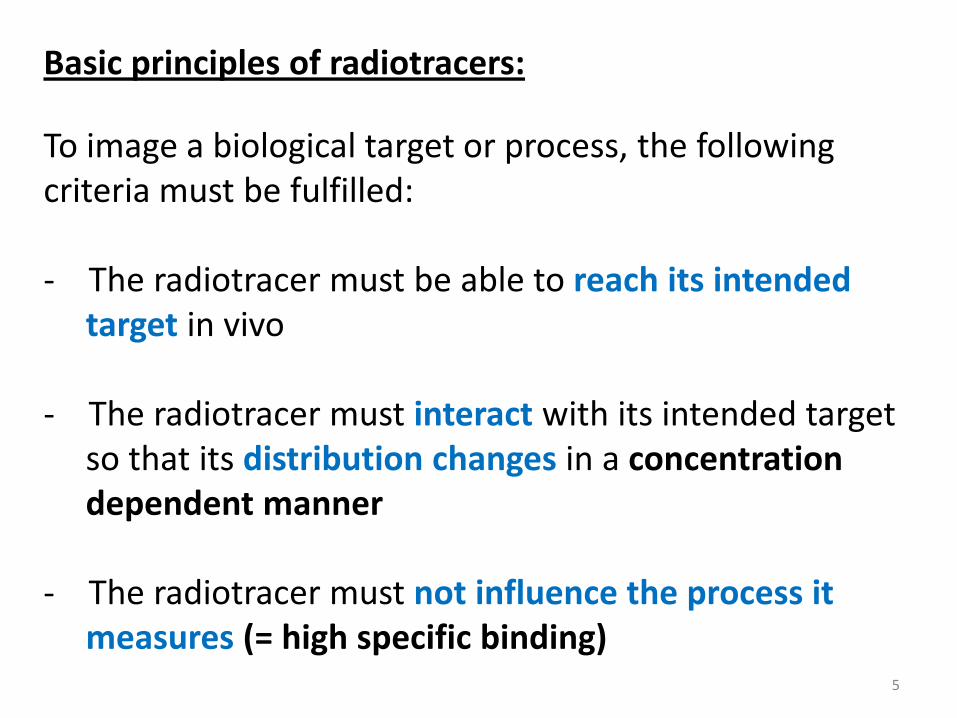
Basic principles of radiotracers: To image a biological target or process, the following criteria must be fulfilled: - The radiotracer must be able to reach its intended target in vivo - The radiotracer must interact with its intended target so that its distribution changes in a concentration dependent manner - The radiotracer must not influence the process it measures (= high specific binding)
Properties of radiotracers:
1) Affinity and binding potential
2) Lipophilicity
3) Pharmacokinetics and time-activity curves
6
7
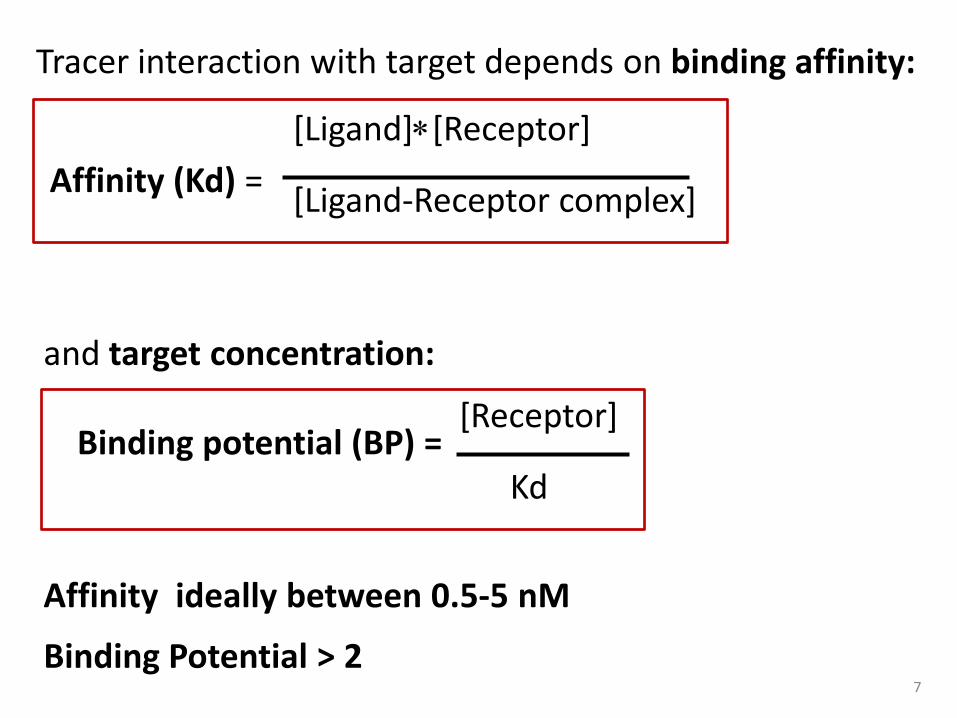
Tracer interaction with target depends on binding affinity:
Affinity (Kd) = [Ligand]∗[Receptor] [Ligand-Receptor complex]
and target concentration: Binding potential (BP) =
[Receptor] Kd
Affinity ideally between 0.5-5 nM
Binding Potential > 2
8
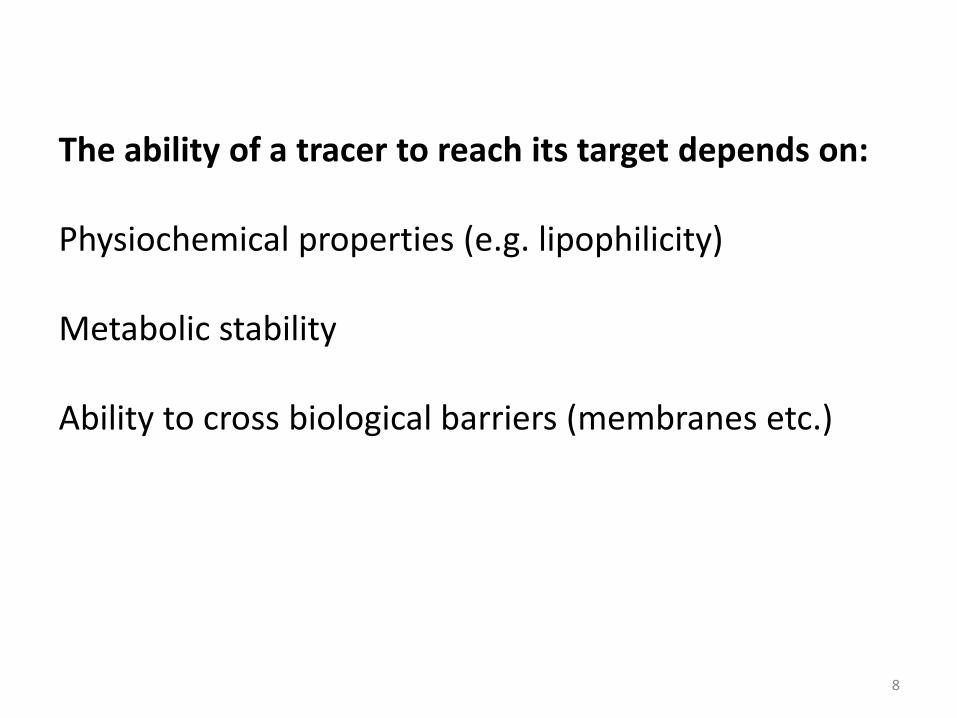
The ability of a tracer to reach its target depends on: Physiochemical properties (e.g. lipophilicity) Metabolic stability Ability to cross biological barriers (membranes etc.)
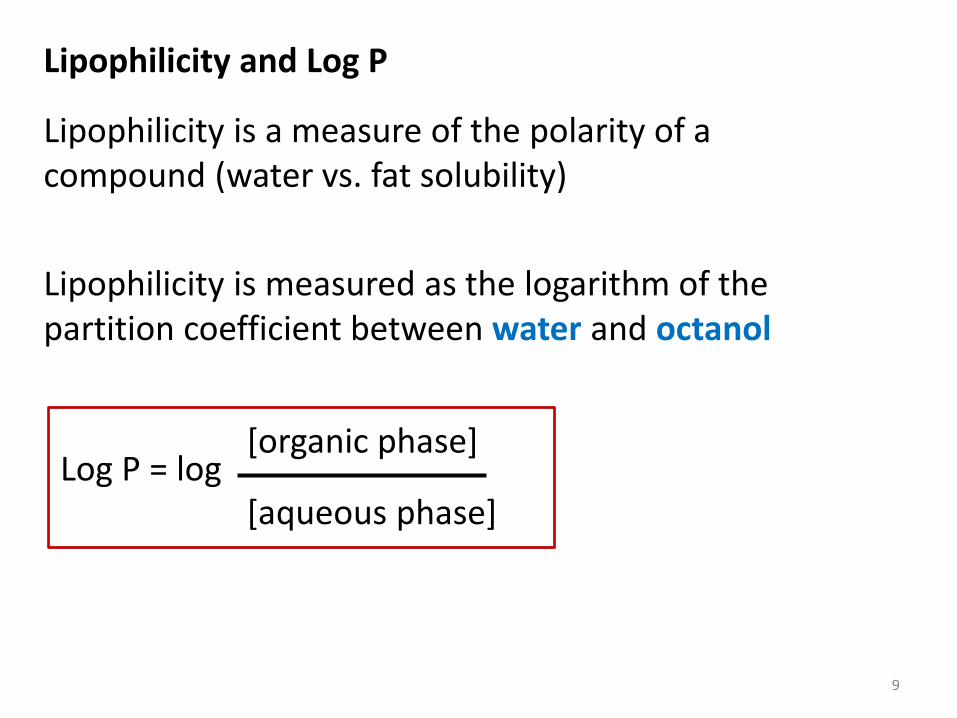
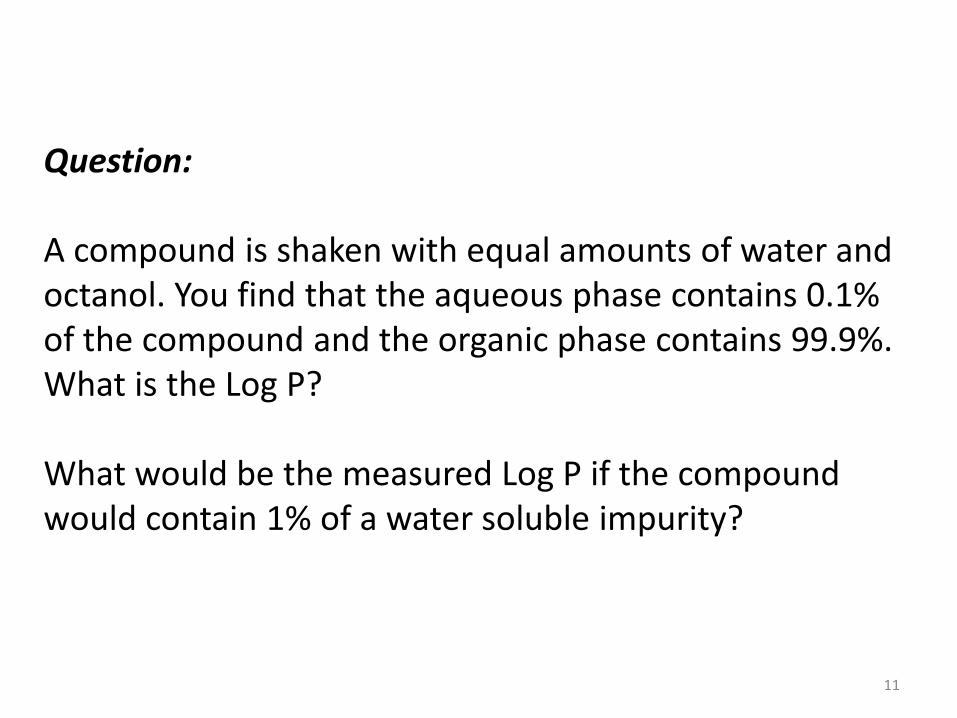
Lipophilicity and Log P
Lipophilicity is a measure of the polarity of a compound (water vs. fat solubility)
Lipophilicity is measured as the logarithm of the partition coefficient between water and octanol
Log P = log
9
[organic phase] [aqueous phase]
10
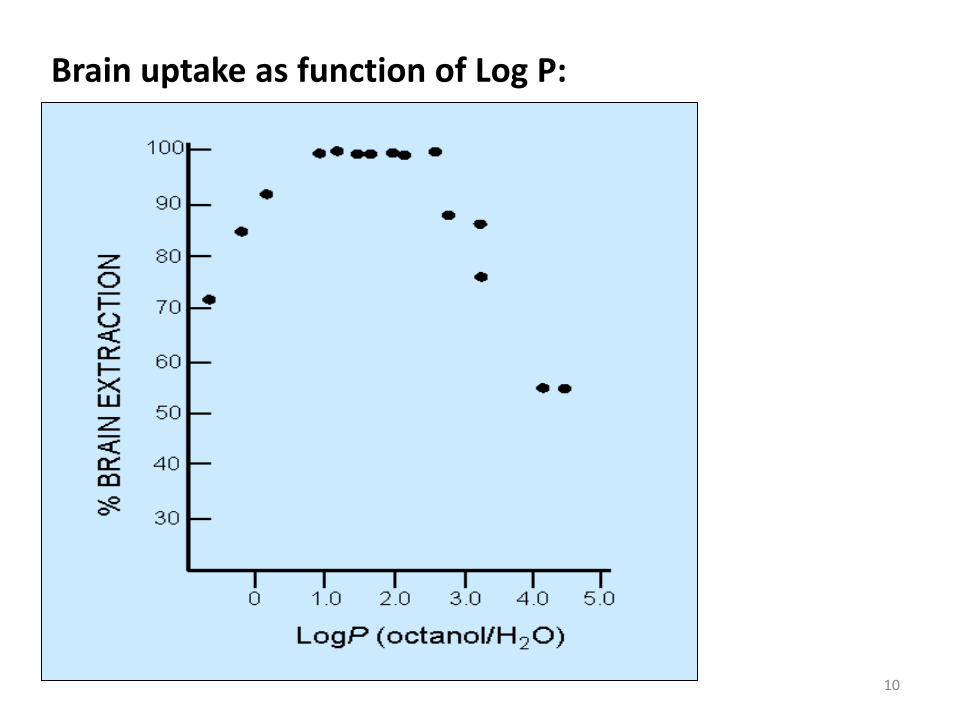
Brain uptake as function of Log P:
11
Question: A compound is shaken with equal amounts of water and octanol. You find that the aqueous phase contains 0.1% of the compound and the organic phase contains 99.9%. What is the Log P? What would be the measured Log P if the compound would contain 1% of a water soluble impurity?
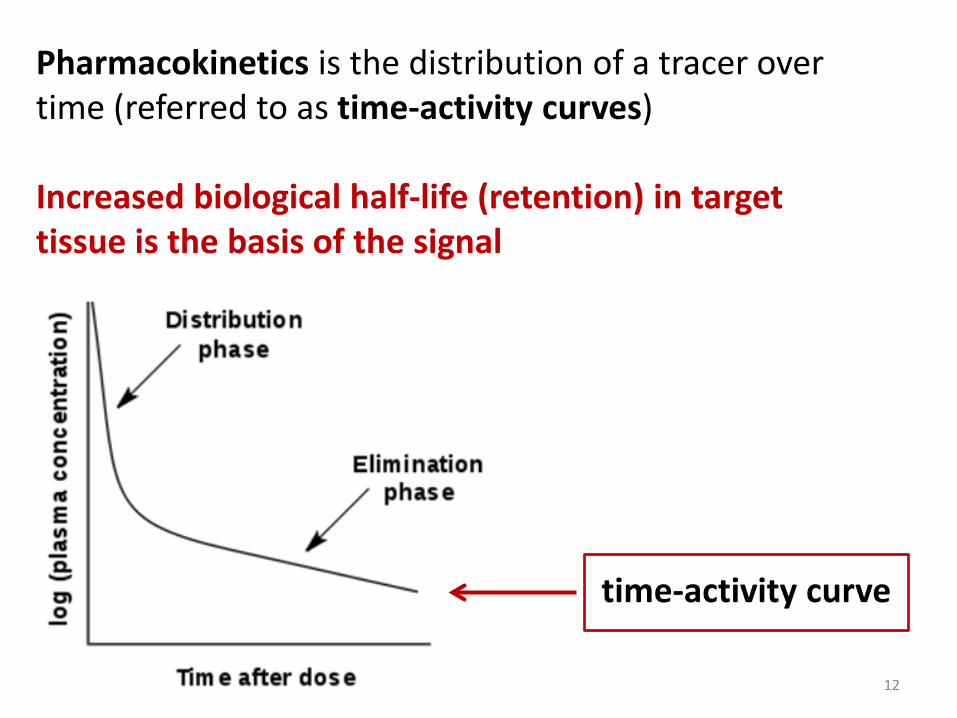
Pharmacokinetics is the distribution of a tracer over time (referred to as time-activity curves) Increased biological half-life (retention) in target tissue is the basis of the signal
12
time-activity curve
13
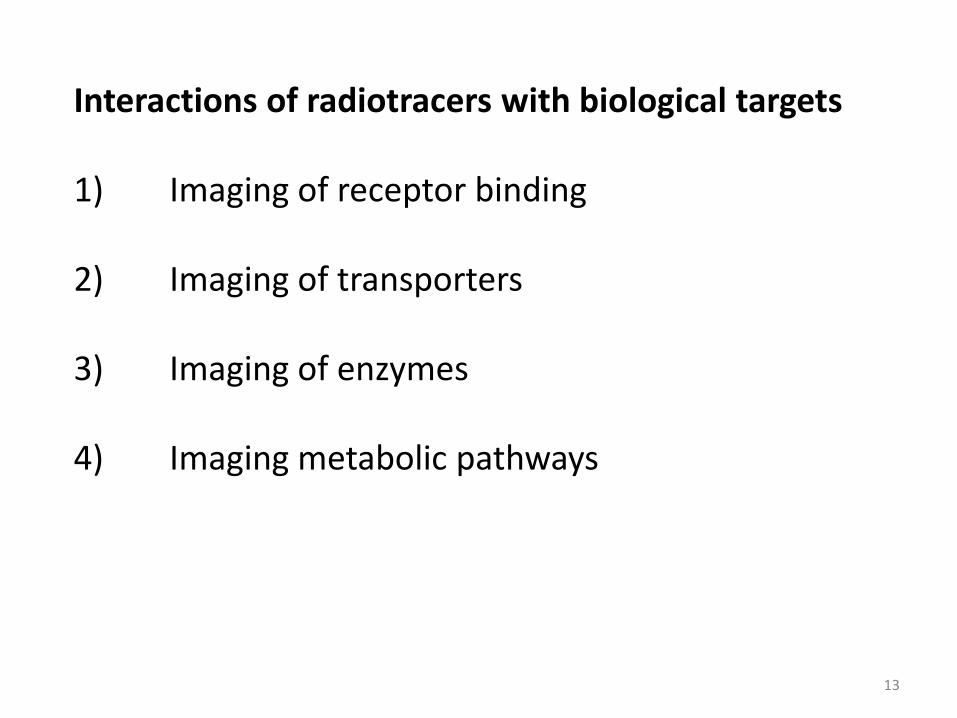
Interactions of radiotracers with biological targets 1) Imaging of receptor binding 2) Imaging of transporters 3) Imaging of enzymes 4) Imaging metabolic pathways
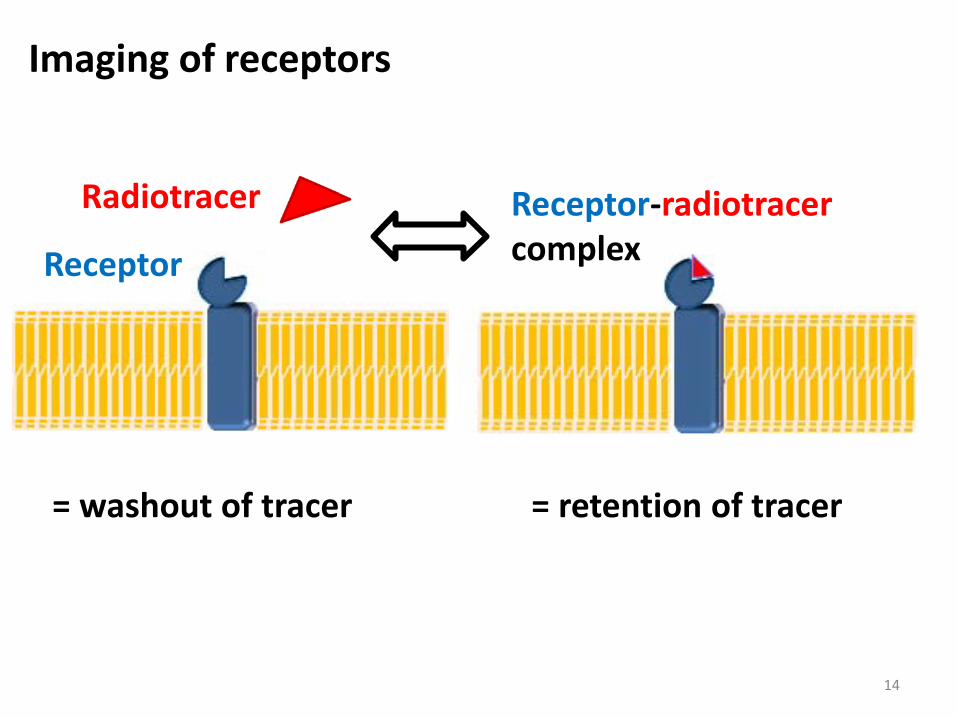
Imaging of receptors
Receptor-radiotracer complex Receptor
Radiotracer
14
= retention of tracer = washout of tracer
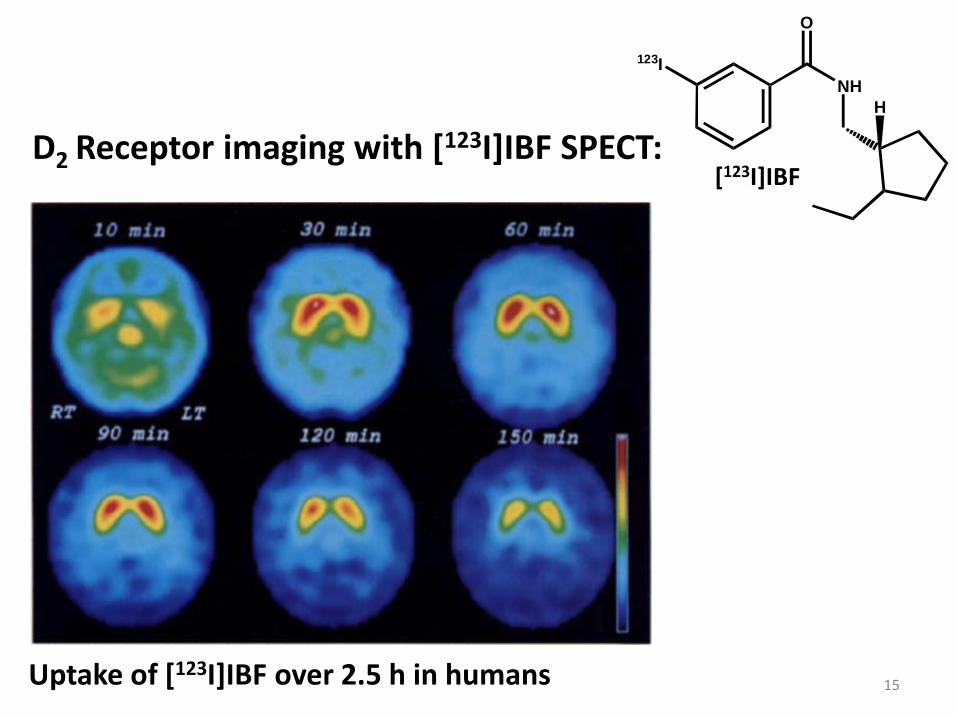
D2 Receptor imaging with [123I]IBF SPECT:
123I
O
NHH
[123I]IBF
Uptake of [123I]IBF over 2.5 h in humans 15
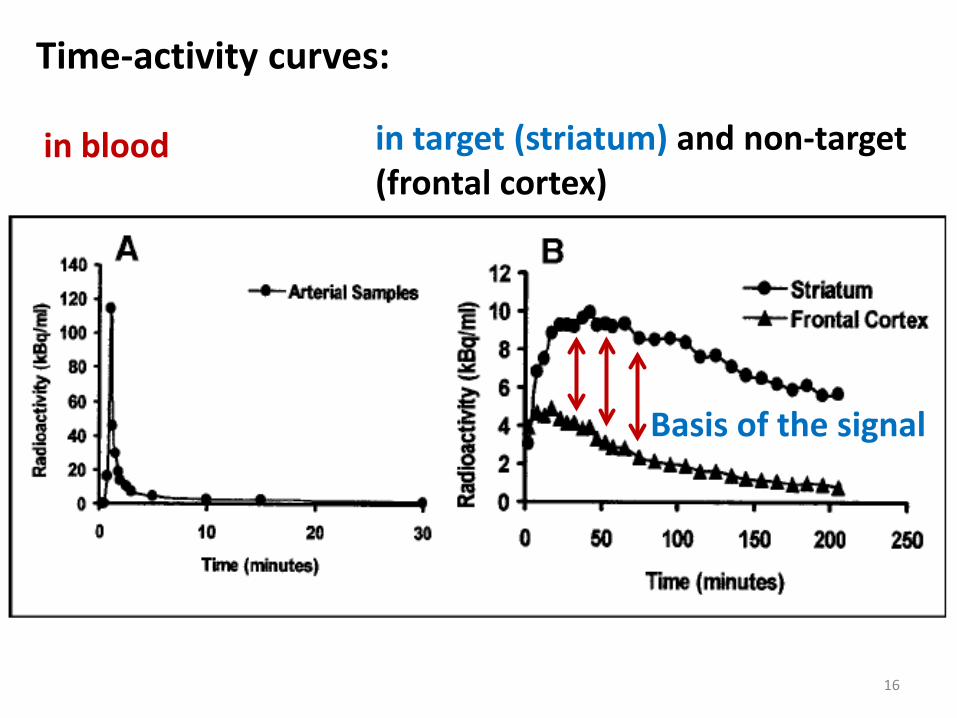
in blood
Time-activity curves:
Basis of the signal
16
in target (striatum) and non-target (frontal cortex)
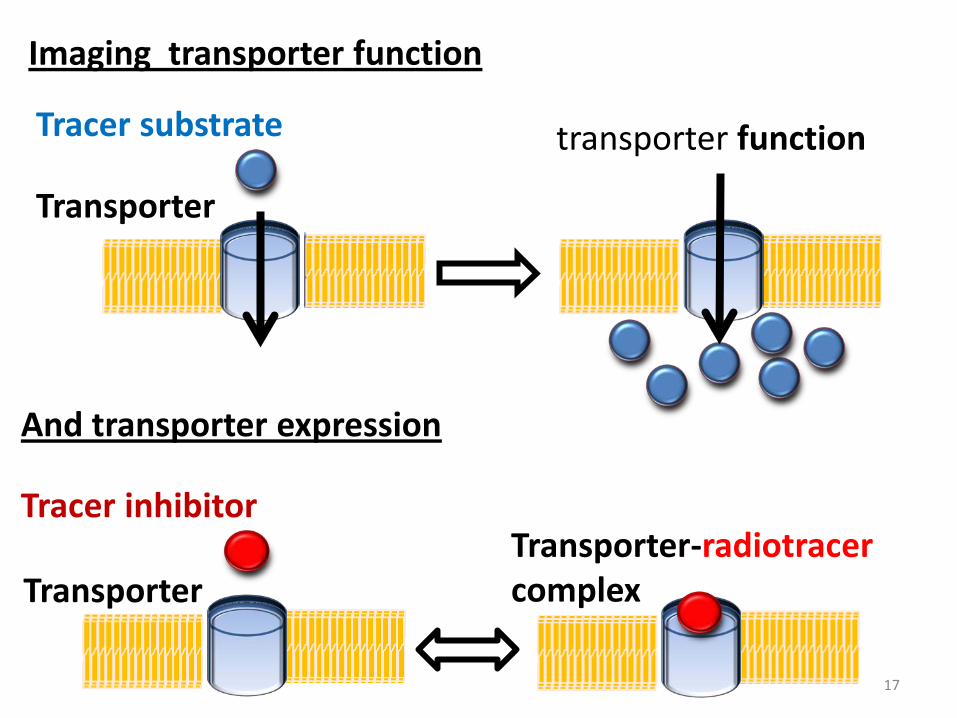
Imaging transporter function
17
Transporter
Tracer substrate transporter function
Transporter
Tracer inhibitor Transporter-radiotracer complex
And transporter expression
18
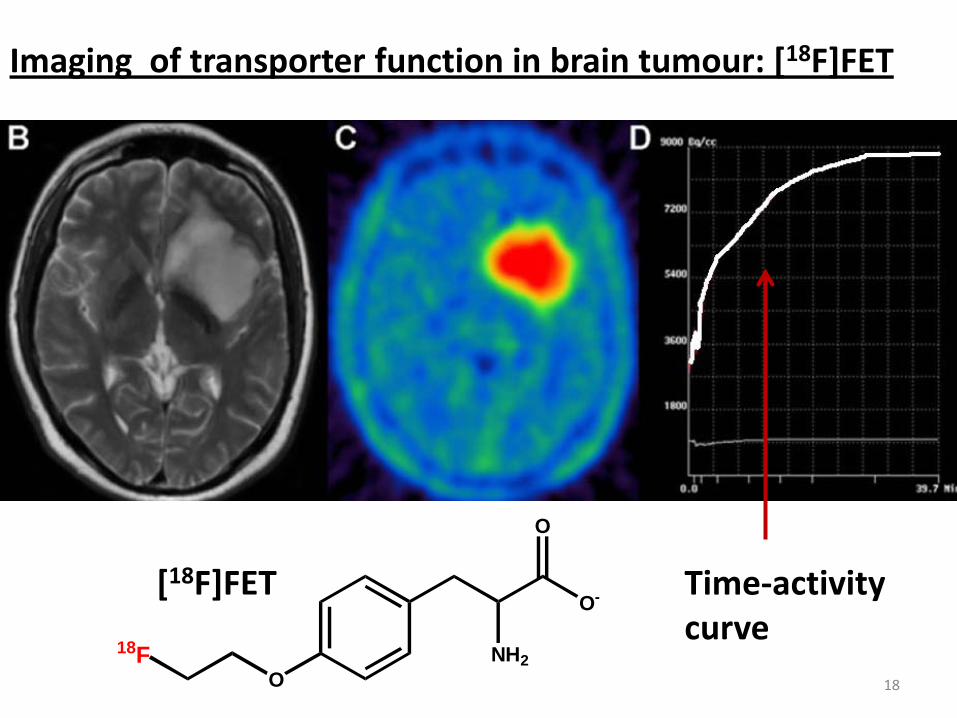
Imaging of transporter function in brain tumour: [18F]FET
ONH2
O-
O
18F
[18F]FET Time-activity curve
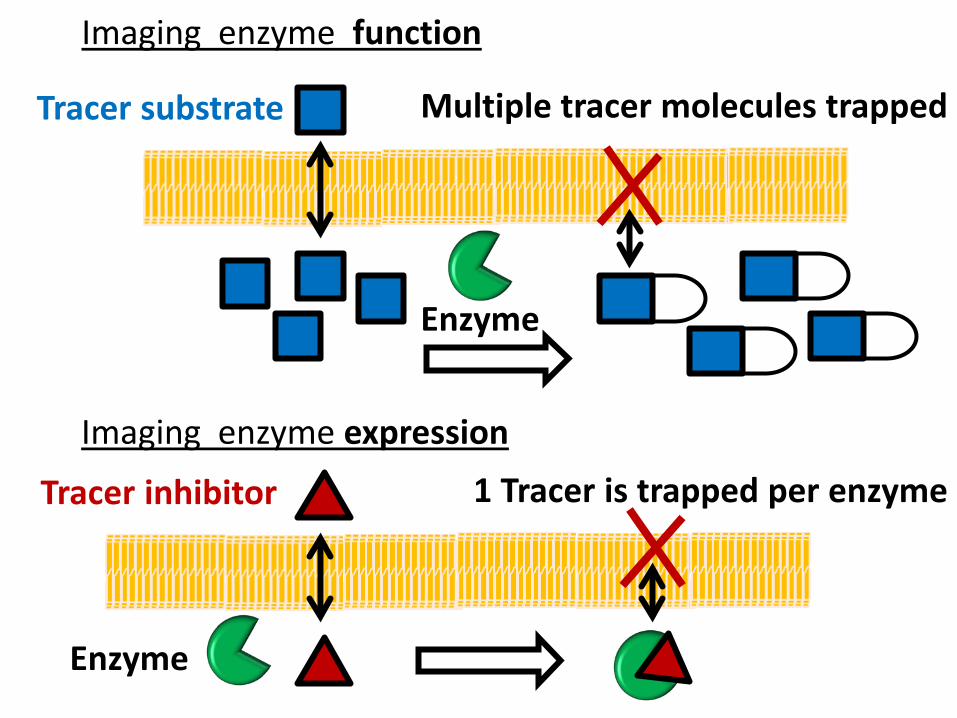
Imaging enzyme function
Enzyme
Tracer substrate Multiple tracer molecules trapped
Imaging enzyme expression
Enzyme
Tracer inhibitor 1 Tracer is trapped per enzyme
20
Enzyme
Tracer substrate Multiple tracer molecules trapped
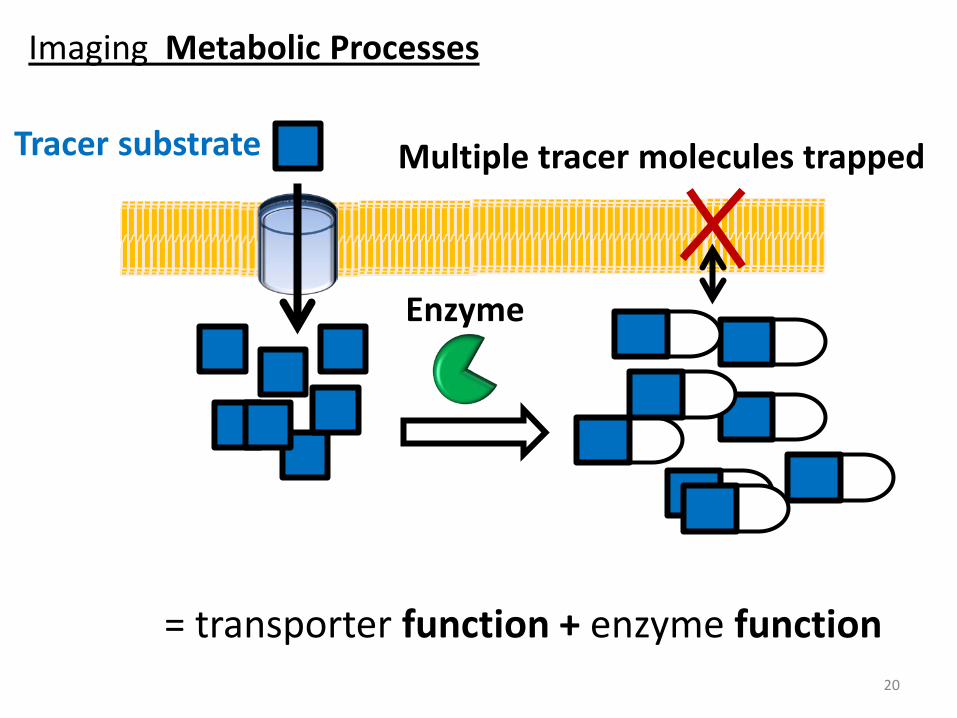
Imaging Metabolic Processes
= transporter function + enzyme function
21
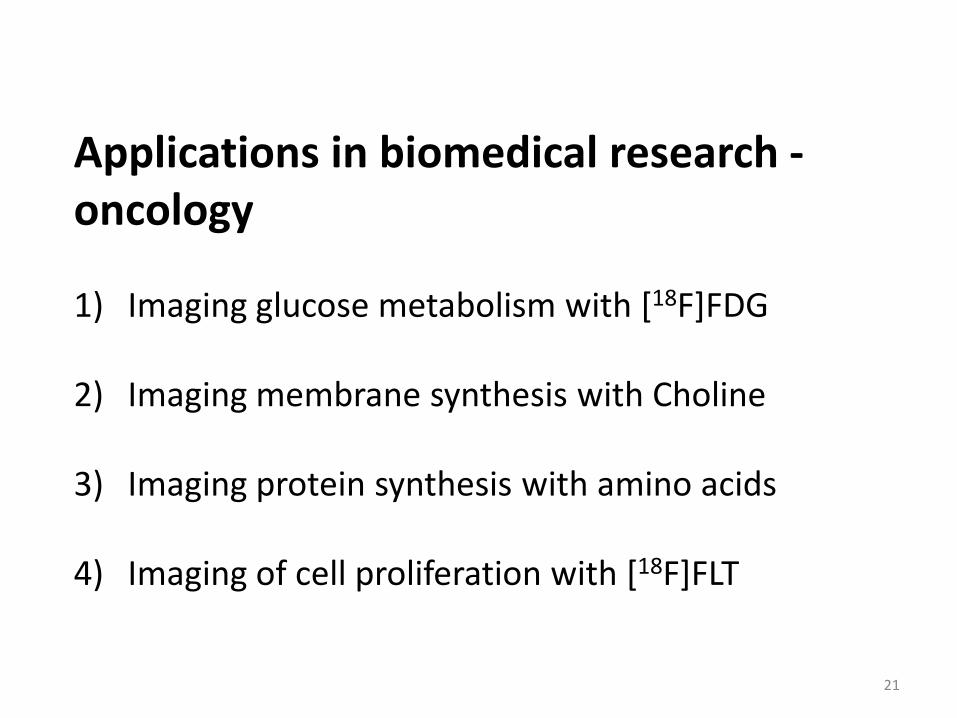
Applications in biomedical research - oncology 1) Imaging glucose metabolism with [18F]FDG
2) Imaging membrane synthesis with Choline 3) Imaging protein synthesis with amino acids
4) Imaging of cell proliferation with [18F]FLT
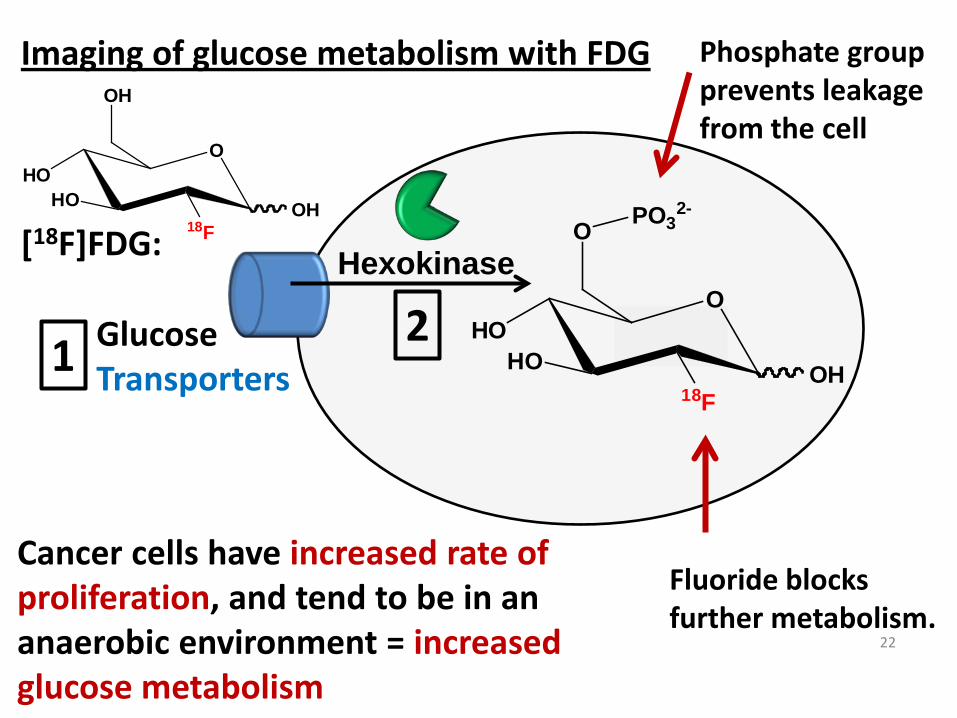
Imaging of glucose metabolism with FDG
Glucose Transporters
Fluoride blocks further metabolism.
Hexokinase
Cancer cells have increased rate of proliferation, and tend to be in an anaerobic environment = increased glucose metabolism
Phosphate group prevents leakage from the cell
[18F]FDG:
OHO
HO
OH
18FOH
22
OHO
HO18F
O
OH
PO32-
1 2
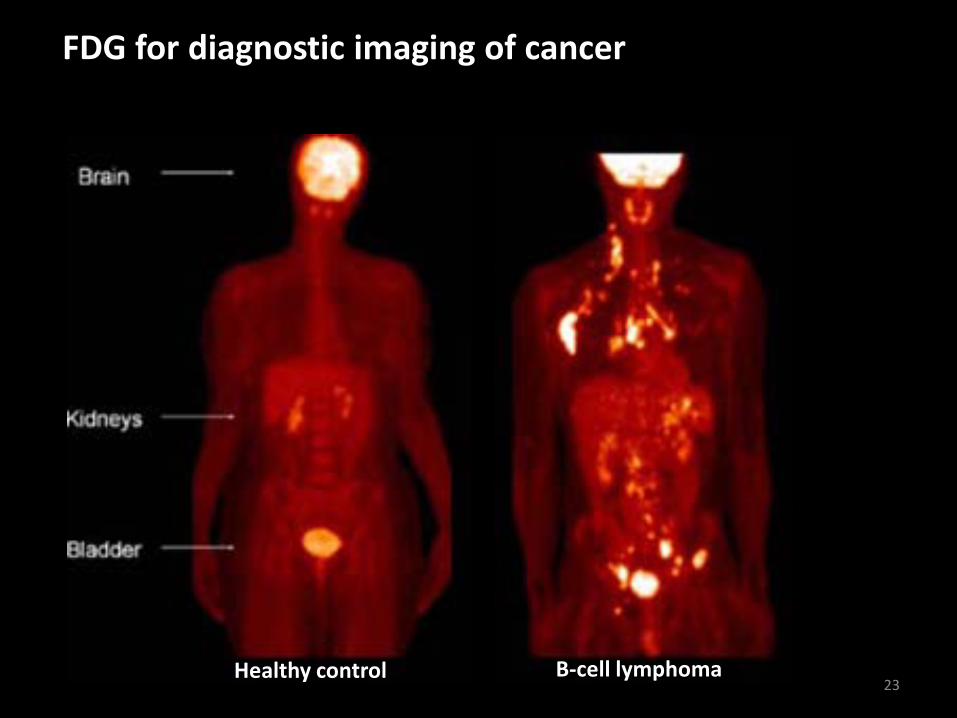
FDG for diagnostic imaging of cancer
Healthy control B-cell lymphoma 23
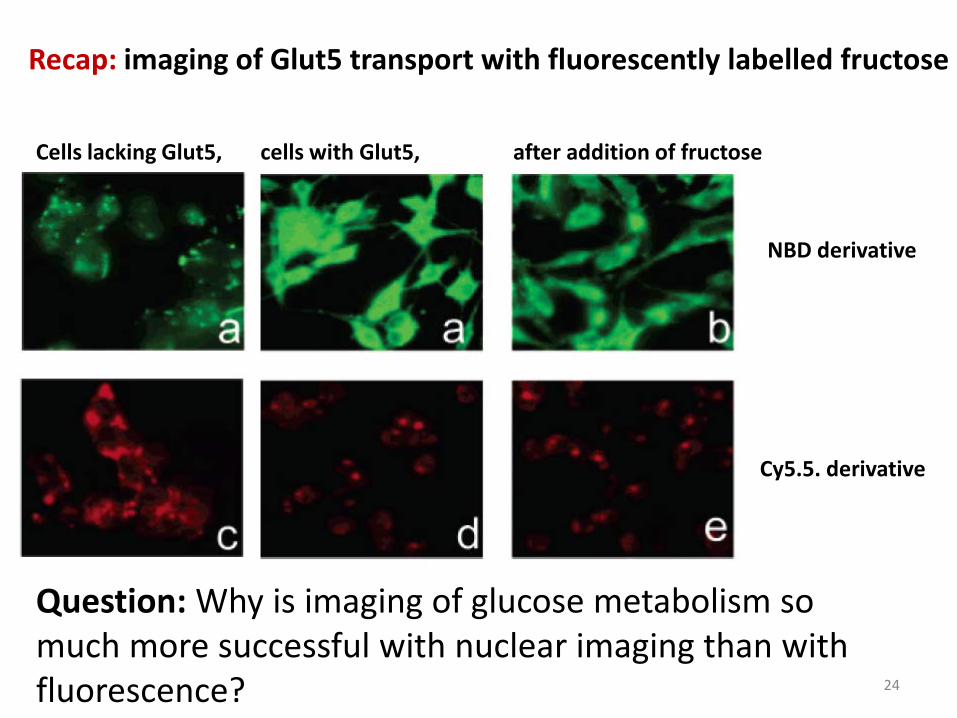
Recap: imaging of Glut5 transport with fluorescently labelled fructose
Cells lacking Glut5, cells with Glut5, after addition of fructose
NBD derivative
Cy5.5. derivative
Question: Why is imaging of glucose metabolism so much more successful with nuclear imaging than with fluorescence? 24
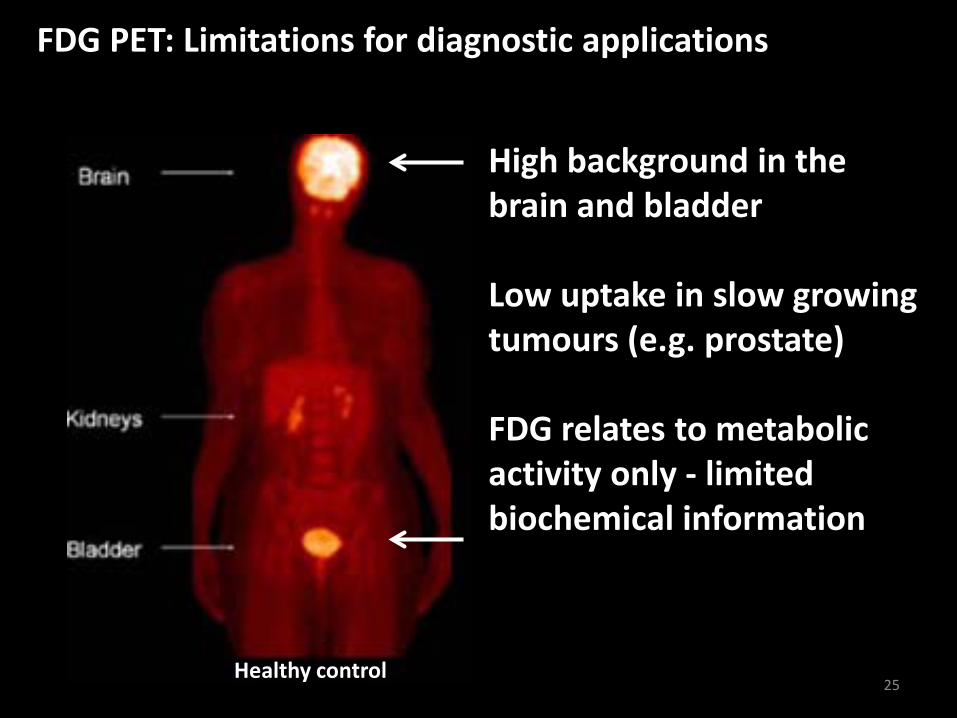
FDG PET: Limitations for diagnostic applications
Healthy control
High background in the brain and bladder Low uptake in slow growing tumours (e.g. prostate) FDG relates to metabolic activity only - limited biochemical information
25
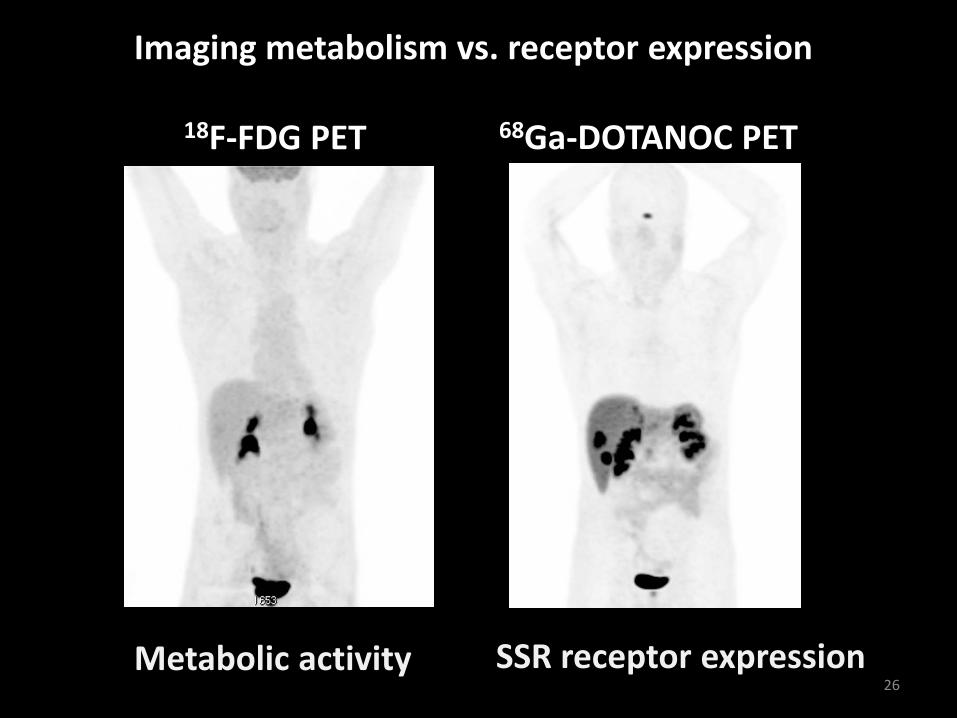
68Ga-DOTANOC PET 18F-FDG PET
Imaging metabolism vs. receptor expression
Metabolic activity SSR receptor expression 26
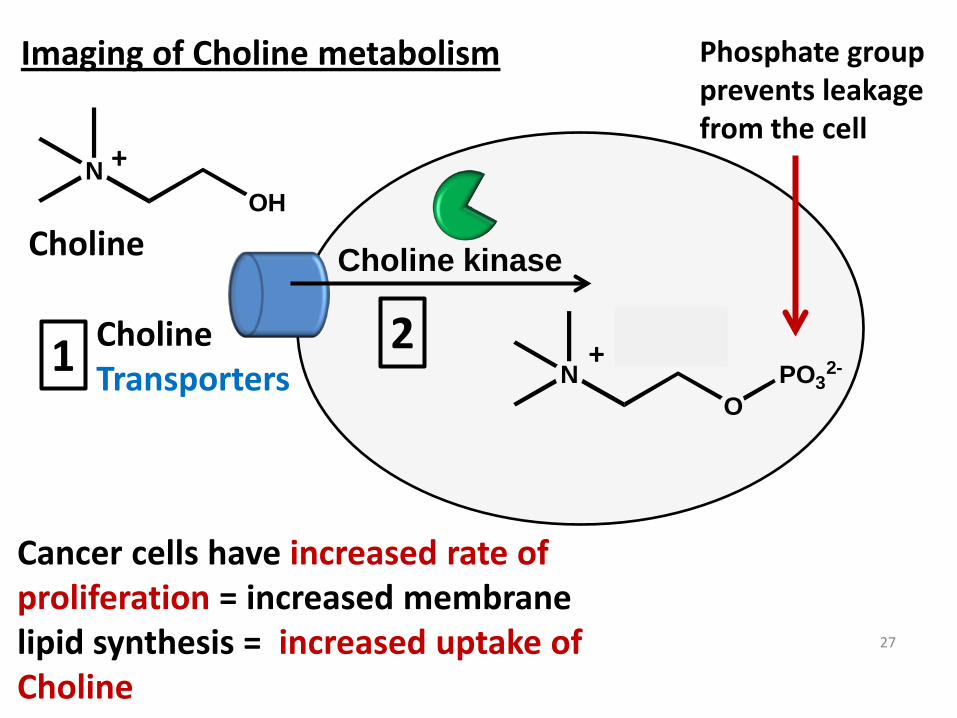
Imaging of Choline metabolism
Choline Transporters
Cancer cells have increased rate of proliferation = increased membrane lipid synthesis = increased uptake of Choline
Phosphate group prevents leakage from the cell
Choline
27
1 2
NOH
Choline kinase
NO
PO32-
+
+
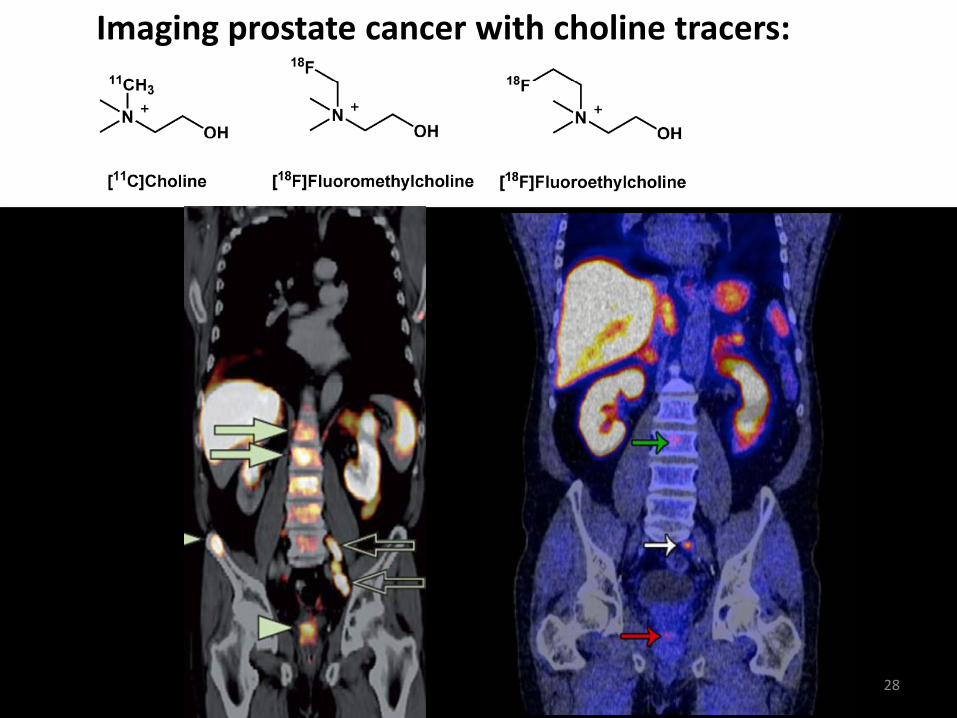
Imaging prostate cancer with choline tracers:
28
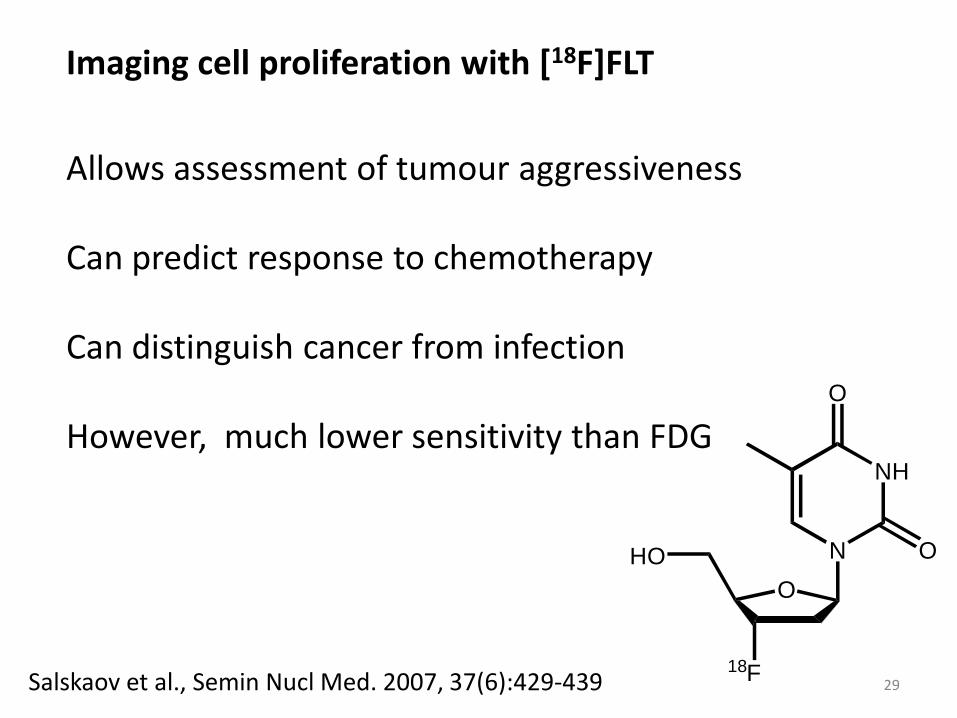
Imaging cell proliferation with [18F]FLT
Allows assessment of tumour aggressiveness Can predict response to chemotherapy
Can distinguish cancer from infection However, much lower sensitivity than FDG
Salskaov et al., Semin Nucl Med. 2007, 37(6):429-439
N
NH
O
OO
HO
18F 29
30
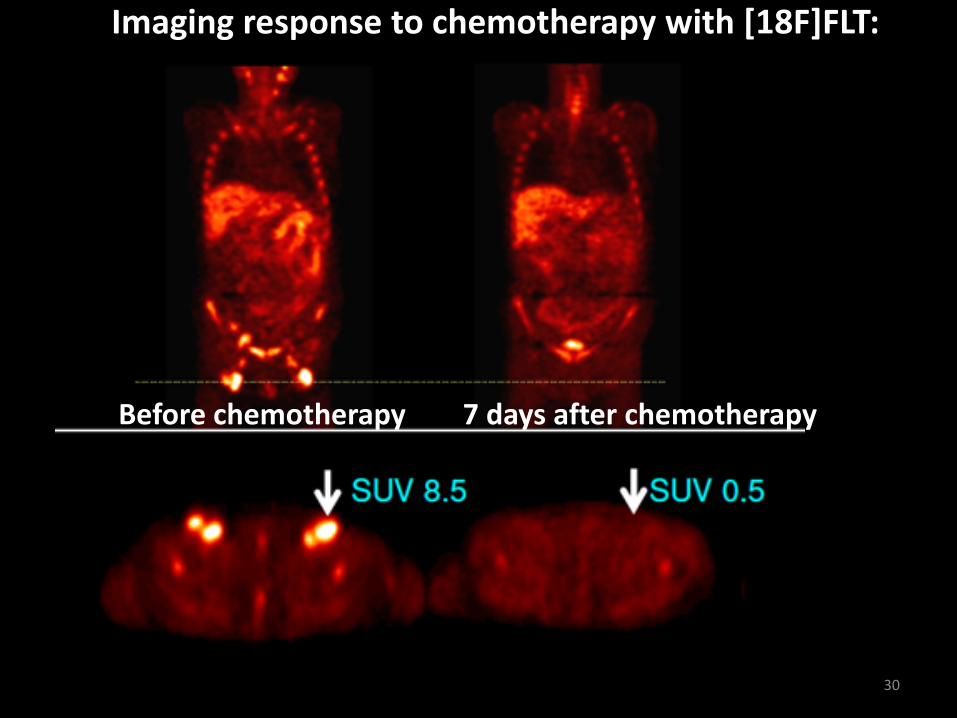
Imaging response to chemotherapy with [18F]FLT: Before chemotherapy 7 days after chemotherapy
31
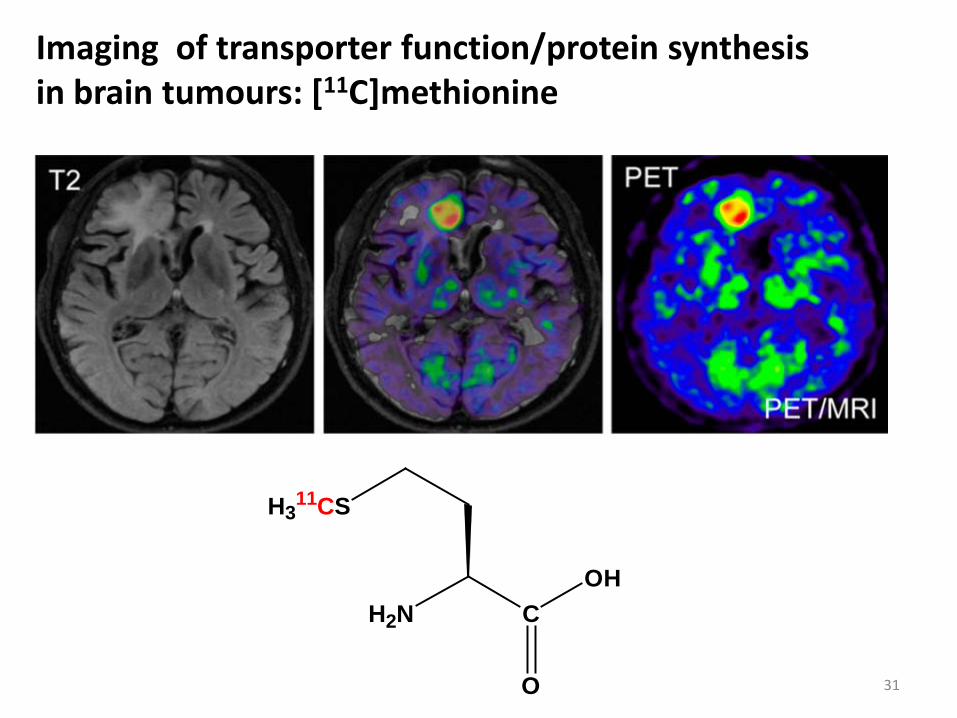
Imaging of transporter function/protein synthesis in brain tumours: [11C]methionine
H2N C
H311CS
O
OH
Nuclear imaging of brain diseases
32
33
Nuclear imaging of brain diseases 1) Imaging of Amyloid plaque in Alzheimer’s disease 2) Imaging of movement disorders (Parkinson disease)
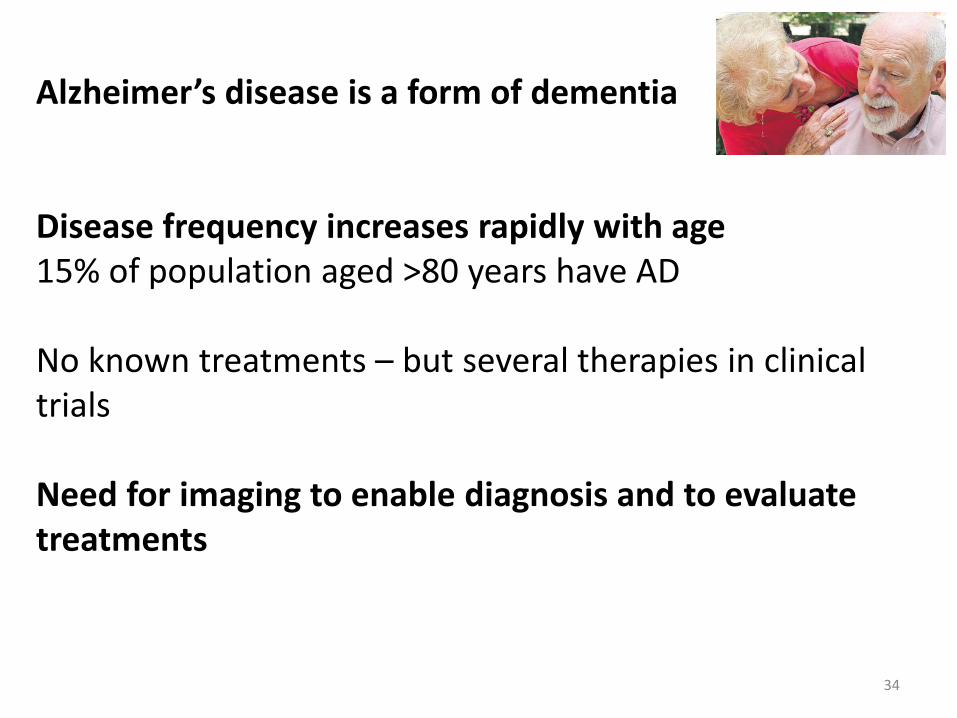
Alzheimer’s disease is a form of dementia Disease frequency increases rapidly with age 15% of population aged >80 years have AD No known treatments – but several therapies in clinical trials Need for imaging to enable diagnosis and to evaluate treatments
34

Alzheimer’s disease is associated with Amyloid plaques:
N
SHO
NH
11CH3
[11C] PIB
Amyloid plaque
35
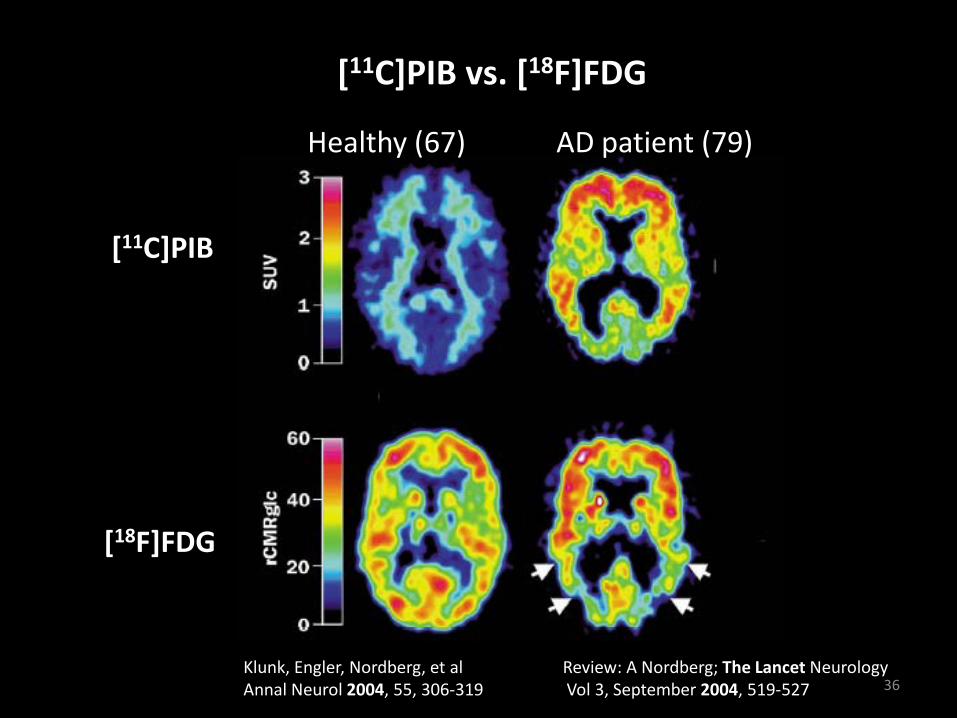
[11C]PIB vs. [18F]FDG
[18F]FDG
[11C]PIB
Healthy (67)
AD patient (79)
Klunk, Engler, Nordberg, et al Review: A Nordberg; The Lancet Neurology Annal Neurol 2004, 55, 306-319 Vol 3, September 2004, 519-527 36
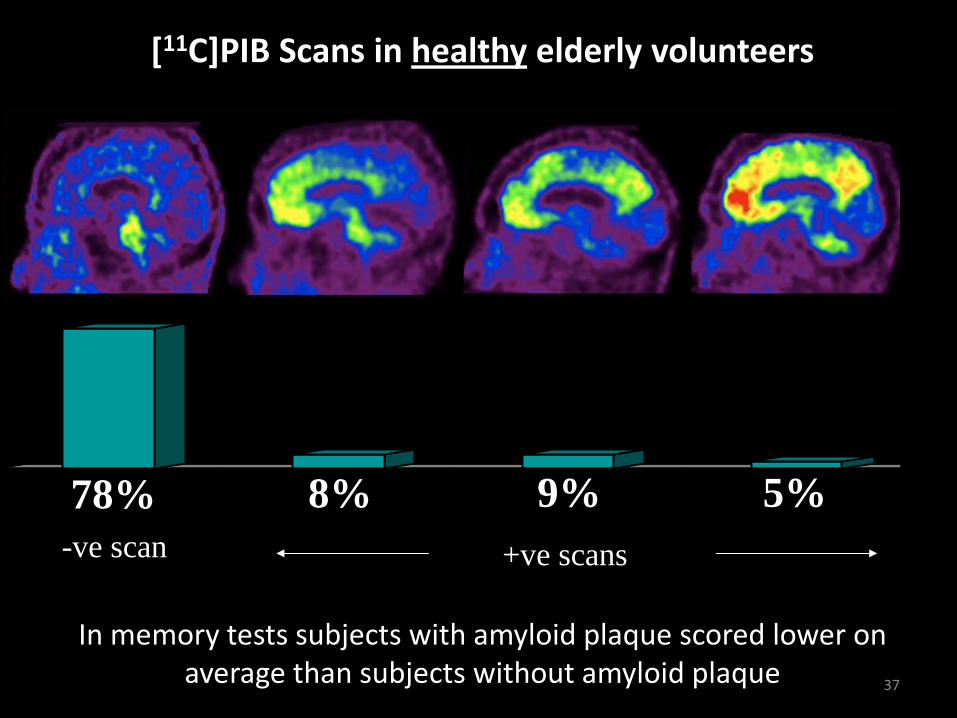
78% 8% 9% 5%
PIB PET scans in healthy elderly volunteers (n=32)
Healthy controls with +ve scans had memory Z-scores0.5 lower than controls with –ve scans
-ve scan +ve scans
[11C]PIB Scans in healthy elderly volunteers
In memory tests subjects with amyloid plaque scored lower on average than subjects without amyloid plaque 37
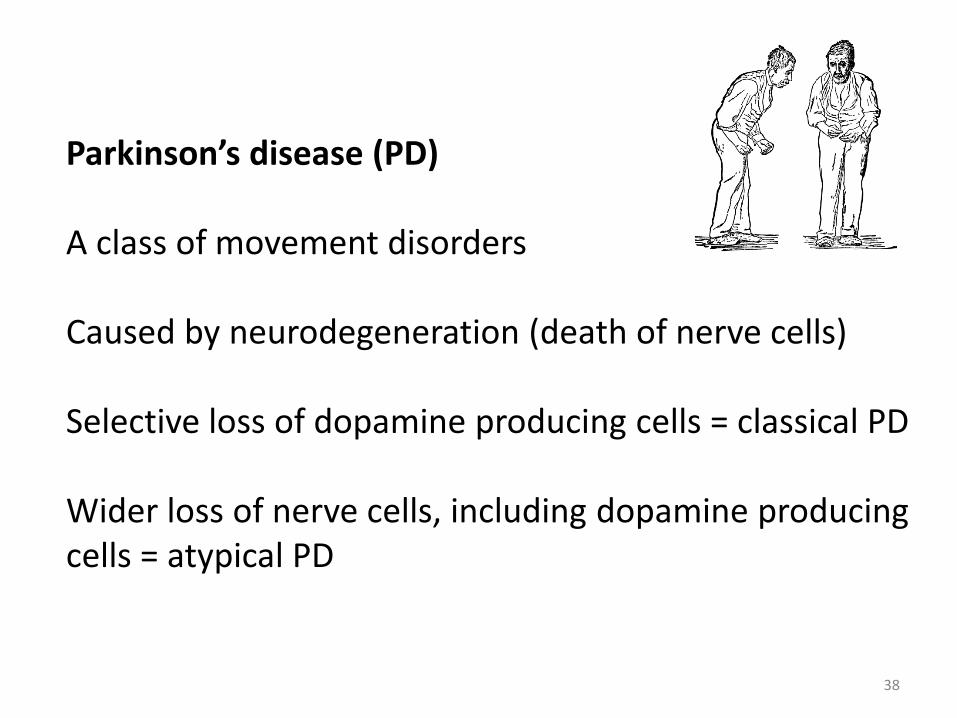
Parkinson’s disease (PD) A class of movement disorders Caused by neurodegeneration (death of nerve cells) Selective loss of dopamine producing cells = classical PD Wider loss of nerve cells, including dopamine producing cells = atypical PD
38
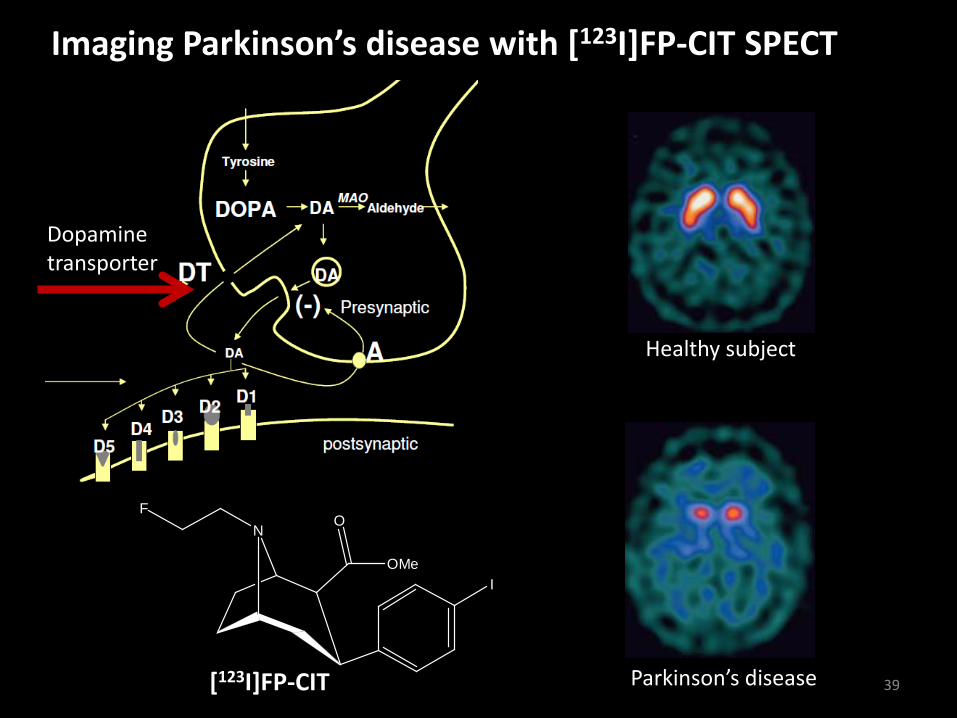
Imaging Parkinson’s disease with [123I]FP-CIT SPECT
Healthy subject
Parkinson’s disease
Dopamine transporter
NF
I
O
OMe
[123I]FP-CIT 39
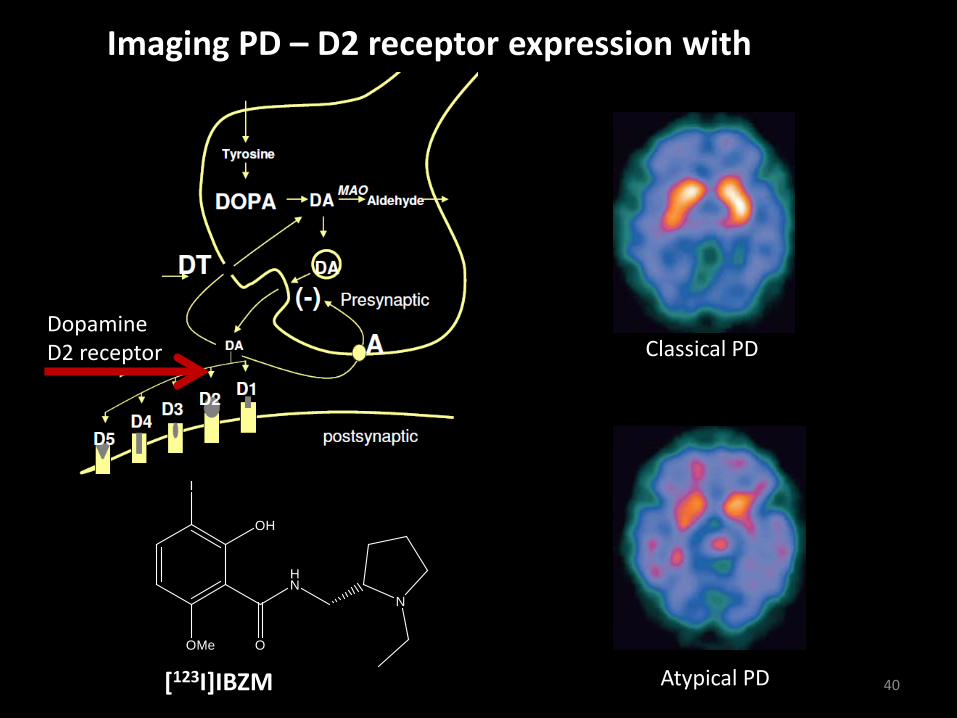
Imaging PD – D2 receptor expression with
[123I]IBZM
Classical PD
Atypical PD
Dopamine D2 receptor
I
OH
OMe O
HN
N
[123I]IBZM 40
Nuclear imaging in research and drug discovery 1) Use of PET to study receptor occupancy 2) Use of PET to study drug behaviour
41
42
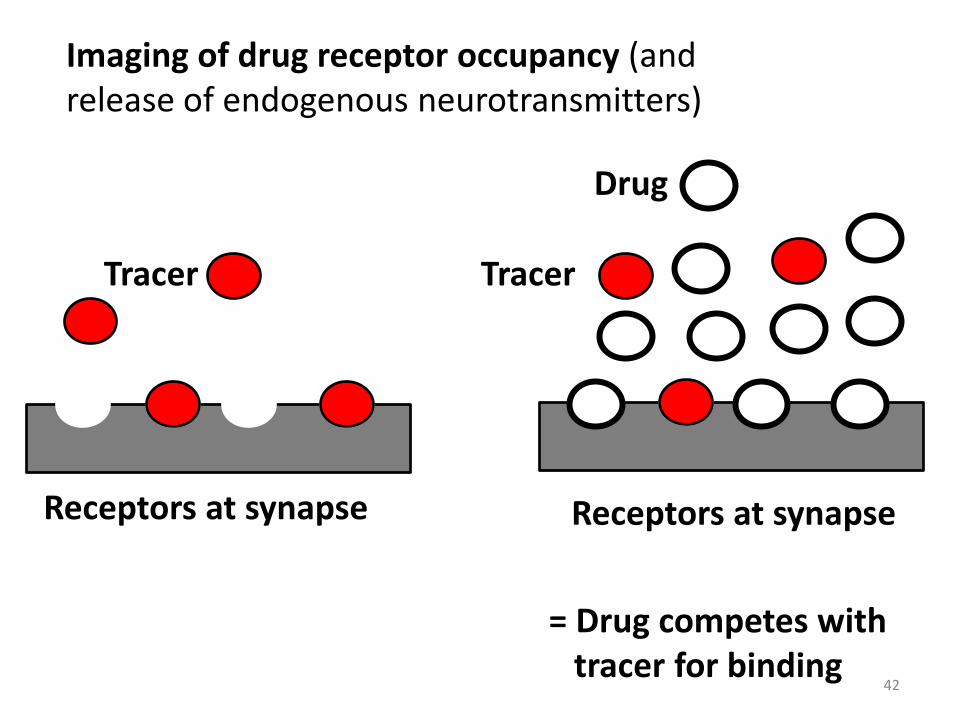
Imaging of drug receptor occupancy (and release of endogenous neurotransmitters)
Receptors at synapse
Tracer
Receptors at synapse
Tracer
Drug
= Drug competes with tracer for binding
43
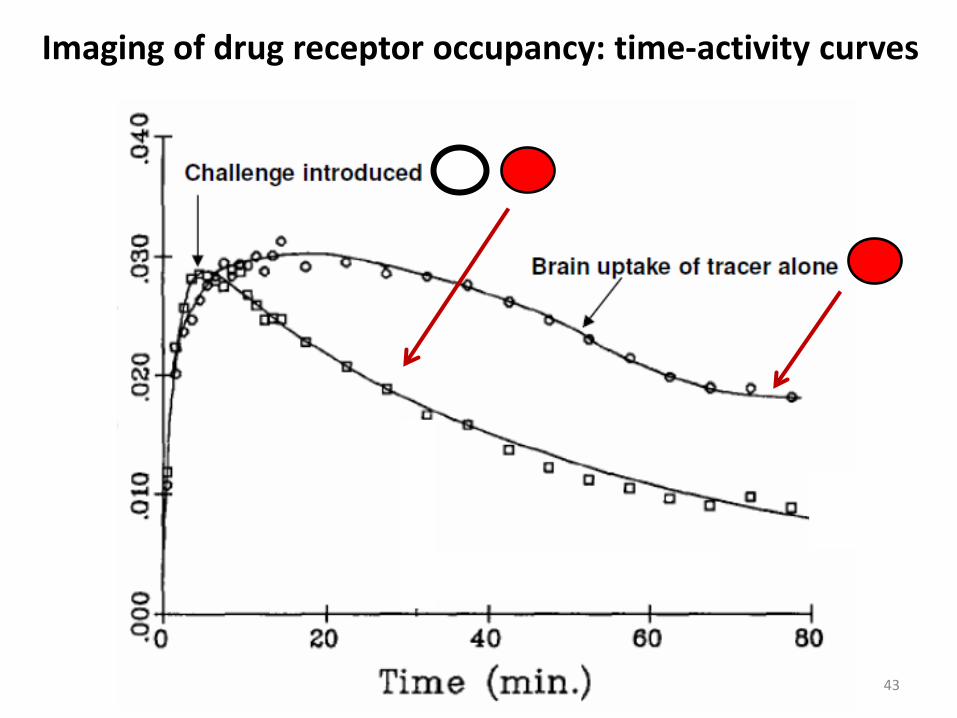
Imaging of drug receptor occupancy: time-activity curves
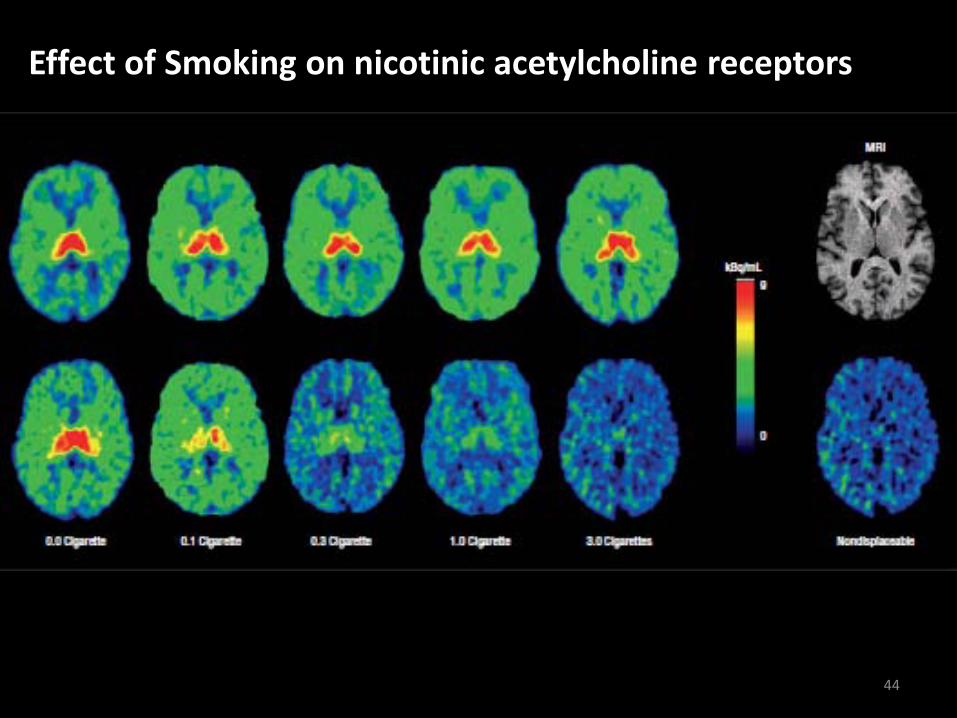
Effect of Smoking on nicotinic acetylcholine receptors
Conclusion: Smoking results in complete block of nAChRs
44
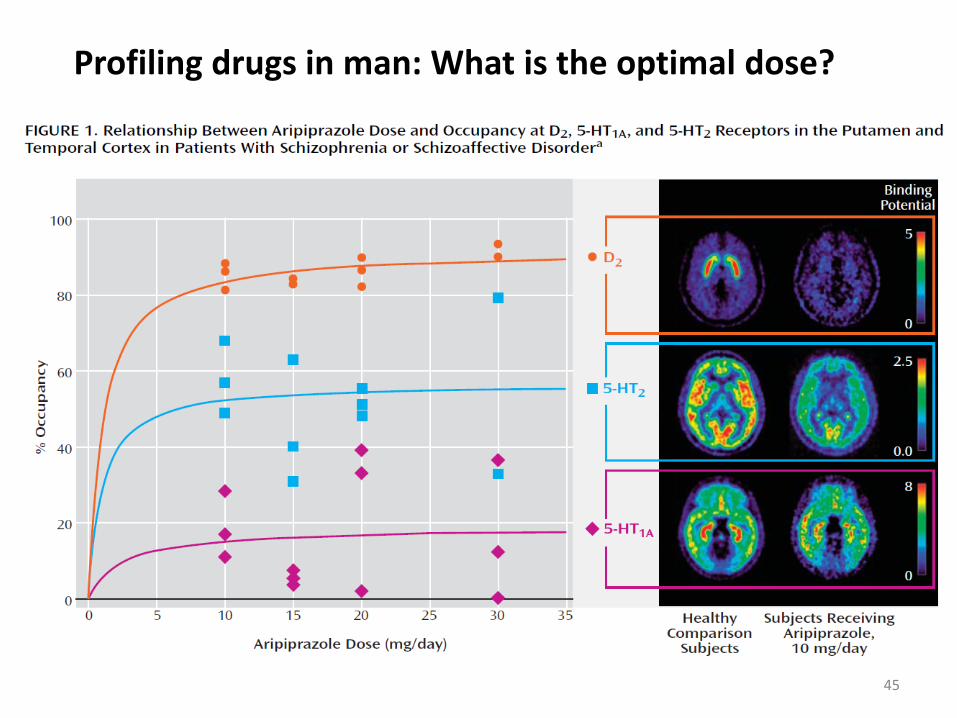
Profiling drugs in man: What is the optimal dose?
45
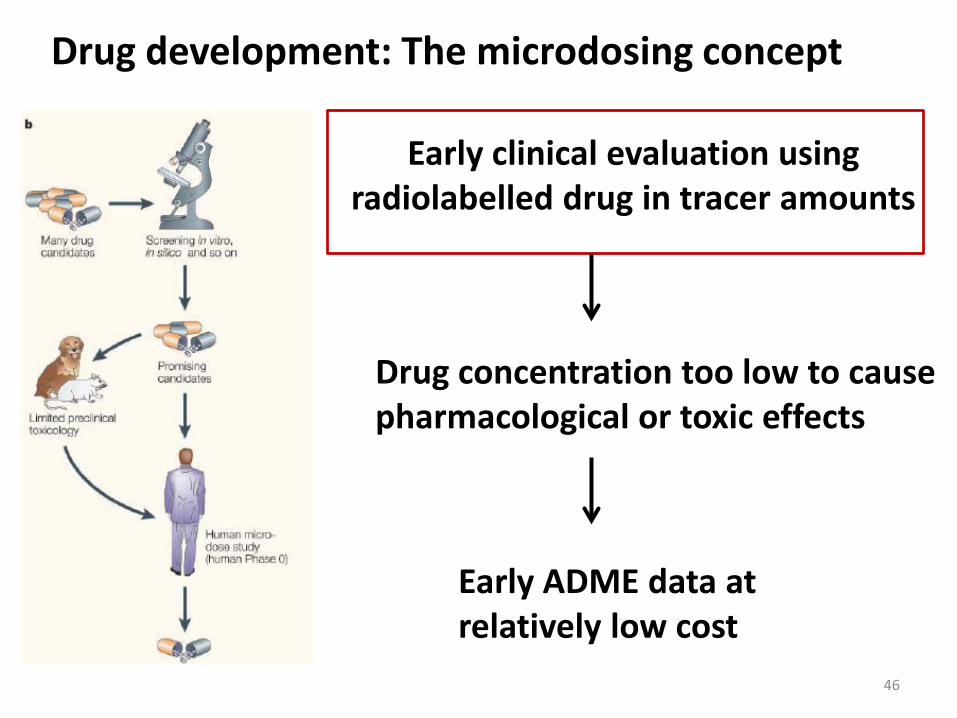
Early clinical evaluation using radiolabelled drug in tracer amounts
Drug concentration too low to cause pharmacological or toxic effects
Early ADME data at relatively low cost
Drug development: The microdosing concept
46
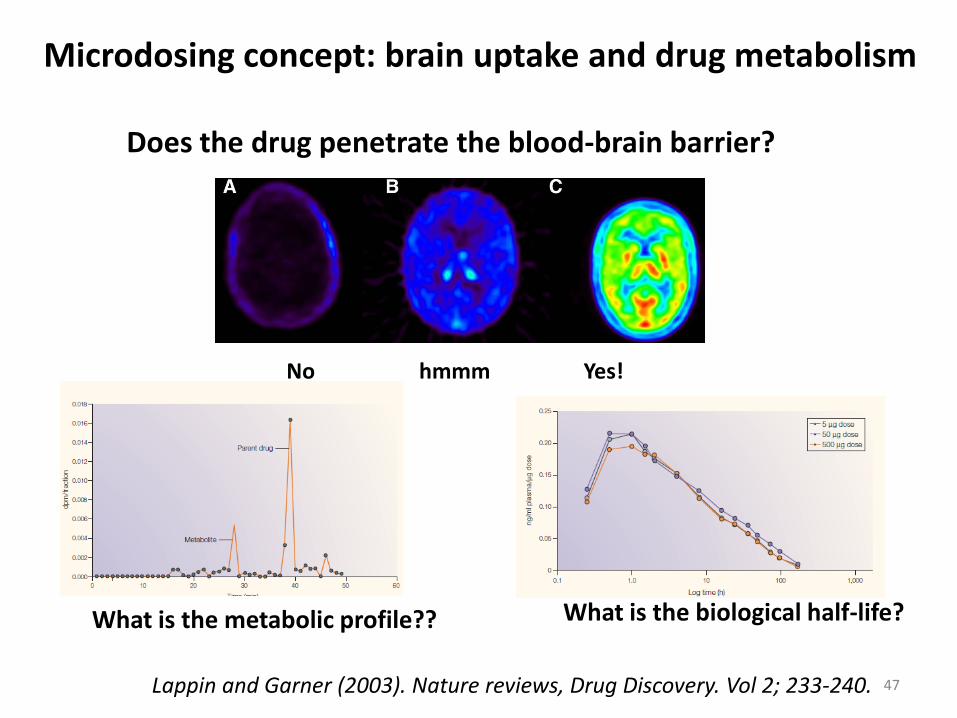
Microdosing concept: brain uptake and drug metabolism
Does the drug penetrate the blood-brain barrier?
No hmmm Yes!
What is the metabolic profile?? What is the biological half-life?
Lappin and Garner (2003). Nature reviews, Drug Discovery. Vol 2; 233-240. 47
48
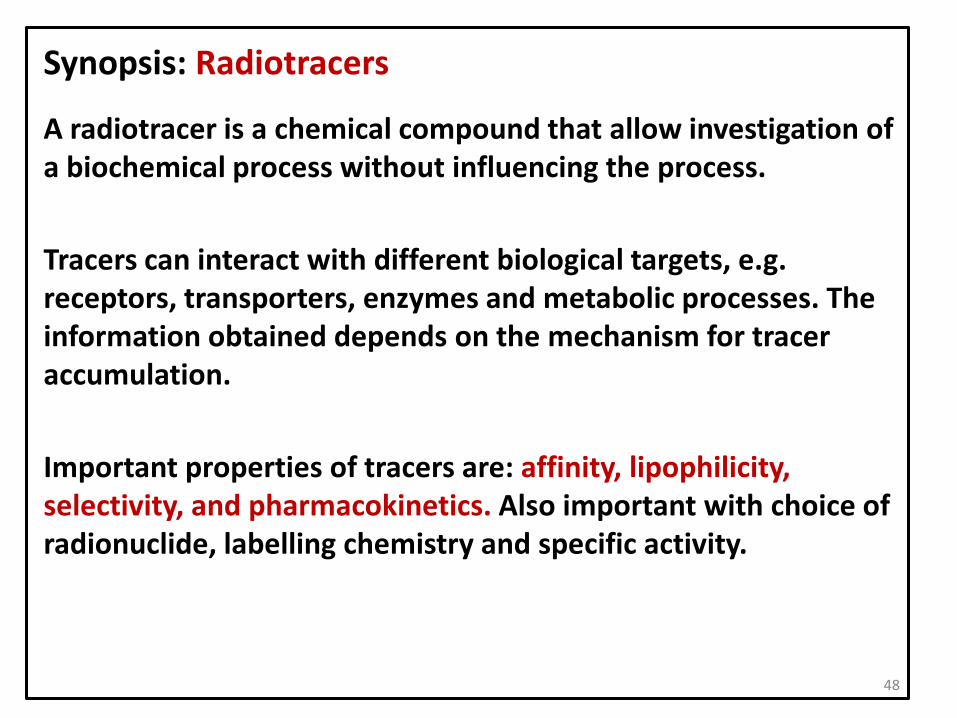
Synopsis: Radiotracers
A radiotracer is a chemical compound that allow investigation of a biochemical process without influencing the process.
Tracers can interact with different biological targets, e.g. receptors, transporters, enzymes and metabolic processes. The information obtained depends on the mechanism for tracer accumulation.
Important properties of tracers are: affinity, lipophilicity, selectivity, and pharmacokinetics. Also important with choice of radionuclide, labelling chemistry and specific activity.
49
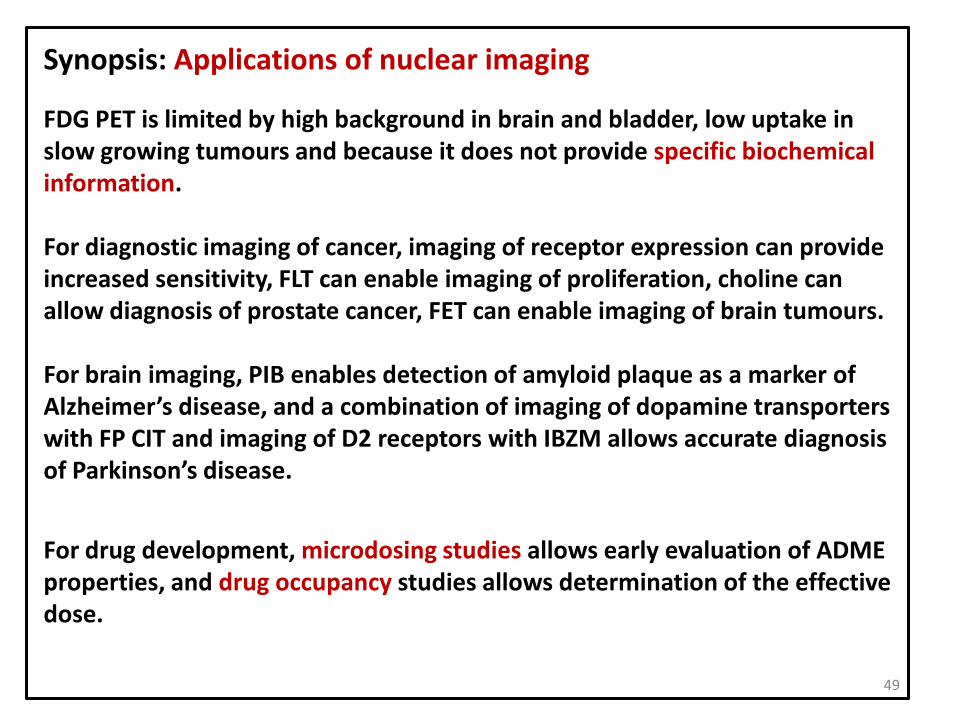
Synopsis: Applications of nuclear imaging
FDG PET is limited by high background in brain and bladder, low uptake in slow growing tumours and because it does not provide specific biochemical information.
For diagnostic imaging of cancer, imaging of receptor expression can provide increased sensitivity, FLT can enable imaging of proliferation, choline can allow diagnosis of prostate cancer, FET can enable imaging of brain tumours.
For brain imaging, PIB enables detection of amyloid plaque as a marker of Alzheimer’s disease, and a combination of imaging of dopamine transporters with FP CIT and imaging of D2 receptors with IBZM allows accurate diagnosis of Parkinson’s disease.
For drug development, microdosing studies allows early evaluation of ADME properties, and drug occupancy studies allows determination of the effective dose.
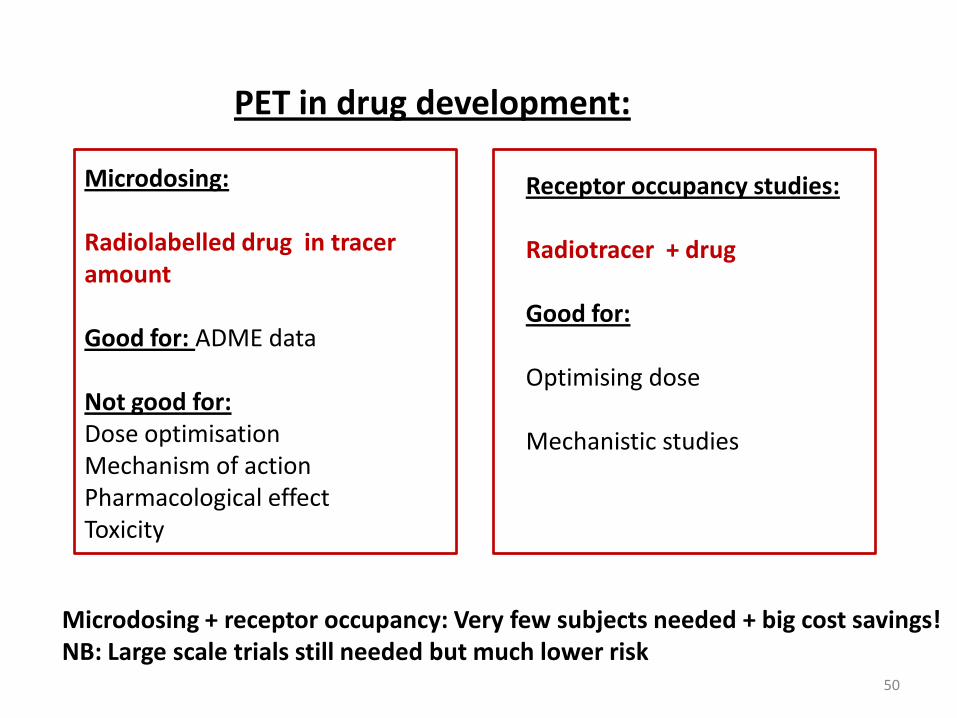
PET in drug development:
Microdosing: Radiolabelled drug in tracer amount Good for: ADME data Not good for: Dose optimisation Mechanism of action Pharmacological effect Toxicity
Receptor occupancy studies: Radiotracer + drug Good for: Optimising dose Mechanistic studies
Microdosing + receptor occupancy: Very few subjects needed + big cost savings! NB: Large scale trials still needed but much lower risk
50
Learning outcomes - you should understand: The limitations of FDG, and how the use of other tracers, including FLT, Choline, FET and RGD peptides can provide additional information. The principle of imaging amyloid plaque with PIB and how this relates to Alzheimer’s disease. The principle of imaging Dopamine transporters and D2 receptors and how this enables diagnosis of Parkinson’s disease. What microdosing studies are and how they can be used in drug development The principles of drug occupancy studies and how these can be used for drug development
51
Assessment – you should be able to apply your knowledge of radioactivity and nuclear imaging to explain underlying principles, solve practical problems and provide rationale explanations related to: Imaging with FDG and its limitations , and how the use of other tracers, including FLT, Choline, and amino acids can provide additional information. The principle of imaging amyloid plaque with PIB and how this relates to Alzheimer’s disease. The principle of imaging Dopamine transporters and D2 receptors and how this enables diagnosis of Parkinson’s disease. What microdosing studies are and how they can be used in drug development The principles of drug occupancy studies and how these can be used for drug development
52
Further reading:
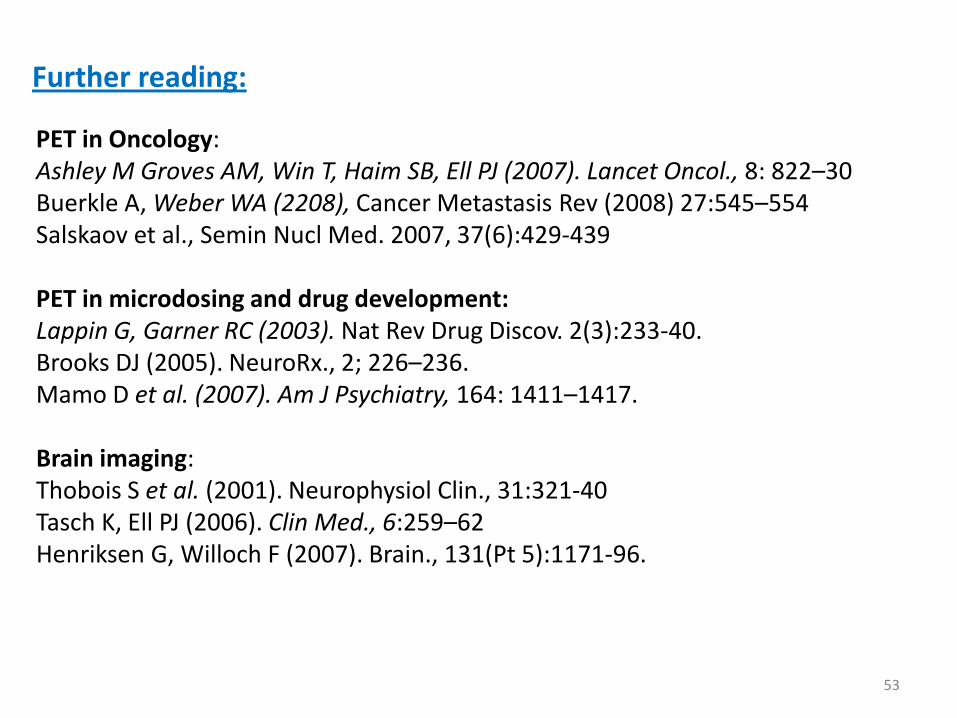
PET in Oncology: Ashley M Groves AM, Win T, Haim SB, Ell PJ (2007). Lancet Oncol., 8: 822–30 Buerkle A, Weber WA (2208), Cancer Metastasis Rev (2008) 27:545–554 Salskaov et al., Semin Nucl Med. 2007, 37(6):429-439 PET in microdosing and drug development: Lappin G, Garner RC (2003). Nat Rev Drug Discov. 2(3):233-40. Brooks DJ (2005). NeuroRx., 2; 226–236. Mamo D et al. (2007). Am J Psychiatry, 164: 1411–1417. Brain imaging: Thobois S et al. (2001). Neurophysiol Clin., 31:321-40 Tasch K, Ell PJ (2006). Clin Med., 6:259–62 Henriksen G, Willoch F (2007). Brain., 131(Pt 5):1171-96.
53