UCD CENTRE FOR ECONOMIC RESEARCH WORKING PAPER … · of course also produce goods or services that...
54
UCD CENTRE FOR ECONOMIC RESEARCH WORKING PAPER SERIES 2020 The Structure of Multinational Firms' International Activities Ronald B Davies, University College Dublin James R Markusen, University of Colorado, Boulder WP20/05 February 2020 UCD SCHOOL OF ECONOMICS UNIVERSITY COLLEGE DUBLIN BELFIELD DUBLIN 4
Transcript of UCD CENTRE FOR ECONOMIC RESEARCH WORKING PAPER … · of course also produce goods or services that...
UCD CENTRE FOR ECONOMIC RESEARCH
WORKING PAPER SERIES
2020
The Structure of Multinational Firms' International Activities
Ronald B Davies, University College Dublin
James R Markusen, University of Colorado, Boulder
WP20/05
February 2020
UCD SCHOOL OF ECONOMICS UNIVERSITY COLLEGE DUBLIN
BELFIELD DUBLIN 4

The Structure of Multinational Firms' International Activities
Ronald B. Davies* University College Dublin
James R. Markusen University of Colorado, Boulder
February 15, 2020
Abstract: The structure of a multinational firm, that is how its affiliates relate to one another, is critical for understanding where multinationals locate, how policy affects them, and their resilience to localized shocks. Here, we review the two main structures – market-seeking horizontal and cost-difference exploiting vertical investment – prevalent in the literature. In addition, we use data (primarily from the US) to examine which of these structures seems to dominate the data. This includes a novel use of measures of global value chain positioning of a country's industries. In each case, the data suggests a dominant role for horizontal investment. We conclude with a discussion of the challenge that intangibles play in multinational data and point towards potentially fertile areas for future research.
JEL Codes: F23; F14
Key Words: Foreign Direct Investment; Multinational Corporations:
Horizontal FDI; Vertical FDI; Global value chains
Contacts:
* This paper was Prepared for The Brooking Institution project and volume Multinational Corporations in a
Changing Economy. We thank the editors, Chad Bown, and conference participants for helpful comments.

3
1. Introduction
When thinking about multinational enterprises (MNEs) several questions come to
mind, including why some firms become multinationals, how policies influence a country's
attractiveness to firms, and how MNEs affect both the countries from which they come
(home) and those where they go (host). Running through the answers for all of these is the
matter of what multinationals are actually doing; that is, how they have structured their global
activities. One way you might envision that structure is like a snake. With a snake, the head
decides where to go, the mouth swallows food, and the spine twists for movement. Each part
of the snake does a separate activity, all of which adds up to a well-functioning whole.
Similarly, a firm may organize itself so that different affiliates perform different activities
which combine together for a finished output.
Alternatively, one can envision a structure more like an octopus. As opposed to the
differentiation inherent to the snake's parts, each of the octopus's arms does essentially the
same thing with the central head guiding the overall coordination. Here, the MNE's various
affiliates replicate each other with guidance from the home headquarters. Thus, just as
animals can be structured in different ways, so too can firms.
Understanding the firm's structure informs us about why the bulk of activity is in
developed countries, why trade policy can have conflicting effects on investment, why some
firms (but not all) die when an affiliate runs into trouble, and the potential labor market
effects from increased foreign direct investment (FDI).
In this chapter, we provide a broad framework for describing the structure of MNE
activities that aims to describe how the different parts of an MNE fit in to one another and
what the data suggest about the relative importance of alternative structures. This exercise
points towards a particularly important role for horizontal FDI, an octopus-like structure in
which the MNE is performing a roughly similar activity in its different affiliates, that is, it
replicates its activities across borders. Knowing that can then help to explain all sorts of
issues key to policy making and the public, such as why despite decades of warnings, we
generally don’t see a negative link between outbound FDI and home wages.
We begin our chapter with a number of basic definitions, concepts, and clarifications
of what we mean by some basic terms. First, a multinational firm is one that has equity
interests in establishments, such as plants or offices, in foreign countries. The key here is
ownership, with a standard definition of ownership as when a single individual owns at least
10% or more of the equity. When that owner is in a different country than the establishment,
this counts as FDI. Some large firms have extensive businesses with foreign customers and
suppliers via contracts and other arrangements, but do not actually have ownership of those
activities. As such, they are not normally defined as MNEs and, importantly, they are not
included in multinational data sets that we focus on.
Abstracting from the considerable heterogeneity among firms, the most primal form
of an MNE consists of a headquarters (parent) in the home country and at least one foreign
affiliate in another (host) country. A key aspect of this relationship is that generally the parent
supplies intangible assets and other services (e.g. management, technology, intellectual
property, marketing and finance) to the foreign affiliate. The firm’s headquarters’
establishment is generally a net exporter of these intangibles and services to affiliates and

4
those affiliates are net suppliers of goods (final or intermediate) or services (e.g., legal,
accounting, advertising affiliates, etc.) to customers. Profits, or the returns to intangibles and
other services, flow from affiliates to parents. Thus, much intra-firm trade is not in physical
intermediate or final goods.
These service flows are often or even typically poorly measured and documented,
something that has confounded attempts to fully understand the functioning of multinationals
and something we delve into at the end of this chapter. The headquarters’ establishment can
of course also produce goods or services that they sell at home and/or export to affiliates or
third parties.1 Affiliates produce goods and/or services and occasionally conduct some of
their own R&D. Many affiliates are exclusively in service industries, though their services
tend to be customer oriented relative to headquarter services. This, however, is a description
of what the different parts of the firm do, not how they relate or compare to one another. This
latter is what we mean by the structure of the MNE's global activities and is one of our
focuses.
Four characteristics clarify what we mean by the structure of a multinational firm. The
first is the geographic distribution of a firm’s establishments. The second is the activities
performed by the various establishments, including their value added and whether outputs are
final or intermediate goods and services. A third characteristic is where foreign affiliate
outputs are sold (locally in the host market, exported to home country, and/or exported to
third countries) and from where inputs are purchased. A final characteristic is the interactions
among establishments, that is, the intra-firm flows of goods, services, and intangibles. The
first goal of the chapter is to bring these together into a handful of archetypes that provide a
lens for viewing the data. Doing so generates two main MNE structures: the snake-like
vertical MNE (where different affiliates do different things) and the octopus-like horizontal
MNE (where replication is key).
Data analysis is the second aim of the chapter, in which we assemble and analyze
broad quantitative and qualitative data on these concepts for US MNEs and their foreign
affiliates. Although our focus is on US data both because of data quality and to simplify our
exposition, we include the experience of other nations as appropriate to show that what is
found for the US extends to the other major sources of FDI. In doing this, we seek to find
general characteristics and patterns rather than emphasize the specific experience of
individual firms, industries, or countries. Our goal to leave the reader with an understanding
for what general concepts are most important to the data (and which are perhaps widely held
but not supported by data) as well as key areas where the data is as yet underdeveloped. We
therefore operate at a more aggregate level than is often done with case studies and anecdotes
in order to arrive at this broad vision. When doing so, we find that the bulk of the evidence
points towards horizontal FDI as playing a dominant role in the aggregate data.
Finally, in focusing on understanding the structure and patterns of multinational
activity, several other important firm decisions are not considered. These could be
characterized as earlier-stage firm choices. Specifically, we do not delve into the firm's
choice of whether to produce at home or abroad, generally referred to as the offshoring
decision. In addition to assuming that a firm has decided to produce abroad, we set aside the
1 In order to avoid burdensome exposition, when we say "production" we mean the production of goods and/or services unless otherwise noted.

5
ownership decision, also known as outsourcing versus vertical integration, which concerns
whether to own the foreign affiliate or contract with local firms for the work. Although of
considerable interest, these are beyond the scope of this chapter and dealt with elsewhere in
this volume. Further, we will not explore the choice of where to locate foreign affiliates in
detail except insofar as they relate to our central discussion of MNE structure. We therefore
leave out issues such as tax policy for the location decision.
In the next section, we lay out two main MNE structures: horizontal (in which
significant amounts of activity is replicated across borders) and vertical (where the
production process is fragmented). We also discuss some of their more prominent offshoots
and develop a set of predictions for which patterns in the data are most consistent with one
structure or another. In Section 3, we dig into primarily US data to gain an insight into which
structure appears to dominate the FDI landscape. This arrives at the conclusion that most FDI
is horizontal. In Section 4, we introduce a new approach based on global value chains (GVC)
which supports and extends the insights of Section 3. Section 5 focuses on the issue of
intangible assets in order to point to the limitations of the current data and the need for future
efforts in this area. Finally, in Section 6, we conclude by suggesting how understanding these
structures is likely important for policy.
2. Structural Archetypes and Predictions
Two main structures for MNE activity have been developed over the past forty years:
horizontal and vertical FDI.2 The fundamental difference between the two is one of
differentiation versus replication. For most people, their initial instinct when imagining what
an MNE is up to is to think of a vertical MNE (the snake) which performs different activities
across its different affiliates, fragmenting its production process. The classic example of a
vertical MNE is an apparel company such as Nike who designs its apparel in the US and then
produces the actual shoe in countries like China or Vietnam which is then shipped to a Nike-
owned store in Europe for sale to consumers. This vertical structure is a natural embodiment
of the global value chain (GVC) with each step in the process contributing to a final good.
The key to this structure is that each link in the GVC does a different activity, with the
different stages located in different countries.
In contrast, a horizontal MNE (the octopus) more or less replicates key parts of its
production process across borders. For example, an auto MNE such as Toyota may design its
car in Japan and then use this blueprint to produce cars in both Japan, the US, and the UK.
While the blueprints are only done in one location and thus there is still an element of a
supply chain in the firm's structure, the major part of its activities, here the manufacturing of
the cars, is repeated in different countries.
In addition to the specific examples just mentioned, a couple of broader examples and
ones which are familiar to most readers are in order. In addition to many manufacturing
industries such as autos, cement and chemicals, many service firms and industries closely fit
the horizontal structure. Fast food restaurants, hotels, accounting, consulting and legal
2 The seminal horizontal model was laid out in Markusen (1984) while the vertical model was formalized in Helpman (1984). Since then numerous extensions and variants have been developed, the number of which is too great to adequately cover here excepting the main updates to the models discussed below.

6
services all perform roughly the same activities in many countries and indeed within
countries. Indeed, replication is a key attraction of chain fast food with the familiarity
appealing to customers even when the chain is foreign-owned. As an example, Wikipedia
reports that there were 5,910 KFC outlets and 2,700 McDonald's in China as of 2018.
Vertical examples include the Maquiladora factories in Mexico, where parts, components and
other intermediates are assembled and the final output exported. Domestic value added is
about 15% of output, imported intermediates are about 80-90% of all intermediates used by
these plants, and virtually all output is exported. Business process outsourcing (BPO) is an
example of vertical production in services. Industries ranging from banks to airlines can have
routine white-collar activities ranging from payroll, to data entry to call centers located
abroad in places like India, the Philippines or Ireland.3
While this distinction may initially seem minor, it has very fundamental implications
for what one would expect in the data. Here, we discuss three differences between the two
structures: the comparison of input costs in the home and host countries, the location of sales,
and the relationship between FDI in one host and that in other hosts. The first two build from
the same question: why choose FDI rather than simply producing at home? That latter is
more aligned with why the firm has invested in a particular host as opposed to another one.
We set this last issue aside for the moment in order to focus on why the firm has become a
multinational in the first place.
Each of these two structures has a somewhat different answer to the question of why
the firm became an MNE. If asked this, most people would respond that it must be the case
that labor is cheaper overseas than at home. This idea naturally extends to any inputs the firm
uses in its production process (including raw materials), but the intuition is the same: an input
is available cheaper in the foreign country than at home. If this were true for the entire
production process, the firm might be best off entirely relocating to that foreign location.
This, however, would not make it an MNE since it would entirely operate in the host and
miss the cross-border ownership key to the definition of FDI. Instead, for FDI to make sense,
it must be that some inputs are cheaper at home while other inputs are cheaper in the host. Put
differently, different stages of the production process are located in various countries because
each location is the least expensive for that particular stage of production. Thus, vertical FDI
is when investment is driven by differences in costs across borders.
An implication that arises from this is that, if cost differences are a driving force for
vertical FDI, then it only makes sense when countries are different from one another. The
classic example, due to Helpman (1984), is when investment happens between a highly
skilled developed country and a low-skill abundant host country. In this case, the developed
North country serves as the home since its abundance of high-skill workers makes it the
natural place to focus on innovative activity including the development of the firm's
3 For many cases of both horizontal and vertical international production, firms do not actually own the foreign
production partner. Some fast food restaurants and hotel are franchises. A lot of relatively simple and low-
skilled production and final assembly is done by independent contractors or licensees, generally referred to as
outsourcing. This includes manufacturing industries such as clothing and footwear, but also the assembly of
sophisticated electronic goods such as smart phones. When the multinational does not have an equity interest in
the foreign producer, that activity is not in the foreign affiliate data we exploit in this paper, and there is no
obvious way to measure it.

7
intangible assets. The less developed Southern country meanwhile will have low wages for
assembly workers, making that the natural location for production of the finished good. Thus,
vertical FDI will flow from North to South since this allows the firm to fragment its GVC and
take advantage of the production cost differentials across borders. The output of this can then
be sold wherever consumers are located. In particular, given the relative wealth in home, one
would expect that a good deal of MNE output is exported from the host back to the home
country. This structure then closely fits the example of Nike discussed above.
Note that this cost savings is driven by production costs. A second source of costs is
in delivering output to consumers. In some cases, these costs can be quite daunting. One
example is when the good is very difficult to transport across borders because of its weight
(e.g. concrete) or delicacy (such as fresh foods). Another is when there are policy barriers to
trade such as quotas or tariffs. A classic example of this is when the US imposed severe trade
restrictions on Japanese auto imports in the 1980s. This led many Japanese firms to jump the
tariff wall and begin producing in the US for US consumers rather than continuing to import
from elsewhere. Third, it may be that, in order to effectively compete in a market, it is crucial
for a firm to have a local presence in order to read the market's desires and effectively
distribute its product to local consumers.
In each these cases, even if there is not a production cost savings to producing in the
host, there can be a significant savings in terms of serving the market. Note that just as these
savings encourage production in the host, they likewise encourage production at home since
it would be comparably costly to serve the home market from a distance. This then results in
a horizontal MNE structure where the firm produces its final product in both home and host
with each production location's output geared towards local sales. This is the replication that
is the trademark of the horizontal MNE. In addition, the parent part of the MNE generates
intangibles such as designs or trademarks and uses this joint input across the two affiliates.
Since the parent produces both output and the joint input, the affiliate is not a carbon-copy of
the parent. Instead, the horizontal MNE is marked by the significant overlap in the activities
of the parent and affiliate, with similar activities being carried out across borders.
As with the vertical MNE, this generates two predictions for where horizontal FDI is
most likely to thrive. Recall that for vertical FDI, since different production processes are
happening in different countries that it works best North-South, that is, when countries differ
from one another. Horizontal FDI, however, replicates processes across borders. This makes
sense when costs are not very different across countries. Thus, horizontal FDI should be
found when the home and host are fairly similar to one another. This is one of the key
insights of Markusen (1984) who shows that horizontal FDI can even happen when the two
countries are identical to one another. Further, recalling the importance of developing
intangible assets, a fairly skill-intensive endeavor, we can further narrow our horizontal
search to FDI between skill-abundant developed countries, making horizontal FDI a North-
North phenomenon. In addition, there is a clear difference in where affiliate output is sold. In
vertical FDI, a sizable share of output was shipped back to the rich home consumers. In direct
contrast, horizontal affiliate output is sold locally since the desire to access those consumers
is the entire point of this MNE structure.
The above then gives us two ways to distinguish between the horizontal and vertical
structures in the data: a comparison of the costs between the home and host country (often
8
proxied by differences in skill levels or other measures of the development of the home and
host) and analysis of whether affiliate output is sold locally or exported to home.
Up to this point, these two archetypes have focused on a setting with only two
countries, the home and host. This is obviously a simplification and one which, when relaxed,
offers a third way to distinguish between vertical differentiation and horizontal replication.
When opening the model to third countries, vertical FDI can be broadened by introducing
further fragmentation of the GVC. While it is most natural to think about linear GVCs, e.g.
where silicon is converted into computer chips which are then exported to a factory where
they are installed on motherboards that are then shipped to another facility for assembly into
a laptop, another possibility is that the chips and motherboards are produced separately and
then all the installation and assembly happens in a central location.
Baldwin and Venables (2013) discuss these alternative vertical structures, labelling
the first, linear structure a "snake" and the second, hub-and-spoke approach a "spider". Note
that the spider differs from a horizontal MNE since in a spider, the intermediates flow to the
central "body" whereas in the horizontal GVC intermediates flow from the central parent to
the affiliates. In any case, both of these complex vertical structures are again based on
differentiation since each affiliate performs a different part of the overall process which is
brought together through international trade.4
Following from its focus on market access, opening the basic horizontal structure up
to third countries means gaining access to more consumers.5 A key aspect of this is that those
additional consumers can be catered towards by not only exporting from the parent or
producing in this new third country, but also by exporting from an affiliate in a nearby host.
For example, a US firm operating in Ireland has access to Irish consumers but also, and
perhaps more importantly, consumers in the European Union who can be served by the Irish
affiliate without being troubled by the tariffs and quotas that apply to imports from non-
member countries. Thus, this "export platform" investment is attracted not only by the host's
consumers but by those in nearby countries, what is sometimes referred to as surrounding
market potential.
For example, as detailed by Barry (2004), US software firms including Microsoft
have affiliates in Ireland that duplicate and package software provided by the parent firm with
that output destined for the European market.6 Likewise, in order to achieve "just in time"
manufacturing Dell has located affiliates in the US, Ireland, China, and more so as to
assemble the same computers near regional consumers. Nevertheless, the heart of export
platform FDI is the same as in the simpler horizontal structure – the replication of key
activities across barriers since it is still the case that the Irish affiliate is designed to replicate
US production for overseas consumers. This then fits in well with our octopus analogy in
which the central head guides the activities of the arms all of which are capable of essentially
the same thing.7
Together, these extended versions of the horizontal and vertical models give us two
4 See the work of Bergstrand and Egger (2007) for a complete treatment of complex vertical FDI. 5 For a full discussion, see the work of Ekholm, et al. (2007). 6 He notes a similar strategy for pharmaceutical companies including Pfizer and Merck. 7 Indeed, since affiliates generally operate with a fair degree of autonomy, the giant Pacific octopus is especially relevant since it has nine brains: one central and one for each of the somewhat autonomous arms.

9
additional predictions for the data. The first of these relates to the substitutability or
complementarity of investment across hosts (as opposed to between a given host and the
home country). If an MNE has a complex vertical structure, it is integrated via trade between
its affiliates (either from one link to the next in a snake structure or from various links to the
central node in the spider structure). This works best when trade barriers are low between
hosts, suggesting that investment in one host makes the most sense if there is also investment
in other nearby hosts. This results in a complimentary relationship in FDI across hosts. If an
MNE has an export platform structure, FDI in one host is a substitute for FDI in another
nearby host. The reason for this is that the consumers in one country can be served
reasonably well by the affiliate in the proximate host. Thus, examining the
complementary/substitutability of FDI across hosts gives another way of judging whether
FDI structures aim to fragment the GVC or replicate it. In addition, since export platform is
again geared for local sales (where "local" now refers to the host's region), then significant
sales in third countries provides a further clue into the nature of MNE structures.
In the next section, we turn to the data to develop a set of stylized facts that provide
insight into which of the two core structures – vertical fragmentation or horizontal replication
– seems to dominate FDI activity. Before doing so, it is important to recall that the flow of
intangibles is a critical aspect of the overall integration of the firm. In the vertical MNE, the
parent firm is often the provider of services to the next link in its GVC. The same is true for
the horizontal firm, with the difference being that in the horizontal MNE those services are
used jointly across affiliates. Thus, neither of these models require actual physical exports by
the parent to its affiliates nor do they contradict our above description of the prototypical
MNE. Both structures, however, do suggest a critical role in the export of intangibles from
the parent to the affiliate which is something specifically addressed in Section 5.8
3. Using US data to Distinguish Structures
In this section, we delve into the three methods of distinguishing across FDI structures
– differences between the home and host, the destination(s) of affiliate sales, and the
substitutability/complementarity of affiliate activity – in turn.
The early work attempting to distinguish horizontal from vertical FDI often relied on
differences in factor endowments (as a proxy for cost differences) with the prediction being
that horizontal investment should be more common between Northern countries whereas
vertical FDI should be prevalent from developed to developing countries. Even a brief look at
the data finds that the bulk of FDI is North-North, consistent with horizontal FDI. Figure 1
presents UNCTAD's data on US stocks of inbound and outbound FDI decomposed between
developed and developing countries.9 From this, two things are readily abundant. First, the
8 Note that this flow refers to where the intangible is generated not where it is "located" for tax purposes, an issue at the heart of the taxation of FDI taken up elsewhere in this volume. 9 These data come from https://unctad.org. Stocks measure the value of foreign-owned equity, retained earnings, and net loans, at their historical cost value. While this can roughly be considered the "capital" of the MNE, this should be taken as an approximation due to issues of depreciation. In addition, this is only a rough approximation of the value of investment since the productivity and intensity of capital can vary across countries and industries. These issues do not arise for affiliate sales, however, sales are potentially more prone to year-on-year fluctuations relative to more stable FDI stocks. On the whole, the two give fairly similar pictures

10
large majority of US investment comes from and goes to other developed countries, strongly
suggestive of horizontal FDI. Second, although the US does invest a growing amount in
developing countries, showing that vertical FDI is important, FDI in the US from developing
countries remains negligible. This is consistent with the idea the vertical FDI should
primarily originate in skill-abundant developed countries but be hosted by developing
nations.
Further, these patterns are not only true in the US data. Figure 2 also uses UNCTAD
data but now looks at inbound and outbound FDI stocks by country group. Although this
figure is unable to break the investment down by origin (for inbound) or destination (for
outbound) investment, since the bulk of FDI comes from and goes to developed countries,
this again supports the fact that MNEs operate primarily between developed countries. While
simple data analysis such as this can mask other underlying forces, these same patterns are
found in econometric analysis that specifically controls for other such factors (including the
wealth of consumers and the geographic distribution of developed countries).
Studies building from the integrated horizontal and vertical analysis of Markusen
(2002) find that the bulk of investment is between countries with similar shares of skilled
labor (see, for example, Markusen and Maskus (1999) or Blonigen, Davies, and Head
(2003)). While evidence of vertical FDI can be found by using this approach (e.g. Davies
(2008)), the empirical evidence is strongly supportive of FDI primarily between the skilled
countries, a result most consistent with horizontal FDI as the dominant structure for MNE
activity.
The second approach to distinguishing horizontal from vertical is via affiliate sales.
Tables 1 through 3, which use publicly available data drawn and condensed from the Bureau
of Economic Analysis, give some evidence and answers.10 Data is for majority owned foreign
affiliates, i.e. US outbound FDI. But before jumping into the issue at hand, the BEA data can
also give us a quick perspective of the importance of foreign affiliate production in total. The
upper right panel of Table 1 gives the value of US foreign affiliate supply of goods and
services as a proportion of total US exports of goods and services respectively. Supply of
goods by US majority-owned foreign affiliates is about 2.8 times the total value of US
exports, and services supply by foreign affiliates about 2.3 times the value of US exports.
Some affiliate sales embody imports from the US so there is some double counting, but
affiliate imports from the US are actually a small number as we will note shortly; and
conversely, there is some foreign content embodied in US goods exports.
Table 1 presents data on the destination of affiliate sales in the top left panel. The
share of sales that are to the host-country market are about 60 percent of total affiliate sales,
with the share for goods lower and the share for services higher. While this means a large
proportion of sales (about 40 percent) is exported, the second and third columns of Table 1
show that most of the exports go to third countries, not back to the US. This latter accounts
for only about 11 percent of total sales. We do not present detailed statistics on intra-firm
trade, but the data show that both intra-firm imports and exports of goods by affiliates are a
of FDI, although as discussed by Davies (2008), the stocks may give more prominence to investment in developing countries. 10 These can be found at https://www.bea.gov/data/intl-trade-investment.

11
very small proportion of total affiliate goods sales.11 Exports of goods from parents to
affiliates are only 5.6 percent of total affiliate goods sales, while exports of goods from
affiliates to parents are only 8.5 percent of affiliate goods sales.12 While it is hard to
document what generally accepted views might be, we suspect that these numbers on intra-
firm trade and total affiliate exports are smaller than what many would guess. In any case,
what is clear that the primary market for US affiliates abroad is not the US as the vertical
model would suggest.
The bottom panel of Table 1 digs deeper by showing the relative importance of goods
versus services in affiliate production. The motivation for including this is that many
international economists continue to spend the overwhelming portion of empirical analysis on
goods, specifically manufacturing. Perhaps this is because of data availability, but that focus
has distorted our view of MNE activity. The bottom panel shows that goods account for 72
percent of affiliate sales. That said, it must be remembered that goods production uses many
more purchased intermediate inputs than services do. This is why the second column reveals
that, measured by value added, the value of goods and services are about the same. This
suggests a "double counting" of sales in goods because of trade in intermediates. Indeed, this
double counting of trade is one of the reasons why trade fell so sharply following the
economic crisis of 2007 (Behms, Johnson, and Yi (2011)) even though the same did not
happen in services (Ariu (2016)). Finally, services are more labor intensive than goods (our
interpretation), and the third column shows that measured by affiliate employment, services
are much more important than goods. This all indicates that the focus on trade in goods is
missing a crucial aspect of MNE activity and that a review of the data is in order.
Table 2 provides more detail on the destination of affiliate sales by breaking the world
down into six regions. The first row gives the world total for reference and is the same as the
first row in Table 1. The first column of Table 2 emphasizes the above point: US affiliate
production abroad is a first-world phenomenon. Furthermore, sales are highly concentrated in
the rich regions of the world.13 This is generally interpreted as another hint that foreign
affiliates are likely dominated by horizontal affiliates that are producing goods and services
similar to those produced in the (rich) US.
The second column of Table 2 shows the local (host country) share of sales in each
region. These are fairly similar numbers across the regions. The share for Europe is low, but
the cause of this is revealed in the third column, which gives the share sold to third countries.
Much European production is sold to third countries, a result suggestive of export platform
FDI and something we examine more in Table 3 below. The fourth column gives the share
exported back to the US (note that this includes all US customers, not just intra-firm exports).
These numbers are also consistently small and continue to tell the same story: multinational
affiliates are not primarily created for low-cost production to ship back home.
The biggest share for exports back to the US is for Canada (at 20 percent), which is
not surprising. Economists have emphasized the importance of within plant specialization
between the US and Canada, with for example plants in the auto industry dedicated to limited
11 Unfortunately, no data on services trade is unreported. 12 In French data, Davies, et al. (2018) find that, even when there is an affiliate in a destination country, one-third of MNEs engage in no intra-firm trade to those countries and export only at arms-length. 13 It should be noted that the Asia-Pacific data do not have information for most of the poorer countries of southeast, south and central Asia, with Indonesia being the lowest income country in the data.

12
numbers of models and parts that are then freely traded across the border (a fairly horizontal
structure). It is worth noting that this share of US sales outstrips that of Latin America where
the lower wages would be the most fertile ground for vertical investment. Thus, again the
sales data is suggestive of horizontal dominance.
The lower panel of Table 2 provides some historical perspective on the shares of
affiliate sales. What is interesting and important is that there has been very little change in
these shares over thirty years. In particular, the share of sales back to the US has remained at
10-12 percent over the whole thirty years. There has been some decline in the local share, but
this has been taken up by sales to third countries. A conjecture is that falling trade barriers
and transport costs over this period has allowed firm to more easily serve nearby countries
from a single plant or office in one country (i.e. export platform FDI).
The data in this lower panel of Table 2 are important in that the discussions among
economists and in the business press about growing fragmentation and global value chains
may have created an expectation that cross-border trade by multinational must have grown
considerably. However, even if all of the increase in sales to third countries are part of
complex vertical FDI, Table 2 confirms that serving local and regional markets remains the
principal task of foreign affiliates. Thus, even as technological and policy changes have made
vertical FDI easier, the data indicates that horizontal FDI's importance has held steady for a
very long time.14
The purpose of Table 3 is to shed light on third-country sales by foreign affiliates,
which, as a reminder, account for about 30 percent of total sales. Here we exclude Canada
from the sample because third-country sales are understandably very small, and we wish to
concentrate on own-region third-country sales. The first column of Table 3 lists the share of
third-country sales that are generated in each region and shows that the overwhelming portion
of third-country sales are by affiliates in Europe and Asia-Pacific. Together, these two
regions account for 90 percent of total third country sales by US affiliates. Further, the
proportion of world third-country sales for these two regions is considerably larger than their
proportion of total sales (74 percent).
The real insight of Table 3, however, is in the second column where we see that the
most of these third-country sales are intra-regional, i.e. what is produced in Europe is sold in
Europe. Overall, 75 percent of world third-country sales stay in the same region. For Europe
and Asia-Pacific the figure is 80 percent. This is again indicative of export platform
investment, particularly in wealthy Europe (which as illustrated by Figure 1 is a major
destination for US FDI).
For individual countries, the BEA data does not identify the exact destination of third-
country sales, but these numbers point towards American MNEs establishing affiliates in one
country to serve all of Europe, i.e. export platform FDI. Which specific country (or countries)
is determined on the basis of cost and other considerations. These could include centrality,
labor costs, taxes and so forth. While some business leaders argue that tax issues are second
order considerations, note that three European countries are particularly export-platform
oriented as shown here:
14 Just in case you were interested, the first octopuses appeared on earth roughly 500 million years ago; snakes arrived on the scene only 100 million years ago.

13
Local share Third country share
Ireland 18 61
Netherlands 40 52
Switzerland 24 67
A common feature of these three outliers is that all of them are countries in which
taxes are low, with Tørsløv, Wier, and Zucman (2018) counting them among the top ten tax
havens. As discussed in detail elsewhere in this volume, this has the potential for distorting
the value of sales for tax purposes. Nevertheless, it is clear that the source of revenues
remains local. Similar results could potentially be found for Asia-Pacific, with multinationals
choosing a specific location such as Singapore, Hong Kong, or Taiwan to serve the much
larger region. Indeed, third-country sales are 59 percent of Singapore’s total, as compared to
local sales of 34 percent (where one suspects that much of the local total is sales to other local
downstream firms for further processing and export). Overall, the data again suggest that
horizontal motives for foreign investment seem to dominate vertical ones.
Finally, as noted above, extending the basic horizontal and vertical models to multiple
host countries yields a third way of distinguishing between replication and fragmentation,
namely, by looking at whether FDI in nearby countries is a substitute (consistent with export
platform and replication) or a complement (consistent with complex vertical fragmentation)
for FDI in a given host. Early work in this regard was undertaken by Blonigen, et al. (2007)
who used spatial econometric techniques for US outbound FDI. While they find some
variation, US FDI in Europe is in particular characterized by substitution of FDI across
borders. They also find a positive effect for surrounding market potential. These two patterns
are strongly indicative of export platform FDI, further supporting the notion that MNEs are
replicating their activities across countries in order to gain access to consumers. Comparable
results can be found for other parent countries in the results of Baltagi, Egger, and
Pfaffermayr (2007), Garretsen and Peters (2009), and others.
Thus, building from the various methods the models of FDI suggest, the data
consistently points towards a major role for horizontal replication in MNE structures. This
does not argue that vertical FDI does not exist since both anecdotal and data analysis find
evidence for it (such as the growing investment in Asia). Rather, this points towards a
primary role for horizontal investment in which most FDI takes place between wealthy,
developed nations in order to replicate key activities to better compete for local consumers. In
the next section, we present an additional method for extracting this pattern from data, a
method that takes from an examination of MNEs and their place in global value chains.
4. FDI and Global Value Chains
In this section, we present a new way of differentiating between horizontal and
vertical FDI by using data on global value chains. This is based on the idea that whereas
vertical FDI is explicitly designed around intra-firm trade, by the nature of its replication
basis, horizontal FDI is less reliant on intra-firm trading of intermediate inputs. This points to
a different utilization of GVCs across the two MNE structures. Here, we examine how FDI
fits into GVCs to create a new, heretofore unexplored window on its strong horizontal flavor.

14
We do so by using two measures of GVC participation, the Output Index (which describes
how much an industry in a given country provides inputs for use by other firms) and the Input
Index (which measures how much the country-industry pair relies on inputs from the GVC).
We find that FDI in developed countries is concentrated in industries where these measures
are relatively small when compared to FDI in developing countries. This is consistent with
the notion that developed countries (which again are the major hosts) attract more mostly
horizontal investment while developing ones host more vertically-oriented FDI.
For vertical FDI, the MNE's GVC is front and foremost since this MNE snake-like
structure is designed to fragment the production process across borders. As such, the parent
and affiliate are obviously links in a GVC. The firm's GVC in the horizontal model is less
obvious but is still present in the form of the joint input which is produced in the headquarters
and used across the various production affiliates (just as the central head of an octopus
provides guidance to each of the arms). Both of these GVCs, however, are internal and do not
describe how MNE activity fits into the production activities of other firms.
In the early models of FDI, such as Helpman (1984) and Markusen (1984), production
technologies were simplified so that only MNEs used intermediate inputs and those inputs
were made by the MNE itself. In practice, many MNEs purchase intermediate inputs from
other firms. Further, those inputs can originate in the home, host, or third countries. In
addition, although the early models of FDI described the foreign affiliates' customers as being
end-use consumers, this does not have to be true. Instead, the multinational's output can serve
as an input into the production activities of other firms. That said, the location of those
unrelated purchasing firms would still vary across MNE structures: i.e. at home (vertical), in
the host (horizontal), or to firms in third countries (export platform). While, as discussed in
Box 1, the distinction between intermediates and final goods is somewhat hazy in practice,
the intuitive difference and what it means for describing GVCs is clear.
With the above in mind, analyzing where parents and affiliates are located in GVCs
can help us understand the structure of MNE activities. Although we do not have data on
intra-firm GVCs, we are able to utilize industry data developed by Antràs and Chor (2018)
that positions an industry in a given country in the global GVC. A key aspect to their work is
that it incorporates the global value chain, that is, it explicitly recognizes that the production
of a final good can involve many stages across industries and countries. We use these data to
construct two measures: one capturing how much an industry feeds into GVCs by supporting
the production of others and one measuring how much the industry draws its inputs from
GVCs. Note that a feature of both of these is that they are constructed for an industry as a
whole.15 Thus, for a given country, they combine the local production of domestically-owned
MNEs, foreign-owned MNEs, and purely domestic firms.
That said, MNEs feature heavily in the construction of the Antràs and Chor (2018)
measures. Roughly one-third of global output, two-third of worldwide exports, and half of
imports are attributable to MNEs (OECD, 2018).16 As such, particularly when focused on the
cross-border aspect of GVC measures, MNEs undoubtedly form a major part of their
15 This is a due to the fact that the input-output data that is available combines all firms within an industry.
16 This is particularly impressive in light of the fact they only account for 23% of global employment (OECD, 2018).

15
construction. Further, the inclusion of non-MNEs is potentially advantageous since, as
discussed above, MNEs can both buy and sell intermediates with unrelated firms.17 Thus, the
inclusion of all firms rather than just MNEs when measuring GVCs may be necessary to
accurately describe their operation. For the first of these, we construct an Output Index
which captures the degree to which an industry's sales contribute to the production process of
other firms.18 One way to do this is to simply measure the percentage of an industry's sales
that are intermediates. This, however, misses the chain part of the GVC since it ignores what
happens beyond the next link in the chain. As a result, this would understate the industry's
contribution to the GVC.
For example, consider the aluminum industry in three countries. In China, the
industry produces aluminum that is sold directly to final consumers as aluminum foil. Thus,
for Chinese aluminum industry, there is no subsequent link in the GVC. The German
aluminum industry meanwhile produces aluminum for beverage companies who turn them
into cans that are then filled and sold to final consumers. In comparison, the American
aluminum industry sells its aluminum to a screw manufacturer who in turn sells its screws to
an airline company which uses them to make planes which are delivered to final consumers.
Unlike the Chinese industry, both the German and American producers have subsequent
links, one link for the Germans and two for the Americans. Obviously, the GVC that the
Chinese sector feeds into is the shortest – there is one step between it and the final consumer.
This would then get the lowest value for the Output Index among the three. If both the
German and American industries sell the same share of their output as intermediates, because
the value chain for the German sector is shorter (two steps away from the final consumer), its
Output Index value would lie between that of China and the US.
Thus, the Output Index accounts for the number of steps between an industry's
production and the final consumer.19 In addition, as detailed in Box 2, it controls for the
varying shares of output sold as intermediates in each link in the GVC. In broad strokes, the
Output Index is higher when country-industry sells as more as intermediates itself and when
its customers sell more as intermediates to a longer GVC chain. Thus, the higher the Output
Index for a nation's industry, the more it contributes to GVCs.20 As discussed in Box 2, some
17 In fact, for US firms, Ramando, Rappaport, and Ruhl (2016) find that intra-firm trade may be the exception rather than the rule. 18 In the WIOD data used by Antràs and Chor (2018), sales are precisely that and as such combine the contributions of labor, capital, intellectual property, and intermediates (which are at the heart of the GVC measures). The WIOD data also break down the sales into the contributions of labor, capital, and intermediates. Recent work by Chen, Los, and Timmer (2019) suggests that this may mis-allocate the importance of intellectual property to capital. This is further discussed in Section 5. 19 Note that these steps include reaching consumers themselves, i.e. the distribution network. The WIOD
database builds from supply-use tables that are based on national accounts data. Using wholesale and retail trade
data, margins for these activities are constructed and gathered into two industries: wholesale services and retail
services. These are then treated as an industry in and of themselves, with the share of purchases/sales linked to
another industry based on relative purchase/sale levels. In the iPhone example of Table 8, this stage in the GVC
is worth $90 which, when combined with the physical components and miscellaneous costs, amounts to a total
"cost" of $329.99.
20 Note that it is not necessary that the output be sold to another country-industry for further processing. Instead, it is certainly possible that the output is sold to another firm (including a related affiliate) in the same industry in the same country. Thus, this is specifically not a measure of internal/external transactions, but rather a measure of how the output is used.

16
industries such as mining contribute heavily to GVCs whereas others (e.g. real estate)
contribute little.
In contrast to the Output Index which measures contribution, the Input Index
measures a country-industry's reliance upon the GVC, that is, the degree to which the GVC
contributes to its own output. One simple way of doing so would be to measure the cost of
purchased intermediates relative to output. However, just as using only the share of output
sold as intermediates understates the contribution to the GVC, doing this would understate
the reliance on the GVC since a given country-industry's suppliers may themselves purchase
intermediates from links further back in the chain. The Input Index accounts for this by
decomposing a country-industry's value-added across the various links in the GVC.
As an example, consider the electronics industry in Japan, Ireland, and India. Japanese
electronics use no inputs other than their own labor.21 Because they use nothing from the rest
of the GVC, their Input Index would be low. The Irish electronics industry, on the other hand,
purchases wiring from its suppliers that it uses to make the components that go into its
electronics. It therefore has one link before it in the GVC. Finally, the Indian computer
industry purchases its components from a supplier which itself purchases the wires from a
third firm, i.e. it has two links before it in the GVC.22
Comparable to the Output Index, an industry drawing from a longer GVC would have
a higher Input Index, i.e. the score for India is greater than that of Ireland which is greater
than that of Japan. Further, as detailed in Box 2, the Input Index also accounts for variation in
the amount of purchased intermediates. Thus, the more that a country's industry relies on the
GVC for producing its output, the higher its Input Index. As discussed in Box 2, there is
considerable variation across countries and industries in terms of reliance on GVCs. Focusing
on the latter, electrical equipment and transport equipment are especially reliant on GVCs.
Real estate, as was true in the Output Index, is fairly self-contained.
Together, the Input and Output Indices give us a method of describing how a foreign
affiliate fits in to the GVC and how this may vary across MNE structures. To visualize this,
we locate a part of the multinational (either parent or affiliate) in the GVC Box in Figure 3.
The box is constructed so that the higher a part of the MNE's Output Index (contributions to
the GVC) the closer to the top of the box it is and the higher its Input Index (reliance on the
GVC), the further to the right it is.
In the simplest vertical MNEs, the firm has a two stage GVC in which an affiliate in a
low-skill country imports high-skill inputs from the parent firm, processes them, and then
sells that to final consumers at home. This affiliate would rank low on the Output Index
(since it sells to final consumers) and high on the Input Index (due to its need for inputs from
the parent). In contrast, the parent would rank highly on the Output Index since most of its
sales are inputs to the affiliate and low on the Input Index because it purchases no
intermediates. This would then place the parent part of the firm in the top left corner of the
GVC box and the foreign affiliate in the lower right-hand corner as shown in Figure 3.
21 As such, their value added would equal their sales. 22 Since a country-industry can sell intermediates to itself, so too can it purchase inputs from itself, something relevant in this specific example, since electronics and electronic components are combined into a single industry.

17
This, configuration can be extended to more complicated vertical structures.23 For
example, consider the iPhone, where the design is done in the US, components such as the
screen are made in Japan, and assembly happens in China.24 The US parent would rank
highly on the Output Index since its output (the design) is used exclusively by the other
stages in the iPhone production line. In addition, since the Japanese affiliate sells inputs to
China, this further boosts the parent's Output Index. The Japanese affiliate also exclusively
sells intermediates, however since it is closer to the end of the GVC (only the Chinese
assembly remains), it would have a more moderate Output Index.25 The Chinese affiliate,
meanwhile, is at the end of the chain and would have a low Output Index.
For the Input Index, the reverse ordering holds. The US affiliate is essentially self-
contained and does not use inputs from the GVC. Both the Japanese and Chinese affiliates,
however, are very reliant on the US for the value added (something supported by the fact that
60% of profits are attributable to the US affiliate as discussed more in Table 8 below).
Therefore, both would rank fairly high on the Input Index with the Chinese value somewhat
higher because it has two links in the chain before its stage in the production process. As
Figure 3 illustrates, this would then give a setup in which the beginning and end of the iPhone
GVC would match the simple vertical MNE, with the middle link found in between these.
For a simple horizontal structure, the parent produces the joint input used in
production both locally and in the foreign affiliate, with all of this output going to final
consumers (some at home, others abroad). As with the vertical foreign affiliate, the horizontal
foreign affiliate sells no output as an intermediate and ranks low on the Output Index. Unlike
the vertical parent, the horizontal parent sells both intermediates and final goods. Therefore,
although it has an Output Index higher than its affiliate, it is not as high as the exclusively
intermediate-selling vertical parent.
On the Input Index side, as with the vertical parent, the horizontal parent purchases no
intermediate inputs and has a low score. The foreign horizontal affiliate, meanwhile, does
purchase intermediate inputs (the joint input from the parent). In contrast to the vertical
affiliate in a low-skill developing country however, the horizontal affiliate is located in a
high-skill abundant country and carries out significant skill-intensive production tasks (tasks
which replicate some of those in the parent). Thus, while the horizontal affiliate is reliant on
the inputs provided by the parent, it provides more of the value embodied in the final product
than a low-skill intensive vertical affiliate does. Together, these factors would tend to place
the two parts of the simple horizontal MNE lower left corner of the box when compared to
vertical FDI.
This simple horizontal baseline can also be extended. One way to do so is to assume
that the affiliate sells its output as an intermediate to an unrelated firm rather than a final
consumer (e.g. the MNE's various affiliates produce concrete which is sold to local
construction firms). This added link in the GVC following the affiliate's production stage
would increase the Output Index both for the affiliate and its parent (who is now linked to a
longer GVC). It would still be the case, however, that the parent part of the firm would have
23 In addition to this three stage production process, as with the horizontal model, adding more intermediate inputs to parent or affiliate production can increase the Input Index. 24 For details on iPhone production, see https://www.lifewire.com/where-is-the-iphone-made-1999503. 25 Indeed, this would be true for any affiliate selling intermediates, including the final one in the MNE's production chain.

18
a higher Output Index than the affiliate because of the joint input the parent provides to its
affiliates. In a similar way, one add additional intermediates to the replicated production
stage. This would increase the Input Index for the parent and all of its affiliates as they all
engage in this activity. In contrast, incorporating intermediates into the development of the
joint input (e.g. technical machinery needed for the R&D behind developing the design)
would increase the Input Index for the parent directly and then indirectly for its affiliates as
they are tied to a longer input GVC.
Finally, one can alter the importance of the inputs obtained from the parent. For
example, suppose that knowledge of local consumer desires is a key part to producing in each
country. As the importance of local knowledge rises, the value generated by the affiliate
would grow, lowering its Input Index. For the parent, where the joint input and distribution
are done locally, this shift in value generation from the joint input to distribution would net
out, leading to no change.
Analyzing where parents and affiliates are located in the GVC Box can then give yet
another indication of the structure of MNE activities. When FDI is concentrated in the top-
left (home) and right-hand side (host) of the box, this would generally be more in line with
vertical FDI. When it is in the middle and bottom-right of the box, this would be an
indication of more horizontal investment. In practice, since both horizontal and vertical FDI
exist (and have much more complex possibilities than the stereotypical models), this
distinction will be less clear-cut. However, by turning to the data, and comparing the
placement in developed and developing countries, we are nevertheless able to find some
suggestive patterns.
In Figure 4, we position inbound and outbound US investment for different industries
in the GVC box. To do so, we use the affiliate sales data used above so that the size of a blue
circle corresponds to the relative size of sales by foreign affiliates in the US. Similarly, the
size of the red circles indicate the relative value of sales by US-owned affiliates abroad.26 To
position each of these in the GVC box, we use the industry's Output and Input Indices for the
US since the sales data do not distinguish between the origin of inbound FDI or the
destination of outbound investment (something explored momentarily with alternative data).
As discussed in Box 2, compared to the global average, the average US industry is
both less reliant on GVCs (with a mean across industries of 0.36 relative to the global mean
of 0.42) and contributes less to them (the US industry average is 0.26 whereas the global
average is 0.32). This would place US industries towards the lower-left corner of the GVC
box compared to the global average. Note that this is also the region of the box where
horizontal FDI is most likely to be found. Given the large role that US inbound and outbound
FDI plays in the global FDI picture, , this gives additional support to the conclusion drawn
above that the horizontal FDI plays a considerable role in overall FDI activity.
Turning to the figure itself, we see two things. First, the sizes of the blue inbound and
red outbound circles are largely similar to one another.27 This indicates that for the US, the
major outbound FDI industries are also its major inbound ones. This again suggests
replication, i.e. horizontal FDI, in the data since vertical investment should move primarily in
26 Note that these are all foreign affiliates (some US-owned and some not), not the parent part of the MNE. 27 Note that since the coordinates for both inbound and outbound FDI are those for the US industry, the circles by definition have the same location in the GVC box.

19
one direction or the other, not both. The second feature we see in Figure 4 is that even
accounting for the fact that overall US activity skews towards the lower-left corner, the bulk
of FDI activity (the larger circles) tends towards the middle left of the GVC box. Thus,
compared to the US as a whole, more FDI is found in those industries that require relatively
few inputs from GVCs and yet contribute in a fair way to them. This again fits the horizontal
notion illustrated in Figure 3. That said, there are three notable exceptions to this pattern
illustrated by the three large circles with Input Index measures above 0.5. These are (moving
from left to right) Chemicals and Chemical Products, Food, Beverages and Tobacco, and
Transport Equipment. All of these seem to suggest the potential for relatively more vertical
activity. Although these make up 16.2% of outbound sales and 32.8% of inbound sales, the
overall picture nevertheless suggests that US-involved FDI activity is predominately
horizontal.
The dominance of horizontal FDI in the US, however, does not rule out the existence
of vertical FDI however. Instead, the above discussion indicates that, if vertical FDI is to be
found, it may be necessary to look to relatively less-developed hosts. One limitation of Figure
4 is that it does not use bilateral information, that is, we do not know where investment into
the US originates or where US-owned affiliates are located. As such, we were forced to use
the US values of the two indices for its outbound investment and were unable to contrast the
GVC positioning US outbound FDI to developed versus developing hosts.
As an alternative, we now utilize a different dataset from the BEA that, for a limited
number of countries and industries, does provide such bilateral information. In Figure 5, we
plot the US outbound investment where, unlike the outbound information in Figure 4, we can
use the Input and Output Index values of the host rather than the US. In addition, we
differentiate between two broad groups: developing hosts (Brazil, Mexico, and China) and
developed hosts (Canada, France, Germany, the UK, the Netherlands, Australia, Japan, and
Switzerland).
This latter distinction is important because there are significant differences in the
GVC patterns across these groups as illustrated in the lower part of Table 4. Across these
developed countries, the Input Index has an average of 0.44 while the Output Index has an
average of 0.34. Both of these are lower, but only slightly so, than the average of the three
developing countries. However, when weighting by the relative share of US FDI of an
industry within each group of countries, the differences become more pronounced with the
developing Input Index 56% higher and the Output Index 23% higher than those in the
developed countries. Put simply, the US FDI in developing countries is much more geared
towards industries that are both more reliant upon and that feed more into GVCs.
This can also be seen in Figure 5, where even after accounting for the fact that the
developing countries overall tend towards the right-hand side of the box, their FDI-dominated
industries are those which have higher Input Indices relative to the country-specific average.
If outbound FDI to developing countries is more vertical, this is what one would expect.
Nevertheless, since FDI activity is larger in the developed hosts, this suggests that although
vertical FDI does occur, the bulk of FDI is still found in the lower-left, horizontal region of
the GVC Box.
In Figure 6, we dig deeper by focusing specifically on the US investment in the three
developing countries for which we have data: Brazil, China, and Mexico. While there is again

20
overlap, we see that even within these nations, China is different due to its high Input and
Output values (see Box 2 for more discussion). Thus, even among these emerging nations,
US FDI China appears to be an outlier in that it tends to be in industries that rely heavily on
GVCs.
While to this point we have largely focused on US data for data availability, it is
worthwhile making attempts to broaden the picture, in particular because the US may be a
special case due to its large size and its position as the largest destination for and recipient of
FDI (at least when measured as stocks of FDI; China currently captures the first spot in FDI
inflows with the US coming in second). With this in mind, we now turn from the BEA data to
that made available by the OECD.28 This provides information on total inbound and outbound
FDI stocks in 2011 (i.e. just as in Figure 4, these data lack bilateral information).29 Note that
despite switching the measure of FDI from affiliate sales to FDI stocks, as shown in Figure 7,
the US picture overall looks similar to the 2014 BEA sales data in Figure 4. This reassures us
that the lessons learned for the US from the BEA data likely carry over to the OECD data and
vice versa. The purpose of switching datasets, however, is not to look at the FDI data across
different FDI measures but to look at the experience of other countries.
In Figure 8, as with Figures 6 and 7, we focus on inbound FDI and use the host
country Input and Output Index values. We do so to compare the US to four other major
OECD FDI hosts: the UK, Germany, Canada, and France. Note that, to ease comparison to
the US baseline, we denote the US values by X's rather than circles. This comparison reveals
two features of the data. First, these countries' industries are generally found in the same
lower-left corner of the box as the US industries are. Second, even within a country, more
FDI is found in the lower-left region of the box than in the top right. This suggests that the
strong horizontal flavor of US FDI extends to the rest of the "Big 5".
Figure 9, meanwhile, compares the US baseline to four relatively less developed
OECD host countries (Czech Republic, Korea, Poland, and Spain). As in Figure 5, these
relatively developing hosts are situated further to the right than is the US, that is, industries in
these countries rely more on GVCs than those in the US. Furthermore, even accounting for
this difference, we see that their most important FDI-hosting industries have higher Input
Indices than the country-specific average. Comparable to Figure 6, this suggests that, as the
level of development lags, vertical FDI becomes more important. Combining this with Figure
8 and the fact that the "Big 5" are both the sources of and destinations for a significant share
of global FDI, this GVC Box approach confirms the alternative approaches that suggest that
the dominant structure of FDI activity is horizontal.30
28 These can be found at https://data.oecd.org/fdi/fdi-flows.htm. 29 Note that due to data availability here we use stocks, not sales, and information for 2011 rather than 2014. One issue with using stocks of FDI is that it increases the relative importance of capital intensive industries. Further, when comparing across countries, Davies (2008) finds that vertical hosts of FDI seem to be more capital intensive than horizontal hosts. Finally, note that the industry breakdown is less fine in these data and we therefore have fewer data points per country. 30 Although they do not control for the size of investment, Davies, Desbordes, and Ray (2018) analyze the number of affiliates established during 2003-2010. Using this, the Big 5 countries account 38.3% of outbound cross-border mergers and acquisitions and 32.6% of inbound M&As. In terms of greenfield investment, which is more often found hosted by developing countries, the Big 5 are home for 50.2% of new affiliates and host to 21.1% of them. Thus, both as home and hosts, these five nations make up a substantial portion of FDI activity.

21
5. Evaluating intangible asset and other service flows.
As noted in the introduction, parent firm or headquarters’ supplies of intangible and
other services to affiliates are generally unobserved and unmeasured. Multinational supplies
of management, technology, R&D, intellectual property, marketing and finance to affiliates
are believed to be large and a crucial part of MNE activity. They are not only emphasized in
the international business literature, but they are a cornerstone of theoretical models of
multinational firms as embodied in the idea of the horizontal model's joint input. This makes
the need for data on them all the more crucial.
The role of intangibles, alternatively called knowledge-based assets, in theoretical
models is that they are assumed to possess a "joint" or non-rivaled nature that is not found in
physical capital such as plant, equipment, and property. The idea is that a knowledge-based
asset, a blueprint for example, can be used in multiple locations without reducing its value in
any one location. An alternative but largely equivalent terminology is that intangibles and
specifically knowledge-based assets create firm-level scale economies as opposed to or in
addition to any plant-level economies of scale. These firm-level scale economies give the
multinational a powerful tool and incentive for adding additional plants or offices abroad at
low additional cost, thereby giving the multi-plant multinational a competitive advantage
over local single-plant firms.
The importance of intangible assets to understanding multinationals is acknowledged
but remains a conceptual and theoretical curiosity due to the difficulties in observing and
measuring the existence and contribution of these assets. Generally, their role shows up as
simply the profits earned by foreign affiliates rather than payments to the parent for its
services. Table 5 makes this point by again using the BEA data. Two measures of profits or
income are given in the data and a short description of these are given below the Table.
“Profits” tends to be in line with what economists would call profits, while “Net Income” is
more in line with accounting definitions of profits. For example, profit here includes taxes
paid but excludes capital gains while net income is the other way around.
The second column of Table 5 shows that profits and net income are significant but
not especially large relative to total affiliate sales. Column 3 however shows that profits and
net income are a large share of value added. Unfortunately, we have not been able to find
comparable numbers for the US corporate sectors a whole. One figure we did find was by the
BEA which reports profits as a share of revenues as 3.4 percent in 2018, while some numbers
we found for Federal Reserve data give about 7.0 percent. We also cannot tell if these
numbers are closer to the (economic) definition of profits in Table 5 or to the (accounting)
definition of net income. In addition, these latter figures are for complete corporations, while
Table 5 (and BEA data) gives only that for affiliates. Thus we cannot make a statement to the
effect that foreign affiliates are, as a whole, highly profitable.
Nevertheless we are including the profit and net income as shares of sales and
especially value added for two reasons. First, these high numbers are often quoted by critics
of multinational firms, who claim the firms earn excessive monopoly profits and/or complain
that firms are moving jobs abroad and not repatriating profits. Second, and regardless of
whether these figures are significantly higher than the US corporate averages, we will argue
shortly that they are likely much inflated by failing to take into account the value of
knowledge-based and other intangible assets.

22
One obvious approach to getting a handle on the importance of intangibles is to look
at royalties, fees and R&D figures for affiliates and parents. While we have these for
affiliates from the BEA data, we do not have figures for parents and corporations as a whole,
and thus cannot say will much confidence that multinational corporations are R&D and
intellectual-property intensive relative to the corporate sector as a whole (though all
researchers are confident that this is true). Second, reported royalties and fee for intellectual
property are only a small part of what we call intangible assets and their services.
Management and engineering services, marketing, finance, and brand values may in total
reduce formal licensing fees to a small part of this unmeasured capital.
Rows 5-7 of Table 5 report figures from the BEA data. Royalties received and paid by
affiliates and R&D performed by them are quite small, though not trivial, shares of value
added. A second concern about using reported fees and royalties (and for that matter profits
on an individual country basis) is that they can be subject to income shifting and double
counting. This chapter concentrates on real production and supply decisions and it is beyond
its scope to discuss financial and accounting questions.
That said, we can illustrate the issue in the lower panel of Table 5 which gives
statistics for Irish affiliates of US multinationals. As is widely known, Ireland is a favorite
location for US multinationals to establish subsidiaries to serve the whole EU (recall that
earlier we noted its high levels of third-country sales). While Ireland has many advantages for
US firms include the English language, favorable land prices, modest regulation, and a skilled
labor force, it also has highly advantageous tax policies for US firms. For perspective,
Ireland’s share of the world population is about 0.0006 yet Irish affiliates of US firms account
for about 6 percent of all US foreign affiliates sales, 5 percent of all affiliates’ value added
and R&D, though a modest 1 percent of all affiliates’ employment worldwide.
These numbers are not surprising given Ireland’s status as an export-platform. But
note from Table 5 that Irish affiliates share of all affiliates’ profits worldwide is 11 percent,
double Ireland’s share of sales and value added, suggesting profit shifting to this low tax
jurisdiction. However, the truly impressive numbers in Table 5 are that Irish affiliates receive
a full 50 percent of all fees and royalties received by US foreign affiliates and pay 42 percent
of all fees and royalties paid by US affiliates. Part of this striking number is due to the
industry composition of Irish affiliates, which is heavily weighted toward computer hardware
and software and pharmaceuticals. Still, it is likely a smoking gun for financial and
accounting maneuvers. These issues are beyond the scope of this chapter as just noted.
Nevertheless the data on profits and income are important insofar as they lead into the next
issue, which is the overestimation of affiliate profits rates due to the omission of intangibles
in calculating profits.
A promising new approach is to measure intangibles in GVCs as a residual difference
between values of final goods and payments for all tangibles. This is found in a recent
analysis by Chen, Los and Timmer (2019). As they discuss, the World Input Output Database
(WIOD), as is typical of all input-output tables, lumps many things into one item simply
called payments to “capital”.31 As we understand it, this is in part a residual balancing item
that includes actual payments to capital but also pure profits, possible types of Ricardian
31 These can be downloaded from http://www.wiod.org/home. Note that the WIOD data also form the basis for the data used for our Input and Output Indices.

23
rents, and so forth. What the authors do is to independently (of the input-output capital
number) construct traditional measure of physical and tangible capital such as property, plant
and equipment. They then calculate the different between their measure of tangible capital
and the number given in the WIOD to get a residual value that they label intangible capital.
They are careful to emphasize that this is a residual measure and thus can, of course, include
some income that is not what we would wish to label returns to intangibles. One advantage of
their methodology is that all returns from all countries are included, and thus their measure is
immune to profit shifting and other accounting maneuvers by multinationals.
Results from their working paper are shown in Table 6. They divide world factor
income into payments to labor, tangible capital, and intangible capital. The share they
attribute to intangible capital is very large at 30.7 percent of total factor payments, which is
1.7 times the size of the share of payments to tangible capital. The second row of the upper
panel gives the changes in the three shares over the period 2000-2014. As the authors state,
the fall in labor share has been well documented and is widely known. What has not been
identified however, is that much of the share growth in capital has been in the share of
intangible capital.
The lower panel of Table 6 breaks the share of intangible capital down into stages of
production. The biggest share is found in upstream production stages, which we assume
including many of the headquarter services that we listed earlier, as well as parts and
components which are often more skill intensive than final assembly and distribution. Not
only do these upstream stages account for the largest share of intangible capital income, but
that share has grown significantly over the period 2000-2014 while the shares to both labor
and tangible capital have shrunk. While the data in Table 6 are for all industries in all
countries aggregated and by no means specific to multinational firms, they are suggestive of
the level and the growing importance of intangible capital in the world economy.
We do not know of many attempts to document and measure intangible service flows
within multinational firms and the study noted above estimates the contribution of intangible
capital as a residual value for the world economy as a whole. Nevertheless, their numbers are
large enough that they surely motivate researchers to try to do more specifically for MNEs.
There are a couple of attempts that we know of that make some progress at a restrictive level,
either looking at a particular intangible or at a single firm. Tables 7 and 8 provide results in
this vein.
Table 7 comes from the website of a consulting firm which calculates brand value for
large firms.32 While the data are for 2009, making some rankings out of date, they are
nevertheless useful for generating a feel for the size of asset values involved. The elements
that go into brand value are listed on the right-hand side of Table 7. Although their precise
methodology is somewhat obscure, the size of these numbers are nonetheless impressive.
Coca-Cola tops the list at 69 billion US dollars followed by IBM at 60 billion – in 2009!
While some of these totals are surely just the accumulated effects of many years of
advertising, the list also suggests a lot of reputation capital for product quality, reliability and
sophistication. We do not know what the total stock market value of these companies was at
the time, but these intangible brand values are surely not trivial and have almost assuredly
grown considerably since their publication.
32 These come from https://www.b2binternational.com/publications/value-of-brands/.

24
Table 8 gives data for a specific product, an Apple iPhone 4, taken from Brennan and
Rakhmatullin (2015).33 Some politicians love to hate these numbers, either because they
supposed show excess profits or because US content is supposedly too low. We disagree with
both of these points of view. The first numbers in Table 8 are a cost breakdown of the
physical components in the phone plus assembly costs, the total of which come to $194. Then
distribution and miscellaneous (which includes who knows what) is added to arrive a total
cost of $324. As one can see, the US content measured in this way is rather small, even if
most all of the distribution and miscellaneous costs are US content. The iPhone sells for
$600, leaving a residual “profit” of $270 per phone.
However, if one looks critically at this breakdown, one is struck by all of the things
missing. For example, this does not even include the software in the phone, a significant
omission as Apple is as much a software company as a hardware firm. Further, the iOS
ecosystem (including iTunes) is one of the major attractions of Apple products. On the right-
hand side of Table 8, we have provided a list of just some of the items that are in fact long-
term firm investments that are contributing to this “profit”. Although this is our list, not that
of the author(s) of this study, we emphasize that their decomposition makes no attempt to
value any of the items on the list. If we were to take a contrary point of view and assume that
Apple makes just a “normal” return on investment, then we might argue that the contribution
of intangible assets is as much as 45 percent of the retail price. Further, it seems likely that
most of this value is American content since the parent firm produces intangible services
while foreigners make parts and do assembly.
While there is a need for more work in this area, a new working paper from the World
Bank Group by Ayyagari, Demirguc-Kunt and Maksimovic (ADM) (2019) makes substantial
progress at trying to estimate the value of intangible capital more directly. It does not focus
on multinational firms specifically, but rather uses a sample of large US firms. This working
paper in turn builds on the methodology and empirical results of Peters and Taylor (2017). At
issue is the often-documented high returns on invested capital (RIOC) for the most successful
firms, with a particular run-up starting around 1990.
The authors’ show that these high measured profits are in large part due to the
mismeasurement or rather non-measurement of intangible capital in the denominator of
standard ROIC calculations. To correct this, they calculate intangible capital as the sum of
two measures: knowledge capital and organization capital. Both are done by a methodology
similar to the way that physical capital stocks are calculated by a perpetual inventory method,
by summing up and depreciating past investments in R&D and other measures for knowledge
capital, and a portion of selling, general and administrative expenses as a measure of
organizational capital.
A few of their results are shown in Table 9. The top two rows give the conventional
measure of ROIC and the corrected measure which accounts for intangible capital in the
denominator of the measure (it also affects the numerator but that effect is small). The right-
hand column gives the percentage point difference between the conventional measure and the
corrected measure for the 90th percentile and up of firms. Accounting for intangible capital
lowers the ROIC by 29 percentage points for the top firms.
33 We have seen several analogous case studies and they all seem to come up with roughly similar stories, both for Apple and other products.

25
They then break the industries down into those with high and low levels of routine
manual labor in their workforces (RMAN) and industries with high and low levels of
intangible capital (ICAP). Industries with low labor-force shares of routine labor (and
therefore more cognitive skill requirements) have higher ROIC returns with and without the
correction (Table 9 rows 3-6). Within each group, the correction lowers the measured ROIC
much more in the low RMAN industries: 49 percentage points for the low RMAN industries,
22 percentage points for the high RMAN industries.
Rows 7-10 of Table 9 give similar figures for high and low ICAP industries. The high
ICAP industries (which may overlap a lot with low RMAN industries) have substantially
higher returns than the low ICAP industries. The correction for intangible capital lowers the
ROIC considerably by 41 percentage points for the 90th percentile of firms.
There are two main points to the numbers in Table 9. First, the more successful firms
have high returns on invested capital and the correction for intangible capital lowers those
returns a lot more than for less successful firms. Second, among the most successful firms,
those with a low share of routine manual labor and those with a high share of intangible
capital have their returns lowered a lot more by the intangible correction. All of this points
towards the sizable role of intangibles.
As we have emphasized, the work of Chen, et. al. (2019) and Ayyagari, et. al (2019)
does not distinguish multinational firms from non-multinationals. But a lot of work,
summarized and extended most recently in Bernard, Jensen, Redding and Schott (2018),
consistently and convincingly shows that the most internationally engaged firms are the
highest productivity firms which in turn are the most profitable. A very large share
international trade and production are accounted for by the top decile of firms. While the
current state of knowledge does not allow for a definitive statement, we believe that there is a
substantial overlap between the top decile of firms in Bernard et. al. and the top decide of
firms in Ayyagari et. al. Assuming this is true, then the low RMAN and high ICAP firms in
the latter paper are dominated by multinationals. This in turn suggests that the high returns to
multinational affiliates that we discussed in connection with Tables 5, 8 and 9 may be due to
mismeasurement with a misallocation of the value of US-generated intangibles attributed
instead to affiliate profits.
Assuming that there is a high correlation between mutlinationality and intangible
capital, several important policy conclusions follow. First, overseas affiliates are probably
less profitable than they currently appear. Second, the US content of foreign affiliate
production is likely much higher than has been asserted by some politicians, business
journalists and claimed in case studies such as the iPhone example. Correcting for intangible
capital and its supply from parents to affiliates has the potential to shift the location of
measured activity and profits from the affiliates and host country to the parents and parent
country. That said, this is about re-judging the importance of joint inputs. Even reallocating
the value of production towards the parent firm is unlikely to overturn our understanding that
FDI is a developed country phenomenon and therefore has a strong replicative, horizontal
nature.
6. Conclusions

26
When discussing foreign direct investment, several hot button issues arise, including
impacts on labor markets, spillovers in technologies, and the implications for various types of
competitions for multinationals. To address all of these, however, it is necessary to have an
understanding of the structure of multinational activity. In this chapter, we have provided a
framework based on theory that divides investment structures into those that replicate activity
across borders (the octopus-like horizontal MNE) and those that fragment the production
process and do different stages in different countries (the snake-like vertical MNE). These
two structures and their more recent expansions all suggest patterns in the data that can help
to differentiate between the two. As laid out in table below, the different structures give rise
to very different predictions on where MNEs operate, sell their output, and how they connect
to their supply chains. The first two columns give the predictions of the horizontal model and
the vertical model, while the third column reflects the data themselves.
Horizontal Vertical Data
(Replication) (Different)
Country Pairs
North-North North-South North-North
Sales Regional Global Regional
GVC Self-contained Long Self-contained
Parent Intangibles
Joint Input First Link in GVC Important but need more data
When examining the data, the results point towards a dominant role for horizontal
investment. This arises from both the identities of major parent and host countries (and the
comparison across the two), the location of affiliate sales, and the interaction in FDI across
borders. In addition to these techniques which have been explored in the academic literature,
we introduce a new methodology based on positioning within global value chains. In each
case, although evidence of vertical-style investment can be found, the bulk of the data
suggests the horizontal motive. This indicates that a significant share of MNE activity is
replicative, occurs between wealthy countries, and is in no small part geared towards
servicing local consumers and nearby countries, customers who can both be final ones as well
as other producers. Many of these facts differ from the common public perception of FDI.
Recognizing that MNEs have both internal and external GVCs means that policies
aimed at FDI can affect those to which it is connects, including local firms and those
overseas. Such impacts are far from hypothetical. Starting in 2017, the Committee on Foreign
Investment in the United States (a body with the power to halt investment if it deems it
necessary) significantly increased its examination of inbound investment decisions (in 2018,

27
the number of investments scrutinized was 40% higher than in 2016).34 Among the
investments blocked following an investigation was Singaporean Broadcom's acquisition of
Qualcomm, a US manufacturer of computer chips. This acquisition would have been
horizontal (as Broadcom affiliates produce chips globally, i.e. replication) and have involved
the sale of intermediates to local purchasers (in 2018, Qualcomm sold $603 million of its
output in the US, Wagner (2019)). Thus, if this acquisition would have increased efficiency
and lowered chip costs, blocking the investment may well have had a negative impact on
other US firms.
These effects extend to other countries as well. When Qualcomm chips sold in the US
contribute to the assembly of smartphones in China, blocking Broadcom's investment and
halting of the cost reductions that may have led to can negatively impact Chinese production.
This can happen even when those assembly plants are unrelated to either Broadcom or
Qualcomm. This generates the possibility that FDI policy in a host country spills over to third
nations with consequent political effects. Indeed, since Qualcomm had sales of over $15
billion in China in 2018, one might wonder to what extent the US decision to block the
investment from Singapore had more to do with China than Singapore itself.
The value in understanding this structure of MNE activity extends beyond just coming
to grips with the firm. For example, when we see that a significant share of FDI is replicating
skill-intensive activities across skill-abundant countries, this suggests that offshoring via FDI
may be less about eliminating the low-skill domestic work force and more about gaining
access to new markets. Thus, the notion that outbound FDI ships production jobs overseas
may not be as well-founded as the typical political rhetoric would suggest. In addition, just as
an octopus can survive after losing an arm, a horizontal MNE may be fairly resilient to
localized events that negatively impact one of its subsidiaries.
This is less likely for the vertical MNE since, just as the whole snake will die even if
you cut out a short middle part of its length, losing a key affiliate can have significant
implications across the entire firm. Indeed, Davies and Studnicka (2018) show that changes
in the stock market valuations of British firms following the Brexit referendum appears
linked to their vertical GVCs. An additional example from early 2020 was the impact of the
novel coronavirus. When Apple's iPhone suppliers were shuttered for health concerns, this
sent ripple effects across Apple's whole GVC (Feiner, 2020). Thus, to understand the risks an
MNE is exposed to, it may be critical to have a handle on its overall structure.
As with any conclusions, however, one must be aware of limitations on the data. In
particular, data on FDI are subject to challenges on measuring the importance of intra-firm
intangible assets. Since these assets are hard to quantify and quite mobile for tax and other
purposes, it is important to be cognizant of data limitations when drawing conclusions. New
papers by Chen, Los and Timmer (2019) and Ayyagari, Demirguc-Kunt and Maksimovic
(2019), while not about multinational firms per se, make a very strong case that unmeasured
intangible capital is of major important to firms, particularly large and successful companies.
When unmeasured intangible services are just reported as “profits”, this skews the measured
and reported US content of foreign production downwards. This then potentially throws off
our understanding of multinationals and the resulting public policy debates. More work on
intangibles is therefore most welcome.
34 See Sherman (2018) for discussion.

28
REFERENCES
Antràs, P., Chor, D., 2018. On the Measurement of Upstreamness and Downstreamness in Global Value Chains. NBER Working Paper No. 24185.
Ariu, Andrea (2016), Crisis-Proof Services: Why trade in services did not suffer during the 2008-2009 collapse, Journal of International Economics, Vol 98(1), pp 138-149.
Ayyagari, Meghana, Asli Demirguc-Kunt and Vojislav Maksimovic (2019), “The Rise of Star Firms: Intangible Capital and Competition”, World Bank Group working paper.
Baltagi, B. H., P. Egger and M. Pfaffermayr (2007), ‘Estimating Models of Complex FDI: Are There Third-Country Effects?’, Journal of Econometrics, 140, 1, 260–81.
Barry, Frank (2004). "Export-platform foreign direct investment: the Irish experience," EIB
Papers 6/2004, European Investment Bank, Economics Department.
Bems, R., R C Johnson and K-M Yi (2011), Vertical linkages and the collapse of global trade, American Economic Review 101 (3), 308-12.
Bergstrand, J. H. and P. Egger (2007), ‘A Knowledge-and-physical-capital Model of International Trade Flows, Foreign Direct Investment, and Multinational Enterprises’. Journal of International Economics 73, 2, 278–308.
Bernard, Andrew B., J. Bradford Jensen, Stephen J. Redding and Peter K. Schott (2018),
“Global Firms”, Journal of Economic Literature 56(2), 565-619.
Blonigen, Bruce A., Ronald B. Davies and Keith Head (2003). “Estimating the Knowledge-Capital Model of the Multinational Enterprise: Comment,” American Economic
Review 93(3), 980-994. Blonigen, Bruce A., Ronald B. Davies, Glen R. Waddell and Helen Naughton (2007). “FDI
in Space: Spatial Autoregressive Relationships in Foreign Direct Investment,” European Economic Review, 51(5), pp. 1303-1325.
Brennan, Louis and Ruslan Rakhmatullin (2015). Global Value Chains and Smart
Specialization Strategy, JRC Technical Paper JCR 98014. Bureau of Economic Analysis (2014), www.bea.gov/international/usdia2014r. Carr, David, James R. Markusen and Keith E. Maskus (2001), "Estimating the Knowledge-
Capital Model of the Multinational Enterprise", American Economic Review 91, 693-708.
Chen, Wen, Bart Los and Marcel P. Timmer (2018), “Factor Incomes in the Global Value
Chains: The Role of Intangibles”, NBER working paper 25242. Davies, Ronald B., Julien Martin, Mathieu Parenti, and Farid Toubal. (2018). “Knocking on
Tax Haven’s Door: Multinational Firms and Transfer Pricing,” Review of Economics
and Statistics, 100(1), 120-134.

29
Davies, Ronald B. (2008). “Hunting High and Low for Vertical FDI,” Review of
International Economics, 16(2), pp. 250-267. Davies, Ronald B., Rodolphe Desbordes, and Anna Ray. (2018) “Greenfield vs. Merger and
Acquisition FDI: Same Wine, Different Bottles?” Canadian Journal of Economics, 51(4), 1151-1190.
Davies, Ronald B. and Zuzanna Studnicka (2018) "The Heterogeneous Impact of Brexit:
Early Indications from the FTSE," European Economic Review, 110, 1-17. Ekholm, Karolina., Rikard Forslid and James R. Markusen (2007), ‘Export-Platform Foreign
Direct Investment’, Journal of the European Economic Association, 5, 4, 776–95. Feiner, L. (2020), "iPhone manufacturing in China is in limbo amid coronavirus Outbreak,"
CNBC online, 10 February 2020 accessed at https://www.cnbc.com/2020/02/10/coronavirus-leaves-status-of-apple-manufacturing-in-china-uncertain.html
Garretsen, H. and J. Peeters (2009), ‘FDI and the Relevance of Spatial Linkages: Do Third-
country Effects Matter for Dutch FDI?’, Review of World Economics, 145, 2, 319–38. Helpman, Elhanan. “A Simple Theory of International Trade with Multinational
Corporations.” Journal of Political Economy, June 1984, 94(3), pp. 451–71. Markusen, James R. (1984), “Multinationals, Multi-plant Economies, and the Gains from
Trade.” Journal of International Economics, 16(3/4), pp. 205–26. Markusen, James R. and Keith E. Maskus (2001), “Multinational Firms: Reconciling Theory
and Evidence”, in Magnus Blomstrom and Linda Goldberg (editors), Topics in
Empirical International Economics: A Festschrift in Honor of Robert E. Lipsey, Chicago: University of Chicago Press, 71-98.
Markusen, James R. and Maskus, Keith E (2002). "Discriminating among Alternative
Theories of the Multinational Enterprise" Review of International Economics 10, 694-707.
Markusen, James R. (2002), Multinational Firms and the Theory of International Trade, Cambridge: MIT Press.
OECD (2018) Multinationals in the Global Economy, Policy Note.
Peters, Ryan H. and Lucian A. Taylor (2017), “Intangible Capital and the Investment-q Relationship”, Journal of Financial Economics 123(2), 251-272.
Ramondo, Natalia, Veronica Rappoport, and Kim J. Ruhl (2016), "Intrafirm trade and vertical
fragmentation in U.S. Multinational Corporations," Journal of International
Economics 98, 51-59. Sherman, Natalie (2018) "US Weighs Plans to Curb Chinese Investment," BBC News
Online, 21 May 2018, https://www.bbc.com/news/business-43996015.

30
Thomas R. Tørsløv, Ludvig S. Wier, Gabriel Zucman (2018), " The Missing Profits of Nations," NBER Working Paper No. 24701.
Wagner, I. (2018) "Qualcomm's Revenue in FY 2018," Statistica on 8 November 2018,
accessed at https://www.statista.com/statistics/737844/revenue-of-qualcomm-by-region/.

31
Box 1: The final word on final goods
Despite the importance of defining what is an intermediate and what is a final good, the distinction is blurred to say the least. By definition, a final good is one sold to the ultimate consumer, that is, the person who uses the output without producing anything else that is provided for another's use. While this may seem straightforward, it is not. Some products, such as petrol, can easily be finished good (when sold to a private driver) or an intermediate (when sold to a taxi driver). When one pushes the point, what might seem like a finished good (a steak eaten by a hungry worker) can be thought of as an input (into the production of muscle strength by that worker). All of this is to say nothing of the issue of aggregation where the "automobile" sector includes mini-vans (relatively on the final good end of the spectrum) and tour buses (more on the intermediate end of things). Therefore, when approaching the data, you should take the interpretation of the share of final goods in sales as an overall guide on the relative degree to which final use consumers a product rather than a hard and fast definition.

32
Box 2: Details on the Output and Input Indices
For our Output and Input indices, we utilize the data provided by Antràs and Chor (2018). Although we refer readers to their study (as well as the seminal papers of Fally (2012) and Antràs and Chor (2013)) for details, here we provide a brief overview of the technical construction of the measures and their underlying data.
For both of these the starting point is the 2013 version of the World Input Output Database.35 This lists the sales and purchases for 35 sectors (indexed by s) across 40 countries (indexed by j) as well as the value added of each country-industry.36 For a sector r in country i, denote ��� its gross output, ���the value of gross output sold to final
consumers, and ����� the dollar value of sales sold as an intermediate to sector s in country j.
Thus, ��� = ��� + ∑ ∑ ������� , i.e. the sum of what is sold to final consumers and other
producers. In addition, denote ����� = � ���
��� which is the cost of inputs that sector s in country
j needs from sector r in country i in order to produce one dollar of its own output. This can be used to rewrite output in industry r in country i as:
��� = ��� + � � ����������
+ � � � � �������
����������
+. .. The first term is one stage from the final consumer, the second is two stages away (i.e. ri
sells to another industry who then sells to the final consumer), the third is three stages away, and so forth. Then multiplying each of these terms by the number of stages away from the consumer and normalizing by gross output, we obtain a measure of how much ri contributes to the GVC:
��� = ���
���+ 2 ∑ ∑ ����������
���+ 3 ∑ ∑ ∑ ∑ ������� ����������
���+ ⋯ ≥ 1
In this, firms that sell more as inputs (have higher �����s) which are used in processes
further removed from the final consumers will have a higher value. Our Output Index takes this ��� and normalizes it so that it runs from 0 to 1.
Note that there is considerable variation both across industries within a single country and across countries within a single industry. In Figure 1B, we plot the values of the Output Index for the countries singled out in the text, with the US values in the final group. From this, three things can be seen. First, within a country, there is a range of values for the Output Index (i.e. within a group, there is variation in the vertical dimension). Second, the average value for a given country varies nation to nation (i.e. the within-group center varies horizontally). Globally, the average value is 0.32. For the US, the average is 0.26. China, meanwhile, has an average of 0.49. This means that the average US industry contributes less to GVCs than the average industry globally which itself contributes less than the average Chinese industry. Third, the range of values also varies across countries. Whereas the standard deviation for the US is 0.15, the standard deviation for China is 0.28.
35 This can be found at http://www.wiod.org/home. 36 It does so from 1995-2011, however, we ignore the time dimension and only use the 2011 values.

33
Figure 1B: Output Index Within Countries
This should not be taken to mean that the only variation is across countries. In
Figure 2B, we illustrate the values across countries within a given industry. As one might expect, there are clear differences in the average value of the Output Index across industries. However, this figure also shows that there is considerable variation within an industry but across countries (again, the vertical variation within a group). Thus, although some industries on average contribute more to GVCs than others, the extent to which this occurs depends highly on the country in question. There are two sources of the variation in these two figures. First, there is the share of a country-industry's output sold as an intermediate where higher shares lead to a higher Output Index. Second, there is the matter of who those intermediates are sold to, since selling to another industry that itself sells intermediates links to a longer GVC and generates a higher Output Index. As these two figures show, there is a great deal of heterogeneity in these across industries and countries.
0.2
.4.6
.81
Outp
ut In
de
x
Bra
zil
Can
ad
a
Chin
a
Czech
Rep
.
Germ
any
Fra
nce
Ko
rea
Me
xic
o
Po
land
Sp
ain
UK
US
A
Country

34
Figure 2B: Output Index Within Industries
For the Input Index, define ����� = �� ��
���, which is share of sj's output used as an input
by industry ri.37 With this, gross output can be written as ��� = ���� + ∑ ∑ ������� ���, i.e.
gross output for ri equals its value added and the sum of its expenditures on non-processed factors of production and on intermediate inputs. Expanding this, we see that:
��� = ���� + � � �����������
+ � � � � �������
�����������
+. .. i.e. output is the sum of value added along the different links in the production chain feeding into ri's output. The first term is one step before ri's output, i.e. what it does itself. The second term is the value added coming from the intermediates ri uses, making that value added two steps away from output, the third term is three steps away and so on. Multiplying each stage by the number of links in the chain before it reaches ri's output and dividing by the value of output, we obtain:
�� = ����
���+ 2 ∑ ∑ �����������
���+ 3 ∑ ∑ ∑ ∑ ����� �������������
���+ ⋯ ≥ 1
where again, the greater the importance of inputs (higher �����s) and the more links before
output, the higher this score. To arrive at our Input Index we normalize this value so that it runs from 0 to 1. As with the Output Index, the Input Index varies within a country across industries and within and industry across countries. Figure 3B is the counterpart to Figure 1B excepting that it uses the Input Index. Globally, the average industry has an Input Index of 0.42, with different countries having different within country averages. As with the Output
37 Note that the difference between α and b is that the first is what ri sells to sj as an input while the second is what ri buys from sj as an input.
0.2
.4.6
.81
Outp
ut In
de
x
Ag
ricu
lture
Min
ing
Foo
dT
extile
sL
ea
ther
Woo
dP
ape
r &
Pub
lishin
gR
efin
ed
Pe
tro
leum
Che
mic
als
Rub
be
r a
nd
Pla
stics
Non
-Meta
llic M
ine
ral
Me
tals
Ma
chin
ery
Ele
ctr
ica
l E
qu
ip.
Tra
nspo
rt E
qu
ip.
Ma
nu
factu
rin
gU
tilit
ies
Con
str
uction
Mo
tor
Ve
hic
les
Who
lesale
Tra
de
Reta
il T
rade
Hote
ls &
Re
sta
ura
nts
Inla
nd T
ransp
ort
Wate
r T
ransp
ort
Air
Tra
nspo
rtO
ther
Tra
nsp
ort
Tele
co
mm
un
ica
tion
sF
inan
ce
Rea
l E
sta
teO
ther
Busin
ess
Industry

35
Index, the US is somewhat below this average at 0.26 and China is somewhat higher with an average of 0.63. Further, as shown in Figure 4B, there is again variation both across industries (the average for each of the groupings varies across them) and within an industry but across countries (the vertical variation). As with the Output Index, this variation is generated by the use of intermediates and where those intermediates come from (i.e. the length of the GVC that is tapped into). Figure 3B: Input Index Within Countries
0.2
.4.6
.81
Inp
ut In
dex
Bra
zil
Can
ad
a
Chin
a
Czech
Rep
.
Germ
any
Fra
nce
Ko
rea
Me
xic
o
Po
land
Sp
ain
UK
US
ACountry

36
Figure 4B: Input Index Within Industries
0.2
.4.6
.81
Inp
ut In
dex
Ag
ricu
lture
Min
ing
Foo
dT
extile
sL
ea
ther
Woo
dP
ape
r &
Pub
lishin
gR
efin
ed
Pe
tro
leum
Che
mic
als
Rub
be
r a
nd
Pla
stics
Non
-Meta
llic M
ine
ral
Me
tals
Ma
chin
ery
Ele
ctr
ica
l E
qu
ip.
Tra
nspo
rt E
qu
ip.
Ma
nu
factu
rin
gU
tilit
ies
Con
str
uction
Mo
tor
Ve
hic
les
Who
lesale
Tra
de
Reta
il T
rade
Hote
ls &
Re
sta
ura
nts
Inla
nd T
ransp
ort
Wate
r T
ransp
ort
Air
Tra
nspo
rtO
ther
Tra
nsp
ort
Tele
co
mm
un
ica
tion
sF
inan
ce
Rea
l E
sta
teO
ther
Busin
ess
Industry

37
Figure 1: US FDI Stocks by Country Group
Figure 2: Total FDI Stocks by Country Group
-
500
1 000
1 500
2 000
2 500
3 000
3 500
4 000
2001 2002 2003 2004 2005 2006 2007 2008 2009 2010 2011 2012
US FDI (Billions of Dollars)
Inbound: Developed Inbound: Developing
Outbound: Developed Outbound: Developing
0
5000
10000
15000
20000
25000
FDI Stock By Group
Inbound: Developing Inbound: Developed
Outbound: Developing Outbound: Developed

38
Figure 3: FDI in the GVC Box
Figure 4: Total US FDI in the GVC Box
Notes: Higher Input Index indicates more reliant on GVCs. Higher Output Index indicates
more contribution to GVCs. Size of bubble indicates relative size of industry in affiliate sales.
Figure 5: US Outbound FDI using Host GVC indices
0.2
.4.6
Outp
ut In
de
x
.2 .3 .4 .5 .6 .7Input Index
Outbound Inbound

39
Notes: Higher Input Index indicates more reliant on GVCs. Higher Output Index indicates
more contribution to GVCs. Size of bubble indicates relative size of industry in affiliate sales.
Figure 6: US Outbound FDI to Brazil, Mexico, and China
0.2
.4.6
.81
Outp
ut In
de
x
.2 .4 .6 .8 1Input Index
Developed Developing
0.2
.4.6
.81
Outp
ut In
de
x
0 .2 .4 .6 .8 1Input Index
Brazil Mexico
China
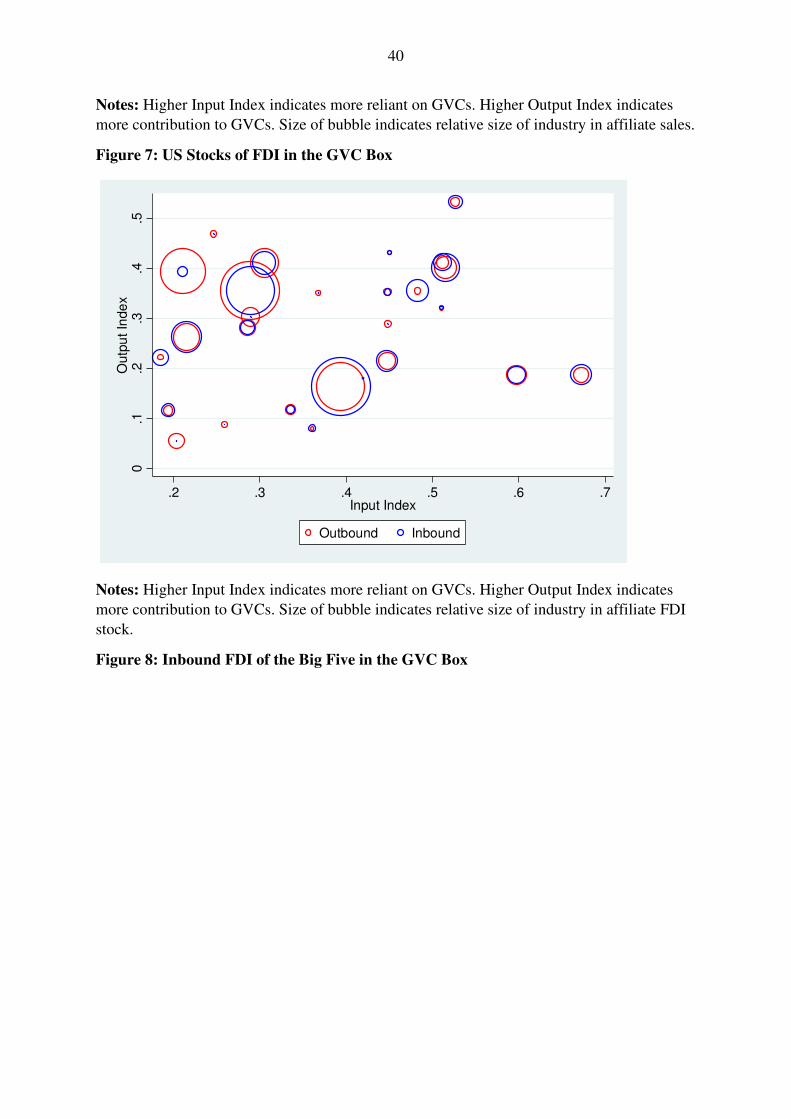
40
Notes: Higher Input Index indicates more reliant on GVCs. Higher Output Index indicates
more contribution to GVCs. Size of bubble indicates relative size of industry in affiliate sales.
Figure 7: US Stocks of FDI in the GVC Box
Notes: Higher Input Index indicates more reliant on GVCs. Higher Output Index indicates
more contribution to GVCs. Size of bubble indicates relative size of industry in affiliate FDI
stock.
Figure 8: Inbound FDI of the Big Five in the GVC Box
0.1
.2.3
.4.5
Outp
ut In
de
x
.2 .3 .4 .5 .6 .7Input Index
Outbound Inbound

41
0.2
.4.6
Outp
ut In
de
x
0 .2 .4 .6 .8Input Index
USA Canada
UK Germany
France

42
Notes: Higher Input Index indicates more reliant on GVCs. Higher Output Index indicates
more contribution to GVCs. Size of bubble indicates relative size of industry in affiliate FDI
stock.
Figure 9: Inbound FDI of Developing OECD in the GVC Box
Notes: Higher Input Index indicates more reliant on GVCs. Higher Output Index indicates
more contribution to GVCs. Size of bubble indicates relative size of industry in affiliate FDI
stock.
0.2
.4.6
.8O
utp
ut In
de
x
.2 .4 .6 .8 1Input Index
USA Poland
Spain Czech Republic
Korea

Tab
le 1
: G
oo
ds
and S
ervic
es S
up
pli
ed b
y F
ore
ign A
ffil
iate
s of
US
MN
Es
Goods
& s
evic
es s
uppli
ed b
y a
ffil
iate
s
Des
tin
atio
n o
f af
fili
ate
sale
s re
lati
ve
to t
ota
l U
S e
xport
s of
goods
& s
ervic
es
[20
14 B
EA
ben
chm
ark s
urv
ey, T
able
II.
E.1
abri
dged
][2
014 B
EA
ben
chm
ark s
urv
ey, B
EA
inte
rnat
ional
tra
de
dat
a]
Shar
e host
countr
y
Shar
e oth
er
fore
ign
Shar
e U
S
as p
roport
ion o
f
tota
l U
S e
xport
s
of
goods
as p
roport
ion o
f
tota
l U
S e
xport
s
of
serv
ices
Sh
are
s0.5
94
0.2
97
0.1
09
Aff
ilia
te s
upp
ly
o
f goods
2.7
61
Go
od
s0.5
62
0.3
31
0.1
07
Aff
ilia
te s
upp
ly
Ser
vic
es0.6
76
0.2
09
0.1
15
o
f se
rvic
es2.3
39
Imp
ort
ance
of
goods
ver
sus
serv
ices
- f
ore
ign a
ffil
iate
s
[20
14 B
EA
ben
chm
ark s
urv
ey, T
able
II.
E, F
, G
ab
ridged
]
Shar
e of
val
ue
added
Shar
e of
emp
loym
ent
Go
od
s**
0.7
23
0.5
16
0.4
06
Ser
vic
es**
0.2
77
0.4
84
0.5
94
** "
goo
ds
" in
cludes
min
ing. "
serv
ices
" in
cludes
som
e th
at a
re a
rguab
ly n
ot
serv
ices
:
agri
cult
ure
, fo
rest
ry, fi
shin
g (
ver
y s
mal
l num
ber
s), co
nst
ruct
ion, uti
liti
es
Shar
e of
sale
s

Tab
le 2
: R
egio
nal
co
nce
ntr
atio
n o
f af
fili
ate
acti
vit
y;
shar
es o
f af
fili
ate
sale
s
[Mil
lio
ns
of
doll
ars,
20
14 B
EA
ben
chm
ark s
urv
ey, T
able
II.
E.1
ab
rid
ged
]
Reg
ion
Shar
e of
tota
l
worl
d a
ffil
iate
sale
s
Of
regio
nal
to
tal,
shar
e to
host
cou
ntr
y
Of
Reg
ional
to
tal,
shar
e to
th
ird
cou
ntr
ies
Of
regio
nal
to
tal,
shar
e to
US
Worl
d1.0
00.5
90
.30
0.1
1
Euro
pe
0.4
70.5
10
.40
0.0
9
Asi
a-P
acif
ic0.2
70.6
30
.28
0.0
9
Can
ada
0.1
10.7
70
.03
0.2
0
Lat
in A
mer
ica,
oth
er W
este
rn H
em.
0.1
20.6
80
.17
0.1
5
Afr
ica
0.0
20.5
70
.28
0.1
4
Mid
dle
Eas
t0.0
10.5
70
.27
0.1
6
Worl
d -
201
40.5
90.3
00.1
1
Worl
d -
200
4
0.6
20.2
70
.11
Worl
d -
199
40.6
70.2
30.1
0
Worl
d -
198
40.6
40.2
40.1
2

Tab
le 3
: S
ales
by A
ffil
iate
s to
Cou
ntr
ies
oth
er t
han
th
e H
ost
Cou
ntr
y
T
hir
d-C
ountr
y s
ales
are
lar
gel
y I
ntr
a-R
egio
nal
or
to o
ther
hig
h-i
nco
me
coun
trie
s
Pro
port
ion
of
tota
l
worl
d t
hir
d-c
ou
ntr
y
sale
s b
y U
S a
ffil
iate
s
Pro
port
ion
of
regio
n's
thir
d-c
oun
try s
ales
th
at
are
intr
a-re
gio
nal
Worl
d1
.00
0.7
5
Euro
pea
n a
ffli
ates
th
ird
-countr
y s
ales
0.6
40
.80
Asi
a-P
acif
ic a
ffli
ates
th
ird
-cou
ntr
y s
ales
*0.2
60
.80
Lat
in A
mer
ica,
Wes
tern
Hem
isp
her
e af
fili
ates
th
ird-c
ou
ntr
y s
ales
0.0
70.4
3
Afr
ican
aff
ilia
tes
thir
d-c
ou
ntr
y s
ales
0.0
20.1
7
Mid
dle
Eas
t af
flia
te t
hir
d c
oun
try s
ales
0.0
10.2
2
Pro
port
ion
of
worl
d t
hir
d-c
oun
try s
ales
th
at a
re i
ntr
a-E
uro
pea
n0
.72
o
r in
tra-
Asi
a-P
acif
ic
* A
sia-
Pac
ific
dat
a co
nsi
sts
of
hig
h a
nd m
idd
le-i
nco
me
cou
ntr
ies
only
, no
ob
serv
atio
ns
for
the
po
ore
st
[Sh
are
val
ues
, 2
01
4 B
EA
ben
chm
ark s
urv
ey, T
able
II.
D.5
ab
ridg
ed]

Tab
le 4
: In
put
and O
utp
ut
Indic
es
Inp
ut
Ind
exO
utp
ut
Ind
ex
Unw
eigh
ted
All
coun
trie
s0
.42
70.3
20
US
A0.3
65
0.2
60
Maj
or
US
Ho
sts
Unw
eigh
ted
Dev
elo
ped
0.4
43
0.3
47
Dev
elo
pin
g0.4
74
0.3
65
% d
iffe
rence
(D
evel
op
ing v
s. D
evel
op
ed)
7.0
%5.2
%
Wei
ghte
d b
y In
du
stry
FD
I Sh
are
Dev
elo
ped
0.4
10
0.3
35
Dev
elo
pin
g0.6
42
0.4
13
% d
iffe
rence
(D
evel
op
ing v
s. D
evel
op
ed)
56.7
%2
3.1
%
Note
s: W
eig
hts
are
th
e sh
are
of
FD
I fo
r th
is c
oun
try-i
ndust
ry w
ithin
the
gro
up
of
cou
ntr
ies.
The
dev
elop
ed a
nd
dev
elo
pin
g c
ou
ntr
y s
ub
sets
are
th
ose
use
d i
n F
igure
5.

Tab
le 5
: F
ore
ign
Aff
liat
es o
f U
S M
NE
s: s
ales
, v
alue
added
, p
rofi
ts a
nd
net
in
com
e
Tota
lA
s a
Shar
eA
s a
Sh
are
mil
lio
n U
S$
of
Tota
l S
ales
of
Val
ue
Add
ed
Sal
es (
1)
6504
90
9
Val
ue
Add
ed (
2)
14
90
153
0.2
29
Pro
fit
(3)
5542
26
0.0
85
0.3
72
Net
Inco
me
(4)
11
66
223
0.1
79
0.7
83
Ro
yal
ties
and f
ees
rece
ived
(5)
67
786
0.0
10
0.0
45
Ro
yal
ties
and f
ees
pai
d (
6)
10
709
60.0
16
0.0
72
R&
D p
erfo
rmed
by a
ffli
ates
(7)
5527
80.0
08
0.0
37
Irel
and -
aff
liat
e ac
tivit
y a
s a
pro
po
rtio
n o
f U
S a
ffil
iate
s w
orl
dw
ide
Ro
yal
ties
and f
ees
rece
ived
(5)
0.5
07
Ro
yal
ties
and f
ees
pai
d (
6)
0.4
15
Aff
ilia
te s
ales
(1
)0.0
57
Val
ue
add
ed (
2)
0.0
53
R&
D p
erfo
rmed
by a
ffli
ates
(7)
0.0
51
Em
plo
ym
ent
(8)
0.0
09
Pro
fit
(3)
0.1
10
[20
14 B
EA
ben
chm
ark s
urv
ey, T
able
II.
D,F
,I a
bri
dg
ed]

Tab
le 5
: F
ootn
ote
s
(1)
Sal
es f
rom
Tab
le I
I.D
.1
(2)
Val
ue
Add
ded
fro
m T
able
II.
F.1
(3)
Pro
fit
fro
m T
able
II.
F.7
Pro
fit-
type
retu
rn i
s an
eco
nom
ic a
ccou
nti
ng m
easu
re o
f p
rofi
ts f
rom
curr
ent
pro
du
ctio
n.
Unli
ke
net
in
com
e, i
t is
gro
ss o
f fo
reig
n i
nco
me
taxes
, ex
clud
es
capit
al g
ains
and
loss
es a
nd
inco
me
from
equ
ity i
nves
tmen
ts,
and
ref
lect
s ce
rtai
n o
ther
adju
stm
ents
nee
ded
to
con
ver
t p
rofi
ts
from
a f
inan
cial
acc
oun
ting
bas
is t
o a
n e
cono
mic
acc
oun
ting
bas
is.
(4)
Net
in
com
e fr
om
Tab
le I
I.D
.1
Net
in
com
e re
ceip
ts i
ncl
ude
not
just
sal
es f
rom
pro
du
ctio
n, b
ut
also
(unli
ke
pro
fits
)
inco
me
from
equit
y i
nves
tmen
ts i
n a
ffli
ates
, fr
om
oth
er e
quit
y i
nves
tmen
ts,
capit
al g
ains
and
loss
es a
nd
oth
er i
nco
me,
and
(un
lik
e p
rofi
ts)
sub
trac
ts f
ore
ign t
axes
pai
d
(5)
Ro
yal
ties
and f
ees
reei
ved
fro
m T
able
II.
I.8
(6)
Ro
yal
ties
and f
ees
pai
d f
rom
Tab
le I
I.I.
8
(7)
R&
D p
erfo
rmed
by a
ffil
iate
s fr
om
Tab
le I
I.I.
1
(8)
Em
plo
ym
ent
from
Tab
le I
I.G
.1

Tab
le 6
: T
he
Ro
le o
f In
tang
ible
s in
Glo
bal
Val
ue
Chai
ns
Ch
en, L
os
and
Tim
mer
, N
BE
R W
P 2
52
42
Shar
es o
f fa
ctor
inco
me
in G
lob
al V
alu
e
Ch
ain
s of
Man
ufa
cture
d G
ood
s 2
01
4
Lab
or
shar
e
Tan
gib
le
capit
al s
har
e
Inta
ngib
le
capit
al s
har
e
Rat
io o
f
inta
ng
ible
to
tang
ible
Fac
tor
shar
es51
.218
.130.7
1.7
P
erce
nta
ge
po
int
chan
ge
20
00-2
01
4-5
.22.3
2.9
Shar
es o
f st
ages
of
pro
duct
ion
in i
nta
ng
ible
capit
al i
nco
me
20
14
Dis
trib
uti
on
stag
e
Fin
al
pro
duct
ion
stag
e
Upst
ream
pro
duct
ion
stag
es
Shar
e of
inta
ng
ible
cap
ital
27.0
26.6
46
.4
P
erce
nta
ge
po
int
chan
ge
20
00-2
01
4-1
.3-4
.25
.5

Tab
le 7
: B
ran
d V
alue
as a
n e
xam
ple
of
inta
ng
ible
ass
ets
Nam
eB
rand V
alu
e ($
bil
lio
n)
20
09 s
urv
ey
Co
ca-C
ola
69
IBM
60
Mic
roso
ft57
Fro
m B
2B
in
tern
atio
nal
:
GE
48
Ass
ess
bra
nd v
alu
e on
a v
arie
ty o
f is
sues
su
ch a
s:
Nok
ia45
stra
tegic
bra
nd
man
agem
ent
McD
onal
d's
32
mar
ket
ing
bu
dg
et a
lloca
tio
n
Goo
gle
32
mar
ket
ing
RO
I
Toyota
31
po
rtfo
lio
man
agem
ent
Inte
l3
1b
rand
exte
nsi
ons
Dis
ney
28
M&
A,
Hew
lett
-Pac
kar
d2
4b
alan
ce s
hee
t re
cognit
ion
Mer
cedes
-Ben
z2
4li
censi
ng,
Gil
lett
e2
3tr
ansf
er p
rici
ng
Cis
co2
2in
ves
tor
rela
tio
ns
BM
W22
Lou
is V
uit
ton
21
Mar
boro
19
Hon
da
18
Sam
sung
18
htt
ps:
//w
ww
.b2b
inte
rnat
ion
al.c
om
/pub
lica
tion
s/val
ue-
of-
bra
nd
s/
App
le15

Tab
le 8
: A
pple
iP
hone
bre
akd
ow
n:
unm
easu
red s
ervic
es a
nd
inta
ng
ible
s,
mis
lab
eled
as
sim
ply
"p
rofi
t"
Physi
cal
com
pon
ents
and a
ssem
bly
Kore
a80.0
5
Ger
man
y1
6.0
8
Fra
nce
3.2
5
Jap
an
0.7
0
Oth
er6
2.7
9
US
A24.6
3S
ervic
es a
nd i
nta
ng
ible
s
Ch
ina
VA
6.5
4
soft
war
e
Fac
tory
gat
e p
rice
19
4.0
4m
anag
emen
t
mar
ket
ing
Dis
trib
uti
on
90.0
0fi
nan
ce
Mis
c45
.95
R&
D a
nd i
nte
llec
tual
pro
per
ty
bra
nd
val
ue
& g
ood
wil
l
To
tal
"co
st"
32
9.9
9co
ntr
acts
and c
ust
om
er l
ists
trai
ned
and a
ssem
ble
d w
ork
forc
es
Ret
ail
pric
e6
00
.00
Ap
ple
"p
rofi
t"270
.01
(4
5%
of
reta
il p
rice
)w
ww
.res
earc
hgat
e.net
/pub
lica
tio
n/3
035
23
378

Tab
le 9
: R
etu
rn o
n I
nv
este
d C
apit
al (
RO
IC),
Co
nv
enti
on
al a
nd
Co
rrec
ted
fo
r
In
tan
gib
le C
apit
al
(R
MA
N -
ro
uti
ne
man
ual
lab
or,
IC
AP
- i
nta
ng
ible
cap
ital
)
fro
m A
yya
gar
i, D
emir
gu
c-K
un
t, a
nd
Mak
sim
ov
ic (
AD
M)
(20
19
)_
Ret
urn
on
in
ves
ted
cap
ital
, 1
99
0-2
01
5
25
th
per
cen
tile
med
ian
75
th
per
cen
tile
90
th
per
cen
tile
90
th p
erce
nti
le:
per
cen
tag
e p
oin
t
dif
fere
nce
:
con
ven
tio
nal
min
us
corr
ecte
d
RO
IC a
s co
nv
enti
onal
ly m
easu
red
9.3
19
.936
.96
9.1
RO
IC c
orr
ecte
d f
or
inta
ng
ible
cap
ital
1.6
11
.923
.34
0.3
-28
.8
RO
IC c
on
ven
tio
nal
lo
w R
MA
N i
nd
ust
ries
9.0
21
.845
.19
8.1
RO
IC c
orr
ecte
d l
ow
RM
AN
in
du
stri
es
1.9
13
.227
.64
8.9
-49
.2
RO
IC c
on
ven
tio
nal
hig
h R
MA
N i
nd
ust
ries
9.5
19
.133
.15
5.7
RO
IC c
orr
ecte
d h
igh
RM
AN
in
du
stri
es
1.5
11
.220
.83
3.9
-21
.8
RO
IC c
on
ven
tio
nal
lo
w I
CA
P i
nd
ust
ries
7.0
14
.825
.64
1.9
RO
IC c
orr
ecte
d l
ow
IC
AP
in
du
stri
es
2.1
11
.120
.63
4.5
-7.4
RO
IC c
on
ven
tio
nal
hig
h I
CA
P i
nd
ust
ries
11
.42
3.8
44
.18
5.7
RO
IC c
orr
ecte
d h
igh
IC
AP
in
du
stri
es
0.9
12
.425
.04
5.3
-40
.5

UCD CENTRE FOR ECONOMIC RESEARCH – RECENT WORKING PAPERS WP19/14 Karl Whelan: 'The Euro at 20: Successes, Problems, Progress and Threats' June 2019 WP19/15 David Madden: 'The Base of Party Political Support in Ireland: An Update' July 2019 WP19/16 Cormac Ó Gráda: 'Fifty Years a-Growing: Economic History and Demography in the ESR' August 2019 WP19/17 David Madden: 'The ESR at 50: A Review Article on Fiscal Policy Papers' August 2019 WP19/18 Jonathan Briody, Orla Doyle and Cecily Kelleher: 'The Effect of the Great Recession on Health: A longitudinal study of Irish Mothers 2001-2011' August 2019 WP19/19 Martina Lawless and Zuzanna Studnicka: 'Old Firms and New Export Flows: Does Experience Increase Survival?' September 2019
WP19/20 Sarah Parlane and Lisa Ryan: 'Optimal Contracts for Renewable Electricity' September 2019 WP19/21 Claes Ek and Margaret Samahita: 'Pessimism and Overcommitment' September 2019 WP19/22 David Madden 'BMI Mobility and Obesity Transitions Among Children in Ireland' September 2019 WP19/23 Martina Lawless and Zuzanna Studnicka: 'Products or Markets: What Type of Experience Matters for Export Survival?' October 2019 WP19/24 Neil Cummins and Cormac Ó Gráda: 'Artisanal Skills, Watchmaking, and the Industrial Revolution: Prescot and Beyond' October 2019 WP19/25 Morgan Kelly, Cormac Ó Gráda and Peter Solar: 'Safety at Sea during the Industrial Revolution' October 2019 WP19/26 Oana Peia and Davide Romelli: 'Did Bank Lending Stifle Innovation in Europe During the Great Recession?' November 2019 WP19/27 Dimitrios Bermperoglou, Yota Deli and Sarantis Kalyvitis: 'Investment Tax Incentives and Their Big Time-to-Build Fiscal Multiplier' November 2019 WP19/28 Judith M Delaney and Paul J Devereux: 'Math Matters! The Importance of Mathematical and Verbal Skills for Degree Performance' November 2019 WP19/29 Alan Fernihough and Cormac Ó Gráda: 'Across the Sea to Ireland: Return Atlantic Migration before the First World War' November 2019 WP19/30 Tamanna Adhikari and Karl Whelan: 'Do Business-Friendly Reforms Boost GDP?' December 2019 WP19/31 Judith M Delaney and Paul J Devereux: 'The Effect of High School Rank in English and Math on College Major Choice' December 2019 WP19/32 Tensay Hadush Meles, Lisa Ryan and Sanghamitra Mukherjee: 'Heterogeneity in Preferences for Renewable Home Heating Systems' December 2019 WP20/01 Cormac Ó Gráda: 'Economic History: ‘An Isthmus Joining Two Great Continents’?' January 2020 WP20/02 Margaret Samahita and Håkan J Holm: 'Mining for Mood Effect in the Field' January 2020 WP20/03 Vincent Hogan and Patrick Massey: 'Professional Rugby on the Celtic Fringe' January 2020 WP20/04 Sanghamitra Chattopadhyay Mukherjee, Séin Healy, Tensay Hadush Meles, Lisa Ryan, Robert Mooney, Lindsay Sharpe and Paul Hayes: 'Renewable Energy Technology Uptake: Public Preferences and Policy Design in Early Adoption' February 2020
UCD Centre for Economic Research Email [email protected]