
UC DAVIS WEST VILLAGE RESCO TECHNICAL INTEGRATION PROJECT€¦ · 15-05-2012 · o Bruce Dickinson,...
101
Energy Research and Development Division FINAL REPORT UC DAVIS WEST VILLAGE RESCO TECHNICAL INTEGRATION PROJECT JUNE 2014 CEC-500-2015-005 Prepared for: California Energy Commission Prepared by: University of California, Davis Environmental Stewardship and Sustainability
Transcript of UC DAVIS WEST VILLAGE RESCO TECHNICAL INTEGRATION PROJECT€¦ · 15-05-2012 · o Bruce Dickinson,...

E n e r g y R e s e a r c h a n d De v e l o p m e n t Di v i s i o n F I N A L R E P O R T
UC DAVIS WEST VILLAGE RESCO TECHNICAL INTEGRATION PROJECT
JUNE 2014 CEC-500 -2015-005
Prepared for: California Energy Commission Prepared by: University of California, Davis Environmental Stewardship and Sustainability

PREPARED BY: Primary Authors: A.Sidney England, Assistant Vice Chancellor, Environmental Stewardship & Sustainability Tobias Barr, Project Manager, Institute of Transportation Studies & UC Davis Energy Institute Anthony Eggert, Executive Director, UC Davis Policy Institute for Energy, Environment and the Economy Benjamin Finkelor, Executive Director, UC Davis Energy Efficiency Center Mary Hayakawa, Executive Director, UC Davis Real Estate Services Benjamin White, Graduate Student Researcher UC Davis Policy Institute for Energy, Environment and the Economy Ruihong Zhang, Professor, UC Davis Department of Biological and Agricultural Engineering University of California Environmental Stewardship & Sustainability One Shields Avenue Davis, CA 95616 Phone: 530-752-4416 | Fax: 530-752-2432 Contract Number: PIR-08-035 Prepared for: California Energy Commission Gail Wiggett Contract Manager
Aleecia Gutierrez Office Manager Energy Systems Research Office
Laurie ten Hope Deputy Director ENERGY RESEARCH AND DEVELOPMENT DIVISION
Robert P. Oglesby Executive Director
DISCLAIMER This report was prepared as the result of work sponsored by the California Energy Commission. It does not necessarily represent the views of the Energy Commission, its employees or the State of California. The Energy Commission, the State of California, its employees, contractors and subcontractors make no warranty, express or implied, and assume no legal liability for the information in this report; nor does any party represent that the uses of this information will not infringe upon privately owned rights. This report has not been approved or disapproved by the California Energy Commission nor has the California Energy Commission passed upon the accuracy or adequacy of the information in this report.

i
ACKNOWLEDGEMENTS
The Zero Net Energy (ZNE) goal for West Village grew out of a collaborative effort between
UC Davis and West Village Community Partnership, LLC; after the neighborhood was already
well along in the design phase. Preliminary evaluation of affordable energy efficiency measures
done in collaboration with the UC Davis Energy Efficiency Center revealed that the ZNE goal
might be within reach. The California Energy Commission Renewable-based Energy Secure
Community (RESCO) grant program funding became available at a critical stage to support the
evaluation and feasibility analyses necessary to develop the technical, financial, policy and legal
understanding necessary to decide how to pursue the goal. The Energy Commission RESCO
grant was foundational to the ZNE effort at West Village.
Successful completion of this grant would not have been possible without support at the Energy
Commission, especially program staff including Pablo Gutierrez, Gail Wiggett and Rizaldo
Aldas. They understood and appreciated that West Village was an implementation project
where results of the ZNE analysis were informing decision making as planning, design and
construction were, and still are underway.
This final report summarizes the results of a broad team that researched and analyzed the many
aspects of the effort. Follow are some of the key leaders in this effort. We are deeply indebted
to all:
• Feasibility Evaluation
o Bill Starr – UC Davis Design and Construction Management
o Kurt Wengler – UC Davis Design and Construction Management
o Nolan Zail – Transform Urban (formerly with West Village Community
Partnership, LLC)
o Bill Dakin and Marc Hoeschele – Davis Energy Group
o Bruce Dickinson, Eleanor Branch, Mike Petouhoff, and Osama Idrees – Chevron
Energy Solutions
• Plug-In Electric Vehicle Integration
o Tobias Barr – UC Davis Energy Institute
o Jamie Davies – UC Davis Plug-in Hybrid & Electric Vehicle Research Center
o Kevin Nesbitt – UC Davis Plug-in Hybrid & Electric Vehicle Research Center
o Gil Tal – UC Davis Plug-in Hybrid & Electric Vehicle Research Center
o Bu Wu – UC Davis Plug-in Hybrid & Electric Vehicle Research Center
• Renewable Energy Anaerobic Digester Feasibility
o Michele Wong and Josh Rapport – CleanWorld

ii
• Technology Transfer
o Sumiko Hong – UC Davis Energy Efficiency Center
o Bob Segar – UC Davis Campus Planning and Community Resources
o Javier DeLeon – UC Davis Plug-in Hybrid & Electric Vehicle Center
o Bill Dakin, Alea German and David Springer – Davis Energy Group
o Mary Miller – Exploratorium

iii
PREFACE
The California Energy Commission Energy Research and Development Division supports
public interest energy research and development that will help improve the quality of life in
California by bringing environmentally safe, affordable, and reliable energy services and
products to the marketplace.
The Energy Research and Development Division conducts public interest research,
development, and demonstration (RD&D) projects to benefit California.
The Energy Research and Development Division strives to conduct the most promising public
interest energy research by partnering with RD&D entities, including individuals, businesses,
utilities, and public or private research institutions.
Energy Research and Development Division funding efforts are focused on the following
RD&D program areas:
Buildings End-Use Energy Efficiency
Energy Innovations Small Grants
Energy-Related Environmental Research
Energy Systems Integration
Environmentally Preferred Advanced Generation
Industrial/Agricultural/Water End-Use Energy Efficiency
Renewable Energy Technologies
Transportation
UC Davis West Village RESCO Technical Integration Project is the final report for the UC Davis
West Village RESCO Technical Integration project (Grant Award Number PIR-08-035)
conducted by the University of California, Davis. The information from this project contributes
to Energy Research and Development Division’s Renewable Energy Technologies Program.
For more information about the Energy Research and Development Division, please visit the
Energy Commission’s website at www.energy.ca.gov/research/ or contact the Energy
Commission at 916-327-1551.

iv
ABSTRACT
The University of California, Davis, is striving to develop a Zero Net Energy (ZNE) community
at West Village, an on-campus neighborhood for university students, faculty and staff. ZNE is
defined as zero net energy from the grid measured on an annual basis. Including deep energy
efficiency measures in all facilities is fundamental to meet demand with on-site renewables.
Several alternative approaches to meeting the remaining demand with renewable energy were
also evaluated. West Village Community Partnership, LLC, the private developer for West
Village, ultimately chose to supply renewable energy using photovoltaic panels developed
through the California Solar Initiative’s New Solar Home Partnership program. Financial,
regulatory, technical and policy evaluation of various approaches to ZNE solutions was
conducted and recommendations were made to facilitate achieving ZNE goals at other
communities in the future. The feasibility of developing a biodigester to produce electricity
from biogas also was evaluated. This generation source was not included in the West Village
development for financial and technical reasons; however, it was constructed elsewhere on the
campus. During the course of planning for West Village, the potential for Plug-in Electric and
Plug-in Hybrid Electric Vehicles to significantly increased grid-based energy was characterized
and strategies developed for providing local renewable energy.
Keywords: Anaerobic Digester, Biodigester, Energy Conservation, Energy Efficiency, Onsite
Generation, Plug-in Electric Vehicle, Plug-in Hybrid Vehicle, Renewable Energy, RESCO,
Technology Transfer, UC Davis, West Village, Zero Net Energy
.
Please use the following citation for this report:
England, A. Sidney, Tobias Barr, Anthony Eggert, Benjamin Finkelor, Mary Hayakawa,
Benjamin White and Ruihong Zhang. June 2014. UC Davis West Village RESCO Technical
Integration Project: Final Report. California Energy Commission. Publication number: CEC-
500-2015-005.

v
TABLE OF CONTENTS
Acknowledgements ................................................................................................................................... i
PREFACE .................................................................................................................................................. iii
ABSTRACT .............................................................................................................................................. iv
TABLE OF CONTENTS ........................................................................................................................... v
EXECUTIVE SUMMARY ........................................................................................................................ 1
CHAPTER 1: UC Davis West Village and the Zero Net Energy Goals .......................................... 7
1.1 UC Davis West Village .............................................................................................................. 7
1.1.1 West Village Goals ............................................................................................................. 8
1.1.2 Development and Construction Status ........................................................................... 9
1.2 The UC Davis West Village Energy Initiative ...................................................................... 10
1.2.1 Goals and Objectives ....................................................................................................... 10
1.2.2 The California Energy Commission Renewable-Based Energy Secure Community
Program 11
1.2.3 Evolution of the WVEI .................................................................................................... 12
CHAPTER 2: SmartGrid Integration Final Engineering and Design .......................................... 15
2.1: Goals of the Task .......................................................................................................................... 15
2.2: Consumption ................................................................................................................................ 15
2.2.1 Load Estimation ............................................................................................................... 15
2.2.2 Energy Efficiency ............................................................................................................. 16
2.2.3 Energy Budget .................................................................................................................. 22
2.3: Onsite Generation and Distribution .......................................................................................... 23
2.3.1 Community Energy Park ................................................................................................ 23
2.3.2 Single Family – Community PV Array with PPA Provider ....................................... 26
2.3.3 Single Family – Rooftop PV Array with Smaller Community PV Array ................. 26
2.3.4 Multi-Family/Mixed-Use – One Loop ........................................................................... 26
2.3.5 Multi-Family/Mixed-Use – Multiple Loop ................................................................... 27
2.4: Designing and Integrating PEVs into ZNE communities ...................................................... 28

vi
2.4.1 Estimating Vehicle Charging Loads by Evaluating Travel Distances ...................... 28
2.4.2 Mitigating Vehicle Charging Loads with Solar ........................................................... 30
2.4.3 How Much Extra PV Solar should be Installed to Achieve ZNE for a Community? .
............................................................................................................................................. 31
2.4.4 Dealing with Uncertainty: Making Solar PV Systems Easily Expandable .............. 32
2.4.5 Integration of SmartGrid Vehicle Charging Systems .................................................. 33
2.4.6 Benefits of Controlled Vehicle Charging ...................................................................... 34
2.4.7 SmartGrid Electric Vehicle Charging Conclusions ..................................................... 35
2.4.7 Lessons Learned: Project Benefits and Conclusions................................................... 35
CHAPTER 3: Site Specific Technology Optimization – Renewable Energy Anaerobic
Digester Feasibility ................................................................................................................................. 38
3.1. Goals of the Task ...................................................................................................................... 38
3.2. Quantification and Characterization of Organic Wastes at UC Davis ............................. 38
3.2.1. Inventory of Organic Residuals ..................................................................................... 38
3.2.2. Sampling and Analysis of Organic Waste .................................................................... 39
3.2.3. Biogas Yield and Production Rate ................................................................................. 41
3.3. Anaerobic Digester Design and Operation Optimization .................................................. 42
3.3.1. Pilot Testing ...................................................................................................................... 42
3.3.2. Effluent Treatment ........................................................................................................... 45
3.4. Project Planning and Engineering ......................................................................................... 49
3.4.1. Site Evaluation .................................................................................................................. 49
3.4.2. Engineering and Economic Design Considerations .................................................... 50
3.5. Analysis of Biomethane and Biofuels Production ............................................................... 50
CHAPTER 4: Technology Transfer and Wide Scale Implementation Plan ................................ 54
4.1 Technology Transfer and Wide Scale Implementation Plan .............................................. 54
4.1.1 The Current Landscape of ZNE and Understanding the Obstacles to Wide Scale
Implementation ................................................................................................................................ 54
4.1.2 Challenges for Developers and Builders ...................................................................... 55
4.1.3 Challenges for Residents ................................................................................................. 61

vii
4.2 Recommendations for Advancing Successful Adoption of ZNE Communities ............. 63
4.2.1 Lessons Learned ............................................................................................................... 63
4.2.2 Key barriers to Success and Policy Recommendations ............................................... 68
4.3 Importance of Modeling Tools and Resources for Stakeholders....................................... 71
4.3.1 Technology Transfer Plan ............................................................................................... 74
4.4 Education and Technology Transfer Strategies for West Village ...................................... 74
4.4.1 Key Strategies ................................................................................................................... 75
4.4.2 Education and Outreach Tools ....................................................................................... 77
4.4.3 Elements of the Energy Collaboration Laboratory ...................................................... 78
4.4.4 Zero Net Energy Data Visualizations ............................................................................ 82
GLOSSARY .............................................................................................................................................. 89
REFERENCES .......................................................................................................................................... 90
LIST OF FIGURES
Figure 1: Location of UC Davis West Village ........................................................................................ 7
Figure 2: Site Plan for UC Davis West Village Phase 1 ......................................................................... 9
Figure 3: Aerial photograph of UC Davis West Village, September 2013 ...................................... 10
Figure 4: "Islanded" Zero Net Energy Concept for UC Davis West Village ................................... 13
Figure 5: "3-Loop" Zero Net Energy Concept for UC Davis West Village ...................................... 14
Figure 6: West Village – Energy Resources Mix for Zero Net Energy ............................................. 25
Figure 7: Commuter Car Total Daily Miles .......................................................................................... 29
Figure 8: Waste Characterization for UC Davis 2012 ......................................................................... 38
Figure 9: UC Davis pilot biogas energy facility. ................................................................................. 43
Figure 10: Quantities of dairy manure and food waste fed into the pilot digester. ...................... 43
Figure 11: Biogas production from pilot digester fed with dairy manure and food waste .......... 44
Figure 12: pH of pilot digester effluent ................................................................................................ 45
Figure 13: Ammonia concentration of pilot digester effluent ........................................................... 46
Figure 14: Integrated treatment system for recovery of nutrients and water from digester
effluent ....................................................................................................................................................... 47
Figure 15: UC Davis READ digesters, biogas cleaning, and energy generation equipment ........ 53

viii
Figure 16: Overview of Observatory Gallery ....................................................................................... 78
Figure 17: Exploratorium interactive Wall .......................................................................................... 79
Figure 18: Reception in Exploratorium Observatory .......................................................................... 80
Figure 19: Invisible Light interactive Exploratorium exhibit ............................................................. 81
Figure 20: Heat Camera interactive Exploratorium exhibit ............................................................... 81
Figure 21: Energy dashboard display: PVC production and consumption ..................................... 82
Figure 22: PVC Solar array at Exploratorium ...................................................................................... 83
Figure 23: Time series energy production vs consumption ZNE goals ........................................... 83
Figure 24: Residential Energy Usage Application ............................................................................... 84
Figure 25: Exploratorium “Ice Stories” Website design example .................................................... 86
LIST OF TABLES
Table 1: West Village Program Goals ..................................................................................................... 8
Table 2: West Village Project Building Types ..................................................................................... 16
Table 3: Base Case Assumptions for Single and Multi-Family Building Types (2008 Title 24) ... 17
Table 4: Multifamily Building Description - Summary of Final Package ....................................... 19
Table 5: Projected Multi-Family Annual Building Energy Use (no solar thermal)........................ 20
Table 6: Single Family Building Description - Summary of Final Package .................................... 21
Table 7: PG&E Electric Rates applicable to West Village .................................................................. 22
Table 8: BAU West Village Annual Energy Consumption and Budget .......................................... 22
Table 9: Proposed ECM Annual Energy Consumption and Budget ............................................... 23
Table 10: Estimated home charging energy consumption per vehicle per week day ................... 30
Table 11: Summary of ideal solar PV orientation and for West Village Single Family Homes ... 30
Table 12: Impact of Solar PV orientation at West Village on total production ............................... 31
Table 13: Estimates for Solar PV system size to meet ZNE under a variety of scenarios ............. 31
Table 14: UC Davis organic waste considered potentially suitable feedstock for READ facility 39
Table 15: Organic waste streams tested and their sources ................................................................ 40
Table 16: Biogas and methane yields and final characteristics of the organic wastes tested in
round 1 after 18 days of thermophilic digestion at F/M of 1.0 .......................................................... 41

ix
Table 17: Biogas and methane yields and final characteristics of the organic wastes tested in
round 2 after 35 days of digestion. ........................................................................................................ 42
Table 18: Nutrient Analysis for Permeate and Retentate Samples (Wet basis) .............................. 47
Table 19: Aeration treatment results for anaerobic digester effluent .............................................. 48
Table 20: Specifications of RO membranes .......................................................................................... 48
Table 21: Performance of RO membranes for separation of ammonium and nitrate .................. 49
Table 22: Recovery of nutrients after RO treatment ........................................................................... 49
Table 23: Summary of Biogas Recovery Alternatives ........................................................................ 52
Table 24: Capital and Operating Costs for UC Davis Biodigester ................................................... 53
Table 25: Identified West Village Outreach Leadership Team ......................................................... 76

1
EXECUTIVE SUMMARY
Introduction
In 2003, the University of California adopted a plan to create a new neighborhood for students,
faculty and staff. Today, this community is known as UC Davis West Village (West Village).
When completed, it will cover approximately 205 acres and will be the home for approximately
3,000 students and 475 staff and faculty families with a total population of approximately 5,000.
The community also will host the first community college on a University of California campus
and will have approximately 42,500 square feet of retail/office space.
Through a collaborative design process with West Village Community Partnership, LLC, and
UC Davis expanded its core principle to make UC Davis West Village environmentally
responsive and launched the West Village Energy Initiative. Working together, UC Davis and
West Village Community Partnership first looked for ways to make West Village as energy
efficient as possible. In 2007, the UC Davis Energy Efficiency Center and the Davis Energy
Group identified deep energy efficiency measures that could be included in the design of the
student housing and single family residences. The results demonstrated that by adopting
extensive energy efficiency measures, West Village Community Partnership could reduce
energy consumption in West Village by nearly 50 percent beyond the California Energy
Efficiency Building Code.
With this result, West Village Community Partnership and UC Davis realized that a larger goal
was within reach – the goal of making West Village a Zero Net Energy (ZNE) community. In
2008, West Village Community Partnership engaged Chevron Energy Solutions to evaluate the
conceptual financial feasibility of achieving a ZNE or “zero net electricity from the grid
measured on an annual basis” goal.
In 2009, West Village Community Partnership and UC Davis decided to strive for this goal.
Because West Village had to be accessible for UC Davis faculty, students and staff, the ZNE goal
had to be balanced against affordability. The West Village Energy Initiative was created and the
following principles adopted:
• West Village would strive to use ZNE from the grid measured on an annual basis.
• ZNE must be achieved at no additional cost to the developer.
• ZNE must be achieved at no additional cost to the consumer.
• West Village would adopt deep energy efficiency measures to reduce energy demand.
• ZNE would be achieved through multiple renewable resources developed on-site at a
community scale.
• West Village would be used as a living laboratory for further energy-related topics.
Project Purpose
UC Davis was awarded a California Energy Commission Renewable-Based Energy Secure
Community (RESCO) grant in February 2010 and work on the ZNE project began immediately.

2
The overall goal of the UC Davis RESCO grant agreement was to resolve the remaining barriers
to make the West Village one of the world’s leading sustainable communities.
The Energy Commission RESCO grant was foundational to develop strategies for the ZNE goal.
It provided a significant portion of the funds required to pursue the ZNE concept that was in
the implementation stages, not in preliminary design. The topics evaluated with Energy
Commission RESCO funding include:
• Evaluate deep energy conservation measures;
• Determine the energy requirements of the community;
• Understand the likely increasing demand for plug-in vehicles;
• Evaluate renewable energy options;
• Evaluate multiple physical design models;
• Select the current approach to ZNE;
• Understand the financial and regulatory incentives and barriers to the ZNE goal; and
• Recommend methods for advancing ZNE to other communities.
Project Results
Evolution of the ZNE Concept
The overall approach to ZNE at West Village included evaluating several design concepts and
all were predicated on adopting deep energy conservation measures:
• An “islanded” community with on-site renewable energy through community solar
arrays and a community energy park that included a biodigester linked to a fuel cell and
advanced storage battery system.
• A “three-loop model” distributing solar and fuel cell renewable energy in three one-
megawatt distribution loops to the multifamily and mixed use portion of West Village
and a solar power purchase agreement for single family homes.
• An “all photovoltaic” renewable energy model for the multifamily housing under the
California Solar Initiatives New Solar Home Partnership.
The “all photovoltaic” concept was chosen and implemented for multifamily housing at West
Village. Further analyses concluded that the “three-loop” and “all photovoltaic” models were
not feasible for various combinations of these reasons:
• Regulatory issues for an “islanded” community;
• Cost of the fuel cell and battery;
• Low tariffs available for biogas electricity;
• Lack of incentives for non-solar renewable energy;

3
• Higher costs to construct three 1-megawatt loops to take advantage of California Solar
Initiative incentives;
• Lack of reimbursement by the Investor-Owned Utility for behind the meter
infrastructure;
• Regulatory issues for community-scale solar; and
• Financial issues associated with the timing of housing construction and phasing of
renewable energy resources.
Feasibility analysis and preliminary planning for the biodigester resulted in a shifted focus for
that element of the ZNE concept. Building on a previous Energy Commission RESCO grant
analyses, UC Davis was awarded a U.S. Department of Energy Community Renewable Energy
Grant and an Energy Commission American Recovery and Reinvestment Act matching grant
for design and construction of a biodigester. As a result, a 50-ton per day facility was built in
collaboration with CleanWorld and opened April 2014. The site for the biodigester is the
existing campus landfill located approximately 1.5 miles southwest of West Village. The
electricity from the facility will be connected to the campus electrical grid. While this source of
electricity will not directly feed West Village, which is tied to the Pacific Gas & Electric grid, a
portion of the renewable energy could be credited to West Village to meet the ZNE goal.
Designing and Integrating PEVs into ZNE Communities
The potential for Plug-in Hybrid and Electric Vehicles to significantly increase electricity
demand has grown substantially in recent years. Under the RESCO project the team was able to
expand their evaluation to include integrating smart grid electric vehicle charging stations and
also provide a case study on planning and installing Electric Vehicle Supply Equipment (EVSE)
and mitigating electric vehicle charging loads with solar PV. The project resulted in these results
and recommendations:
• Similar to traffic impact analysis for new real estate developments, developers and
planners should also consider evaluating travel to understand the potential energy
impacts to the community from future electric vehicle charging loads. Such an analysis
would inform electrical infrastructure investment, including appropriate sizing of
renewable energy generation systems in ZNE communities.
• ZNE communities should embrace and engage electric vehicle infrastructure in early
planning and construction stages. These communities cannot be viewed as sustainable
without addressing electric vehicle infrastructure. Installing conduit dedicated to vehicle
charging in parking areas during construction is a strong recommendation. Given the
current and project growth of the electric vehicle market, developers and planners
should plan aggressively for electric vehicle charging infrastructure.
• For the modeled energy consumption from electric vehicle use at the single family
homes in West Village, the project team found great variability ranging from 3.0 kWh to
27.5 kWh’s per day. Given this variability, it is not reasonable to expect that the onsite
solar PV at West Village can accommodate 100 percent of these loads. Rather, West

4
Village and other real estate development projects should consider providing a
minimum amount of extra PV resources or build the homes PV system to be easily
expandable, making the home Solar Plug-in Electric Vehicle Ready.
• Smart controls are readily available for many electric vehicle charging stations. These
controls can be valuable, particularly to the efficiency of the grid. Those installing or
considering installing Level II or higher power electric vehicle chargers in public and
workplace applications should strongly consider choosing a charger that has control
capabilities. This will allow these charging stations to participate in controlled electric
vehicle charging programs such as Demand Response in the future.
Lessons Learned for Future ZNE Communities
West Village provided several key lessons that will be useful to policy-makers and developers
interested in pursuing similar projects. These are discussed in greater detail in section 4.2 and
are summarized here:
• Creating a ZNE community is feasible under market-rate conditions;
• Given the myriad of challenges any project of this type is sure to encounter, early team
alignment on goals is critical for success;
• A rigorous and active approach to energy and financial modeling is critical to be
responsive to changing conditions;
• Engage local utility early and often on issues related to project design and operation;
• Building user behavior can have significant and unpredictable impacts on energy use;
and
• Opportunities exist to improve the regulatory landscape for future ZNE developers
including providing greater certainty on incentive programs and providing flexibility
for project owner/operators to provide signals to residents to encourage efficiency.
The uniqueness of West Village has resulted in international media coverage of the project and
the project becoming an invaluable case study for achieving market-rate ZNE performance on
large construction projects. West Village’s distinctiveness comes, in part, from how the design
integrates cost-effective energy efficiency and renewable generation measures rather than
relying on using a single technology or approach to construction. The lessons learned at West
Village can be applied to a wide range of future projects.
Recommend methods for advancing ZNE to other communities
UC Davis led the ZNE Technology Transfer Plan (ZNETTP) efforts. The ZNETTP is designed as
a platform for sharing best practices and on-going key learning, not just from West Village, but
also other signature large-scale ZNE projects. The plan describes the target audiences, the
outreach leadership team, the list of outreach activities, the estimated costs for those activities,
and the fundraising strategy for funding the plan.
UC Davis partnered with the Exploratorium to develop specifications for education and

5
outreach tools that can be used to reach general audiences. The tools are specific to West
Village, through an Energy Collaboration Laboratory and outdoor energy exhibits, but can be
extended through media and partner institutions (including the Exploratorium).
UC Davis also worked with Davis Energy Group to create an on-line ZNE Community
Assessment Feasibility Tool to provide a starting point for public and private sector
stakeholders as they consider ZNE feasibility for community-scale projects they are working to
develop.
Project Benefits
The Energy Commission RESCO grant allowed the UC Davis team to evaluate policy,
regulatory, and technological issues associated with ZNE construction in a large real-world
project. These evaluation results are consolidated and available to disseminate to, and use by,
parties interested in ZNE construction. Prior to the West Village project, an information source
of this type did not exist for teams considering ZNE construction.
As the largest planned ZNE community in North America, the benefits associated with
disseminating the lessons learned on West Village are unique to the project and could not have
been realized any other way than by the team responsible for the project’s implementation.
These benefits include the ability for interested parties to gain real-world information about:
• Designing and developing a large-scale, market-rate, mixed-use project built to meet
California’s goals for ZNE residential construction;
• Creating a living laboratory where the effectiveness of various cost-effective ZNE large
scale implementation strategies can be evaluated on an ongoing basis;
• Creating and implementing a design methodology that evaluates optimal tradeoff points
between completing energy efficiency measures and renewable generation technologies;
• Regulatory issues that may act as barriers to increasing ZNE buildings in California, and
suggestions for how regulations may be improved.
• Specific design and construction strategies that may be used across building types to aid
building energy efficiency;
• Energy efficiency or renewable generation strategies not supported by current policy,
regulation, or technological development.
Availability of this information will aid policy-makers, developers, and building designers by
providing a distillation of the lessons learned during the 13-year timeframe of the West Village
project. This will assist the building design and construction community in reducing the costs of
ZNE construction, and will assist the state in developing future policies that encourage
widespread ZNE deployment.
In addition to providing a case study on integrating electric vehicle charging into West Village,
the project team’s report is intended to assist real estate developers and community planners in
6
preparing for electric vehicles in future zero-net-energy communities. The project team
anticipates these findings will help future communities plan for and mitigate electric vehicle
charging loads with local renewable energy resources. The findings on energy consumption,
mitigation, planning and controlling vehicle charging also benefit California rate payers. By
providing best practices for integrating electric vehicles into zero-net-energy communities and
understanding the benefits of electric vehicle charging controls, communities can optimize
integrating zero-emissions electric vehicles and renewable energy resource into future
California zero-net-energy communities.
As California strives to achieve its strategic goals around ZNE, the ZNETTP that UC Davis and
the Exploratorium created presents a blueprint for how the state might invest in building a ZNE
outreach initiative. Such an initiative would increase the market facilitation ofZNE by positively
influencing the targeted specific audiences of policymakers considering regulatory and
legislative changes that impact ZNE and key public sector and private sector stakeholders
involved in community scale development projects that can incorporate ZNE. The initiative
would also influence the public, increasing the market demand for ZNE (retrofit and new home
construction applications). Even if the state does not completely fund implementing the plan,
having the ZNETTP in place allows potential funding by other entities and its ultimate
implementation, which will benefit California going forward.
While the on-line ZNE Community Assessment Feasibility Tool will provide direct initial
benefit to users who are considering ZNE (and technological approaches and best practices) for
their community projects, it is also an investment. The tool, with additional funding support by
the state and/or other entities, can continue to be refined over time to benefit its variety of
stakeholders.

7
CHAPTER 1: UC Davis West Village and the Zero Net Energy Goals
1.1 UC Davis West Village
In 2003, the University of California, Davis (UC Davis) Long Range Development Plan and the
accompanying master plan to create a new neighborhood for students, faculty and staff were
adopted by The Regents of the University of California. Today, this community is known as UC
Davis West Village (West Village) and is located on the UC Davis campus between Russell
Boulevard and Hutchison Drive, just west of State Route 113 (Figure 1). When completed, West
Village will cover approximately 205 acres and will be the home for approximately
3,000 students and 475 staff and faculty families with a total population of approximately
5,000 (Table 1). The community also will host the first community college on a University of
California campus and at build out will have approximately 42,500 square feet of retail/office
space.
West Village is being developed in two phases (Table 1). The site plan for Phase 1 (Figure 2) has
a village square at the center surrounded by mixed-use buildings with retail/office space on the
ground floor and apartments above. The Sacramento City College Davis Center is located on
the southwest corner of the square. Student apartments are located along across the southern
half of the site with single family homes along the northern half. In addition, the site includes
generous open space as part of the overall design.
Phase 1 of the community is being developed through a public-private partnership between
UC Davis and West Village Community Partnership, LLC, (WVCP) a joint venture of Carmel
Partners from San Francisco and Urban Villages from Denver.
Figure 1: Location of UC Davis West Village

8
Table 1: West Village Program Goals
Program Phase 1 Phase 2 Total
Size 130 acres 75 acres 205 acres
Faculty/Staff Housing 343 units 132 units 475 units
Student Housing Beds 1,980 beds 1,158 beds 3,000 beds
Retail/Office Space ≤ 42,500 sf -- ≤ 42,500 sf
Community College 60,000 sf -- 60,000 sf
1.1.1 West Village Goals
The West Village creates a neighborhood that will ensure that many students, faculty and staff
who wish to live in the community where they study and work will be able to do so. The
neighborhood will help maintain a “college town” atmosphere for the community and will be a
vibrant addition to the university and Davis communities. The goals for the design and
implementation of the community are:
• Quality of Place – to create a great community and desirable place to live that will help
UC Davis recruit the best and brightest students, faculty and staff, to let them live within
walking or cycling distance of the campus, and to participate fully in campus life.
• Affordability – to enable faculty and staff to purchase new homes locally at below market
prices and to expand the choices for students to live near campus.
• Environmental Responsiveness – to develop the site and buildings according to sound
environmental principles so as to reduce reliance on cars, limit energy consumption, enable
renewable energy production, and contribute to a healthy environment.

9
Figure 2: Site Plan for UC Davis West Village Phase 1
1.1.2 Development and Construction Status
Construction of the first West Village apartments began in 2010. The Phase I Ramble
Apartments (192 units with 654 student beds) were occupied in September 2011. The mixed-use
buildings around the Village Square, including the Viridian Apartments (123 units with
192 beds) on the second through fourth floors, were occupied in September 2012. The first
building of the Sacramento City College West Village Center opened in January 2012. The Phase
II Ramble Apartments (192 units with 630 student beds) opened in September 2012. The final
phase of student housing built by WVCP, the Solstice Apartments (156 units with 504 beds)
opened in September 2013 (Figure 3). Construction of single family model homes is expected to
start in 2014.

10
Figure 3: Aerial photograph of UC Davis West Village, September 2013
1.2 The UC Davis West Village Energy Initiative
1.2.1 Goals and Objectives
Through a collaborative design process with WVCP, UC Davis expanded upon its core
principle of making UC Davis West Village environmentally responsive and launched the West
Village Energy Initiative (WVEI). Together, the UC Davis and WVCP team first considered
how to make West Village as energy efficient as possible. In 2007, UC Davis commissioned a
study with its own UC Davis Energy Efficiency Center and local consulting firm, the Davis
Energy Group, to help identify deep energy efficiency measures that could be included in the
design of the student housing and single family residences to be built as part of West Village.
The results of this study demonstrated that by adopting deep energy efficiency measures,
WVCP could reduce consumption in West Village by nearly 50 percent compared to the
California Energy Efficiency Building Code.
With this result, WVCP and UC Davis realized that a much larger goal was within reach – the
goal of making West Village a Zero Net Energy (ZNE) community. In 2008, WVCP engaged
Chevron Energy Solutions to evaluate the financial feasibility of achieving a ZNE goal defined
as “zero net electricity from the grid measured on an annual basis.”
In 2009, WVCP and UC Davis decided to strive for this goal. Because West Village had to be
accessible for UC Davis faculty, students and staff, the ZNE goal had to be balanced against the

11
goal of affordability. In response to these competing principles, WVEI was created and the
following principles were adopted by the team:
• West Village would strive to use ZNE from the grid measured on an annual basis.
• ZNE must be achieved at no additional cost to the developer.
• ZNE must be achieved at no additional cost to the consumer.
• West Village would adopt deep energy efficiency measures to reduce energy demand.
• ZNE would be achieved through multiple renewable resources developed on-site at a
community scale.
• West Village would be used as a living laboratory for further energy-related topics.
1.2.2 The California Energy Commission Renewable-Based Energy Secure Community Program
UC Davis was awarded a California Energy Commission Renewable-Based Energy Secure
Community (RESCO) grant in February 2010 and work on the ZNE project began immediately.
The goal of the UC Davis RESCO grant agreement was:
• To resolve the final remaining barriers to make the West Village one of the world’s
leading sustainable communities.
The objectives of the grant agreement were:
• To ensure that the West Village community will be Zero Net Energy;
• To provide energy to residents, among others, that is at or below the cost of what they
would have paid in a “business as usual” case, while maintaining or improving the quality
of life for the residents; and
• To seek to be a source of information and inspiration for additional communities in
California, and further California’s key environmental goals, including Assembly Bill 32, the
California Global Warming Solutions Act, and the new California Renewables Portfolio
Standard (RPS) aimed at reducing the state’s greenhouse gas emissions by 33 percent by
2020.
The target for the WVEI was to be a ZNE community through integrating a diverse array of
renewable energy resources. While the community was proposed to use a commercially
available and state-of-the-art technology, the integrating those activities in a large scale
development posed a new set of challenges:
• How the renewable energy project can be effectively coordinated with the West Village
project.

12
• How to integrate and optimize multiple distributed energy resources with a smart grid
at a community scale including connecting each Demand Energy Response (DER) into the
smart grid, interconnection to a static disconnect switch, and the integrating plug-in hybrid
electric vehicle fueling stations.
• How to optimize each specific distributed energy resource, especially the biogas
digester, so that they run as efficiency and cleanly as possible and produce the maximum
benefit to West Village.
• How to integrate performance monitoring into the smart grid system. How to build
additional functionality into the smart grid so that it contains advanced tools for consumers
and is able to adapt to new technologies and changes at the West Village in the future.
The Energy Commission RESCO grant was foundational to develop strategies for the ZNE goal.
It provided a significant portion of the funds required to pursue the ZNE concept for a
community that was in the implementation stages, not in preliminary design. The topics
evaluated with Energy Commission RESCO funding include:
• Evaluate deep energy conservation measures (Chapter 2);
• Determine the energy requirements of the community (Chapter2);
• Understand the likely increasing demand for plug-in vehicles (Chapter 2);
• Evaluate renewable energy options (Chapters 2 and 3);
• Evaluate multiple physical design models (Chapter 2);
• Select the current approach to ZNE (Chapters 2 and 4);
• Understand the financial and regulatory incentives and barriers to the ZNE goal
(Chapter 4); and
• Recommend methods for advancing ZNE to other communities (Chapter 4).
1.2.3 Evolution of the WVEI
A fundamental challenge for the WVEI was that West Village was an active project being
designed, constructed, and occupied while the initiative was underway. As the design and
implementation of West Village proceeded, the approach to the ZNE goal evolved.
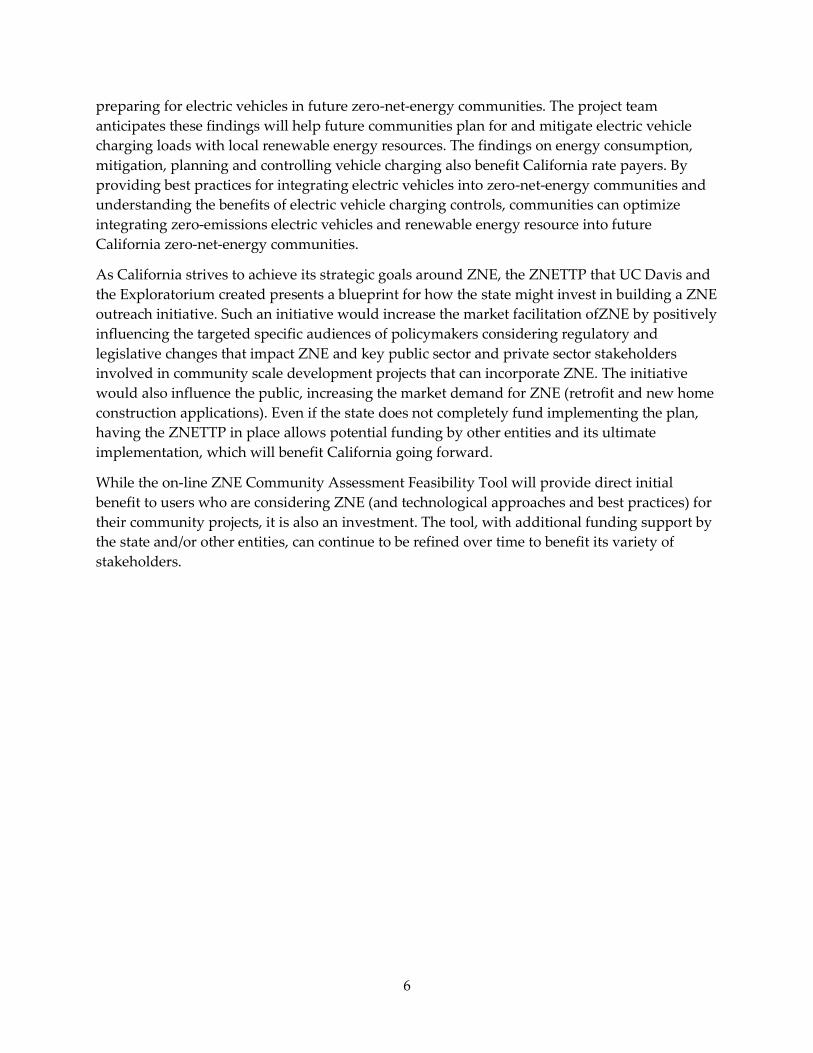
The initial ZNE design concept relied on deep energy conservation measures to reduce demand
and to produce renewable energy through community solar arrays and a community energy
park that included a biodigester linked to a fuel cell and advanced storage battery system
(Figure 4). This concept would have allowed the community to be self-sufficient for electrical
energy needs and would have been connected to the regional power grid for backup. Analyses
conducted under the Energy Commission RESCO grant revealed that this approach was not
feasible due to:
• Regulatory issues for an “islanded” community;
13
• Regulatory issues for community-scale solar;
• Cost of the fuel cell and battery;
• Lack of incentives for non-solar renewable energy; and
• Financial issues associated with the timing of housing construction and phasing of
renewable energy resources.
Figure 4: "Islanded" Zero Net Energy Concept for UC Davis West Village
Later analyses considered a three-loop distribution model to distribute renewable energy in
three one-megawatt distribution loops to the multifamily and mixed use portion of West Village
(Figure 5). Analyses conducted under the Energy Commission RESCO grant revealed that this
approach was not feasible due to:
• Regulatory issues for a smaller but still “islanded” community;
• Cost of the fuel cell and battery;
• Low tariffs available for biogas electricity;
• Lack of incentives for non-solar renewable energy;
• Higher costs to construct three 1-megawatt loops to take advantage of California Solar
Initiative incentives; and
• Lack of reimbursement by the Investor-Owned Utility for behind the meter
infrastructure.

14
Figure 5: "3-Loop" Zero Net Energy Concept for UC Davis West Village
Based on the results of these analyses, WVCP made the decision to implement the photovoltaic
renewable energy for the multifamily housing under the California Solar Initiative’s New Solar
Home Partnership.
See Chapter 2 of this report for technical information related to the evaluation of alternative
concepts and to Chapter 4 for a summary of regulatory issues and recommendations.
The initial ZNE concepts for West Village included a biodigester to convert organic waste to
electricity. Feasibility analysis and preliminary planning for the biodigester progressed under
Energy Commission RESCO grant and through a grant from a U.S. Department of Energy
Community Renewable Energy Deployment program (DOE CRED). The Energy Commission
RESCO included funding for certain elements of the feasibility analysis and materials testing at
the campus pilot plant (See Chapter 3). The DOE CRED grant included funding to help with
design and construction. Although, a biodigester is not being constructed as part of a
Community Energy Park at West Village, a result of this background work is that a 50-ton per
day biodigester facility was completed in December 2013. The site for the biodigester is the
existing campus landfill located approximately 1.5 miles southwest of West Village. The
electricity from the facility will be connected to the campus electrical grid. While this source of
electricity will not directly feed West Village, which is tied to the Pacific Gas & Electric (PG&E)
grid, a portion of the renewable energy could be credited to West Village to meet the ZNE goal.
15
CHAPTER 2: SmartGrid Integration Final Engineering and Design
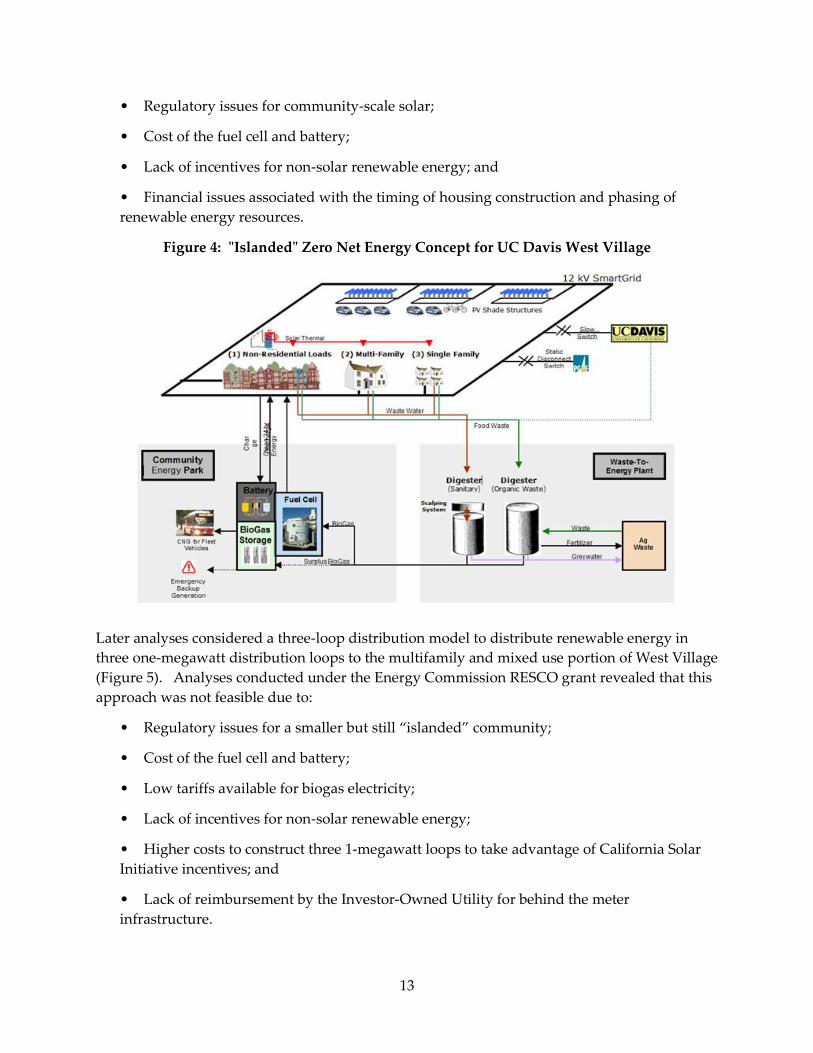
2.1: Goals of the Task
This task tested scenarios to achieve the ZNE goal by identifying appropriate energy efficiency
measures, forecasting demand and matching with renewable energy resources. Task 2
addressed load reduction and optimization, integration with the community design (energy
systems, and sub-systems), and energy efficiency throughout the community served by the
West Village grid, as well as aspects of the grid itself including electrical distribution and
interconnection; design, integration and interaction with renewable energy assets; and
integration of Plug-in Hybrid Electric Vehicle (PHEV) charging stations. As discussed in
chapter 1.2.3, the results of these analyses led to an evolving design and method that shifted
from an “islanded” community energy park to a three-loop model for the multi-family housing
and eventually to a PG&E grid-connected model using solely PV panels for the multi-family
buildings. As a result, the nature of the analysis also evolved.
The analysis provided primarily by Chevron Energy Solutions (CES February 2014) and Davis
Energy Group (DEG May 2010) can be broken down into three primary efforts.
• Consumption: An analysis and selection of different energy efficient designs for the
buildings in the community. It covers the utility and financial analysis performed to
determine the energy and cost budget. Finally, it provides information on the phase-
in assumptions made for the community.
• On-Site Generation and Distribution: Design of the on-site renewable generation and
its distribution. Various scenarios are examined for this project including the
community energy park, multi-family housing options and single family options.
• Interconnection to Load Serving Entity: Analysis and designs considered for
interconnection the West Village project to the load serving entity. These results are
presented in detail in the CES final report (CES February 2014) and are not
summarized below.
2.2: Consumption
2.2.1 Load Estimation
In late 2008, Davis Energy Group (DEG) was retained by Chevron Energy Solutions to provide a
refined analysis that would precisely quantify the cost-effectiveness of energy efficiency
packages as well as provide detailed hourly energy usage profiles for each of the key building
construction types in the project. Developing the 8,760 hourly profiles is critical for Chevron
Energy Solutions in quantifying the complicated energy transfers that must occur with PG&E to
balance generation and consumption over the course of a year. These hourly profiles are
included in the DEG report (DEG May 2010). Table 2 presents the building types planned in
2008-10 to demonstrate the relative contribution to the overall project energy budget.

16
Table 2: West Village Project Building Types
Building Type Floor Area (ft2) # of Units
Student Housing - Ramble A 432,300 324
Student Housing - Ramble B 241,200 204
Student Townhomes 33,400 20
Student Housing - Subtotal 706,900 548
Single Family (60% with detached flats) 637,600 343
Mixed Use Commercial 42,300 TBD
Mixed Use Residential 116,700 120
Leasing Building 13,300 1
Community College 56,000 3 buildings
2.2.2 Energy Efficiency
The overriding goal was to develop a cost-effective package of energy efficiency measures that
provided favorable life cycle economics and insured that the required level of energy efficiency
was integrated to meet the community ZNE goals. A community energy consumption target of
9.2 MWH/year was determined based upon the maximum expected contribution of onsite
renewable energy generation.
Additional project energy efficiency goals included:
1. Minimize natural gas use to facilitate meeting a 9.2 MWH/year goal and maximize the
contribution of on-site generation to on-site energy loads1.
2. Evaluating project-wide full-year hourly energy use profiles, by developing hourly
electrical and natural gas energy projections for each product type.
3. Estimating expected energy bill savings from adopting the proposed energy efficiency
packages for the different product types using standard PG&E tiered electric and gas
rates. Using standard PG&E rates develop the expected costs of the energy bill for the
West Village tenants and then develop simple payback and life cycle cost economic
evaluations to document package performance. Life cycle cost evaluation incorporated
maintenance and replacement costs and time intervals.
1 Since community energy use comprises both electricity and gas consumption, the ZNE calculation
requires a conversion of gas energy to electrical energy. This conversion can either be made at a “site”
efficiency level (29.3 kWh/Therm) or power plant “source” efficiency (9.8 kWh/Therm at an assumed
33.3% plant efficiency). For this study, the 29.3 kWh/Therm was assumed.

17
4. Supporting the community developer and their design team in finalizing the package of
energy efficiency measures.
The assumed base case requirements for the single and multi-family building types are
summarized in Table 3. The requirements are based on the 2008 prescriptive requirements, but
modified based on what local builders/developers are currently using to demonstrate
compliance2. Base case mechanical system for multi-family was assumed to be individual
storage gas water heaters providing both domestic hot water and space heating (via fan coil).
Base case systems for single family homes assumed gas storage water heaters for water heating
only and ducted gas furnace with ducts and furnace located in the attic. Cooling was assumed
to be provided by a split system air conditioner for both products.
Table 3: Base Case Assumptions for Single and Multi-Family Building Types (2008 Title 24)
Single Family Multi-Family
BUILDING ENVELOPE:
Walls (Exterior) 2x6 16” o.c. R-19 batt. 2x6 16” o.c. R-19 batt.
Roof (Attic) R-38 blown insulation; Radiant barrier roof sheathing
R-38 blown insulation; Radiant barrier roof sheathing
Roofing Products (roof slope > 2:12)
Aged solar reflectance ≥ 0.2; thermal emittance ≥ 0.75 (Cool Roofing products)
Aged solar reflectance ≥ 0.2; thermal emittance ≥ 0.75 (Cool Roofing products)
Glazing U-Factor/ SHGC
Average U ≤ 0.33 / SHGC ≤ 0.21 Average U ≤ 0.35 / SHGC ≤ 0.35
HVAC:
Cooling 13 SEER / 10.5 EER AC split system 13 SEER / 10.5 EER AC split system
Heating 80% AFUE Gas Furnace Hydronic heating off of water heater
Ducts R-6.0 ducts in attic R-6.0 Ducts (attic on third floor, else in between floors)
Fresh Air Mechanical Ventilation
Per ASHRAE 62.2, mandatory Jan. 2010 Per ASHRAE 62.2, mandatory Jan. 2010
WATER HEATING:
Type Individual 50 gal. gas storage water heaters; 0.60 Energy Factor
Individual 50 gal. gas storage water heaters; 0.62 Energy Factor
3RD PARTY TESTING / VERIFICATION:
Duct Tightness / Duct Location
Tight Attic Ducts; Tested at < 6% Leakage
Tight Attic Ducts; Tested at < 6% Leakage
Envelope Integrity / Tightness
None None
Cooling System None None
LIGHTING / APPLIANCES:
High Efficacy Lighting
Kitchens: 1/2 of installed Wattage must be fluorescent. Other Rooms/ Outdoors: High efficacy or motion sensor/dimmer
Kitchens: 1/2 of installed Wattage must be fluorescent. Other Rooms/ Outdoors: High efficacy or motion sensor/dimmer
Energy Star Appliances
Builder Standard Appliances Builder Standard Appliances
2 Builders typically do not exactly follow the prescriptive requirements, often substituting other measures
to obtain performance tradeoffs.

18
Cooktop / Oven Standard Electric Standard Electric
Miscellaneous Load Control
None None
Building Energy Optimization software (BEopt) developed by the National Renewable Energy
Laboratory was used to evaluate water heating energy use for both single and multifamily
building types. Solar thermal systems were evaluated based on information provided by the
bids and specifications received from the various solar contractors that Carmel Partners was
working with WVCP. The target performance for active solar systems was 60 percent annual
solar fraction. Lower solar fractions were assumed for the batch or integrated collector storage
(ICS) systems, since these systems are lower efficiency (35-45 percent solar fractions).
Multifamily Results: Table 4 summarizes proposed measures for the student apartments for a
3-story student apartment building which includes six three bedroom and six four bedroom
units. Measures that are italicized indicate no change from the base case specification. Table 5
presents the energy use projects for the twelve student apartments included in the model
building with and without the recommended energy efficiency measures.

19
Table 4: Multifamily Building Description - Summary of Final Package
DESCRIPTION
BUILDING ENVELOPE:
Walls (Exterior) 2x6 16” o.c. R-21 batt w/ ½” exterior foam. Quality Insulation Inspection.
Roof (Attic) R-49 blown insulation; Radiant barrier roof sheathing
Roofing Products (roof slope > 2:12)
Aged solar reflectance ≥ 0.2; thermal emittance ≥ 0.75 (Cool Roofing products)
Glazing U-Factor/ SHGC Average U ≤ 0.33 / SHGC ≤ 0.21
Distributed Thermal Mass Additional 1/2" gypcrete on Floors 2 and 3
HVAC:
Cooling 15 SEER / 12.5 EER Heat Pump
Heating 8.5 HSPF Heat Pump
Ducts R-6.0 ducts in conditioned space
Fresh Air Mechanical Ventilation
Per ASHRAE 62.2, mandatory Jan. 2010
WATER HEATING:
Type Central HPWH in each bldg. (3.3 COP ETech unit); Active solar water heating option
3RD
PARTY TESTING / VERIFICATION:
Duct Tightness / Duct Location Ducts in Conditioned Space; Tested < 6% Leakage
Envelope Integrity / Tightness Blower Door Testing @ CFM50: ≤ 3.0 SLA; 3rd Party Quality Insulation Inspection
Cooling System ACCA Manual J & D; Fan Power and EER Verification; Cooling Coil Air Flow
LIGHTING / APPLIANCES:
High Efficacy Lighting All hard-wired lighting fluorescent or LED. Assume 80% hardwired lighting. Lighting controls / Vacancy sensors.
Energy Star Appliances Dishwasher, Refrigerator, Washer
Cooktop / Oven Standard Electric
Miscellaneous Load Control One switch wiring, energy usage displays

20
Table 5: Projected Multi-Family Annual Building Energy Use (no solar thermal)
Title 24 Base Case Final ECM Package
End Use therms kWh therms kWh
Cooling 0 18,356 0 8,230
Heating 2,093 0 0 12,728
Water Heating 2,357 0 0 17,885
Lighting 0 16,076 0 6,547
Pumps and Fans 0 5,193 0 4,731
Miscellaneous (& appliances) 0 47,283 0 40,727
Total 4,449 86,909 0 90,848
Single Family Results: A total of 343 single family detached homes are proposed for West
Village, ranging in size from 1,300 to 4,000 square feet in size. There are four product types,
based on lot width, with three different plans within each product type. All single family plans
are two-story. Table 6 summarizes the proposed measures for the detached single family
homes. Measures that are italicized indicate no change from the base case specification. For
more details on the analysis of the proposed measures as well as the analysis for the other
building types, please refer to DEG (May 2010).

21
Table 6: Single Family Building Description - Summary of Final Package
DESCRIPTION
BUILDING ENVELOPE:
Walls (Exterior) 2x6 16” o.c. R-21 batt w/ ½” – 1” exterior foam. Quality Insulation Inspection.
Roof (Attic) R-49 blown insulation;
Radiant barrier roof sheathing
Roofing Products (roof slope > 2:12)
Aged solar reflectance ≥ 0.2; thermal emittance ≥ 0.75 (Cool Roofing products)
Glazing U-Factor/ SHGC Average U ≤ 0.33 / SHGC ≤ 0.21
Distributed Thermal Mass 5/8” drywall throughout
HVAC:
Cooling 15 SEER / 12.5 EER Heat Pump
Heating 8.5 HSPF Heat Pump
Ducts R-6.0 ducts in conditioned space
Fresh Air Mechanical Ventilation
NightBreeze for summer night ventilation cooling & fresh air mechanical ventilation
WATER HEATING:
Type Heat Pump Water Heater in garage or exterior closet. Adequate ventilation required.
Mfg. / Efficiency Energy Factor ≥ 2.0
Solar Water Heating Active solar water heating system (0.60 solar fraction). 1 4x8 collector per home.
3RD
PARTY TESTING / VERIFICATION:
Duct Tightness / Duct Location
Ducts Conditioned Space;
Tested < 6% Leakage
Envelope Integrity / Tightness Blower Door Testing @ CFM50: ≤ 1.5 SLA; 3rd
Party Quality Insulation Inspection
Cooling System ACCA Manual J & D; Fan Power and EER Verification; Cooling Coil Air Flow
LIGHTING / APPLIANCES:
High Efficacy Lighting All hard-wired lighting fluorescent or LED. Assume 80% hardwired lighting.
Lighting controls / Vacancy sensors.

22
Energy Star Appliances Dishwasher; Homeowner incentives to encourage purchase of other EnergyStar appliances
Cooktop / Oven Induction cooktop as buyer option
Miscellaneous Load Control One switch wiring, energy usage displays
2.2.3 Energy Budget
A tariff simulation model for the community was used to estimate the utility costs of different
mixes under different scenarios (CES February 2014). Table 7 identifies the different PG&E
rates that were reviewed.
Table 7: PG&E Electric Rates applicable to West Village
Table 8 and Table 9 summarize the results of the tariff simulations undertaken to establish the
baseline energy budget for the community and the impact of energy conservation measures on
energy use and utilities bills. Further information and analysis is included in the Microsoft Excel
spreadsheet model in Appendix 1.2 to the CES report (CES February 2014).
Table 8: BAU West Village Annual Energy Consumption and Budget
Energy Summary Utility Bills Summary
Unit Type Electricity (KWh)
Gas (Therms)
Total Energy (KWh)
Elec. Rate
BAU Elec Bill
BAU Gas Bill
Metering Bill
Total Annual Bill
Single Family 2,169,982
266,540 9,899,646
E-1 $277,569 $258,428
$31,582 $567,579
Multi Family 3,962,889
198,587 9,721,898
E-6 $640,412 $198,587
$50,605 $889,604
MU Residential
628,499 29,776 1,492,002
E-6 $87,699 $29,776 $11,358 $128,833
MU Commercial
532,494 5,733 698,763 A-10S
$87,063 $5,733 $10,950 $103,746
Los Rios 537,592 2,970 623,708
E-19S
$101,312 $2,970 $1,825 $106,107
Common Areas
299,999 0 299,999 LS-3 $38,844 $0 $73 $38,917
TOTAL 8,131,455
503,606 22,736,017
$1,232,899
$495,493
$106,393
$1,834,786
Rate Type Time-Of-Use Demand Charges
Max KW allowed
E1, E7 Single Family Residential
No No Tier structured
E6 Single Family Residential
Yes No Tier structured
ES,EM Multifamily No No Tier structured
A1 Small General No No <200
A6 Small General Yes No <200
A10 Medium General Yes Yes <500
E19 High General Yes Yes <2000
23
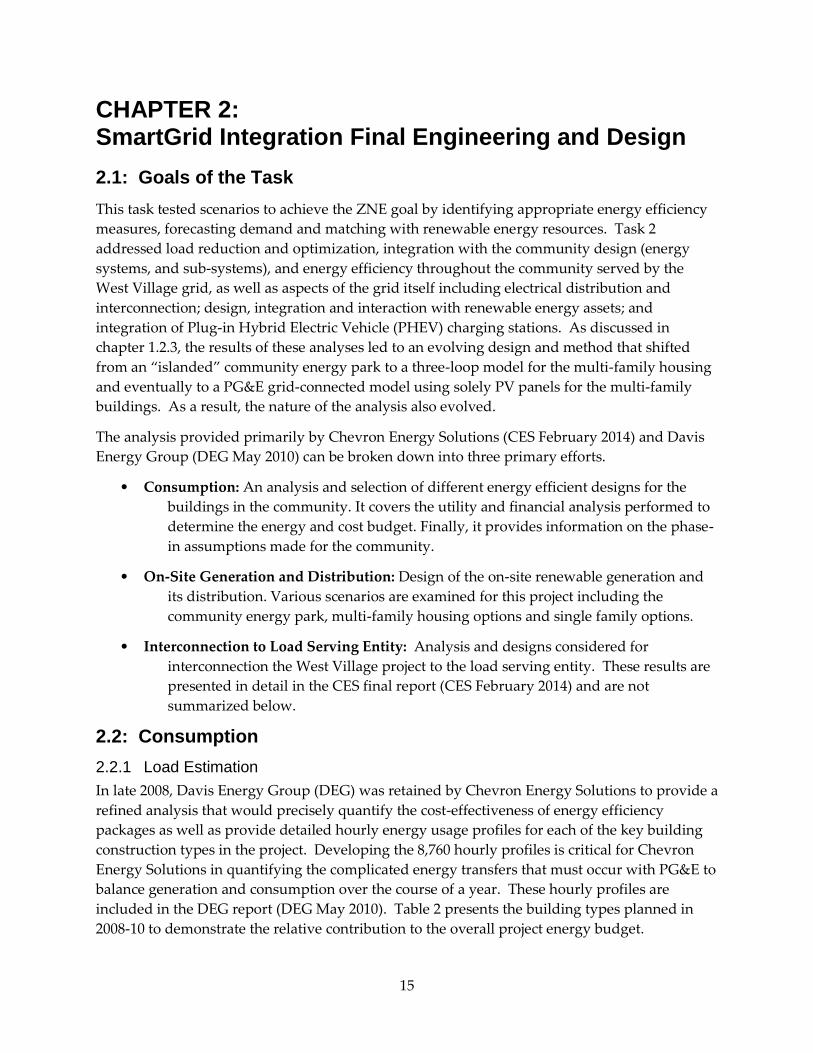
Table 9: Proposed ECM Annual Energy Consumption and Budget
Energy Summary Utility Bills Summary
Unit Type Electricity (KWh)
Gas (Therm
s)
Total Energy (KWh)
Elec. Rate
PKG-B Elec Bill
PKG-B Gas Bill
Metering Bill
Total Annual
Bill
Single Family 3,444,27
0 0
3,444,270
E-1 All
elec $430,238 $0 $31,582 $461,820
Multi Family 4,067,89
2 0
4,067,892
E-1 All
elec $483,544 $0 $0 $483,544
MU Residential 703,635 0 703,635
E-1 All
elec $83,517 $0 $0 $83,517
MU Commercial
491,831 5,733 658,100 A-
10S $81,478 $5,733 $10,950 $98,161
Los Rios 537,592 2,970 623,708
E-19S
$101,312 $2,970 $1,825 $106,107
Common Areas
150,015 0 150,015 LS-3 $19,424 $0 $73 $19,497
TOTAL 9,395,234
8,703 9,647,62
0 $1,199,5
13 $8,703 $44,430
$1,252,646
2.3: Onsite Generation and Distribution
The goal of this RESCO task was to develop the best method to integrate Renewable Energy
Sources (RES) into West Village Community Electrical Distribution System. The focus of the
work was to coordinate with the developer on placing central inverters throughout the
community and integrating them into the ZNE community design. This section provides the
details of the multiple community designs considered for the project. For each scenario,
examination of the technical, regulatory, and financial requirements of the community was
undertaken. A full joint trench design for was developed for the infrastructure as in available in
Appendix 2.1 to the CES Report (CES February 2014).
Scenarios examined for the West Village Community include:
• Community Energy Park: looking at the entire development, examining its energy
needs, available energy resources, and how to meet the project goals from a holistic
approach.
• Single Family and Multi-Family/Mixed-Use Hybrids: Within each scenario there were
two different designs analyzed: community-scale (at different levels) and building-
by-building.
2.3.1 Community Energy Park
The West Village ZNE Community Energy Park Concept was designed and conceived,
maximizing an organized and integrated approach. Figure 4 illustrates the initial ZNE
Community Energy Park concept. With this approach, West Village would satisfy its annual

24
electricity and gas demand by integrating solutions that reduce energy consumption with a
diverse array of indigenous renewable energy resources in an economic and technically optimal
manner. Planned technologies included: Energy efficiency (passive & active)
• Distributed Solar Photovoltaic
• Distributed Solar Thermal
• Biogas digester
• Fuel Cell(s)
• Advanced energy storage
• SmartGrid technology
• Bio-methane upgrade system
This scenario envisioned a single point of interconnection with PG&E. The entire development
would have been considered a single customer from the utility perspective. The WVEI team
studied PG&E and California Public Utility Commission (CPUC) tariff books and codes to
determine how such a system will work. Given the energy demands of the development,
PG&E’s electrical tariff E-19 would have been the most applicable tariff which applied to
medium and large commercial customers. This tariff provided the system with two critical
success factors:
Time-of-Use Tariff: this is necessary to reflect the true cost of energy as it is being
consumed during the day.
Net Metering: the development energy profile – shown below – represented a “negative
peak” profile, where Solar generated during the day can be exported to the utility at a
higher value than power consumed at night.
The baseline building energy usage at full build-out (assuming 2008 Title 24 standards) for West
Village implied an annual energy load of approximately 23,000 MWh. Of this, 11,100 MWh was
gas demand and 12,000 MWh was electric demand. This demand had to be completely offset to
achieve the goal of ZNE. Figure 6 demonstrates this path to ZNE.

25
Figure 6: West Village – Energy Resources Mix for Zero Net Energy
Matching load with generation during the ramp-up period of the development was considered
a critical challenge to overcome, as it added uncertainty to the business model and ownership
structure that were hindering its development, especially as it related to the single family units.
Conversely, multi-family residences and mixed use commercial areas appeared able to take
advantage of the non-residential/high-rise exceptions in Rule 18 for master-metering of the
smart grid at the point of connection with PG&E. Unfortunately, due to Net-Metering
limitations, the single electrical distribution loop for approximately 3MW demand load would
have to be split into three radial distribution systems of less than 1 MW demand threshold for
net-metering and CSI incentives. This resulted in financial complications for interconnecting all
of the components of the ZNE smart grid due to load matching and redundant distribution
costs. The smart grid estimated costs increased in the following ways:
The three distribution system cost of $1.5 million was 3 times the original one loop
distribution cost estimates
The increased cost for gas line deletion was estimated at approximately $100k in added
costs for the increased number of transformers due to the electrical load increased by an
all electrical community.
After the analysis of this scenario, and the work done by the different stakeholders including
the Utility, the University and the developer, it was concluded that this scenario would not be
applicable under the current conditions and further scenarios were examined. The
recommendation was to explore different scenarios for the Single-Family portion of the

26
development than for the Multi-Family and Mixed-Use tenets. All of these scenarios were
analyzed with respect to solar system construction feasibility, utility interconnection issues,
available incentive programs and regulatory requirements.
2.3.2 Single Family – Community PV Array with PPA Provider
This scenario explored a rather unique and innovative strategy to meet the energy demands of
the Single Family portion of the West Village Development. The system design was ground-
mounted, located at the West Village sports field area and an adjacent area planned for a future
phase of the West Village development. It would have been connected directly to the PG&E
utility grid. The amount of energy generated by the system would have been equal to that of
the energy demands estimated of the Single Family units. Each unit would be connected
separately to the utility and buy their energy directly from the utility. The ground-mount
design lowered the cost of the system and allowed for more energy generation taking
advantage of higher tilts.
This scenario was considered the least challenging from a regulatory and utility interconnection
perspective. It would have utilized existing tariffs and rulings without the need for any
changes. The system’s only challenge would have been to finance the system and sell power at
the wholesale generation cost for the Utility.
2.3.3 Single Family – Rooftop PV Array with Smaller Community PV Array
Realizing the limitations of the previous scenario, a different virtual ZNE scenario was analyzed
where each dwelling unit would include installation of the most economically feasible PV
system on its roof and the remaining energy would be offset by a Virtual ZNE ground mount
system. Given the available roof space, a roof-top system of 5 KW DC was considered. The
rooftop systems in aggregate were estimated to offset close to two-thirds of the energy needs of
the Single-Family development at total of 1,700 KW and energy production of 2,380 MWh. The
remaining third of the energy demand would have been met by the ground-mount system
which could have been developed in a similar structure of the previous scenario. The system
size is estimated at 700 KW DC.
With this approach, maximized captured incentive must be weighed carefully against the
increased complexity of the system design, construction costs and uncertainty of ownership
model. With Solar PV part of each unit, questions over who owns the system and who has
responsibility to maintain and guarantee the upkeep of the equipment becomes more
challenging. This analysis also revealed that the financial feasibility of such a small ground-
mount system is difficult to attain, given that it will need to compete with much larger systems
where economies of scale savings are captured.
2.3.4 Multi-Family/Mixed-Use – One Loop
This design approached the Mixed-Use portion of the development with similar philosophy of
the initial design scenario: an integrated approach with the entire mixed use and multifamily
portion of West Village considered a single user with an electrical distribution loop that has one
interconnection with the utility. Following completion of the previous scenarios, the initial
27
Solar PV opportunities were understood, and the development layout was finalized. The
resulting system consists of:
• Parking-Shade Structures, and
• Public area shade structures
The total system size is 2,400 KW DC with estimated production of 4,000 MWh. The drawing
below shows the location of the Solar PV in the development. The system design incorporates
more PV in the recreation fields’ area. This provides dual benefits in shading to the residents
and spectators of the sports area. Initial design of bike and pond are shade structures were
eliminated.
This scenario envisioned one joint trench that would serve the mixed-use portion of the
development. Renewable energy sources were to be connected at multiple points around the
development. This system would have provided the benefits of economy-of-scale, minimized
interconnection points to the electrical distribution, and provided another advantage in that it
allowed for the construction of the Solar PV system independently from the construction of the
buildings and the beginning of the use. This was critical to the project given the different time
drivers of the project: while the construction schedule and full build-out of this portion of the
development was over three years, the Solar PV was on a shorter time scale driven by the
financial needs of the project, incentives and cost of PV variability. The list below summarizes
the benefits for this scenario:
• Economy of Scale with minimal system components and necessary supporting
infrastructure, leading to a more economically feasible installation
• System sizing to meet 100 percent of load: the aggregation of the units and end-users
minimized the variability and uncertainty of usage, thus allowing the system sizing
to be close to 100 percent
• Construction Schedule can be independent from the absorption rate of the development,
minimizing the need to match load and generation
• Minimal impact on the joint trench design and the electrical distribution network
This scenario, paired with either of the Single-Family scenarios, would have achieved the goals
and objectives of the WVEI from the regulatory and technical perspectives. It integrated
seamlessly with the business as usual electrical distribution network. The drawbacks of this
scenario were the low incentive level captured and the challenge of matching load with
generation during the ramp-up periods of the development.
2.3.5 Multi-Family/Mixed-Use – Multiple Loop
Following from the previous scenario, a design approach was examined where the mixed-use
family portion is broken down to multiple loops. This approach minimized the downfalls of the
previous scenario by:

28
Maximizing incentives by splitting the system into multiple loops with each loop
considered a separate system eligible for maximum incentive size, essentially making
the entire system eligible for the incentives
Minimizing the gap between load and generation, the multiple loops would be built at
different times and for each loop, the associated PV System can be built with it.
The total system size remained 2,800 KW DC with estimated production of 4,000 MWh. This
analysis maximized the California Solar Incentive and provided a better integration of the Solar
PV schedule with the community construction schedule. However, this was achieved at a large
added cost to the joint trench and electrical distribution costs.
2.4: Designing and Integrating PEVs into ZNE communities
Integrating “Smart” electric vehicle infrastructure is not just about installing reliable controls
technology. Equally important is thorough planning and assessment of electric vehicle
adoption, expected travel distances and vehicle energy use to determine the impacts attributed
to electric vehicle charging. At West Village, this has become even more of a challenge, as the
project must accommodate a growing number of electric vehicles into the ZNE goal. This
section of the report documents effort to address the following issues. Details are presented in
Barr (March 2014):
Integrating the smart grid enabled electric vehicle charging stations at West Village
Making recommendations for future communities and real estate developments
Developing a process to perform assessments of estimated adoption and energy use
from plug-in electric vehicles
Estimating demand and recommending how to accommodate electric vehicle charging
loads with solar at the single family homes to be built at West Village
Providing market perspectives for electric vehicles and solar based on activities in 2014
2.4.1 Estimating Vehicle Charging Loads by Evaluating Travel Distances
To determine estimated impact from future electric vehicle charging at the single family homes
at West Village, it was necessary to understand travel distances and vehicle type. To understand
the unique travel of West Village, regional data from local authorities was used and filtered
according to those who were identified as employs of UC Davis.
After the simulation was executed, and the potential households that would buy PEV were
estimated, the following results were found. There are 259 households that currently live in
West Davis that have at least one household member who works in UC Davis. It was assumed
that 20 percent of households would have PEV. After each household’s probability to purchase
PEV calculated from the number of drivers in the household, the researchers randomly selected
48 households that are most likely to purchase PEV. Those households that are estimate to
purchase a PEV demonstrate vehicle miles traveled (VMT) distributions shown in Figure 7.

29
Figure 7: Commuter Car Total Daily Miles
The total home energy consumption of a PEV is based on a combination of the daily VMT and
the electric range of the vehicle. Two scenarios were calculated. The lower scenario is based on
the assumption that each PEV owner will charge the car at home to 100 percent of battery
capacity once a day and also will use public charging or workplace charging whenever
available. The second scenario is based on up to two charging events per day at home and using
a public charging or workplace charging only if additional miles are needed. The average
consumption used is 333 watt hours per mile for all vehicles or about 3 miles per kWh. If most
of the VMT will be urban the energy consumption may be lower, up to about 4 miles per kWh.
The total energy consumption per car is capped by the battery size (capacity), amount of time
elapsed during charging events (energy absorbed during refueling), and is also dictated by the
energy consumed by operating the vehicle, which is based on the miles traveled per day. Table
10 illustrates energy consumption of each vehicle type based on our two scenarios and takes
into account that weekend trips are more likely to use 100 percent of the PHEV battery and up
to 80 percent of the BEV range, thus consuming more energy.

30
Table 10: Estimated home charging energy consumption per vehicle per week day
Vehicle type
lower demand: one home charging per day plus workplace
charging
Maximum demand: Two
home charging per day Minimum
workplace charging
PHEV 10 3.0 kWh
6.1 kWh
PHEV 20 6.1 kWh
9.4 kWh
PHEV 40 9.1 kWh
13.0 kWh
BEV 70 6.1 kWh
15.2 kWh
BEV 100 7.6 kWh
18.8 kWh
BEV 150+ 10.6 kWh
27.3 kWh
2.4.2 Mitigating Vehicle Charging Loads with Solar
To highlight the impact of siting solar PV generation the estimated yearly solar PV energy
production from two examples of West Village Solar PV orientations was compared to ideal
conditions. Table 11 summarizes the range ideal orientation for optimal efficiency given the
constraints of the Solar PV system designs for the single family homes development.
Table 11: Summary of ideal solar PV orientation and for West Village Single Family Homes
Array Description Tilt angle (degrees)
Azimuth angle (degrees)
Ideal orientation 30 180
South facing home with LR* config. 22.6 180
East facing home with L** config. 22.6 90
*LR refers to a configuration where an equal number of solar panels are split between the left and right sides of the roof. **L refers to a configuration where all of the solar panels are located on the left side of the roof
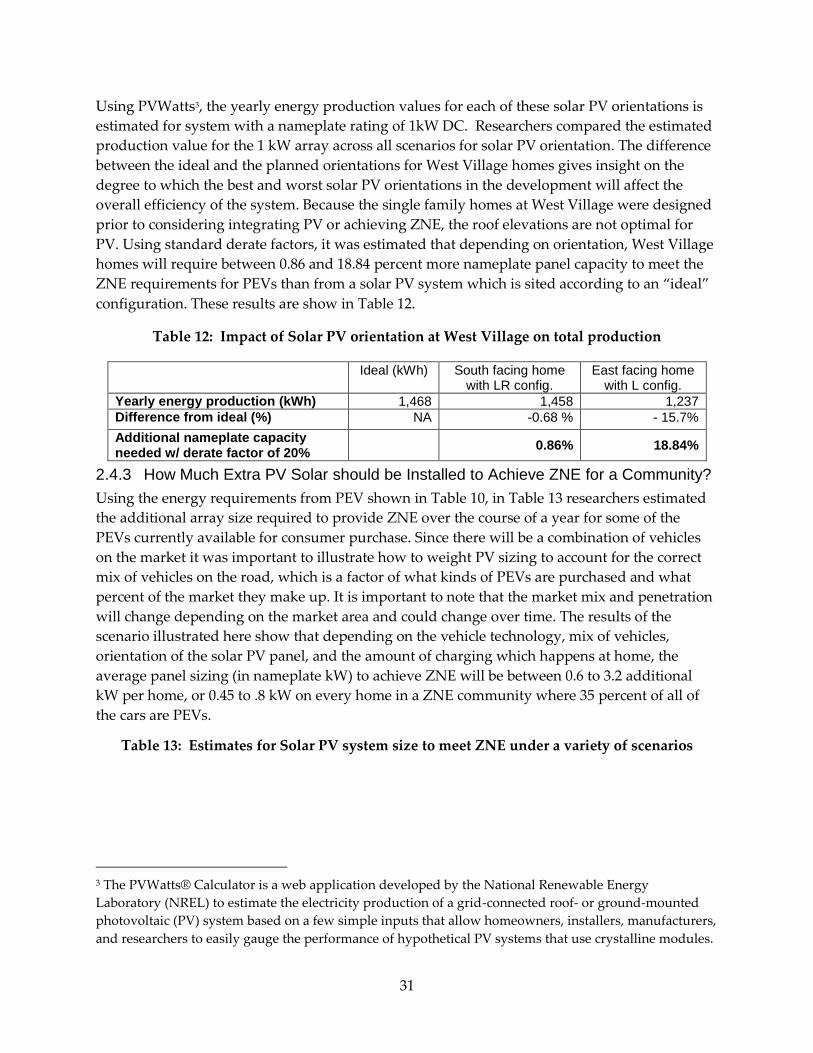
31
Using PVWatts3, the yearly energy production values for each of these solar PV orientations is
estimated for system with a nameplate rating of 1kW DC. Researchers compared the estimated
production value for the 1 kW array across all scenarios for solar PV orientation. The difference
between the ideal and the planned orientations for West Village homes gives insight on the
degree to which the best and worst solar PV orientations in the development will affect the
overall efficiency of the system. Because the single family homes at West Village were designed
prior to considering integrating PV or achieving ZNE, the roof elevations are not optimal for
PV. Using standard derate factors, it was estimated that depending on orientation, West Village
homes will require between 0.86 and 18.84 percent more nameplate panel capacity to meet the
ZNE requirements for PEVs than from a solar PV system which is sited according to an “ideal”
configuration. These results are show in Table 12.
Table 12: Impact of Solar PV orientation at West Village on total production
Ideal (kWh) South facing home with LR config.
East facing home with L config.
Yearly energy production (kWh) 1,468 1,458 1,237
Difference from ideal (%) NA -0.68 % - 15.7%
Additional nameplate capacity needed w/ derate factor of 20%
0.86% 18.84%
2.4.3 How Much Extra PV Solar should be Installed to Achieve ZNE for a Community?
Using the energy requirements from PEV shown in Table 10, in Table 13 researchers estimated
the additional array size required to provide ZNE over the course of a year for some of the
PEVs currently available for consumer purchase. Since there will be a combination of vehicles
on the market it was important to illustrate how to weight PV sizing to account for the correct
mix of vehicles on the road, which is a factor of what kinds of PEVs are purchased and what
percent of the market they make up. It is important to note that the market mix and penetration
will change depending on the market area and could change over time. The results of the
scenario illustrated here show that depending on the vehicle technology, mix of vehicles,
orientation of the solar PV panel, and the amount of charging which happens at home, the
average panel sizing (in nameplate kW) to achieve ZNE will be between 0.6 to 3.2 additional
kW per home, or 0.45 to .8 kW on every home in a ZNE community where 35 percent of all of
the cars are PEVs.
Table 13: Estimates for Solar PV system size to meet ZNE under a variety of scenarios
3 The PVWatts® Calculator is a web application developed by the National Renewable Energy
Laboratory (NREL) to estimate the electricity production of a grid-connected roof- or ground-mounted
photovoltaic (PV) system based on a few simple inputs that allow homeowners, installers, manufacturers,
and researchers to easily gauge the performance of hypothetical PV systems that use crystalline modules.
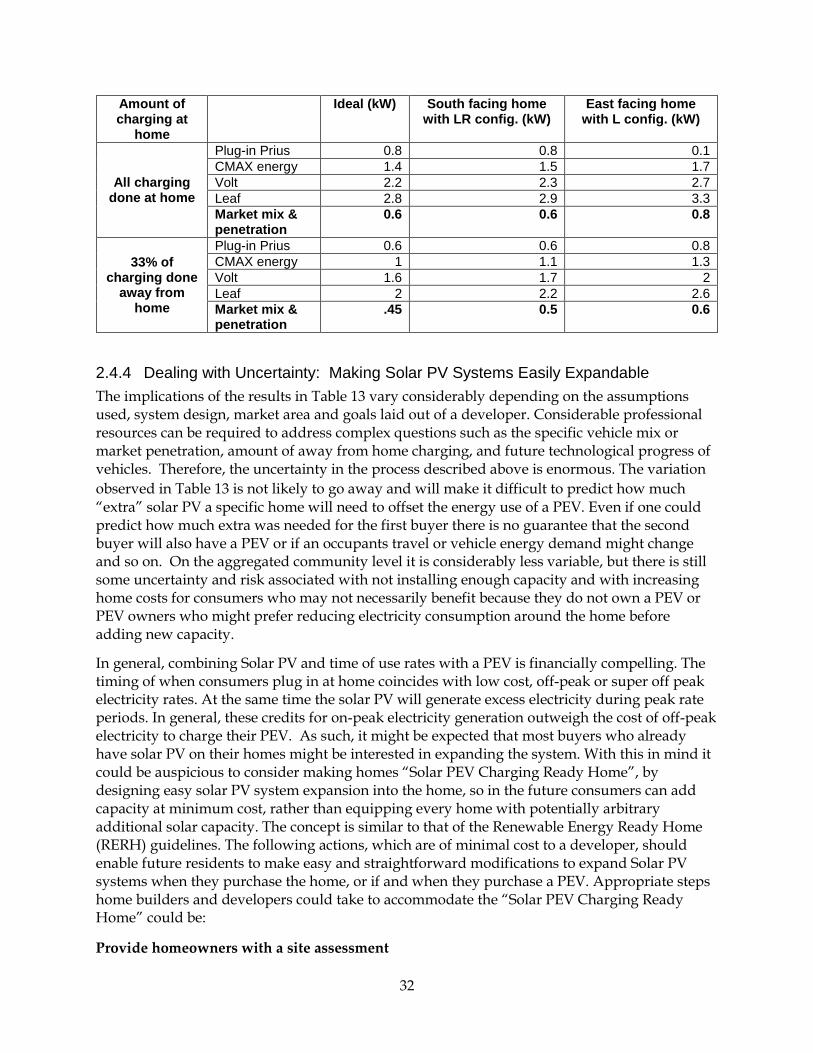
32
Amount of charging at
home
Ideal (kW) South facing home with LR config. (kW)
East facing home with L config. (kW)
All charging done at home
Plug-in Prius 0.8 0.8 0.1
CMAX energy 1.4 1.5 1.7
Volt 2.2 2.3 2.7
Leaf 2.8 2.9 3.3
Market mix & penetration
0.6 0.6 0.8
33% of charging done
away from home
Plug-in Prius 0.6 0.6 0.8
CMAX energy 1 1.1 1.3
Volt 1.6 1.7 2
Leaf 2 2.2 2.6
Market mix & penetration
.45 0.5 0.6
2.4.4 Dealing with Uncertainty: Making Solar PV Systems Easily Expandable
The implications of the results in Table 13 vary considerably depending on the assumptions used, system design, market area and goals laid out of a developer. Considerable professional resources can be required to address complex questions such as the specific vehicle mix or market penetration, amount of away from home charging, and future technological progress of vehicles. Therefore, the uncertainty in the process described above is enormous. The variation
observed in Table 13 is not likely to go away and will make it difficult to predict how much “extra” solar PV a specific home will need to offset the energy use of a PEV. Even if one could predict how much extra was needed for the first buyer there is no guarantee that the second buyer will also have a PEV or if an occupants travel or vehicle energy demand might change and so on. On the aggregated community level it is considerably less variable, but there is still some uncertainty and risk associated with not installing enough capacity and with increasing home costs for consumers who may not necessarily benefit because they do not own a PEV or PEV owners who might prefer reducing electricity consumption around the home before adding new capacity.
In general, combining Solar PV and time of use rates with a PEV is financially compelling. The timing of when consumers plug in at home coincides with low cost, off-peak or super off peak electricity rates. At the same time the solar PV will generate excess electricity during peak rate periods. In general, these credits for on-peak electricity generation outweigh the cost of off-peak electricity to charge their PEV. As such, it might be expected that most buyers who already have solar PV on their homes might be interested in expanding the system. With this in mind it could be auspicious to consider making homes “Solar PEV Charging Ready Home”, by designing easy solar PV system expansion into the home, so in the future consumers can add capacity at minimum cost, rather than equipping every home with potentially arbitrary additional solar capacity. The concept is similar to that of the Renewable Energy Ready Home (RERH) guidelines. The following actions, which are of minimal cost to a developer, should enable future residents to make easy and straightforward modifications to expand Solar PV systems when they purchase the home, or if and when they purchase a PEV. Appropriate steps home builders and developers could take to accommodate the “Solar PEV Charging Ready Home” could be:
Provide homeowners with a site assessment
33
• Propose a location for additional solar PV. In the case of limited roof space they may
identify options for solar canopies on the property.
• Identify the orientation of proposed panels.
• Identify the inclination of proposed panels.
• Conduct a solar shading study
• Document the solar resource potential at the designated array location
Complete structural and safety considerations
• Document the maximum dead and live load on the proposed panel location
• Install a permanent roof anchor fall safety system on sloped roofs
Infrastructure for expanding solar PV
• Assess strategies to make solar PV easily expandable, these may include using micro-
inverters, oversizing a line inverter, etc.
• Dedicate enough space for additional inverters or a larger inverter
• Install a conduit for the DC wire run
• Dedicate extra panel space and capacity to accommodate additional solar PV
• Provide architectural drawings and diagrams of additional PV system components
Infrastructure for a home Electric Vehicle Supply Equipment (EVSE)
• Install a dedicated breaker to support a 240V and 40 amp appliance
• Dedicate a space for an EVSE
• Provide conduit, pathway, or standard from panel to EVSE location, or install a 14-40
plug.
Homeowner education
• Provide home buyers with marketing information and relevant information in a
dedicated pamphlet
• Discuss the features of the system
2.4.5 Integration of SmartGrid Vehicle Charging Systems
The RESCO project allowed West Village to explore the integration of a smart grid controlled
electric vehicle charging station. The project accomplished this through a smart energy gateway,
which communicates wirelessly with a group of vehicle charging stations installed at West
Village.

34
During the period of development for West Village, there was a push to develop a smart grid.
Loosely defined the Smart Grid is generally accepted as technology systems and applications on
the distribution network and customer’s side of meter which enables real-time controls, energy
management and data monitoring to optimize the electrical grid. If electrical vehicle chargers
and other electrical appliances behind the customer’s meter have the capability to provide real-
time data and controls, theoretically energy demand could be optimized. The original vision at
West Village included a smart grid distribution network, dynamic renewable energy
generation, and controls and automation in the buildings. However, the project was not able to
pursue smart grid integration past the early planning stages. The project abandoned pursuing
the smart grid due to excessive costs associated with owning and maintaining electricity
distribution infrastructure. Also, there are many rules and regulations governing
interconnection to the utility and the incentive eligibility for technologies such as solar PV are
significantly curtailed when a customer or end use is not directly served by the utility. Thus the
project didn’t have the financial resources or the appetite for risk to endure these challenges. As
such the project decided to pursue a zero-net energy, grid-tied PV structure, which typically has
little communication and no grid interactive automation capabilities.
2.4.6 Benefits of Controlled Vehicle Charging
Currently, because electric vehicles have only recently become available for purchase and
penetration in the total vehicle fleet is still ramping up, grid impacts from charging electric
vehicles are not considered to be an issue. It’s generally accepted that until there are more than
one million vehicles on the road in California the additional demand on the grid can be easily
met with current generation resources4. While this is mostly correct, there are many activities
and behaviors recently observed that might change the general perceptions of when and how
electrical vehicle owners charge their vehicles. For example, prior to the availability of electric
vehicles it was widely accepted that the majority of EV drivers would charge at home, during
the night or early morning. While this assumption was reasonable, other developments in the
market place, such as free workplace and public charging, are causing many electric vehicle
drivers to charge during daytime during on-peak hours. While the promise of free public and
workplace charging has helped to ramp-up electric vehicle sales, it could cause concern for the
grid earlier than previously thought, particularly on grid system peak demand days. Also,
while the grid system in California as a whole has adequate capacity, extra on-peak loads could
cause problems on some of the distribution networks with limited capacity, causing that
particular distribution circuit to require updating sooner than anticipated. Finally, additional
on-peak grid loads cause concern in the wholesale bulk power market place and can also lead to
unnecessary power plant emissions. This is because on high demand days, the cost of energy to
meet the demand from on-peak charging could cause the overall power cost to rise rapidly as
supply dwindles and transmission becomes constrained. Often, in order to meet the peak
demand grid operators often have to ramp up “peaker plants”, which typically don’t run
optimally and may have more emissions than other sources. In fact, grid operators might be
4 California Plug-in Electric Vehicle Collaborative, Taking Charge (2010).
35
required to import coal energy from other states during these high demand events or risk
blackouts and brownouts.
With these concerns and benefits in mind, applying controls to vehicle charging could elevate
much or all strains on the grid. Mechanisms such as demand response, which currently exist in
the energy market, could be applied to electric vehicle charging. Other potentially beneficial
applications, such as vehicle-to-grid energy storage and dispatch, are currently being evaluated
and demonstrated. The combination of controlled charging, vehicle-to-grid and demand
response could be instrumental in managing loads and variable renewable generation on the
grid. While the benefits of distributed load controls and energy storage applications are not
fully understood, they are generally view optimistically by researchers, automakers, ISO and
many utilities.
2.4.7 SmartGrid Electric Vehicle Charging Conclusions
Through the process of designing, installing and commissioning this system, the project has
made the following conclusions:
Controlled charging can offer benefits to the grid stability and financial benefits to those
users who participate in demand response events.
When selecting vehicle charging stations it is important to consider equipment with
communications capabilities, as this equipment can easily be integrated into smart grid
systems. This is particularly important with workplace, public and mixed use charging
installations as these applications can expect to observed charging station use during on-
peak utility tariff hours, when the grid could be potentially strained for generation
resources.
Given the current direction and pace of California’s Title 24 requirements for new
construction, it’s reasonable to assume that similar to the 2013 commercial lighting
requirements, demand response capability may be required in the future for electric
vehicle charging stations.
2.4.7 Lessons Learned: Project Benefits and Conclusions
The purpose of this project was not only to help prepare West Village for growing PEV
adaption, but also to tell the story of Electric Vehicle Service Equipment (EVSE) integration at
West Village for the betterment of future ZNE communities. The documentation of this process,
including a description of the methods and techniques used to determine potential near term
impacts, is intended to provide guidance to city and county planners and real estate developers
interested in similar ZNE projects. It is a record of lessons learned from the first ZNE
community built in the United States as well as research and recommendations on the
integration of electric vehicles into new communities. As PEV adoption grows it is imperative
that decision makers adequately plan for the impacts of a transportation system that is slowly
shifting from being powered by fossil fuels to electricity provided by the grid. The implications
are important as more ZNE communities are promoted, planned and built. PEVs contribute
significantly to community sustainability goals and should not be addressed as an afterthought.
36
Lessons Learned from EVSE Integration at West Village
Given the experience of integrating electric vehicle charging infrastructure at West Village this
report provides the following considerations for new communities and zero-net-energy
community:
Providing conduit at multiple parking locations, regardless of current need of the
community is important to streamline vehicle charger installation at a later date.
While West Village did place extra conduit aggressively, there are concerns that there
will not be adequate capacity to support the amount of electric vehicles expected in the
near to midterm at West Village, thus more infrastructure is beneficial.
Providing a separate, isolated electrical panel and meter for electric vehicle charging add
significant value as it enables electric vehicles to be metered separately, take advantage
of future electricity rates for electric vehicle charging, doesn’t interfere with building
load panel size calculations and enables solar PV to be dedicated specifically to electric
vehicles.
While Level 2 charging is valuable and should be made available, more low power Level
1 charging should be installed. At West Village, this was particularly true for workplace
and residential applications, where electric vehicles are parked for eight hours or more.
EVSE SmartGrid Integration at West Village
The RESCO project allowed West Village to explore the integration of a smart grid controlled electric vehicle charging station. The project accomplished this through a smart energy gateway, which communicates wirelessly to a group of vehicle charging stations installed at West Village. Through the process of designing, installing and commissioning this system, the project has made the following conclusions:
Controlled charging can offer benefits to the grid stability and financial benefits to those
users who participate in demand response events.
When selecting vehicle charging stations it is important to consider equipment with
communications capabilities, as this equipment can easily be integrated into smart grid
systems. This is particularly important with workplace, public and mixed use charging
installations as these applications can expect to observed charging station use during on-
peak utility tariff hours, when the grid could be potentially strained for generation
resources.
Given the current direction and pace of California’s Title 24 requirements for new
construction, it’s reasonable to assume that similar the 2013 commercial lighting
requirements, demand response capability may be required in the future for electric
vehicle charging stations.
37
Estimating Travel and Energy Impacts of PEVs at West Village
To determine estimated impact from future electric vehicle charging at the single family homes
at West Village, it was necessary to understand travel distances and vehicle type. To understand
the unique travel of West Village, regional data from local authorities was used and filtered to
select those identified as employees of UC Davis.
To understand travel and electric vehicles, tools have been created to help developers,
planners and others. When considering accommodating electric vehicle charging loads
with renewable resources, its important practitioners should become familiar with these
resources in order to accurately estimate the impacts from electric vehicles.
The range of travel and vehicle choice at West Village was found to be widespread and
ranged from 3kWh to 27.3 kWh per day of energy use between two scenarios.
Given the range of energy use, accommodating 100 percent of electric vehicle charging
energy with on-site renewables at West Village probably is not practical.
Mitigating Estimated PEV Charging Impacts to Achieve ZNE Goals
Using regional and local travel data collected for the project, models were created to evaluate mitigating these expected vehicle charging loads in a new or existing community with solar. The project found:
Due to the diversity of vehicles and travel distances, those who strive to accommodate
electric vehicle charging loads with renewables should consider careful analysis as to
optimize their renewable energy systems size and costs.
Regardless of the wide range and often unpredictable nature of electric vehicle charging
energy use, with careful analysis, it is achievable and reasonable to mitigate a significant
portion of a community’s electric vehicle energy consumption with solar arrays ranging
from 0.8 to 4 kW in size.
Estimating future vehicle charging demand can be complex and also warrants careful
consideration. One effective approach for single family homes is to, at a minimum,
install adaptable PV infrastructure that can be readily and easily expanded to meet
increasing PEV charging needs of future residents. This design philosophy is called solar
PEV charging ready.
Including the appropriate PV size or the capability to easily expand the home’s PV
system to accommodate electric vehicle charging loads could be important marketing
tool for builders and developers to attract home buyers.

38
CHAPTER 3: Site Specific Technology Optimization – Renewable Energy Anaerobic Digester Feasibility
3.1. Goals of the Task
The goals of this task were to finalize engineering design, site architectural plans and cost
estimates for a UC Davis Renewable Energy Anaerobic Digester (READ) facility that would
convert organic residuals on the campus of UC Davis and West Village into biogas energy,
compost and fertilizer products and provide biogas energy to West Village. The following
findings are extracted from reports prepared by HDR (2011) and Zhang and Zhang (2014).
3.2. Quantification and Characterization of Organic Wastes at UC Davis
3.2.1. Inventory of Organic Residuals
In 2012, the UC Davis main campus produced 123 tons/day of waste. The waste was
characterized by waste type and fate: recycled 76 tons/day, organics 30 tons/day, and landfilled
16 tons/day with a remaining “miscellaneous” fraction. Three main organic waste sources were
identified at UC Davis – food waste, green waste, and animal wastes. More than 85 percent of
the organic waste produced at UC Davis was animal-based, primarily as animal waste and
bedding (e.g., straw or rice hulls) (Figure 8).
Figure 8: Waste Characterization for UC Davis 2012

39
A departmental survey and review of waste disposal records were conducted to develop a
feedstock inventory of the campus organic waste stream. Site visits were made to individual
locations on the campus in Davis and to the health sciences campus in Sacramento. The
purposes of this approach were to:
• Assess the quality and quantity of the materials for assessment of their suitability as
feedstock for anaerobic digesters;
• Gain insights as to the unique issues associated with the generation and consolidation at
each potential source; and
• Determine the logistics of feedstock availability in terms of collection frequency,
method, and responsibility.
The sources and quantities of organic wastes were determined and those potentially suitable for
an anaerobic digester are summarized in Table 14.
Table 14: UC Davis organic waste considered potentially suitable feedstock for READ
facility
Department Facility Waste Stream TS to Digesters (tpy) TS (wet tpd) Dry Solids (tpd) TS (wet lb/d) % SolidsMethane
Production (scfd)
Compactor - Other 170 0.47 0.08 932 18% 1,539
Compactor - Food
Pulper80 0.22 0.04 438 18% 724
Waste Oil 3.12 0.01 0.00 17 18% 28
Compactor 170 0.47 0.08 932 18% 1,539
Waste Oil 2.26 0.01 0.00 12 18% 38
Olive Center Olive Press Olive Pomace 10 0.03 0.01 55 29% 81
Dairy Manure 2600 7.12 3.42 14,247 48% 32,483
Feed LotManure + Straw
Bedding1440 3.95 0.63 3,945 16% 6,014
SheepManure + Straw
Bedding300 0.82 0.13 1,644 16% 1,253
BeefManure + Straw
Bedding100 0.27 0.04 548 16% 414
Horse (Cole
Facility)
Manure + Straw
Bedding460 1.26 0.20 2,521 16% 2,356
GoatManure + Straw
Bedding150 0.41 0.08 822 19% 811
Straw Bedding 371 1.02 0.33 2,033 32% 2,370
Dry Lots 35 0.10 0.03 192 32% 213
Barn 1530 4.19 0.80 8,384 19% 6,209
Pasture 510 1.40 0.60 2,795 43% 1,403
ASUCDCoffee
House/MU
Pre-Consumer
Food Waste50 0.14 0.05 274 38% 635
Med Center New Facility Canola Shortening 11 0.03 0.01 60 18% 100
Robert Mondavi Institute for Wine and Food StudyWinery Pomace 5 0.01 0.00 27 29% 40
Food Service Cafeterias Grease Trap Waste 104 0.28 0.04 571 15% 1,465
Equistrian CenterCampus
Recreation
Segundo
Trecero and
Cuarto/Oxford
Sodexho (Food
Waste)
Animal Science
Center for
Equine Health
Center for
Equine Health
3.2.2. Sampling and Analysis of Organic Waste
An extensive characterization study was carried out to investigate the potential biogas yield of
organic waste with a high potential for inclusion in the READ facility. Samples were taken
from various sources and analyzed in the laboratory for physical and chemical characteristics
relevant to anaerobic digestion. Their biogas and methane generation potential were
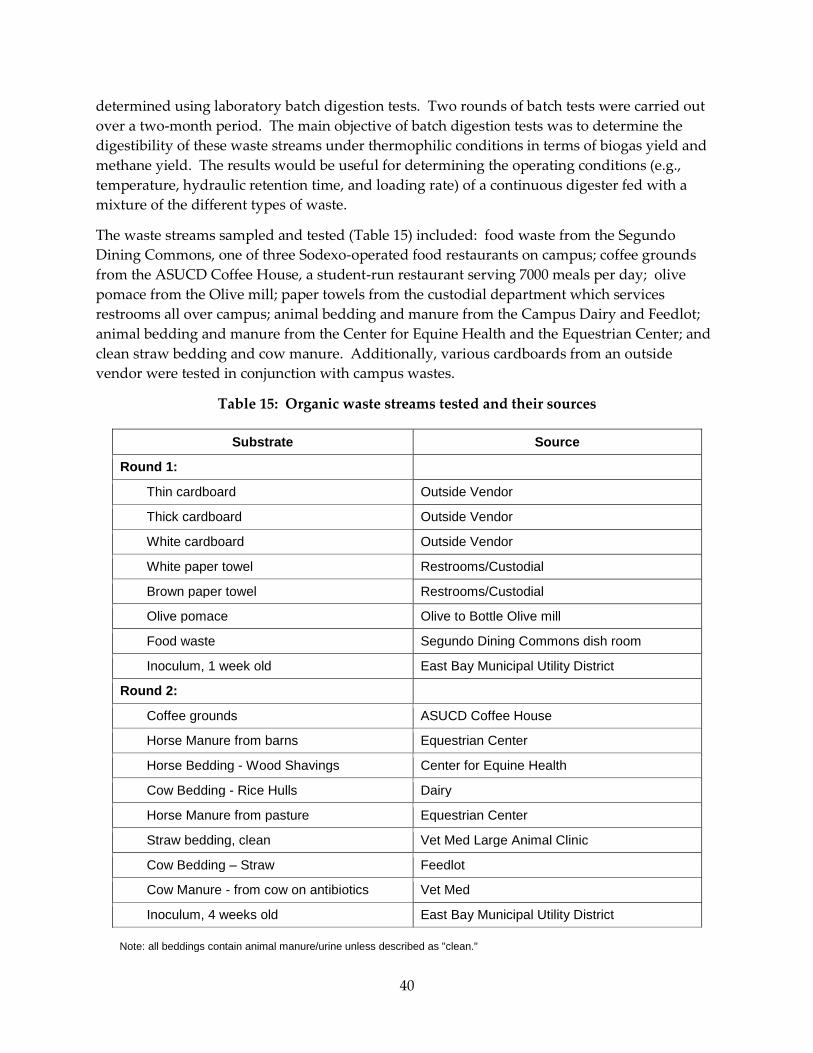
40
determined using laboratory batch digestion tests. Two rounds of batch tests were carried out
over a two-month period. The main objective of batch digestion tests was to determine the
digestibility of these waste streams under thermophilic conditions in terms of biogas yield and
methane yield. The results would be useful for determining the operating conditions (e.g.,
temperature, hydraulic retention time, and loading rate) of a continuous digester fed with a
mixture of the different types of waste.
The waste streams sampled and tested (Table 15) included: food waste from the Segundo
Dining Commons, one of three Sodexo-operated food restaurants on campus; coffee grounds
from the ASUCD Coffee House, a student-run restaurant serving 7000 meals per day; olive
pomace from the Olive mill; paper towels from the custodial department which services
restrooms all over campus; animal bedding and manure from the Campus Dairy and Feedlot;
animal bedding and manure from the Center for Equine Health and the Equestrian Center; and
clean straw bedding and cow manure. Additionally, various cardboards from an outside
vendor were tested in conjunction with campus wastes.
Table 15: Organic waste streams tested and their sources
Substrate Source
Round 1:
Thin cardboard Outside Vendor
Thick cardboard Outside Vendor
White cardboard Outside Vendor
White paper towel Restrooms/Custodial
Brown paper towel Restrooms/Custodial
Olive pomace Olive to Bottle Olive mill
Food waste Segundo Dining Commons dish room
Inoculum, 1 week old East Bay Municipal Utility District
Round 2:
Coffee grounds ASUCD Coffee House
Horse Manure from barns Equestrian Center
Horse Bedding - Wood Shavings Center for Equine Health
Cow Bedding - Rice Hulls Dairy
Horse Manure from pasture Equestrian Center
Straw bedding, clean Vet Med Large Animal Clinic
Cow Bedding – Straw Feedlot
Cow Manure - from cow on antibiotics Vet Med
Inoculum, 4 weeks old East Bay Municipal Utility District
Note: all beddings contain animal manure/urine unless described as "clean."

41
3.2.3. Biogas Yield and Production Rate
Laboratory-based biogas yields for the thermophilic digesters are provided in Table 16 and
Table 17. The total digestion times for Round 1 and Round 2 were 18 days and 37 days,
respectively, at which time the biogas production had leveled off for most of the digesters.
Biogas yield varied from 96 (wood shavings) to 858 ml/gVS (food waste) and methane content
of biogas varied from 58 to 70 percent. The biogas yield of dairy cow manure and horse manure
is 338 and 374, respectively. Food waste had the highest biogas yield, 858 mL/gVS. Olive
pomace has a lower biogas yield, 509 mL/gVS. The biogas yields of cardboard and paper towel
samples ranged from 465 to 606 mL/gVS.
Table 16: Biogas and methane yields and final characteristics of the organic wastes tested in
round 1 after 18 days of thermophilic digestion at F/M of 1.0
Parameter Thin
cardboard Thick
cardboard White
cardboard
White paper towel
Brown paper towel
Olive pomace
Food waste
Biogas Yield (mL/gVS)
529 606 465 505 547 509 858
Methane Yield (mL/gVS)
306 356 262 329 324 350 608
Final CH4 Content of biogas (%)
59.2% 59.7% 58.0% 65.1% 60.3% 67.9% 70.0%
Initial pHa 8.23 8.22 8.21 8.20 8.17 8.15 8.20
Final pHa 7.17 7.14 7.13 7.25 7.19 7.17 7.21
a The measured pH value includes substrate and sludge together.
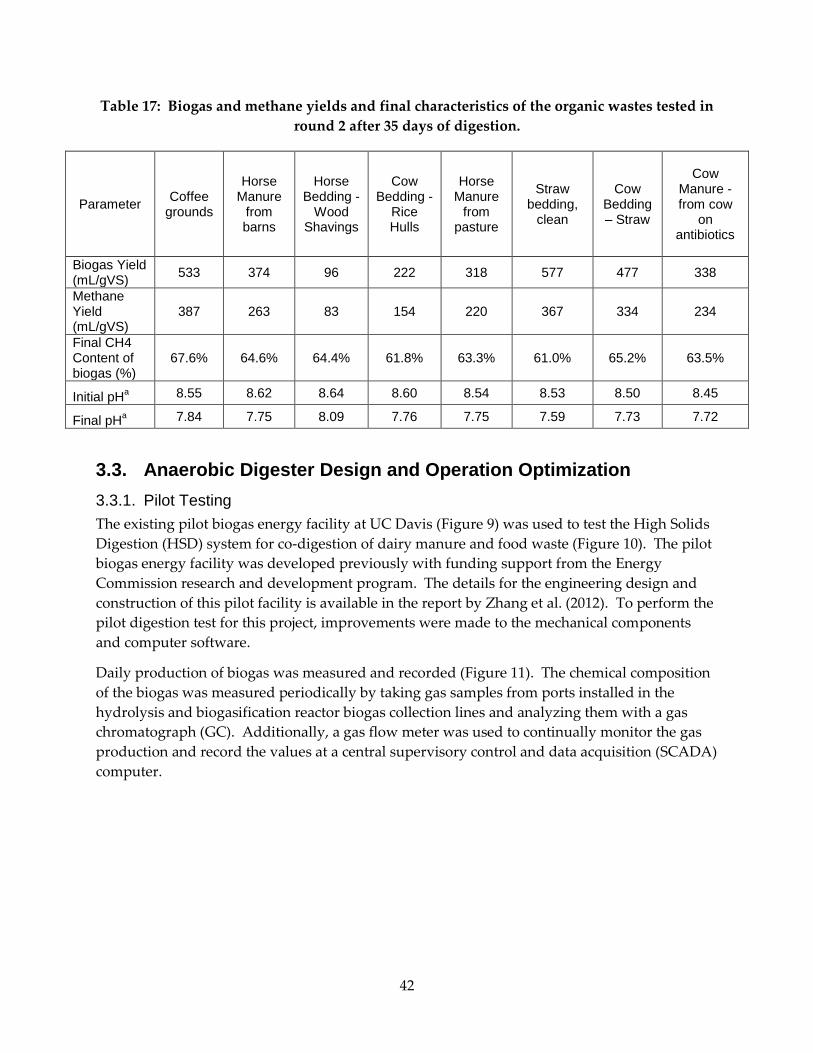
42
Table 17: Biogas and methane yields and final characteristics of the organic wastes tested in
round 2 after 35 days of digestion.
Parameter Coffee
grounds
Horse Manure
from barns
Horse Bedding -
Wood Shavings
Cow Bedding -
Rice Hulls
Horse Manure
from pasture
Straw bedding,
clean
Cow Bedding – Straw
Cow Manure - from cow
on antibiotics
Biogas Yield (mL/gVS)
533 374 96 222 318 577 477 338
Methane Yield (mL/gVS)
387 263 83 154 220 367 334 234
Final CH4 Content of biogas (%)
67.6% 64.6% 64.4% 61.8% 63.3% 61.0% 65.2% 63.5%
Initial pHa 8.55 8.62 8.64 8.60 8.54 8.53 8.50 8.45
Final pHa 7.84 7.75 8.09 7.76 7.75 7.59 7.73 7.72
3.3. Anaerobic Digester Design and Operation Optimization
3.3.1. Pilot Testing
The existing pilot biogas energy facility at UC Davis (Figure 9) was used to test the High Solids
Digestion (HSD) system for co-digestion of dairy manure and food waste (Figure 10). The pilot
biogas energy facility was developed previously with funding support from the Energy
Commission research and development program. The details for the engineering design and
construction of this pilot facility is available in the report by Zhang et al. (2012). To perform the
pilot digestion test for this project, improvements were made to the mechanical components
and computer software.
Daily production of biogas was measured and recorded (Figure 11). The chemical composition
of the biogas was measured periodically by taking gas samples from ports installed in the
hydrolysis and biogasification reactor biogas collection lines and analyzing them with a gas
chromatograph (GC). Additionally, a gas flow meter was used to continually monitor the gas
production and record the values at a central supervisory control and data acquisition (SCADA)
computer.
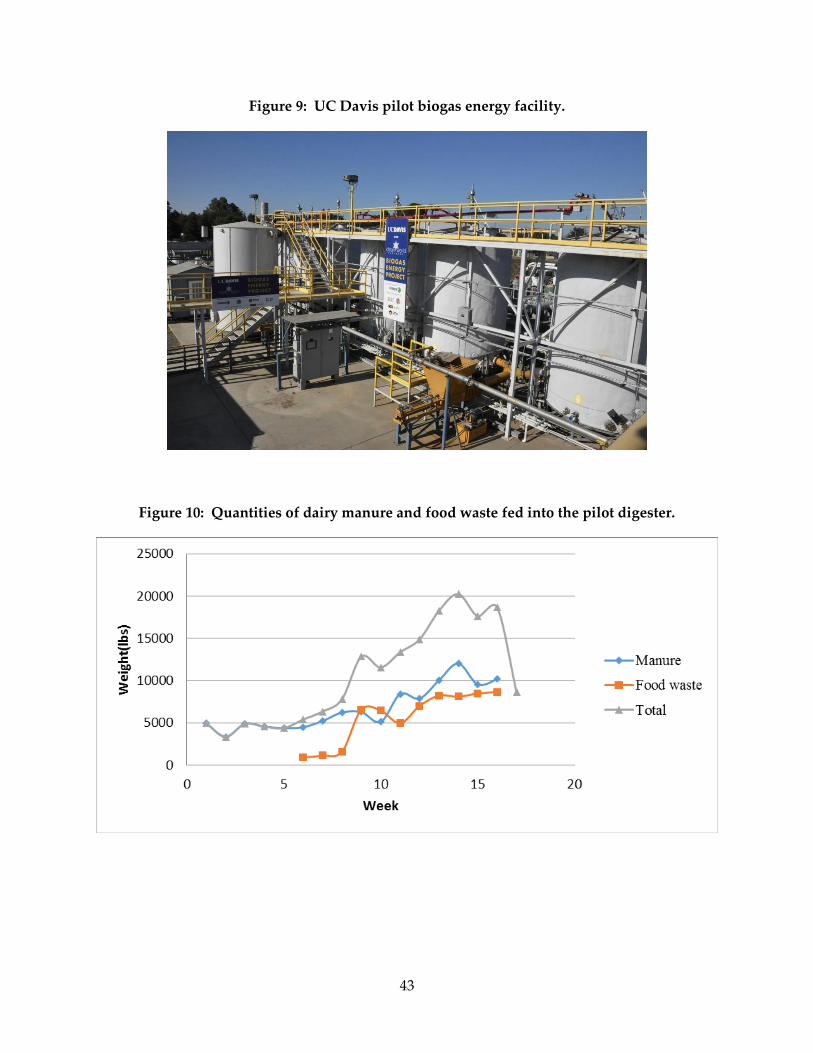
43
Figure 9: UC Davis pilot biogas energy facility.
Figure 10: Quantities of dairy manure and food waste fed into the pilot digester.

44
Figure 11: Biogas production from pilot digester fed with dairy manure and food waste
The pilot biogas energy facility used a comprehensive computer control and monitoring system
for the operation and data collection. The computerized control system was used to monitor all
mechanical components and various processes. Lighted and animated control panels provided
the indication of the operational status of all mechanical, operational and process components.
The operator(s) was able to control and oversee the various processes from the computer station
and make required adjustments and changes as needed.
Once the feedstock (dairy manure or food waste) arrived at the pilot plant, it was weighted and
sampled. The samples were quickly transported to the Bioenvironmental Engineering Research
Laboratory for solids and moisture analysis. Samples were also taken regularly from hydrolysis
and biogasification reactors to measure solids and ammonia contents and pH. The biogas
samples were taken from the biogas collection line to measure the contents of methane, carbon
dioxide and hydrogen.
Food waste was stored in collection bins and delivered to pilot digester once a week. Dairy
manure was scraped from UC Davis Dairy Farm and transferred to pilot digester by truck once
a week. Initial operation started with feeding dairy manure from April 2012 for a month with
about 5000 lbs. per week. Co-digestion operation started from May 2012 with feeding about
1000 lbs. food waste per week and then increased to 6000 lbs. per week.
From 5/15/2012 to 7/20/2012, 65 tons including 39 tons of dairy manure and 26 tons of food
waste were fed into the pilot digesters. The VS loading rate of dairy manure and food waste
was approximately 1:1. Dairy manure had total solids content range in 17 to 45 percent with
average of 32 percent and volatile solids content ranged in 11 to 21 percent with average of 16
percent. VS/TS data of dairy manure were relatively low compared with previous batch

45
digestion dairy manure sample. Scrape process on the farm collected much more sands and dirt
contributing to high fixed solids content. Food waste had total solids content range in 12
percent to 31 percent with average of 25 percent. VS/TS data of food waste were relatively high
with average of 94 percent. The average biogas yield was 613 ml/g-VS (9.83 cf/lb-VS) with
average methane content of 62 percent.
3.3.2. Effluent Treatment
After one month start-up operation, the effluent samples of pilot digesters were collected once a
week and analyzed for pH, solids and nutrient contents. Total Solids content of digester
effluent ranged from 3.3 to 4.7 percent and Volatile Solids from 2.5 to 3.6 percent. As shown in
Figure 12, the pH of the digester effluent has increased gradually throughout the operation
period and became stable at 7.4-7.6 toward the later period of operation. As shown in Figure 13,
ammonia concentrations increased over time with the increasing loading and were stabilized at
around 2000 mg/L toward the end of operation.
Figure 12: pH of pilot digester effluent

46
Figure 13: Ammonia concentration of pilot digester effluent
One week after loading ceased, samples were analyzed for nutrient content after processing
through a microfiltration unit. The nutrient contents of these samples are presented in Table 18.
In order to reduce the odors and chemical oxygen demand of the digester effluent and also
partially convert ammonia into nitrate to result a concentrated liquid fertilizer product that
contains mixed ammonia and nitrate, an integrated treatment system was designed as shown in
Figure 14 for recovery of nutrients and water.
The digester effluent was processed through a bench-scale microfiltration unit. The filtration
performance was assessed by comparing the permeate with raw digester effluent. The total
suspended solids (TSS) was reduced from 6845 mg/L to less than 1 mg/L, representing close to
100 percent removal. The chemical oxygen demand (COD) was reduced from 14500 mg/L to
below 2000 mg/L, representing approximately an 88 percent removal.
The evaluation of the aerobic (aeration) treatment used a bench-scale sequencing batch reactor
that was designed as a nitrification system. The operating conditions of the SBR were
controlled such that the nitrification was allowed to occur while ammonia loss through
volatilization was minimized so that as much as nitrogen was kept in the effluent for future
utilization. About 80 percent COD removal was achieved, and over 88 percent ammonia
removal and 70 percent nitrogen conversion were also accomplished (Table 19). However,
there was about 19 percent nitrogen loss due to volatilization. About 80 percent of converted
nitrogen was nitrite nitrogen instead of nitrate nitrogen. Nitrate nitrogen was more desired
than nitrite nitrogen. Longer retention time might be needed in the second SBR in order to
achieve more complete nitrification.

47
Table 18: Nutrient Analysis for Permeate and Retentate Samples (Wet basis)
Element Unit Permeate Retentate
Total C mg/L 1390 24110
Total N mg/L 1170 2710
NH4-N mg/L 1120 13
NO3-N mg/L <0.1 39
P mg/L 3.34 1321
S mg/L 29.9 841
K mg/L 668 835
Ca mg/L 20.9 1451
Mg mg/L 29.8 305
Na mg/L 396 467
Cl mg/L 461 424
Fe mg/L 1.95 3091
Zn mg/L 0.04 148
Mn mg/L <0.02 21
Cu mg/L 0.05 13
B mg/L 0.88 2
Cd mg/L <0.01 <0.01
Cr mg/L <0.01 1
Pb mg/L <0.05 1
Ni mg/L 0.03 1
Mo mg/L 0.02 0.2
Al mg/L <0.5 693
Figure 14: Integrated treatment system for recovery of nutrients and water from digester
effluent
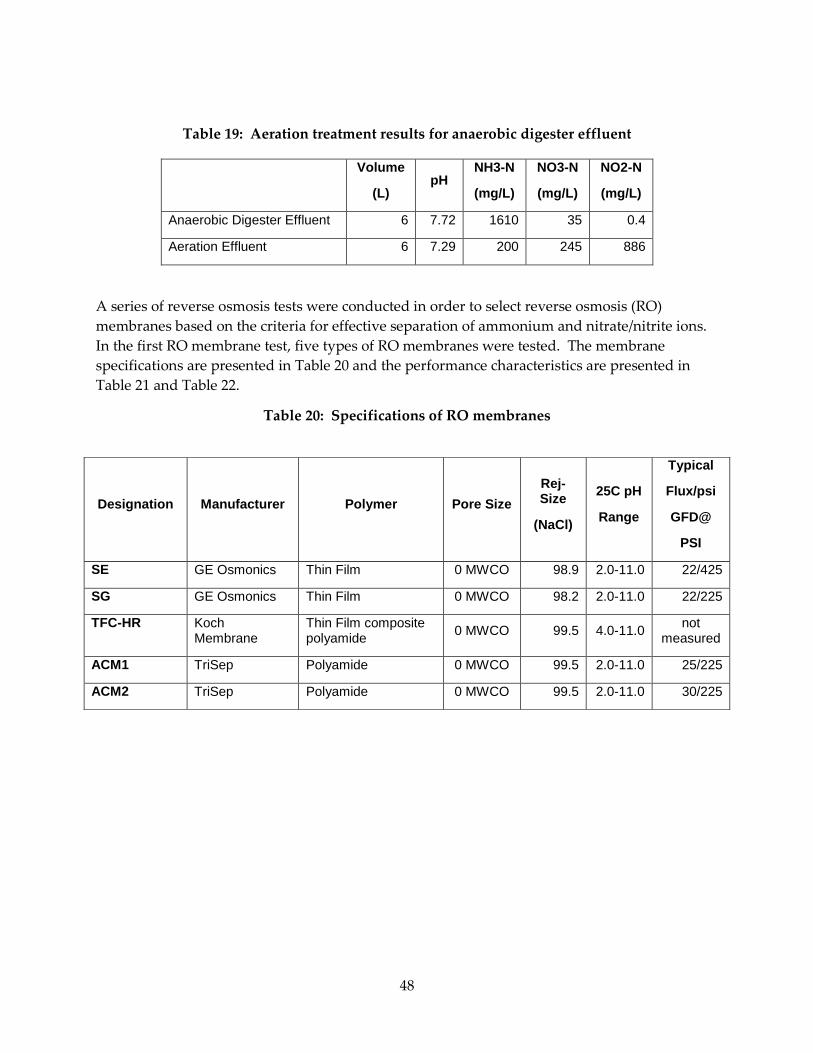
48
Table 19: Aeration treatment results for anaerobic digester effluent
Volume
(L) pH
NH3-N
(mg/L)
NO3-N
(mg/L)
NO2-N
(mg/L)
Anaerobic Digester Effluent 6 7.72 1610 35 0.4
Aeration Effluent 6 7.29 200 245 886
A series of reverse osmosis tests were conducted in order to select reverse osmosis (RO)
membranes based on the criteria for effective separation of ammonium and nitrate/nitrite ions.
In the first RO membrane test, five types of RO membranes were tested. The membrane
specifications are presented in Table 20 and the performance characteristics are presented in
Table 21 and Table 22.
Table 20: Specifications of RO membranes
Designation Manufacturer Polymer Pore Size
Rej-Size
(NaCl)
25C pH
Range
Typical
Flux/psi
GFD@
PSI
SE GE Osmonics Thin Film 0 MWCO 98.9 2.0-11.0 22/425
SG GE Osmonics Thin Film 0 MWCO 98.2 2.0-11.0 22/225
TFC-HR Koch Membrane
Thin Film composite polyamide
0 MWCO 99.5 4.0-11.0 not
measured
ACM1 TriSep Polyamide 0 MWCO 99.5 2.0-11.0 25/225
ACM2 TriSep Polyamide 0 MWCO 99.5 2.0-11.0 30/225

49
Table 21: Performance of RO membranes for separation of ammonium and nitrate
Membrane Type
NO3-N NH4-N
Permeate (mg/L)
Concentrate (mg/L)
Wash water (mg/L)
Permeate (mg/L)
Concentrate
mg/L)
Wash water (mg/L)
ACM2 146 172 233 245
SE 190 228 75 92.6
TFC-HR 29 620 37 17.5 695 105
SG 23 310 72 16.8 290 30
ACM1 37 320 66 16.4 137 44
Table 22: Recovery of nutrients after RO treatment
Membrane Type
NO3-N rejection factor (%)
NO3-N
Yield_1
(%)
NH4-N rejection factor (%)
NH4-N
Yield_1
(%)
ACM2 27 74 7 10
SE 5 34 70 11
TFC-HR 86 73 93 67
SG 89 81 93 62
ACM1 82 91 93 58
3.4. Project Planning and Engineering
The detailed analysis for a biodigester project at UC Davis was included in the feasibility study
prepared HDR (2011). This feasibility study was is a joint result of the Energy Commission
RESCO grant and a Department of Energy Community Renewable Energy Deployment Grant
to UC Davis. RESCO-funded results reported above were used in the feasibility analysis.
3.4.1. Site Evaluation
Three sites were evaluated for the location for the READ facility on the UC Davis campus:
(1) the existing UC Davis landfill on the west side of County Road 95; (2) Hopkins Road near
the University Airport; and (3) the UC Davis wastewater treatment plant south of Interstate 80.
The primary differences between the sites related to costs of relocating existing uses and
compatibility of neighboring uses. Detailed analysis is presented in HDR (2011). After
considering all factors, the decision was made to locate the READ facility and the campus
landfill site.
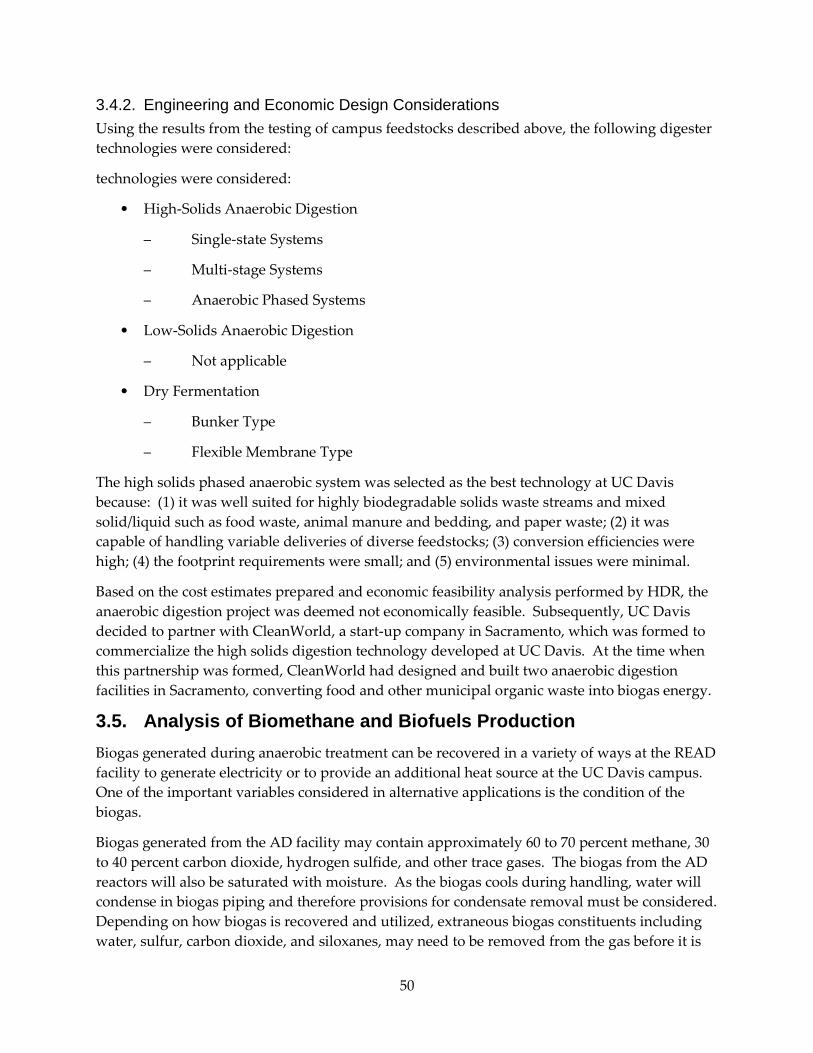
50
3.4.2. Engineering and Economic Design Considerations
Using the results from the testing of campus feedstocks described above, the following digester
technologies were considered:
technologies were considered:
• High-Solids Anaerobic Digestion
– Single-state Systems
– Multi-stage Systems
– Anaerobic Phased Systems
• Low-Solids Anaerobic Digestion
– Not applicable
• Dry Fermentation
– Bunker Type
– Flexible Membrane Type
The high solids phased anaerobic system was selected as the best technology at UC Davis
because: (1) it was well suited for highly biodegradable solids waste streams and mixed
solid/liquid such as food waste, animal manure and bedding, and paper waste; (2) it was
capable of handling variable deliveries of diverse feedstocks; (3) conversion efficiencies were
high; (4) the footprint requirements were small; and (5) environmental issues were minimal.
Based on the cost estimates prepared and economic feasibility analysis performed by HDR, the
anaerobic digestion project was deemed not economically feasible. Subsequently, UC Davis
decided to partner with CleanWorld, a start-up company in Sacramento, which was formed to
commercialize the high solids digestion technology developed at UC Davis. At the time when
this partnership was formed, CleanWorld had designed and built two anaerobic digestion
facilities in Sacramento, converting food and other municipal organic waste into biogas energy.
3.5. Analysis of Biomethane and Biofuels Production
Biogas generated during anaerobic treatment can be recovered in a variety of ways at the READ
facility to generate electricity or to provide an additional heat source at the UC Davis campus.
One of the important variables considered in alternative applications is the condition of the
biogas.
Biogas generated from the AD facility may contain approximately 60 to 70 percent methane, 30
to 40 percent carbon dioxide, hydrogen sulfide, and other trace gases. The biogas from the AD
reactors will also be saturated with moisture. As the biogas cools during handling, water will
condense in biogas piping and therefore provisions for condensate removal must be considered.
Depending on how biogas is recovered and utilized, extraneous biogas constituents including
water, sulfur, carbon dioxide, and siloxanes, may need to be removed from the gas before it is
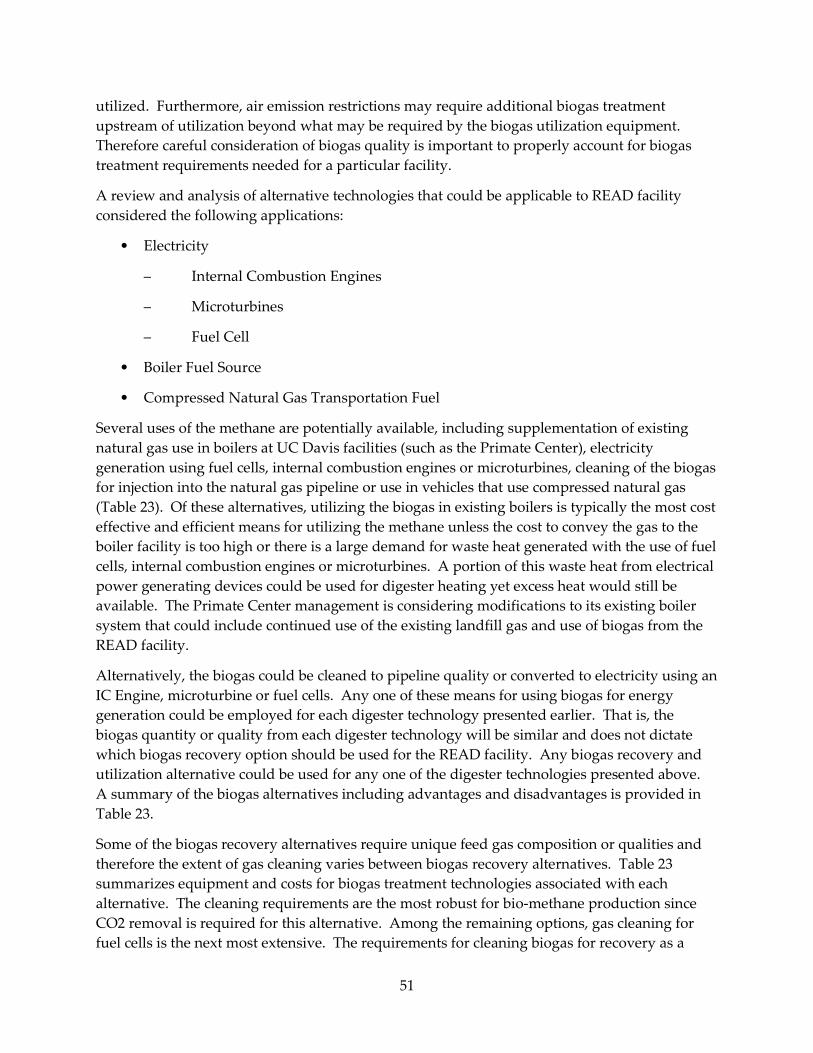
51
utilized. Furthermore, air emission restrictions may require additional biogas treatment
upstream of utilization beyond what may be required by the biogas utilization equipment.
Therefore careful consideration of biogas quality is important to properly account for biogas
treatment requirements needed for a particular facility.
A review and analysis of alternative technologies that could be applicable to READ facility
considered the following applications:
• Electricity
– Internal Combustion Engines
– Microturbines
– Fuel Cell
• Boiler Fuel Source
• Compressed Natural Gas Transportation Fuel
Several uses of the methane are potentially available, including supplementation of existing
natural gas use in boilers at UC Davis facilities (such as the Primate Center), electricity
generation using fuel cells, internal combustion engines or microturbines, cleaning of the biogas
for injection into the natural gas pipeline or use in vehicles that use compressed natural gas
(Table 23). Of these alternatives, utilizing the biogas in existing boilers is typically the most cost
effective and efficient means for utilizing the methane unless the cost to convey the gas to the
boiler facility is too high or there is a large demand for waste heat generated with the use of fuel
cells, internal combustion engines or microturbines. A portion of this waste heat from electrical
power generating devices could be used for digester heating yet excess heat would still be
available. The Primate Center management is considering modifications to its existing boiler
system that could include continued use of the existing landfill gas and use of biogas from the
READ facility.
Alternatively, the biogas could be cleaned to pipeline quality or converted to electricity using an
IC Engine, microturbine or fuel cells. Any one of these means for using biogas for energy
generation could be employed for each digester technology presented earlier. That is, the
biogas quantity or quality from each digester technology will be similar and does not dictate
which biogas recovery option should be used for the READ facility. Any biogas recovery and
utilization alternative could be used for any one of the digester technologies presented above.
A summary of the biogas alternatives including advantages and disadvantages is provided in
Table 23.
Some of the biogas recovery alternatives require unique feed gas composition or qualities and
therefore the extent of gas cleaning varies between biogas recovery alternatives. Table 23
summarizes equipment and costs for biogas treatment technologies associated with each
alternative. The cleaning requirements are the most robust for bio-methane production since
CO2 removal is required for this alternative. Among the remaining options, gas cleaning for
fuel cells is the next most extensive. The requirements for cleaning biogas for recovery as a

52
supplemental fuel in existing boilers or use in an IC Engine or microturbine are similar and
reflect the lowest cost option. Preliminary cost estimates indicated that the fuel cells would be
approximately two to three times the capital cost of the other alternatives.
Table 23: Summary of Biogas Recovery Alternatives
Biogas Recovery
Alternative
Technology Approach to Biogas Cleaning
Advantages Disadvantages
Recovery in Existing Boilers
Chiller system (moisture removal)
Single stage iron sponge (sulfur removal)
Moderately low cost
Would expand upon the current practice of using landfill gas as a supplement to the natural gas boilers at the Primate Center
Adds complexity to boiler operation
Would be limited to use for sites within close proximity to the Primate Center
IC Engine
Chiller system (moisture removal)
Single stage iron sponge (sulfur removal)
Well established technology
Moderately low cost
Potentially higher NOx could result in higher permitting costs
Microturbine
Chiller system (moisture removal)
Two-stage iron sponge (sulfur removal)
Media filter (particulate removal)
Available in small sizes compatible to UC Davis biogas generation
Less NOx is generated so potentially less permitting
Low efficiency (~25-30% overall efficiency)
Moderately high cost
Less established use
Compressed Natural Gas
Water scrubber (CO2 and H2S removal)
Biofilter (air stripper off-gas)
Available pipelines nearby candidate READ facility sites
Efficient use of gas
Significant biogas cleaning needed
Moderately high cost
Fuel Cell
Chiller system for (moisture removal)
Two-stage iron sponge (sulfur removal)
Activated Carbon Filter (organic sulfur removal)
Media filter (particulate removal)
Highest efficiency (~47% electrical efficiency)
Less NOx is generated, so potentially less permitting
Highest cost
Significant biogas cleaning needed

53
Table 24: Capital and Operating Costs for UC Davis Biodigester
Ultimately, the decision was made to use microturbines for biogas to energy conversion. The
anaerobic digesters are expected to produce 120 cubic feet per minute of biogas containing 55-65
percent CH4, 35-45 percent CO2. Currently the landfill from the UC Davis landfill generates 130
cubic feet per minute (cfpm) of landfill gas (primarily 40-45 percent CH4, 55-60 percent CO2). It
was decided to combine the biogas and landfill gas for co-generation of electricity and heat
using four Capstone C200 Microturbines (CARB approved 31 percent +/- 2 percent efficiency,
each rated @ 200 kW) and a Rankine-cycle engine for energy recovery from waste heat (rated @
125 kW, dependent on heat available). An integrated biogas to energy conversion system was
designed and built at UC Davis READ facility as shown in Figure 15. The biogas and landfill
gas are cleaned using a series of filters (water vapor via chiller, H2S via iron sponge, siloxanes
and volatile organic carbons via carbon filter).
Figure 15: UC Davis READ digesters, biogas cleaning, and energy generation equipment
54
CHAPTER 4: Technology Transfer and Wide Scale Implementation Plan
4.1 Technology Transfer and Wide Scale Implementation Plan
4.1.1 The Current Landscape of ZNE and Understanding the Obstacles to Wide Scale Implementation
ZNE as a goal for new development has gained considerable interest as a strategy to save
energy and cut greenhouse gas emissions. A ZNE building or community as defined for this
project is one that uses a combination of improved efficiency and distributed renewable
generation to cover at least 100 percent of its net annual energy use. California agencies have
set ambitious goals for ZNE in new homes by 2020 and in commercial buildings by 2030 and are
pursuing various policies and strategies to achieve those goals5. Furthermore, in 2012,
California Governor Jerry Brown signed Executive Order B-18-12 that sets a ZNE target for 50
percent of the square footage of existing state-owned buildings by 2025 and ZNE for all new or
renovated state buildings beginning design after 2025.
The intent of this analysis (White et al. March 2014a and March 2014b) is to augment the
existing body of literature with the lessons learned from a project team actively seeking to
create a large-scale ZNE project. Existing literature commonly recommends sharing the lessons
learned in specific projects.6 The fact that relatively few ZNE projects have been constructed to
meet the strict financial demands of the private investment market makes the West Village case
study especially relevant to current policy discussion and future deployment of ZNE buildings
by the private sector.
As a result of California’s goals for transforming the building industry by encouraging ZNE
outcomes for all new residential construction by 2020 and all new commercial construction by
2030, ZNE buildings and communities are the subject of a growing body of literature and
research. Such literature includes “The Road to ZNE: Mapping Pathways to ZNE Buildings in
California” by the Heschong Mahone Group, Inc. (2012), and “The Technical Feasibility of Zero
Net Energy Buildings In California” (December 2012) by Arup7 This research explores, at a
5 California Public Utilities Commission Energy Efficiency Strategic Plan, various documents,
http://www.cpuc.ca.gov/PUC/energy/Energy+Efficiency/eesp/
6 Heschong Mahone Group, Inc., “The Road to ZNE: Mapping Pathways to ZNE Buildings in California,”
November 20, 2012,
http://www.calmac.org/publications/The_Road_to_ZNE_Report_CALMAC_PGE0327.01.pdf.
7 Arup North America Ltd., The Technical Feasibility of Zero Net Energy Buildings in California, December 31,
2012, http://www.energydataweb.com/cpucFiles/pdaDocs/904/
California_ZNE_Technical_Feasibility_Report_Final.pdf.

55
high-level, the broad range of issues that must be addressed to enable wide-scale
implementation of ZNE in California. Existing research includes analysis of California’s
building and energy codes, electrical grid infrastructure impacts, utility planning efforts, and
existing and proposed regulatory and policy issues that may contribute to or detract from the
state’s overall ZNE goals.
4.1.2 Challenges for Developers and Builders
Identifying and aligning contractual, reputational, and financial incentives of all team members
from the earliest stages of a project is a necessary step to ensuring attainment of challenging
goals such as ZNE construction. Several key items that were important to the success of West
Village included:
Use of Energy and Financial Models
Energy and financial models were intensively used during all phases of the West Village project
and had significant bearing on the outcome of the project. The use of these models exceeded
that of conventional projects.
Recommendations:
Developers pursing ZNE status should allow time and resources for this process when
preparing project budgets, schedules, and assembling project teams.
Enforcing High Construction Standards
Regardless of the level of analysis and technology that is used in building design, building
performance is significantly dependent on the quality of construction. Basic elements such as
tightly sealed building envelopes, properly installed insulation, and properly installed and
calibrated equipment are often overlooked in the midst of construction. These elements affect
energy consumption of a building and are not easily remedied once a building is complete.
Additionally, inspections by a qualified Home Energy Rating System (HERS) inspector are
given credit by the California Building Code for energy modeling and permitting purposes, as
well by utility incentive programs. For that reason it is important that attention is paid to these
items during the construction process; for West Village DEG recommended inspection by a
qualified third party for the building envelope and mechanical systems. As the owner and
builder of the project, WVCP was incentivized to provide such inspection, as the cost of this
service can be recovered many times over throughout a building’s lifetime as a result of
increased energy savings.
Recommendations:
Conduct inspections during the construction process using an independent third party
Optimizing Airflow
Optimizing airflow in buildings can be addressed to a large degree by good construction
practices as noted above, as well as by passive measures implemented during the design of a
building. The prototypical student housing building, The Ramble, features single-loaded

56
corridors (corridors with apartments on only one side) open to the exterior that allow all
apartment units to receive natural cross-ventilation. Additional passive or near-passive design
features, such as the use of operable windows and ceiling fans, provides occupants with the
option for natural ventilation and air circulation with low or no-energy systems. Davis’s large
temperature swing from day to evening is ideal for nighttime natural ventilation during
summer months and daytime natural ventilation during winter months. The impact on building
energy use as a result of these systems is dependent on the behavior of building users, can vary
widely from occupant to occupant, and is therefore difficult to predict accurately.
Airflow as a result of mechanical systems is more directly controllable by design. Typical
inefficiencies involve incorrectly sized or inefficiently routed ductwork, leaky ducts, and
inefficiently sized mechanical equipment. At DEG’s recommendation a third party review of
these issues was implemented at West Village, including detailed HVAC calculations for
equipment and duct sizing by the project’s mechanical designers, and for tightly sealed ducts
located in the conditioned spaces of buildings. Title 24 provides credit for these measures, as do
utility incentive programs, both of which benefited West Village.
While approaches like these would ideally be standard practice in the building industry,
historically they have been the exception. This situation is changing due to the increasing
stringency of energy efficiency regulations and the proliferation of green building rating
systems such as LEED, which provides credit for these measures.
Recommendations:
Design buildings for maximum passive natural ventilation.
Engineer mechanical ventilation (airflow and duct sizes) specifically for the needs of
each space; do not rely on standards.
Specify tightly sealed ductwork, verified through third party inspection.
Hot Water Heating
Heating water for domestic use constitutes the largest use of energy in the typical base-case
scenario. Reducing the energy use of this function can result in substantial net energy savings.
While solar hot water heating was not used on the project, the next most efficient method of
heating water, a heat pump water heater system, was chosen instead.
Compared to conventional gas or electric water heaters, air-to-water heat pump systems are
relatively complex and are typically not used in market-rate developments. However, the U.S.
Department of Energy finds that such systems can reduce the energy required for water heating
by 33 – 66 percent over conventional electric storage water heaters.8 Their use at West Village
was important in achieving the project’s energy saving goals. Heat pump systems, which work
8 “Heat Pump Water Heaters | Department of Energy,” Heat Pump Water Heaters | Department of Energy,
accessed August 13, 2013, http://energy.gov/energysaver/articles/heat-pump-water-heaters.

57
best in a climate that averages between 40 F and 90 F year-round,9 are well suited for Davis. The
developer and design team alike consider the heat pump water heater system to be the project’s
most unique approach to energy savings. Despite some early challenges keeping these systems
operating correctly, the issues are now thought to be resolved, and the heat pump water heating
system should continue to provide energy savings for the lifetime of the project.
Water-heating system sizes were minimized to the greatest extent possible by incorporating
water-saving appliances such as high-efficiency horizontal axis washing machines, high-
efficiency dishwashers, and low-flow plumbing fixtures. In addition to high-efficiency water
heaters, the design of the plumbing network itself can degrade or enhance energy efficiency.
Long distances between a water heater and the end use result in lost heat and lost energy. To
reduce this loss, the design of the plumbing infrastructure is optimized to use the shortest runs
of water piping possible. Additionally, all piping providing hot water to the buildings and back
to the water heaters is insulated and installed inside conditioned spaces, where feasible, to
further minimize heat loss.
Recommendations:
Maximize efficiency of hot water systems by reducing pipe runs and fully insulating
supply and return hot water pipes.
Evaluate feasibility of expanding existing incentive programs, or creating new
programs, to increase the market penetration of efficient water heating technologies
such as air-to-water heat pumps.
Space Heating
Space heating accounts for 28 percent of base-case energy use, and DEG was able to reduce this
amount by 50 percent in the energy models they provided. Passive measures improved the
thermal performance of the buildings considerably and accounted for a large percentage of
space heating energy savings. DEG’s recommendation for active systems was a high-efficiency
(15 Seasonal Energy Efficiency Ratio [SEER] / 12.5 Energy Efficiency Ratio [EER]) air heat pump,
which was incorporated into the project. Further energy savings were achieved by installing
ducts inside of conditioned space, where feasible, and by fully sealing and insulating all ducts,
regardless of location. These design and construction measures decrease heat loss and increase
the operating efficiency of HVAC equipment.
Recommendations:
Reduce space heating loads to maximum extent possible through efficient building
envelope design.
Investigate the use of heat-pump systems for remaining space heating.
Lighting and Appliances
9 Ibid.

58
Interior lighting and appliances combined account for 29 percent of the base-case building
energy use. Gross energy use for these functions was reduced through the design of lighting
systems and specification of appliances, but as energy use was reduced in other areas, lighting,
appliances, and miscellaneous loads combined continue to represent the largest percentage of
building energy use.
Measures to address lighting energy use include vacancy sensors integrated into light fixtures
to automatically turn lights off when occupants are not present. DEG recommended, and the
builder implemented, hard-wired high-efficacy lighting in the bedrooms of the multi-family
buildings. This measure is not typically incorporated into projects, as it is not required by
building codes and adds cost to construction. The benefit is that permanently installing these
fixtures reduces the number of (potentially inefficient) occupant-owned lamps that are needed
and ties this light source to vacancy sensors. High efficacy lighting was also installed in kitchens
and bathrooms of each unit, per building code standards.
Researchers at UC Davis are conducting leading-edge research and development of LED light
sources. LED technology offers tremendous potential for energy savings, as it can provide
illumination using a fraction of the energy that high-efficiency fluorescent fixtures use today.
Because of their relatively new status in the marketplace at the time, LEDs had not yet seen
wide market uptake for general area lighting needs and had a high relative first cost compared
to other light types, although due to energy savings and long bulb life these costs can be
recovered several times over. During the product review and selection process the design and
development team analyzed these LED fixtures closely, and ultimately determined that lack of
market standardization and uptake would make them inappropriate selections for the West
Village project.
The decision to use florescent lighting in the multi-family portion of West Village was made in
2009. Since that time the price, market uptake, and standardization of LED fixtures has
improved considerably. Future teams working on high-efficiency projects would be wise to
perform a benefit-cost analysis of these fixtures for their project.
The energy use for many residential appliances is regulated by the federal government, and
these regulations cannot generally be made more stringent by an individual state, which
presents challenges in adopting statewide goals for ZNE construction. However, individual
building owners are free to select appliances that meet their cost and efficiency needs. Because
WVCP will remain the owner of the multi-family and mixed-use buildings on site, they were
able to closely control appliance selection. DEG’s recommendations for appliances included
Energy Star-rated dishwashers, refrigerators, washers and dryers.
Recommendations:
Market penetration of LED technology is advancing rapidly. Conduct benefit-cost
analysis for including LED lighting in a proposed project. Such analysis should
incorporate lifetime costs such as increased bulb life and reduced electrical
consumption.

59
Consider providing incentives, such as low-cost energy-efficient appliance packages, to
entice homebuyers to purchase efficient appliances for their new homes.
Furnish rental housing with energy-efficient appliances.
Control of Miscellaneous Electrical Loads
Miscellaneous electrical loads (MEL), sometimes called ‘plug loads,’ from devices owned and
operated by building occupants constitute the majority of energy use in buildings that have
been designed to high standards of operational efficiency. These loads also represent energy use
that is largely out of the control of building designers and owners of multi-tenant buildings, and
this energy use is increasing due to the proliferation of electronic devices. Central to efforts to
curb the increase of MEL is the creation of feedback mechanisms that inform building occupants
about the amount of energy being consumed and providing them with appropriate incentives
to conserve and the ability to control it easily. The market for controls is rapidly growing and
ranges from devices that are built-in to a building’s infrastructure (the electrical system,
automated building management system, or both) to loose devices easily installed and operated
by building occupants. In an effort to reduce building electrical consumption, WVCP contracted
with a manufacturer of a loose device but was faced with serious implementation challenges
that ultimately led to the device’s removal from the project.
The chosen loose devices resembled traditional surge-protector power strips typically used for
computer and stereo equipment. What made the devices used at West Village unique was the
fact that each was equipped with data recording capability and WiFi functionality that allows it
to transmit historical and real-time data to a user-interface, which can be accessed on the user’s
computer or smart phone. The interface provides users with the ability to turn individual
devices on or off in real time or to program schedules for the operation of particular devices. In
addition to reducing the energy use of devices that are constantly on, this type of controllability
also reduces so-called phantom energy loads associated with electronic devices that are turned
off but still draw power. The graphical, user-friendly interface allows users to view current and
past energy use snapshots in a simple and readily comprehensible way.
Conceptually, these devices addressed the dual needs of providing feedback to users about
their energy use and a simple and direct way to control it. At the time of implementation in
2011, the concept of remote management of MEL was still relatively new, and unforeseen
problems quickly emerged. The WiFi signals generated by the devices operated on the same
frequency as building-integrated WiFi Internet service, and may have caused or contributed to a
widespread outage of student Internet service at critical periods. Additionally, the device’s WiFi
signal caused a disruption of the PV system’s automated wireless data gathering and reporting,
resulting in approximately 45 days of lost information regarding energy generation of the PV
system. Unable to provide a remedy in the field for these problems, the manufacturer of the
devices and the project developer removed them from the project after the source of the issue
had been identified. In the meantime, the developer was tasked with resolving student’s
complaints about Internet access being lost in the midst of midterm exams, many of which are
administered online. To date, a replacement for the devices has not been selected and MEL

60
remain unmanaged on the West Village project, although the manufacturer of the devices, and
the industry as a whole, have since worked to eliminate such conflicts with their hardware.
Recommendations:
Provide intuitive, non-obtrusive but powerful method of user control and feedback for
MEL.
Test compatibility of new systems with other building infrastructure prior to
widespread deployment.
Proposals to control the amount of energy consumed by MEL also emerged in CES’s 2009 ZNE
proposal. The use of a master switch to control all lighting and miscellaneous loads in a unit
would provide occupants with the ability to easily limit energy use while away from home. CES
took this concept further and recommended that this switch be integrated with student ID
cards, allowing for tracking of occupant energy-use behavior. The developer chose not to
incorporate this feature into the project due to concerns over cost as well as lifestyle effect on
occupants. Wiring apartment units in this manner would add small incremental cost per unit,
but when multiplied by 663 units would result in notably increased project cost. Additionally,
coordinating the use of a master switch among four independent apartment occupants could be
difficult. As a result, MEL remains unmanaged at West Village and represents a large
remaining area of energy savings for the project.
NEM vs. VNM costs for PV inverters
The West Village development team chose to take advantage of NSHP incentives for PV arrays
in 2010, well after construction had begun on West Village. NHSP incentives could not be
applied to solar installations serving more than one residential unit in 2010, but have since been
modified to allow for virtual net metering in multifamily buildings. As a result of this
limitation, WVCP LLC, who had assumed that virtual net metering would be used in the
multifamily buildings at West Village, had to undertake design changes to the project in the
midst of construction. The total amount that was added to the construction cost of West Village
due to these revisions was not disclosed by WVCP, but included the cost of 671 inverters and
significant amounts of electrical infrastructure such as added conduit, conductors, and
underground connectors. In addition to the added cost of construction (which for a typical
building is a small percentage of total cost of ownership over a building’s lifetime), the addition
of multiple small electrical inverters will create ongoing maintenance and replacement costs
over the lifetime of the buildings. With an industry-standard lifespan of 10-12 years, each
inverter will need to be replaced five to seven times on average during the 65-year ground lease
period. Using a current cost average of $1,454 per inverter, this amounts to a lifetime ownership
cost of between $4,878,458 and $6,829,841 for the project’s owners. Had a VNM arrangement
been available, fewer inverters would have been used, and those would have been larger and
potentially more durable. Although the design of the system under that scenario would have
determined the actual costs, rough estimates indicate a $477,512 difference in costs for inverters
only and between $2,387,558 and $3,342,581 difference in total lifetime ownership costs for those

61
inverters. These amounts represent added costs that WVCP (or any developer of market-rate
multi-family homes) realized as the result of NEM rules in place at the time.
California’s NEM rules were revised in late 2011 and now allow VNM on market-rate, multi-
family housing projects. WVCP has taken advantage of this rule change and has modified the
design of the PV system for the apartment buildings built after that date. For the West Village
project, 156 apartment units are affected by this change and will be supplied with energy from
PV systems in a VNM configuration. Examining costs for inverters only reveals that under the
VNM arrangement 156 apartment units are provided with 65 inverters at a total cost of
$170,430, for an average of $1,109 per apartment for inverters only. This compares with an
average cost per apartment of $1,875 for inverters under the previous arrangement. Under the
VNM arrangement, lifetime ownership costs are projected to be 17 percent of the costs incurred
under the NEM configuration.
The various incentive programs that were used to finance the installation of PV were sufficient
to allow WVCP to include the system in the project with limited to no effect on ROI and no net
financial effect on the occupants of West Village. Reductions in the cost of the PV system would
have allowed the same incentives to purchase larger amounts of PV generating capacity, or
would have allowed the developer to install the same amount of PV while using less funding
from incentive programs. Given that available pools of incentive funding are limited statewide,
this approach would have allowed the incentives to support additional renewables on other
projects.
Recommendations:
Allow for VNM arrangements for multi-family and single-family homes.
Arrange incentive programs to recognize community-scale renewable generation.
CEC and CPUC should continue to examine size limits and other implementation effects
of NEM regulations to ensure that they do not result in an inefficient use of state
resources intended to promote the use of renewable energy generation.
4.1.3 Challenges for Residents
The performance of any construction project typically fluctuates widely during the early stages
of occupancy as building systems are calibrated, construction errors or omissions are corrected,
and building users gain experience with the operation of the new structure. Critical issues are
discovered during the period of initial building occupancy, and properly identifying and
correcting these issues affects the building’s performance over its lifetime. Having a thorough
and detailed action plan to address this process is a fundamental aspect of high-performance
buildings and has been incorporated into green building rating systems such as the USGBC’s
LEED program. In commercial construction, this process begins with building commissioning
by neutral third parties meeting strict requirements for competency and extends through post-
occupancy surveys that shed light on building functions and user behavior. For complex
commercial buildings, it is not uncommon for the process of measurement, verification, and
adjustments to last one to two years after initial occupancy, or longer. For some new buildings,

62
the implementation of continuous commissioning over the building’s lifetime is becoming more
common. In residential construction, similar needs are addressed by on-site inspections
performed by neutral third-party inspection firms to ensure building functionality. Because
residential construction is typically less complex than commercial construction, the scope and
cost of this process is usually less than for commercial structures, however, the potential for
improvements in building performance are measureable in both cases.
Although it is primarily a residential project, the scale of West Village and the combination of
multiple energy efficiency measures with large amounts of renewable energy generation make
the initial break-in period more complex and lengthy than for typical residential projects.
Multiple systems need to function properly both independently and in concert with one
another. The energy use behavior of building occupants creates an additional variable that is
difficult to model (See section below titled, Building Occupant Behavior). As systems are
optimized and user behavior interventions are made, the energy consumption of the buildings
will begin to stabilize and approach the estimates included in early building energy models.
Building Occupant Behavior
The way occupants use a building is not limited to a single end use of energy. Rather, it spans
every assumption made during the energy modeling process, affects all building systems, and
impacts overall energy use. Some systems at West Village have been designed to override
certain occupant behaviors, such as vacancy sensors on built-in light fixtures to prevent lights
from being left on in unoccupied rooms. Other types of energy-consumptive behavior, such as
having low thermostat set points for air conditioning or multiple electronic devices drawing
power, are more difficult to address with design measures and are hard to quantify specifically
without detailed submetering. Submetering could provide the opportunity for separate billing
for individual users and establish financial incentives to conserve energy.
Education of building users holds additional potential for energy savings, although the nature
of tenancy at West Village presents challenges in this regard. The rental cycle at West Village is
currently arranged to roughly correspond to the UC Davis academic calendar. Leases for every
apartment begin September 1 and are 12 months in duration. Tenants are allowed to renew
leases and remain in an apartment over multiple years. Under this leasing cycle, as is common
with most student housing projects, West Village receives an influx of new tenants every year,
and the process of educating these users about energy use begins anew. The project has not yet
been occupied for sufficient time for data to be collected on energy use of new versus existing
tenants. Gathering and analysis of this data may offer insight into the effectiveness of tenant
education and incentive programs in the future.
Critical to the concept of promoting energy-conscious user behavior is the ability for building
users to receive real-time feedback about how their use of the building impacts energy
consumption. Many companies within the building industry have responded to this need, and a
wide range of devices are available that measure energy use against a pre-established baseline
and inform users about their energy use in real-time as well as over extended periods. The most
common of these devices are digital dashboards that graphically present the information in an

63
easy-to-understand format. Use of these devices requires either the submetering of the
monitored systems or that meters be installed post-construction. One approach for post-
construction installation of metering and control equipment is by the use of loose devices that
are plugged in-line with user-owned equipment (See section above titled, Control of
Miscellaneous Electrical Loads). An approach of this type may be used at West Village in the
future if the benefit can be shown to outweigh the cost for the project owner.4.2 Recommendations for Advancing Successful Adoption of ZNE Communities
California’s regulatory and incentive system is complex and outside the range of expertise of
most participants in a development project. Development teams will benefit from a team
member with specialized policy expertise in these areas. Conversely, a clear regulatory pathway
to attaining ZNE in an economical way is needed to facilitate achieving the state’s goals for ZNE
deployment.
Engagement of the local utility provider early in a project will aid success
ZNE projects are faced with regulatory hurdles unique to energy use and generation. Early and
frequent consultation with local utility providers will minimize confusion and expedite the
decision-making process.
Building users have significant, and unexpected, effects on energy use
As buildings become more energy efficient, the remaining energy demand becomes even more
dependent on those that occupy the building. Addressing this component of energy demand is
critical to achieving ZNE results.
Incentives for renewables need to be acted on quickly
The landscape of incentive programs evolves rapidly relative to the timescales of large
development projects, which tend to require years of planning, approvals, and financial
analysis. Consequently, where possible, participants in large development projects should act
early to lock in incentives.
4.2.1 Lessons Learned
Lesson #1: Creating a ZNE Community is Feasible under Market-Rate Conditions
Above all else, West Village is a real estate development project undertaken by a private
developer in pursuit of profit. Although the developer was contractually obligated to make the
project environmentally responsive, they were not under contract to pursue ZNE status and
only agreed to do so to the degree that WVCP’s ROI could be sustained while providing
market-rate costs to tenants and owners. Developers such as WVCP have institutional investors
that expect returns comparable to any other real estate investment, whether it is sustainable
design or not. WVCP has a fiduciary responsibility to their investors and therefore all measures
of efficiency and renewable generation had to work within their financial framework. Incentives
for renewable generation aided the project and allowed ZNE to be pursued. Similar incentives
64
are available to other developers, although state and federal programs are constantly in flux
and must be considered based on their likely contribution at the time of construction.
The design and construction of West Village is not exotic and is replicable in other private
developments. Site plans for multi-family and single-family homes do take environmental
considerations into account while exceeding real estate industry norms for density and design—
in fact, the density of West Village greatly exceeds typical suburban development indicating
that high-density designs are compatible with the pursuit of ZNE at least on sites with adequate
space for renewable generation. The project does not rely on cutting-edge technology to attain
high levels of energy efficiency. With the exception of the air-to-water heat exchange hot water
heaters, all components of the project are off-the-shelf and readily available to other project
teams. WVCP and their consultants actively sought to avoid including custom or unproven
technologies in the project. Buildings are Type-2 and Type-5 construction, which is typical for
residential buildings in California. The major steps taken to ensure efficient buildings include
careful attention to detail in the design of buildings, heavy reliance and responsiveness to
energy modeling, and on-site quality inspection of construction details by an independent third
party. These techniques are available to any design and construction team in California and are
essential to achieving highly efficient buildings.
Lesson #2: Team Alignment is Critical for Success
Designing an environmentally responsive community was a key goal of UC Davis from the
earliest conceptualization of the project, and a development partner was chosen who was
committed to this objective. As the goals of the project evolved to include the attainment of ZNE
status, all team members, including the developer, UC Davis, and their supporting entities
committed themselves to achieving this goal despite the fact that no one was contractually
obligated to do so. The reality of West Village is that a handful of key decision makers
representing WVCP and UC Davis were committed to attaining ZNE. Without them, it would
not have happened.
The pursuit of ZNE involved effort and risks that a typical project would not experience.
Interviews conducted with key high-level participants of the project revealed a consistent belief
that 30 - 40 percent more effort was required at a management level due to ZNE goals than for a
typical project. Extra effort was needed to address financial, regulatory, and technical
challenges. Most of the key team members shouldered this workload in addition to their regular
jobs and did not receive additional compensation for their effort. Commitment to the challenge
and to “doing the right thing” prevailed to motivate the team, as did reputational benefits.
Risks for the team included financial risks for the developer if anticipated energy efficiency
measures did not perform as anticipated, or if highly efficient buildings proved undesirable to
lease. To date neither concern has borne out.
The alignment of entities at West Village was a unique occurrence that is uncommon in the
construction industry. Seldom do owners, developers, designers and contractors march in
unison towards the same goal, as each typically has different incentives for financial and legal
performance. Frequently the incentives of one entity are in competition with the incentives of

65
another. Although the pursuit of ZNE was not a contractual requirement, three factors
contributed to the alignment of the team’s goals and were critical for the project’s success:
• Flexibility of Approach - Carmel Partners, the major equity partner of WVCP LLC., has
a long track record of developing highly successful conventional real estate projects.
WVCP’s representative on the West Village project took the lead in proving to Carmel
Partner’s senior management team that ZNE could be achieved without sacrificing ROI.
Carmel Partners agreed to the proposed approach. Without this approval, ZNE status
would not have been pursued.
• Owner-Builder - Carmel Partner’s subsidiary, Construction West, acted as the General
Contractor for the West Village project. The fact that the owner of the project was also the
builder eliminated the misalignment of financial incentives that typically exists between
owners and contractors, and ensured close pre-construction coordination between the
development, design, and construction teams. This coordination was important to the
benefit-cost analysis that was performed on various efficiency measures and greatly
expedited construction time, thus reducing costs.
• Reputational Involvement - As noted previously, West Village has extensive media
attention. This coverage began while the project was still in the planning stages and
continues today. One result of this coverage was to publically commit the project’s major
stakeholders to the goal of ZNE, whether they had committed to it privately or not. Backing
away from ZNE goals could have created strong negative public perception of the
responsible party, a perceived risk that none of the participants were willing to take.
Future projects pursuing ZNE status should seek to create alignment of incentives during the
earliest stages of their project. Incorporating the goals of ZNE into contract language and
providing incentives for attainment will help create this alignment. Such performance-based
contracts can be problematic for the insurance companies and attorneys that represent design
professionals, as the actual performance of a building is ultimately out of the designer’s control.
This is an industry-wide issue that needs to be addressed within the construction industry in
the near future, as performance-based contracts are becoming more widespread in the building
industry as high-performance buildings become more commonplace.
Lesson #3: A Rigorous, Active Approach to Energy and Financial Modeling is Critical
West Village was heavily influence by the use of energy and financial modeling before detailed
design began. The fortuitous inclusion of DEG in the project brought many years of experience
in modeling residential energy use to bear on the project, and analysis of the energy
performance and financial impacts of energy-related decisions continued at every stage of the
project. As opposed to sticking with one approach for the project, the design team was
responsive to the energy modeling effort and adapted the design of the project based on input
from the models. This differs somewhat from more traditional methods of energy modeling,
whereby a model is developed at the schematic design phase and not updated again until the
design is complete and ready for permitting. At West Village the models were a living
component of the project and provided continual feedback to the owners and design team. This
66
added effort comes at a price, and DEG was supported by a $500,000 grant from the U.S.
Department of Energy through the Build America program. A takeaway lesson for future
owner and design teams that do not have access to grant funds is to structure consultant fees in
a way that supports a level of involvement of energy modeling by a design team that is
experienced with the technology and is contractually committed to an iterative process of
design and energy modeling.
Financial modeling was used in conjunction with basic energy modeling and was performed by
DEG as well as the owner-builder, WVCP and Construction WEST, respectively. Using a
benefit-cost analysis on individual efficiency measures guided the team in selecting the final
suite of measures that were incorporated into the project. Results of such an analysis will vary
for each project and each site, and are recommended as a means of attaining maximum energy
efficiency per unit of economic investment.
Lesson #4: Engage Local Utility Early and Often
At the start of the project, the West Village team admittedly was inexperienced concerning the
extent of challenges that would be involved with pursuing a ZNE project. UC Davis, WVCP,
and their consultants spent considerable time pursing design options that were ultimately not
incorporated into the project. Such schemes included a community that was fully independent
of the electrical grid except for emergencies, and the Three Loop concept that incorporated
multiple forms of renewable generation into the project. All of these schemes failed to address
the regulations and technical barriers of the utility provider, and were not structured to
conform to the typical financial relationship between the utility provider and the customer.
Early and frequent consultation with a knowledgeable representative of PG&E may have
helped the team to avoid some of this effort, and certainly could have helped the team to
navigate the relatively intricate web of regulations that govern the generation and sale of
electricity in California. It is strongly recommended that design teams establish a close working
relationship with their local utility provider and utilize them as a resource throughout the pre-
design and design process. Additionally, to further ZNE penetration in California, it is
recommended that utility companies have knowledgeable staff with meaningful decision-
making authority available for this purpose at no charge to project teams. State incentives could
encourage utilities to create these positions and increase support for ZNE construction.
Lesson #5: Building Users Have Significant Impacts on Energy Use
As noted multiple times in the case study, energy use by building users remains a large variable
at West Village, and real-time user feedback about energy use is not available for the project.
Preliminary energy modeling for West Village assumed that the apartments would be used
similarly to a space shared by a nuclear family; that is, with amenities such as televisions,
gaming systems, and stereo equipment shared among users. College students tend to own these
devices individually and not share with their roommates, thus increasing energy use from
miscellaneous electrical loads.
Exacerbating this problem is that the project has no mechanism to provide real-time feedback
on energy use to building occupants. Rather, due to the time lag of the utility billing cycle and
67
management processing time, building occupants do not receive feedback until up to 45 days
after the energy has been used, mitigating the chances for effective behavioral interventions.
While this time lag is typical for utility customers, building industry research has revealed that
real-time, automated feedback is the most effective method of encouraging energy efficient
behavior. Future project teams would benefit from including feedback systems in a benefit-cost
analysis that examines estimated savings over the lifetime of a project. Such an analysis will
help teams to determine the proper level of feedback to include in their project.
At the West Village project, the CPUC’s Rule 18 also acted to limit the feedback available to
users regarding energy use. By prohibiting building owners from charging tenants
proportionally for electricity, Rule 18 creates barriers to owners of multi-family buildings
seeking to recover investments in renewable generation systems. WVCP responded to this
barrier by electing to pay the properties’ electric bills directly. While regulatory requirements
are satisfied under this arrangement, building occupants no longer receive a signal connecting
their energy use with financial consequences. Thus, a crucial tool for motivating behavior
change has been removed from the project.
In addition to user feedback, continual engagement by building management with building
users about energy efficiency can help building users to constantly improve their energy
performance. The management of West Village targets the top 5 percent of energy users each
month for energy audits and energy education programs, and is considering implementing a
reward system of pizza parties, tickets to sports events, or other similar gestures for the
apartments that reduce their energy use by the largest amount each month. Such incentive
programs can promote healthy competition among building users and result in energy savings
and improved finances for building owners.
Lesson #6: Expertise in State Policies, Regulations, and Incentives is Needed on Project
Teams; Clarity is needed from the State
The state’s current framework of regulations, policies, and incentives for energy efficiency and
renewable generation is complex and creates multiple hurdles for project teams seeking to
create ZNE or deeply energy efficient projects. Multiple entities within the state have put
forward goals for increased penetration of local renewable energy and ZNE buildings, yet few
of these aspirational goals are fully coordinated across state policies and even fewer are codified
into law. Existing utility company regulations have not been updated to encourage large-scale
ZNE projects and certain rules inhibit innovation at the level of individual projects. Incentive
programs are frequently evolving or expiring, while new incentive programs seem to be
introduced on an annual basis. The result is a complex landscape that is confusing at best and
that creates uncertainty and a reluctance to pursue ZNE at worst.
A sentiment that was repeated several times in interviews with stakeholders of the West Village
project was that a clear pathway that would allow the team to meet the legal requirements of
the state, capitalize on available incentive programs, and construct the project in an economical
way did not initially appear to exist. Multiple members of the West Village team noted that they
felt they were inventing the process as they proceeded, resulting in significant additional work
68
for all involved. The team credits the fact that they underestimated the effort required as the
reason they were willing to commit to the process early on, but that future project teams will
strongly benefit from including a team member with relevant experience to assist in navigating
these issues. Utility companies are in a position to act in this capacity if they have incentive to
do so, as they tend to have broad understanding of state energy policy, regulations, and
available incentives.
Lesson #7: Lock-in incentives when possible
The constantly evolving landscape of incentive programs means that decisions to pursue
particular programs need to be locked in quickly. Incentive programs such as the California
Solar Initiative (CSI) offer tiered benefits depending on when an application is filed to
participate in the program, or based on achievement of a project milestone such as the purchase
of renewable generation equipment. Rebates offered through the CSI program (and others)
decline over time.10 Due to the length of time that has elapsed between the decision to utilize the
CSI program and the construction of West Village’s single-family homes, some financial benefit
may be lost due to declining incentive amounts. Project teams are encouraged to identify and
lock in available incentives to maximize available benefits.
4.2.2 Key barriers to Success and Policy Recommendations
CPUC Rule 18 and Building User Feedback of Energy Usage
Apartments at West Village are individually metered but do not pay an electrical bill; rather, the
cost of utilities is included as a flat fee into their monthly rent. This rent remains fixed over the
term of a 12-month lease. Thus, the cost of electricity is indistinguishable from the cost of rent,
and energy conservation does not result in financial savings to the tenant. Under this
arrangement, the tenant has no strong incentive to conserve electricity. The owner, however,
pays the utility bills and is therefore incentivized to induce the tenants to use less energy. This
lack of financial incentive for tenants makes it more difficult to achieve ZNE status at West
Village.
The CPUC’s Electric Rule 18 governs the resale of electricity by building owners to occupants
and is part of the utilities tariff structure enforced by the CPUC.11 A component of Rule 18 is
that residential building owners that have a master meter on a building or dwelling unit are
prohibited from selling electricity passing through that meter to building tenants. Because of
this rule, WVCP is unable to charge tenants directly for electricity delivered from the project’s
PV array.
By absorbing a typical energy bill into the cost of the lease for each unit and by assuming
responsibility for payment of all utility bills, WVCP can realize financial benefit. WVCP is able
10 “California Solar Initiative (CSI) - Rebate Levels,” California Solar Initiative Rebates, accessed October 9,
2013, http://www.gosolarcalifornia.ca.gov/csi/rebates.php.
11 Gordon R. Smith, “Electric Rule No. 18: Supply to Separate Premises and Submetering of Electric
Energy” (PG&E, February 4, 1997), http://www.pge.com/tariffs/tm2/pdf/ELEC_RULES_18.pdf.

69
to recover its costs for the purchase of the PV array, offer tenants an apartment that is
financially competitive with other apartment units in Davis, and realize a long-term financial
benefit after the cost of the PV system has been recovered. But by removing the fundamental
signal that building occupants respond to with regard to energy use—the price signal—WVCP
has also encountered a situation whereby its tenants’ incentives regarding energy use are not
aligned with its own. The result is an ongoing effort of tenant education and persuasion by
WVCP to encourage tenants to reduce their energy consumption.
WVCP receives monthly bills from PG&E for the entire project’s electricity use. Through
analysis of these bills, WVCP is able to determine the high, medium, and low energy users
every month. WVCP currently identifies the highest energy users and targets these occupants
for education and incentive programs. Education programs consist of trained staff inspecting
units for obvious signs of excessive energy use such as mini-refrigerators in tenant bedrooms or
thermostats not adjusted for maximum efficiency. Letters containing suggestions for energy
conservation are sent to these users informing them that they are in the top 5 percent of energy
users and steps need to be taken to reduce consumption. Incentive programs include owner-
provided pizza parties, tickets to athletic events, or other rewards for those units that reduce
energy consumption by the largest amount each month. WVCP is currently considering
additional steps that can be taken, including financial penalties of various forms for exceeding
monthly energy thresholds. WVCP acknowledges that care must be taken with any such action
as to avoid running afoul of Rule 18, and is studying the issue closely.
Any effort at behavior modification is most effective when the feedback mechanism is
temporally linked to the targeted behavior. By using utility bills to determine intervention,
WVCP is providing feedback to building users a considerable time after the behavior has
occurred. Utility bills are backward-looking and by the time WVCP has received the bills,
analyzed them, and determined which users require intervention, it is not unusual for 30-45
days to have elapsed since the energy was consumed. The result is a suboptimal arrangement
for behavior modification and increased costs for WVCP as they are continually trying to chase
past behavior to change future results. Added to this situation is the fact that the typical
inhabitant of West Village exhibits vastly different energy use tendencies than a typical, non-
student apartment dweller.
A typical apartment dweller’s energy use would tend to follow the overall patterns of electricity
use in the state, with peak use occurring in the late afternoon and early evenings. In this
scenario, the largest sources of energy use would typically be space heating and cooling, water
heating, and MEL. Student-occupied apartments do not exhibit a consistent time-of-use profile,
but overall trends show electricity use peaking much later in the day and evening compared
with non-student occupied buildings. Night-owl students cooking, doing laundry, and running
electronic equipment mean that the dominant forms of energy use are MEL, lighting, and space
conditioning (primarily space heating in winter), thus shifting even greater importance on
providing real-time feedback to building occupants combined with the ability to control MEL
energy consumption.
70
Recommendations:
Provide funding for research to determine the effectiveness of non-monetary incentives
and programs to encourage efficiency that are consistent with existing utility rules
Consider changes to the utility rules (incl. Rule 18) that would allow for the owner-
operators of ZNE projects to provide a proportional and meaningful price signal to
residents to encourage efficiency.
Design Related Issues
The lack of submetering of individual electrical circuits within each building prevents a detailed
analysis of energy use patterns. Each residential unit is served by a master electrical meter, and
there is no direct way to disaggregate energy use into different end uses within each unit. It is
therefore difficult to determine which energy load—such as lighting, MEL, space heating,
cooling, or hot water generation—is responsible for the largest portion of energy consumption.
While it is widely assumed that MEL from user-owned equipment is the dominant energy use,
this cannot be measured quantitatively against predicted use patterns. The inclusion of
submeters onto each electrical circuit would provide the opportunity for such measurement and
would allow the building owners to effectively target areas of underperformance and
quantitatively assess the results of these interventions. The cost of submetering would be
incurred during the construction phase of the project, but potential savings from effective
interventions would accrue to the owners throughout the lifetime of the building. Further
research is required to determine the benefit-cost effects of providing these meters compared
with other potential investments in energy measurement and control.
Recommendations:
Provide funding for research to determine behavior associated with different occupant
types, and the costs and benefits associated with submetering in multi-family buildings.
Pacific Gas & Electric (PG&E), through a subcontractor and in conjunction with WVCP, is
conducting a study that has provided submeters on individual end-use circuits for 144
apartment units in West Village. The goal of this study is to disaggregate energy use within a
sampling of units and by doing so, extrapolate the findings to the project as a whole. Results of
this study are not available at the time of this writing.
Building Energy Modeling
Preliminary energy modeling of the West Village buildings relied on a number of well-founded
assumptions to predict total building energy use. Subsequent evaluation of actual energy use
versus predicted values revealed that some of the initial assumptions included in the energy
model were not borne out on the completed project. Primary among these assumptions was that
each four-bedroom apartment unit in West Village was modeled as if it were occupied by a
traditional family and not four individual students. A traditional family would use the
apartment units in a fundamentally different way than students—common amenities such as a
television, computer, stereo, gaming system, and refrigerator would typically be shared by a

71
family but are often not shared by students. In a student-occupied scenario each occupant may
each have these devices independently, thus increasing MEL energy usage by as much as a
factor of four. These higher MEL are likely one of the reasons for the shortfall in ZNE
performance. In addition to addressing user behavior through awareness and education (as
noted below), the developer is considering adding increased PV cells to the project to
compensate for these loads. This expansion of the PV array is the subject of business
negotiations between UC Davis and WVCP, and additional study is required to determine the
precise amount of additional PV that is required to reach ZNE status.
Recommendations:
Provide funding for research to determine if energy use in student housing is affected by
the process by which roommates are assigned—for example, whether or not randomly
assigned roommates behave differently from students who live together by choice. 4.3 Importance of Modeling Tools and Resources for Stakeholders
Extensive use of and reliance on energy models has been a hallmark of West Village from the
earliest stages of the project to present. Davis Energy Group (DEG) has performed the majority
of the modeling work for West Village. Founded in 1981, DEG has a record of participation in
the U.S. Department of Energy’s Build America Program, which aims to improve building
energy efficiency through research and innovation. DEG was a participant in the Build America
Program in 2004, an effort that included energy modeling for prototypical housing units similar
to those that were being planned for the West Village project. This work informed early
efficiency goals for the project. DEG’s work was updated in 2007 while working as a consultant
for the EEC, and was the technical basis for the EEC’s Energy Efficiency report that same year.
As noted previously, this report contained analysis for varying levels of efficiency and
renewable generation and provided an economic framework for each. A high-level outcome of
this work was the realization that the project could be readily designed to outperform the then-
pending Title 24 energy guidelines by approximately 50 percent, and that this performance
could be achieved in an economical manner. Current literature on the design of ZNE buildings
suggests that attaining performance 50 percent below current Title 24 energy standards is a
minimum efficiency threshold for ZNE buildings.12 The efficiency scenarios developed by DEG
and the EEC provided a roadmap of attaining this level of efficiency and became the basis for
attainment of ZNE status.
One product of the West Village RESCO project was a web modeling tool that would assist
builders, developers and planners in the early stages of development to evaluate ZNE potential
and provide an early barometer relating to the ZNE feasibility of the project.
12 Heschong Mahone Group, Inc., The Road to ZNE: Mapping Pathways to ZNE Buildings in California.

72
Summary and Purpose of ZNE Modeling Tool
The intent of this tool is to provide a high level feasibility planning model for developers,
institutions, planners, and others to assess the potential for achieving community-wide ZNE
performance in California. This tool is not intended as a replacement for designing of ZNE
communities or for sizing of community scale renewable energy systems. The model evaluates
new developments comprising single and multi-family buildings, and common area end uses
such as community centers, street and parking lot lighting, and swimming pools. Based on user
inputs and assumptions built into the model, community energy consumption is estimated
along with photovoltaic system size and associated land use required to achieve ZNE.
Assumptions built into the model were developed from modeling exercises, 2013 Title-24 code
requirements, and current standard construction practices in California. Energy use intensities
(EUI) in kBtu/ft2 by building type (single family, low-rise multifamily & high-rise multifamily)
are based on results from the study, The Technical Feasibility of Zero Net Energy Buildings in
California13 funded by the Investor Owned Utilities. This work identified the characteristics of
base case and exemplar prototypes for various building types. The base case prototypes are
2013 Title-24 code compliant buildings while the exemplar cases represent ZNE ready
construction in 2020. Performance was evaluated using the Department of Energy’s EnergyPlus
simulation software. Proposed measures that were determined to be not technically feasible in
2014 were removed for the purposes of this tool. User inputs that drive the energy calculations
include the following:
Location by California climate zone: 7 climate zones are currently included (3, 7, 10, 12,
13, 15, 16 )
Building characteristics including occupancy type, floor area, # of stories, # units, # of
like buildings
2013 Title-24 target compliance margin (as a function of percent better than code)
Fuel choice (electricity or natural gas) for space heating, water heating, and appliances
Total installed lighting wattage of street & site lighting OR characteristics areas &
lengths
Size of swimming pools & spas
The tool assumes energy consumption is offset by on-site, grid-connected photovoltaic (PV)
systems to meet ZNE goals, installed on building rooftops and/or located off-roof within the
community. PV energy generation by climate, tilt, and azimuth was estimated using the
13 ARUP, 2012. The Technical Feasibility of Zero Net Energy Buildings in California. Prepared for Pacific
Gas & Electric Company. December, 2012.
http://www.energydataweb.com/cpucFiles/pdaDocs/904/California_ZNE_Technical_Feasibility_Report_F
inal.pdf

73
EnergyPlus tool. In most cases results are provided for South, West, and East facing arrays. User
inputs that affect the PV production calculations include the following:
Roof pitch
PV module efficiency (4 tiers based on NREL PV Watts14)
Available area for off-roof PV including parking structures, and ground mounted
systems
Community scale ZNE performance is evaluated relative to both site energy (in kWh and
therms), and “Time Dependent Valuation” (TDV) energy. TDV is a core metric for California’s
Building Energy Efficiency Standards and is the proposed starting place for the State’s eventual
ZNE definition15. TDV energy use is based on the 2013 Title-24 hourly multipliers by climate
zone applied to both hourly energy consumption and hourly renewable generation. For projects
with natural gas, site energy evaluation assumes only electricity use is offset by PV, while TDV
energy evaluation accounts for both electricity and gas use. Outputs from the tool include the
following:
Annual energy use (kWh, therms, TDV kBtu)
PV size (kW) and associated area (ft2) to reach net zero electricity and net zero TDV.
Annual energy use reduction relative to code minimum construction
Annual carbon offsets relative to code minimum construction
Results are provided to the user for each building type, for each common area group (i.e. street
lighting) and for the community as a whole.
Additional Scope of the Modeling Tool
Development of this tool has been limited in scope and various expansions have been identified
that would add value to the model.
Expand the 7 California climate zones that are currently covered to all 16.
Incorporate other renewable options such as biomass generation.
Incorporate other building types such as mixed use buildings.
Integrate with a visual tool such as BEopt that could easily allow the user to input # of
building types, building orientation, and roof lines. NREL currently has plans to
develop a community version of BEopt which would align well with this tool.
14 http://pvwatts.nrel.gov/
15 The Energy Commission’s 2011 Integrated Energy Policy Report references “time-dependent
valuation” as a recommended ZNE metric. http://www.energy.ca.gov/2011_energypolicy/

74
Integrate the tool with a PV design tool that already has the ability to accurately account
for offsets and shading.
Include electric vehicle charging and energy storage strategies.
Evaluation of demand impacts and incorporation of demand response strategies.
4.3.1 Technology Transfer Plan
Technology Transfer plans are typically required by publicly-funded agencies that sponsor
technology research. The agencies, and therefore the researchers that are funded by them, are
expected to provide public benefit, and this positive societal impact, especially when it involves
investment in advancing emerging technologies, is expected to manifest ultimately in market
transactions and behaviors. The goal is to have both private sector firms and citizens alike
adopting these new technologies.
Typical Transfer Plans emphasize the importance of the protection of intellectual property and
then strategic licensing of those assets to private sector firms that are active and influential in
the market. This approach both enables and maximizes economic and societal benefit. Securing
intellectual property empowers private sector firms to attract the necessary upfront financial
capital to fully develop a technology and achieve its optimal market penetration. This strategy
is common when the innovation associated with the research being funded can indeed be
protected as intellectual property.
The innovation associated with this research project does not fit, however, the criteria of
traditional technology development. The research funded under this agreement supported
integrated design and modeling of energy components for West Village. While the research did
ultimately lead to market adoption of an integrated set of technologies, it did not produce any
intellectual property that could be patented and/or licensed. While it does not make sense to use
the traditional technology transfer model for the research outcomes from this project, it is clear
that the outcomes, which involve regulatory lessons learned and technology best practices, do
have valuable societal benefit if they can be effectively shared with the right audiences.
4.4 Education and Technology Transfer Strategies for West Village
The Technology Transfer Plan described in the Scope of Work for our proposal was originally
envisioned to share best practices from the research outcomes of just the RESCO solicitation.
The project has leveraged the California Energy Commission’s initial investment through this
project and empowered a number of related West Village ZNE R&D projects. They are all part
of the WVEI. The Technology Transfer Plan being established is a platform for sharing lessons
learned from all ZNE related R&D projects within the WVEI. In order to broaden the market
impact, the plan is defined as the Zero Net Energy Technology Transfer Plan (ZNETTP) with
the framework designed to share best practices not only from West Village, but also from
similarly market leading large-scale ZNE projects throughout California and the world.
West Village is a discreet project, but if California is to achieve its Big/Bold strategic goals of
ZNE for residential new construction by 2020 and commercial new construction by 2030, West
Village will need to be the first of many more community-scale projects to come. West Village

75
can be a catalyst, inspiration and source of best practices for other such projects, especially if the
Technology Transfer plan is implemented successfully.
4.4.1 Key Strategies
Given the unique and market-leading nature of the West Village Community development and
its energy infrastructure, the lessons learned from the West Village Energy Initiative are of
critical importance to a number of different audiences. The Technology Transfer approach
intend to be used will make information accessible to regulatory and legislative public officials,
communities and developers considering ZNE implementation, members of the construction
industry, residents of West Village, and the general public.
For public-sector community-planners as well as private-sector master planners and
developers, as well as those in the construction industry, the researchers are developing an on-
line feasibility tool that will help delineate the considerations to keep in mind in the pursuit of
ZNE. It is anticipated there will be value in updating and refining this tool over time and also
value in collaborating with trade organizations to facilitate discussions about obstacles and
overcoming those obstacles to achieving successful ZNE implementation.
Public agencies are increasingly interested in market facilitation (the Demonstration and
Deployment portion of RDD&D) and are dedicating resources towards overcoming key barriers
to market adoption and commercialization of advanced technologies. The ZNETTP provides a
unique market facilitation tool for advancing ZNE. The plan identifies and addresses key
regulatory and legislative barriers and potential solutions for ZNE adoption. The plan also
addresses the need for broad ZNE education for both the general public and specific
practitioners as well.
In the coming years, public sector agencies will be releasing solicitations, which will hopefully
be inclusive of opportunities to conduct many or all of the elements included in the ZNETTP.
Below is a list of public agencies that may announce applicable funding opportunities:
CA Air Resources Board
CA Energy Commission: EPIC Market Facilitation
CA Public Utilities Commission
US Department of Energy
US Department of Education
National Science Foundation
Pacific Gas & Electric: ZNE Pilot Program
Corporate, Foundation and Individual Fund-Raising Strategy
UC Davis has a strong track record of engaging the private sector, both large and small entities,
in meaningful collaboration on RDD&D. Corporations will be motivated to sponsor the

76
ZNETTP for a diverse set of reasons. Many companies and organizations will only be interested
in a select set of activities, while others will be interested in supporting a broader, more
comprehensive effort. Ultimately, the outreach and education (Table 25) team will need to be
responsive to needs and interests of its private sector partners.
Table 25: Identified West Village Outreach Leadership Team
UC Davis
Energy Efficiency Center Ben Finkelor, Executive Director
Sumiko Hong, Director of Development and External Relations
Alan Meier, Visiting Scientist and Researcher
Ernie Hoftyzer, Management Services Officer
Department of Design Susan Verba, Associate Professor
Center of Excellence for Visualization
Kwan-Liu Ma, Director and Professor
Facilities Management Josh Morejohn, Manager, [email protected]
Kiernan Salmon, Project Manager (Campus Energy Feedback Systems)
Plug-in Hybrid & Electric Vehicle Research Center
Dahlia Garas, Program Director
Tobias Barr, Assistant Project Manager
California Lighting Technology Center
Kelly Cunningham, Outreach Coordinator
Western Cooling Efficiency Center
Paul Fortunato, Outreach Coordinator
Office of Research Paul Dodd, Associate Vice Chancellor for Research
Darenne Hackler, Executive Director
Campus Planning and Community Resources
Bob Segar, Assistant Vice Chancellor
Real Estate Services Mary Goodell Hayakawa
Corporate, foundation and individual prospects will be solicited to fund key elements within
the ZNETTP. Initially, corporations that were involved in the implementation of the WVEI,
such as Carmel Partners, Chevron Energy Solutions, PG&E, SunPower, Honda, and Wells Fargo
will be primary prospects.

77
We will develop additional corporate prospects that have shown involvement in other ZNE
developments such as sponsors of US Department of Energy Solar Decathlon (For example,
Bosch, Cisco, Edison International and Schneider Electric, or sponsors of individual Solar
Decathlon teams, such as United Brotherhood of Carpenters, International Brotherhood of
Electrical Workers, Sheet metal Worker International Association, DIRECTV, General Electric,
Intel Corporation, Applied Materials, Design Within Reach, SMA Solar Technology and Itron.)
We will also develop foundation and individual prospects that have grant or giving priorities in
energy efficiency, and renewable energy, smart grid, ZNE, policy development, carbon
reduction, improving energy literacy in school aged children and general audiences and science
and engineering education. Initial Foundation prospects include, Energy Foundation, Hewlett
Foundation, Packard Foundation, Kresge Foundation and Doris Duke Charitable Foundation.
Tours and conduct outreach activities will continue to be provided as well as opportunities to
develop support from individual donors.
4.4.2 Education and Outreach Tools
UC Davis has established a partnership with the Exploratorium of San Francisco, an
international leader in hands-on informal science education, to collaborate on education and
outreach programs that advance scientific understanding for the general public. Staff at the
Exploratorium took the lead on developing this chapter and white paper specifying the
education and outreach tools that would be specifically useful for engaging general audiences,
including tours, experiential education exhibits and infrastructure, and interactive websites.
The underlying objective behind these education and outreach tools is to create learning
experiences around renewable energy, energy efficiency, smart grid, sustainability science and
technology, and ZNE goals using the West Village Project and the Exploratorium’s sustainable
building as case studies and dissemination platforms.
Audiences Targeted include: Residents, Students, Campus visitors (parents, policy-makers,
visiting delegations), K-12 students and educators, and the general public.
There are 5 key components listed and described in this white paper. Additional education and
outreach components to consider included are listed at the end.
West Village Energy Collaboration Laboratory & Visitor Center
Located within the West Village Community, the Energy Collaboration Laboratory (ECL) is a
mixed-use center that combines:
1. Work space for interdisciplinary design and research teams to collaborate and do design
testing; and,
2. Exhibition and meeting space where residents, students, faculty, visiting delegations
and the public can come to learn more about ZNE and sustainable living.
It’s important that the design of this space is open, inviting and active and not just an exhibition
space that is only populated when a tour comes through or a meeting takes place. The room
design should also be flexible so it can be reconfigured for different uses (furniture and exhibits

78
on wheels). A model for a combination learning lab, workshop and public space is the
Exploratorium’s Observatory Gallery, a glass building that takes advantage of views of the
natural and built environment of the San Francisco waterfront. The gallery was designed for
multiple activities: an interactive exhibit gallery focusing on the local landscape, a workspace
for scientists, designers and educators, a teaching and presentation space for public and
professional invited audiences, and a private event and reception space.
Figure 16: Overview of Observatory Gallery
4.4.3 Elements of the Energy Collaboration Laboratory
Video Wall Touch Screen, where visitors can:
1. Watch an introductory video with interviews recounting the story of the West
Village Project from multiple perspectives (developer, planner, architect, engineer,
public agency, utility company, residents);
2. Learn about the economic and technological feasibility of ZNE in West Village, and
lessons learned in the process of building and occupying West Village;
3. Explore current weather data and data visualizations about current energy use and
production in West Village;
4. Learn about UC Davis research on transportation, renewable energy, energy
efficiency (including lighting, HVAC, water efficiency), electric charging
infrastructure, behavior and user interface, and international energy technologies;,
5. Watch time-lapse video studies of weather, solar motion and community life.

79
6. Gain access to similar outreach material that features the Exploratorium building
and other ZNE case study projects.
Figure 17: Exploratorium interactive Wall
Flexible “hotel” work space that can accommodate interdisciplinary teams of students
and researchers across the fields of design, programming, engineering and social
sciences collaborate on projects related to energy efficiency, renewable energy,
transportation, data visualization and user interface design.
Lounge area where small groups can meet, work or relax.
Presentation, events and meeting space for workshops, talks, receptions, and openings.

80
Figure 18: Reception in Exploratorium Observatory
Display and storage cabinets for computer and monitor equipment, supplies, tools,
teaching props, chairs, and prototypes. Graphics and a white board can be mounted on
the cabinets, providing background text, images and event announcements about West
Village and the ECL.
Interactive exhibits, space allowing. These could initially be Exploratorium-built exhibits
that demonstrate the science behind energy technologies. Current examples include
Heat Pump, which shows how heat exchangers work, Invisible Light, which shows how
much infrared radiation is given off by various light sources from incandescent to LED,
and Sky Theater, a walk-in mini planetarium showing how solar motion changes
seasonally which affects solar power generation. In the future, new exhibits could be
developed in collaboration with designers and scientists from UC Davis, demonstrating
technologies developed on campus such as the operation of advanced sensors in lighting
systems, “swamp cooler” technology for low-energy cooling, and new energy efficient
technologies. Such exhibits could be deployed as they become available.

81
Figure 19: Invisible Light interactive Exploratorium exhibit
Figure 20: Heat Camera interactive Exploratorium exhibit
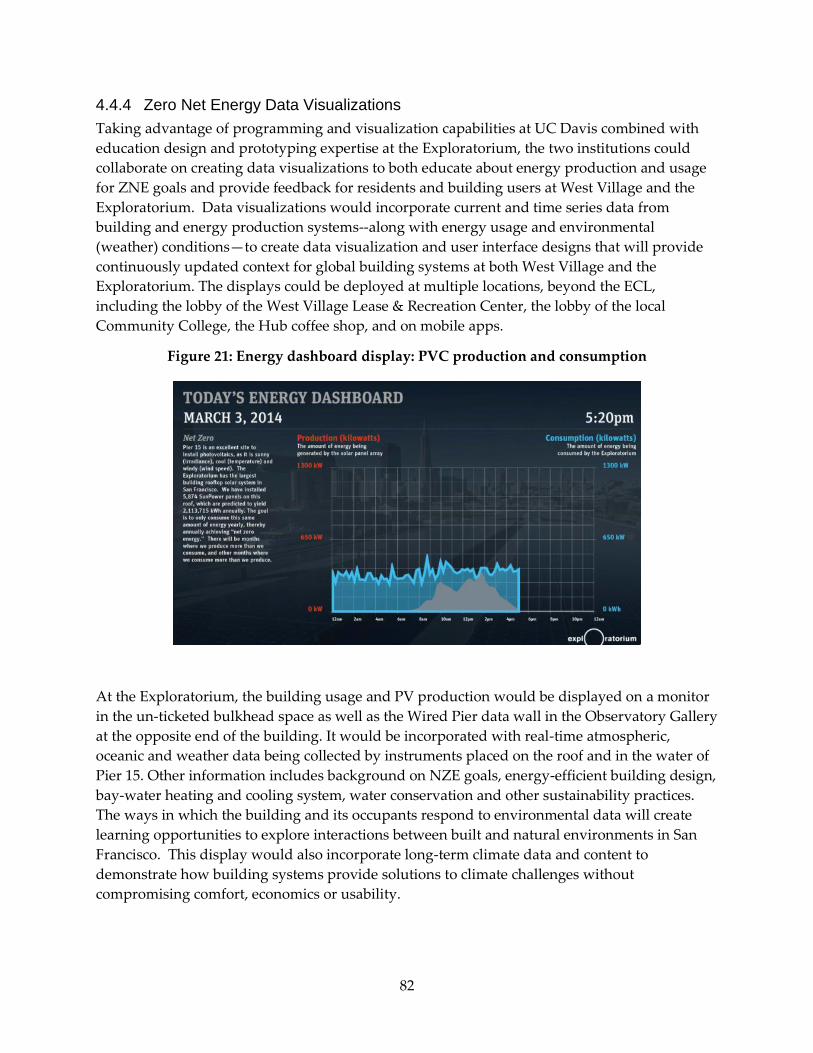
82
4.4.4 Zero Net Energy Data Visualizations
Taking advantage of programming and visualization capabilities at UC Davis combined with
education design and prototyping expertise at the Exploratorium, the two institutions could
collaborate on creating data visualizations to both educate about energy production and usage
for ZNE goals and provide feedback for residents and building users at West Village and the
Exploratorium. Data visualizations would incorporate current and time series data from
building and energy production systems--along with energy usage and environmental
(weather) conditions—to create data visualization and user interface designs that will provide
continuously updated context for global building systems at both West Village and the
Exploratorium. The displays could be deployed at multiple locations, beyond the ECL,
including the lobby of the West Village Lease & Recreation Center, the lobby of the local
Community College, the Hub coffee shop, and on mobile apps.
Figure 21: Energy dashboard display: PVC production and consumption
At the Exploratorium, the building usage and PV production would be displayed on a monitor
in the un-ticketed bulkhead space as well as the Wired Pier data wall in the Observatory Gallery
at the opposite end of the building. It would be incorporated with real-time atmospheric,
oceanic and weather data being collected by instruments placed on the roof and in the water of
Pier 15. Other information includes background on NZE goals, energy-efficient building design,
bay-water heating and cooling system, water conservation and other sustainability practices.
The ways in which the building and its occupants respond to environmental data will create
learning opportunities to explore interactions between built and natural environments in San
Francisco. This display would also incorporate long-term climate data and content to
demonstrate how building systems provide solutions to climate challenges without
compromising comfort, economics or usability.

83
Figure 22: PVC Solar array at Exploratorium
Figure 23: Time series energy production vs consumption ZNE goals
To generate both interest and engagement, data visualizations for West Village will be made
available in the Exploratorium displays and conversely, data visualizations for the
Exploratorium building will be made available on displays in West Village. As more access to

84
the data visualization for additional projects is made available, they can also be offered on
respective displays.
The data visualizations would also be available on the Web, providing learning opportunities
for distant public audiences, educators and students. By combining the visualizations with
information about local weather and climate patterns, Web visitors can compare their locations
to explore what energy solutions might work best for their climate and energy needs.
Figure 24: Residential Energy Usage Application
Currently, real-time data on energy use is largely unavailable for residential users even though
smart-meter technology makes such data delivery possible. In the absence of information,
residents have little understanding of how much energy their appliances are using and whether
there are ways to reduce their consumption. To address this information gap, the team would
design simple energy-usage apps and display that would incorporate granular data from
individual apartments within West Village to provide current and time series energy usage and
production information for residents. This data could be deployed on multiple platforms,
including resident smartphones or dedicated energy displays inside the apartments. The
design of the user interface could be provided by existing vendors or could be designed, tested
and optimized by a team of UC Davis researchers as part of a dedicated research project. The

85
data can also be displayed in a central location in the common area. The energy app would
provide feedback for residents to both monitor their own energy usage and compare it to
average usage in the other buildings in West Village.
Such an app would be useful to engage and educate West Village residents and provide
feedback that could lead to behavior change (for instance alert residents upon leaving their
apartment if they’ve left their lights on or computers running). It can also be used as a platform
to test different intervention techniques (such as gamification) to study energy conservation
behavior and motivation. Long-term use of these apps would allow for tracking attitudes and
social norms over time.
We anticipate such an interface would also form the basis of a more general citizen science
project where participants provide access to energy usage data through their smart meters
(available by request of their energy providers). In exchange, the participants would receive
instruments that measure usage of various appliances in their household and training on how
to audit their energy usage. Through the energy app, information would be provided to the
Citizen Scientists about ways to make energy efficiency or retrofitting improvements in their
households and cost-savings they could realize through incentives and reduced energy usage.
The energy app would track whether participants change their energy usage over time as a
result of participating in the project. For a set of dedicated volunteers, the Exploratorium and
UC Davis would leverage the West Village experience and organize a set of workshops to
introduce concepts and energy audit tools, develop an energy-savings plan, and track users
over time with periodic social and educational events with awards for meeting targets. This
could tie into incentive programs that state programs (Energy Upgrade California), Utility
programs (PG&E), and third-party programs might offer to incentivize retrofitting buildings
and/or modifying behavior for optimal energy consumption and sustainability.
Media and Content Development for the Web
Developing content for the Web would be a major priority early in the project and additional
content could be repurposed from other elements of the project including the data visualization
displays, energy pathway tours, introductory video, and energy efficiency and usage
information developed for the Citizen Science project. Additionally, materials developed for
this project could be distributed on multiple platforms including the Exploratorium and UC
Davis websites, the California Energy Commission and other ZNE websites.
Elements of the website would include navigation that could direct specific audiences,
including policy makers, teachers, student, private sector businesses, and general public, to
content tailored for their interests.
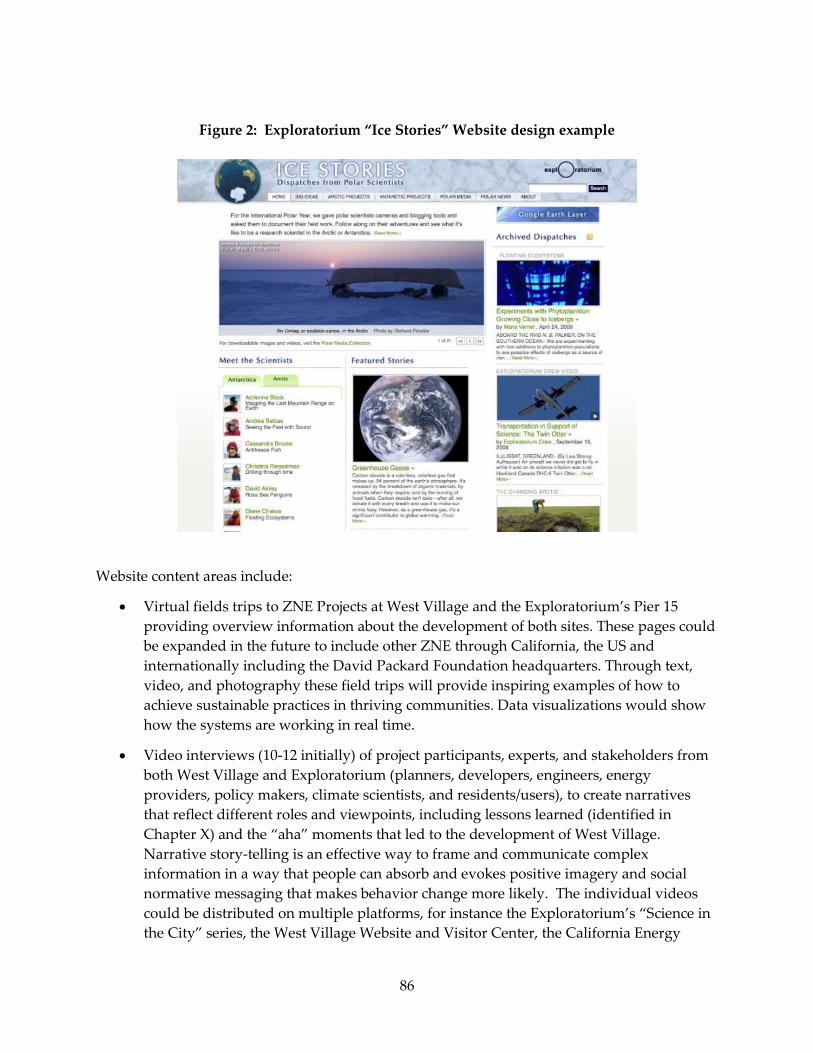
86
Website content areas include:
Virtual fields trips to ZNE Projects at West Village and the Exploratorium’s Pier 15
providing overview information about the development of both sites. These pages could
be expanded in the future to include other ZNE through California, the US and
internationally including the David Packard Foundation headquarters. Through text,
video, and photography these field trips will provide inspiring examples of how to
achieve sustainable practices in thriving communities. Data visualizations would show
how the systems are working in real time.
Video interviews (10-12 initially) of project participants, experts, and stakeholders from
both West Village and Exploratorium (planners, developers, engineers, energy
providers, policy makers, climate scientists, and residents/users), to create narratives
that reflect different roles and viewpoints, including lessons learned (identified in
Chapter X) and the “aha” moments that led to the development of West Village.
Narrative story-telling is an effective way to frame and communicate complex
information in a way that people can absorb and evokes positive imagery and social
normative messaging that makes behavior change more likely. The individual videos
could be distributed on multiple platforms, for instance the Exploratorium’s “Science in
the City” series, the West Village Website and Visitor Center, the California Energy
Figure 2: Exploratorium “Ice Stories” Website design example

87
Commission and other ZNE websites. It can also be used on social media platforms,
such as YouTube and Facebook and shared widely through media networks.
For city planners and developers, a section on Title 24 and other policies to achieve
energy sustainability, efficiency and independence
For general public, media and educators, tips on conserving energy, retrofitting for
efficiency, advanced technologies, and renewable energy systems. Links to the Citizen
Science online project from this section. Links to UC Davis research in Sustainable
Transportation, Energy Efficiency Center, Plug-in Hybrid and Electrical Vehicle Center,
Western Cooling Efficiency Center and other relevant sites from this section.
General background on environmental sustainability and climate change
The Website will also include a web-based tool for planners as an initial scope to test for
feasibility of ZNE in their project
Other Outreach Material
West Village Energy Initiative Annual Report: The first issue of this report was
published for 2012-2013. Subsequent editions will cover the annual leasing cycle
(September through August), with energy consumption and production during the 12
month period being reported in Winter of the following year.
Additional Print Pieces: Book about West Village, to be sold or given away (modeled
after Exploratorium books). PDF (mobile and printed) describing site selection and
sustainability factors from access to transportation and biking, to water conservation,
energy generation, and indoor environmental quality.
One-page Flyer and more detailed white paper for specialized audiences that frame
NZE according to interests: economics for planners, climate for environmentalists,
energy independence for conservatives. Discuss context for California policy changes
(Title 24) with the NZE goals for residential building by 2020 and commercial buildings
by 2030. Specific outreach piece for new development projects such as Hunter’s Point.
Media outreach and article in journals from museum and informal science education to
“green architecture” magazines.
Teacher Professional Development Workshops: In collaboration with Exploratorium
Teacher Institute, develop a week-long summer institute on energy and sustainability
suitable for NGSS. Tie into climate change education community for informal audiences.
Engage maker community with Maker’s Faire booth and Burning Man camp to
encourage and demonstrate ZNE technologies.
Research study on attitudes of West Village residents and Exploratorium visitors on
ZNE science background, environmental objectives and goals of WV project and
Exploratorium “net zero carbon” building system. What are the different frameworks
employed in communicating impacts and goals of ZNE policy (economic, societal,

88
environmental, and moral). Extend study to policy makers, real estate developers,
contractors, city planners, energy providers, key influentials, and other specialized
audiences.
Public Programs, lecture series on sustainability with focus on local environment as part
of Observatory “Lab and Lunch” series for professional audiences. Work with Science of
Sharing workshop series to explore social science issues related to climate change and
behavior change. Include session on policy changes for construction codes to implement
ZNE outcomes for all residential construction (by 2020) and commercial (by 2030)
Conferences/Workshops— Exploratorium and UC Davis jointly organize a symposium
at AAAS annual conference 12/29/14on energy, sustainability and science education for
2015 in San Jose CA.
Work with other sustainable buildings and communities to create a Web-based virtual
network of NZE projects, creating virtual field trips, social media connections, and case
studies. Show how principals of ZNE can be employed even in regions, such as colder
northern climates, where solar energy isn’t adequate to cover all power needs for a
community.
Develop training program for Exploratorium Explainers and student docents at West
Village using pathways and demonstrations to exhibitive the building systems and the
communities’ sustainable practices.
Develop set of outdoor exhibits, displays and points of interest related to energy and
sustainability, relating to observing natural phenomena such as solar irradiation, black
body, wind, tides/waves. This would involve a site study and research to develop a
relevant set of outdoor experiences (similar to development model for Ft. Mason exhibit
set.
Energy & Climate Education Summit: Assemble group of Bay Area science advisors for
two-day workshop on developing education and programming to move the
conversation about climate solutions beyond atmospheric CO2 and changing light bulbs.
Develop a set of exhibit prototypes and demonstrations as an inquiry (NSF Pathways)
phase of a traveling exhibition on energy, technology and the environment for
Exploratorium and other ISE venues that also include human behavior exhibits
developed through the NSF-funded Science of Sharing project at the Exploratorium.

89
GLOSSARY
Term Definition
CEC California Energy Commission
CES Chevron Energy Solutions
CPUC California Public Utilities Commission
CSI California Solar Initiative
DOE CRED U.S. Department of Energy Community Renewable Energy Deployment
EVSE Electric Vehicle Service Equipment
DEG Davis Energy Group
DER Distributed Energy Resources
PEV Plug-in Electric Vehicle
PG&E Pacific Gas and Electric
PHEV Plug-in Hybrid Electric Vehicle
PV Photovoltaic
READ Renewable Anaerobic Digester
RESCO Renewable-based Energy Secure Community
UC Davis University of California, Davis
WVCP West Village Community Partnership, LLC
WVEI West Village Energy Initiative
ZNE Zero Net Energy

90
REFERENCES
Barr, T. March 2014. UC Davis West Village RESCO Technical Integration Project: Smart Grid
Integration of PHEV Charging Stations. University of California, Davis.
California Plug-in Electric Vehicle Collaborative. 2010. Taking Charge: Establishing California
Leadership in the Plug-in Electric Vehicle Marketplace.
http://www.pevcollaborative.org/strategic-plan
Chevron Energy Solutions. February 2014. UC Davis West Village RESCO Report. Chevron
Energy Solutions, San Francisco, CA.
Dakin, B., M. Hoeschele, and C. Backman. May 2010. UC Davis West Village Community
Energy Efficiency Study. Davis Energy Group, Davis, CA.
Davis Energy Group. May 2010. UC Davis West Village Community Energy Efficiency Study.
Davis Energy Group, Davis, CA.
HDR. September 2011. Feasibility Study for Renewable Energy Anaerobic Digester Project,
University of California Davis.
White, B, A. Eggert, S. England, B. Finkelor and M Hayakawa. March 2014a. Creating A Zero
Net Energy Community: A White Paper of the UC Davis West Village Project.
University of California, Davis.
White, B, A. Eggert, S. England, B. Finkelor and M Hayakawa. March 2014b. Creating A Zero
Net Energy Community: A Case Study of the UC Davis West Village Project.
University of California, Davis.
Zhang, R. and M. Zhang. February 2014. UC Davis Renewable Energy Anaerobic Digestion
Project. University of California, Davis.


![[P][W] T. L. Eco. Resco, Laura.pdf](https://static.fdocuments.net/doc/165x107/586f65931a28ab66058be1ed/pw-t-l-eco-resco-laurapdf.jpg)


