UBS MLP ONE-ON-ONE CONFERENCE › ~ › media › Files › O › OneOK-IR › ...Page 16 NATURAL...
62
UBS MLP ONE-ON-ONE CONFERENCE Park City, Utah | Jan. 12-13, 2016
Transcript of UBS MLP ONE-ON-ONE CONFERENCE › ~ › media › Files › O › OneOK-IR › ...Page 16 NATURAL...
UBS MLP ONE-ON-ONE CONFERENCE Park City, Utah | Jan. 12-13, 2016
Page 2
FORWARD-LOOKING STATEMENTS • Statements contained in this presentation that include company expectations or predictions should be considered
forward-looking statements that are covered by the safe harbor protections provided under federal securities legislation and other applicable laws.
• It is important to note that the actual results could differ materially from those projected in such forward-looking statements. For additional information that could cause actual results to differ materially from such forward-looking statements, refer to ONEOK’s and ONEOK Partners’ Securities and Exchange Commission filings.
• This presentation contains factual business information or forward-looking information and is neither an offer to sell nor a solicitation of an offer to buy any securities of ONEOK or ONEOK Partners.
• All future cash dividends and distributions (declared or paid) discussed in this presentation are subject to the approval of each entity’s (ONEOK and ONEOK Partners) board of directors.
• All references in this presentation to financial guidance are based on news releases issued on Feb. 23, 2015, Nov. 3, 2015 and Dec. 21, 2015 and are not being updated or affirmed by this presentation.
Page 3
INDEX ONEOK Partners Overview 4 ONEOK Partners 2016 Guidance 9 Financial Strength 23 ONEOK Overview and 2016 Guidance 25 Appendix
– ONEOK Partners Business Segments 30 – 2015 Volume Outlook 34 – Natural Gas Gathering and Processing 39 – Disciplined Growth Continues 44 – Recent Projects 46 – ONEOK Partners Growth Projects 49 – Non-GAAP Reconciliations 55
ONEOK PARTNERS OVERVIEW
Page 5
ONEOK PARTNERS
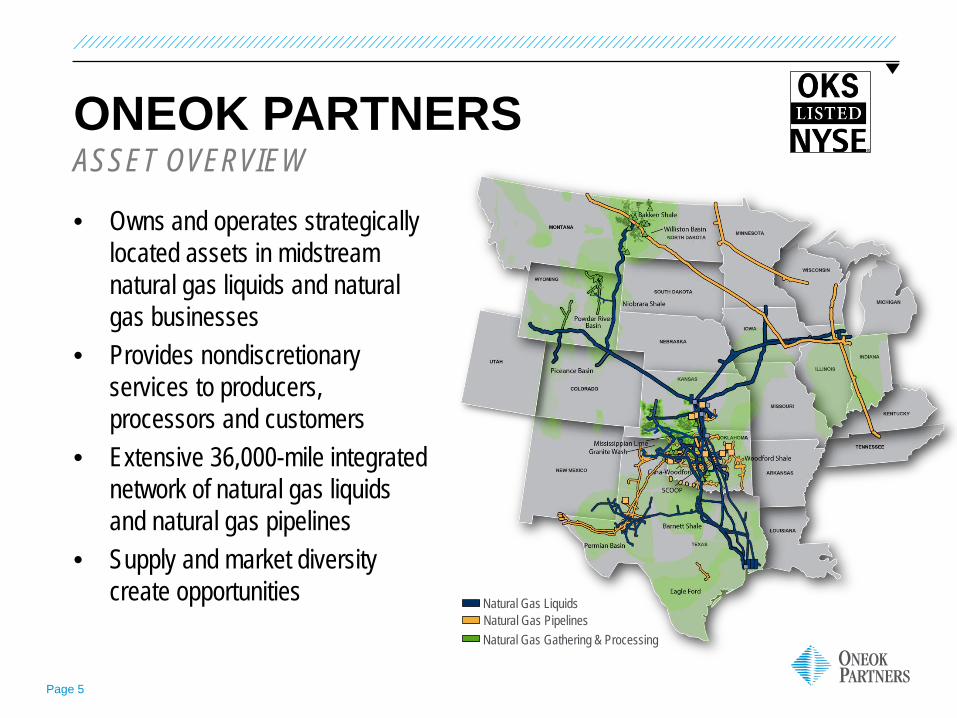
• Owns and operates strategically located assets in midstream natural gas liquids and natural gas businesses
• Provides nondiscretionary services to producers, processors and customers
• Extensive 36,000-mile integrated network of natural gas liquids and natural gas pipelines
• Supply and market diversity create opportunities
ASSET OVERVIEW
Natural Gas Gathering & Processing Natural Gas Pipelines Natural Gas Liquids
Page 6
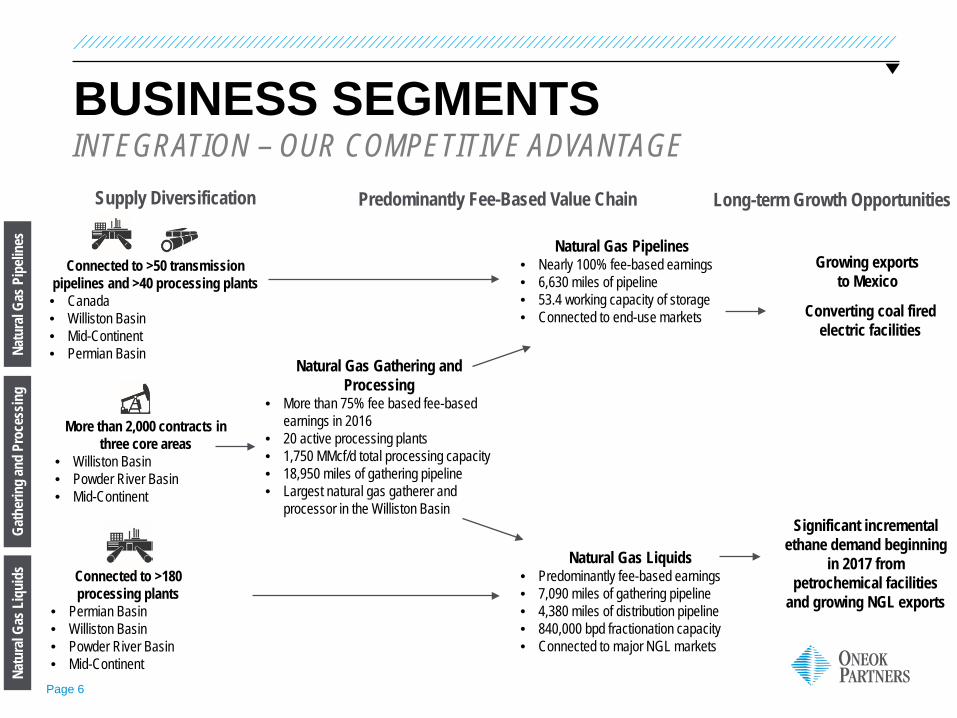
BUSINESS SEGMENTS INTEGRATION – OUR COMPETITIVE ADVANTAGE
Natural Gas Liquids • Predominantly fee-based earnings • 7,090 miles of gathering pipeline • 4,380 miles of distribution pipeline • 840,000 bpd fractionation capacity • Connected to major NGL markets
Natural Gas Pipelines • Nearly 100% fee-based earnings • 6,630 miles of pipeline • 53.4 working capacity of storage • Connected to end-use markets
Predominantly Fee-Based Value Chain Long-term Growth Opportunities
Natural Gas Gathering and Processing
• More than 75% fee based fee-based earnings in 2016
• 20 active processing plants • 1,750 MMcf/d total processing capacity • 18,950 miles of gathering pipeline • Largest natural gas gatherer and
processor in the Williston Basin
Supply Diversification
Growing exports to Mexico
Significant incremental ethane demand beginning
in 2017 from petrochemical facilities
and growing NGL exports
Converting coal fired electric facilities
More than 2,000 contracts in three core areas
• Williston Basin • Powder River Basin • Mid-Continent
Connected to >50 transmission pipelines and >40 processing plants • Canada • Williston Basin • Mid-Continent • Permian Basin Na
tura
l Gas
Pip
eline
s Ga
ther
ing a
nd P
roce
ssin
g Na
tura
l Gas
Liq
uids
Connected to >180 processing plants
• Permian Basin • Williston Basin • Powder River Basin • Mid-Continent
Page 7
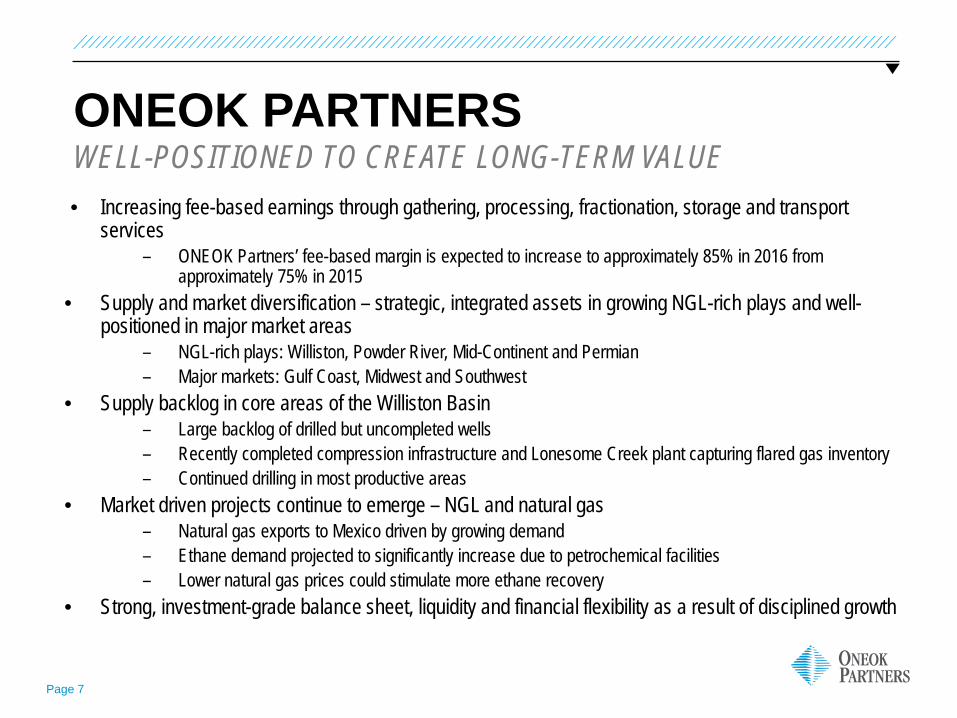
ONEOK PARTNERS
• Increasing fee-based earnings through gathering, processing, fractionation, storage and transport services
– ONEOK Partners’ fee-based margin is expected to increase to approximately 85% in 2016 from approximately 75% in 2015
• Supply and market diversification – strategic, integrated assets in growing NGL-rich plays and well-positioned in major market areas
– NGL-rich plays: Williston, Powder River, Mid-Continent and Permian – Major markets: Gulf Coast, Midwest and Southwest
• Supply backlog in core areas of the Williston Basin – Large backlog of drilled but uncompleted wells – Recently completed compression infrastructure and Lonesome Creek plant capturing flared gas inventory – Continued drilling in most productive areas
• Market driven projects continue to emerge – NGL and natural gas – Natural gas exports to Mexico driven by growing demand – Ethane demand projected to significantly increase due to petrochemical facilities – Lower natural gas prices could stimulate more ethane recovery
• Strong, investment-grade balance sheet, liquidity and financial flexibility as a result of disciplined growth
WELL-POSITIONED TO CREATE LONG-TERM VALUE
Page 8
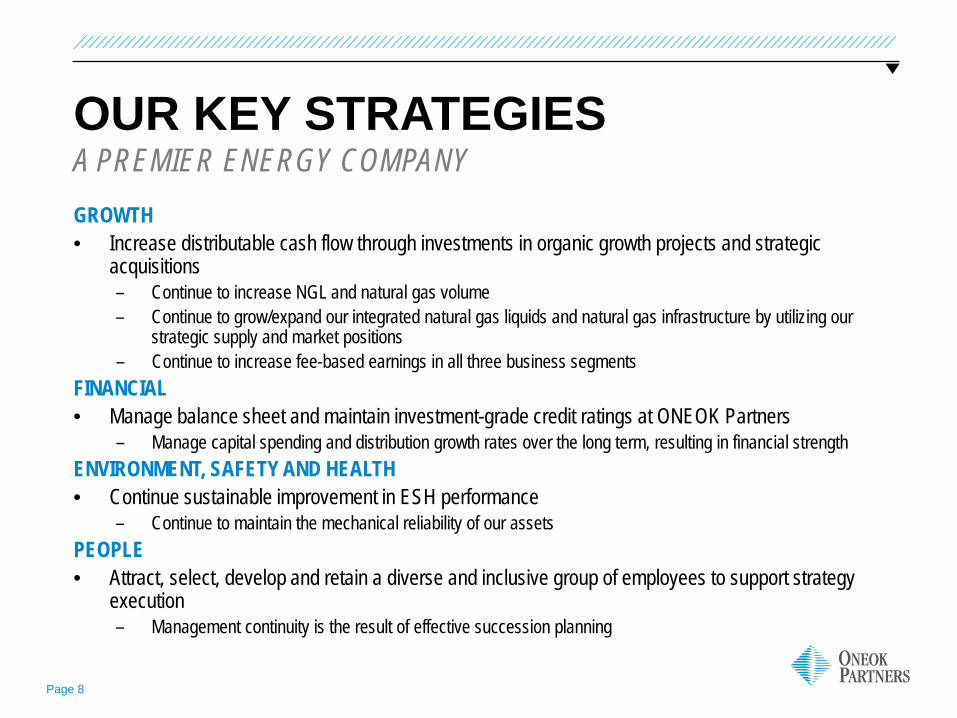
OUR KEY STRATEGIES
GROWTH • Increase distributable cash flow through investments in organic growth projects and strategic
acquisitions – Continue to increase NGL and natural gas volume – Continue to grow/expand our integrated natural gas liquids and natural gas infrastructure by utilizing our
strategic supply and market positions – Continue to increase fee-based earnings in all three business segments
FINANCIAL • Manage balance sheet and maintain investment-grade credit ratings at ONEOK Partners
– Manage capital spending and distribution growth rates over the long term, resulting in financial strength ENVIRONMENT, SAFETY AND HEALTH • Continue sustainable improvement in ESH performance
– Continue to maintain the mechanical reliability of our assets PEOPLE • Attract, select, develop and retain a diverse and inclusive group of employees to support strategy
execution – Management continuity is the result of effective succession planning
A PREMIER ENERGY COMPANY
ONEOK PARTNERS 2016 GUIDANCE
Page 10
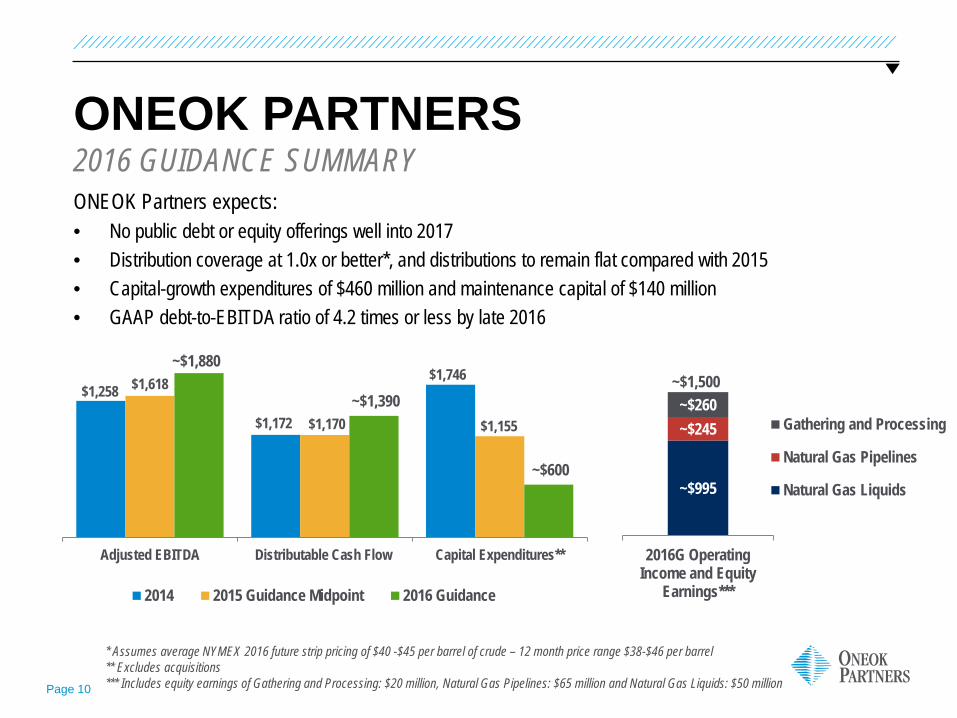
ONEOK PARTNERS ONEOK Partners expects: • No public debt or equity offerings well into 2017 • Distribution coverage at 1.0x or better*, and distributions to remain flat compared with 2015 • Capital-growth expenditures of $460 million and maintenance capital of $140 million • GAAP debt-to-EBITDA ratio of 4.2 times or less by late 2016
2016 GUIDANCE SUMMARY
$1,258
$1,172
$1,746 $1,618
$1,170 $1,155
~$1,880
~$1,390
~$600
Adjusted EBITDA Distributable Cash Flow Capital Expenditures**
2014 2015 Guidance Midpoint 2016 Guidance
* Assumes average NYMEX 2016 future strip pricing of $40 -$45 per barrel of crude – 12 month price range $38-$46 per barrel ** Excludes acquisitions *** Includes equity earnings of Gathering and Processing: $20 million, Natural Gas Pipelines: $65 million and Natural Gas Liquids: $50 million
~$995
~$245 ~$260
2016G OperatingIncome and Equity
Earnings***
Gathering and Processing
Natural Gas Pipelines
Natural Gas Liquids
~$1,500
Page 11
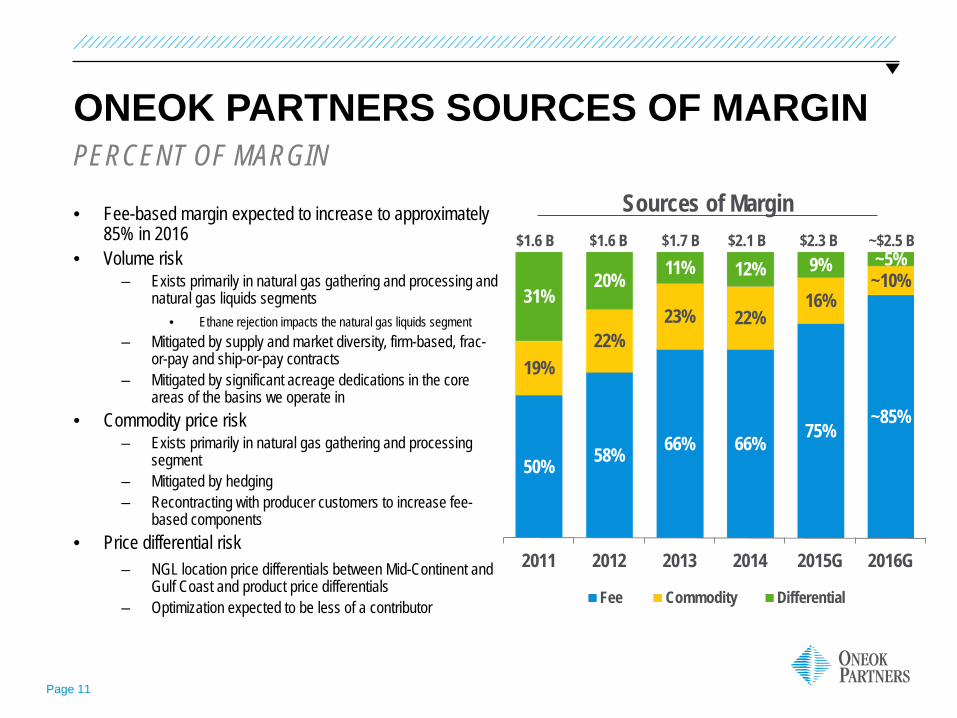
ONEOK PARTNERS SOURCES OF MARGIN
• Fee-based margin expected to increase to approximately 85% in 2016
• Volume risk – Exists primarily in natural gas gathering and processing and
natural gas liquids segments • Ethane rejection impacts the natural gas liquids segment
– Mitigated by supply and market diversity, firm-based, frac-or-pay and ship-or-pay contracts
– Mitigated by significant acreage dedications in the core areas of the basins we operate in
• Commodity price risk – Exists primarily in natural gas gathering and processing
segment – Mitigated by hedging – Recontracting with producer customers to increase fee-
based components • Price differential risk
– NGL location price differentials between Mid-Continent and Gulf Coast and product price differentials
– Optimization expected to be less of a contributor
PERCENT OF MARGIN
50% 58% 66% 66% 75% ~85%
19% 22%
23% 22% 16%
~10% 31%
20% 11% 12% 9% ~5%
2011 2012 2013 2014 2015G 2016G
Fee Commodity Differential
Sources of Margin $1.6 B $1.6 B $1.7 B $2.1 B $2.3 B ~$2.5 B
Page 12
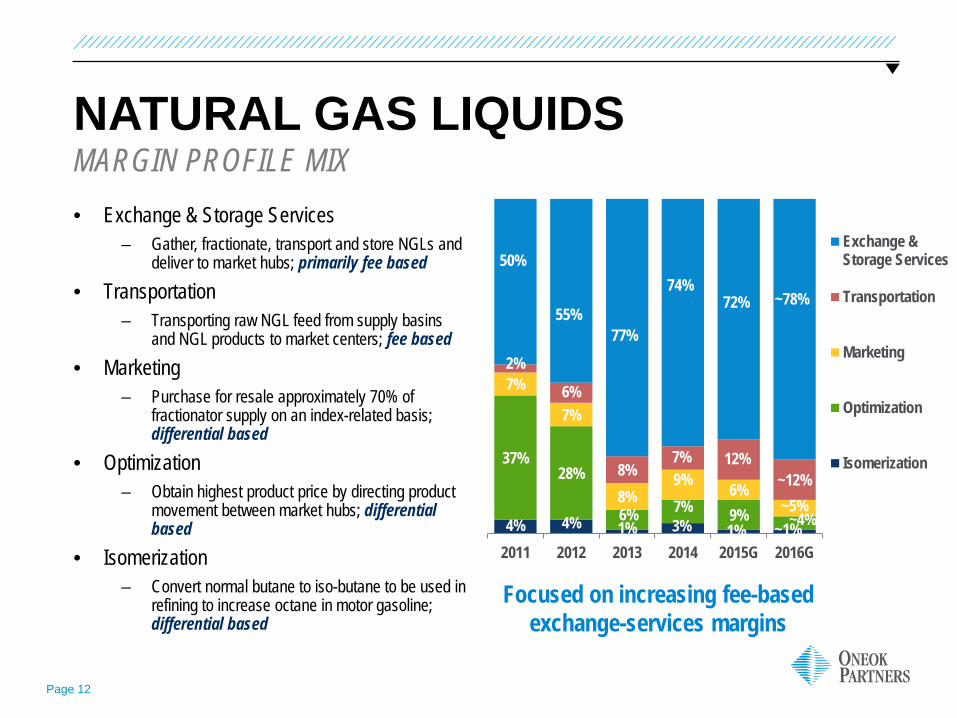
4% 4% 1% 3% 1% ~1%
37% 28%
6% 7% 9% ~4%
7%
7%
8% 9% 6%
~5%
2%
6%
8% 7% 12%
~12%
50%
55% 77%
74% 72% ~78%
2011 2012 2013 2014 2015G 2016G
Exchange &Storage Services
Transportation
Marketing
Optimization
Isomerization
NATURAL GAS LIQUIDS
• Exchange & Storage Services – Gather, fractionate, transport and store NGLs and
deliver to market hubs; primarily fee based • Transportation
– Transporting raw NGL feed from supply basins and NGL products to market centers; fee based
• Marketing – Purchase for resale approximately 70% of
fractionator supply on an index-related basis; differential based
• Optimization – Obtain highest product price by directing product
movement between market hubs; differential based
• Isomerization – Convert normal butane to iso-butane to be used in
refining to increase octane in motor gasoline; differential based
MARGIN PROFILE MIX
Focused on increasing fee-based exchange-services margins
Page 13
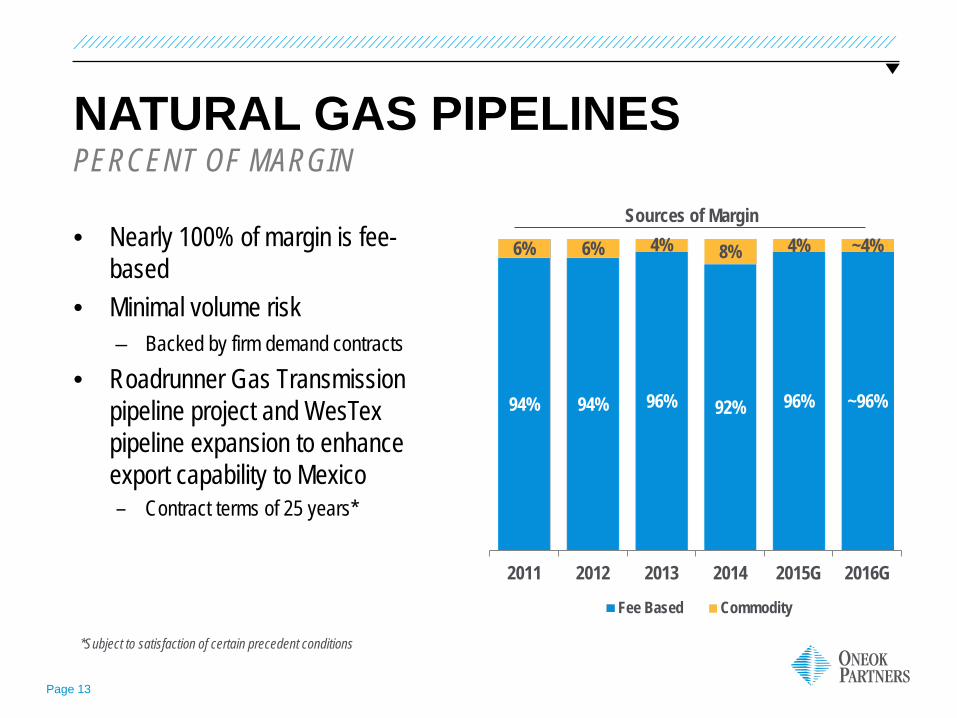
NATURAL GAS PIPELINES
• Nearly 100% of margin is fee-based
• Minimal volume risk – Backed by firm demand contracts
• Roadrunner Gas Transmission pipeline project and WesTex pipeline expansion to enhance export capability to Mexico – Contract terms of 25 years*
PERCENT OF MARGIN Sources of Margin
94% 94% 96% 92% 96% ~96%
6% 6% 4% 8% 4% ~4%
2011 2012 2013 2014 2015G 2016G
Fee Based Commodity
*Subject to satisfaction of certain precedent conditions
Page 14
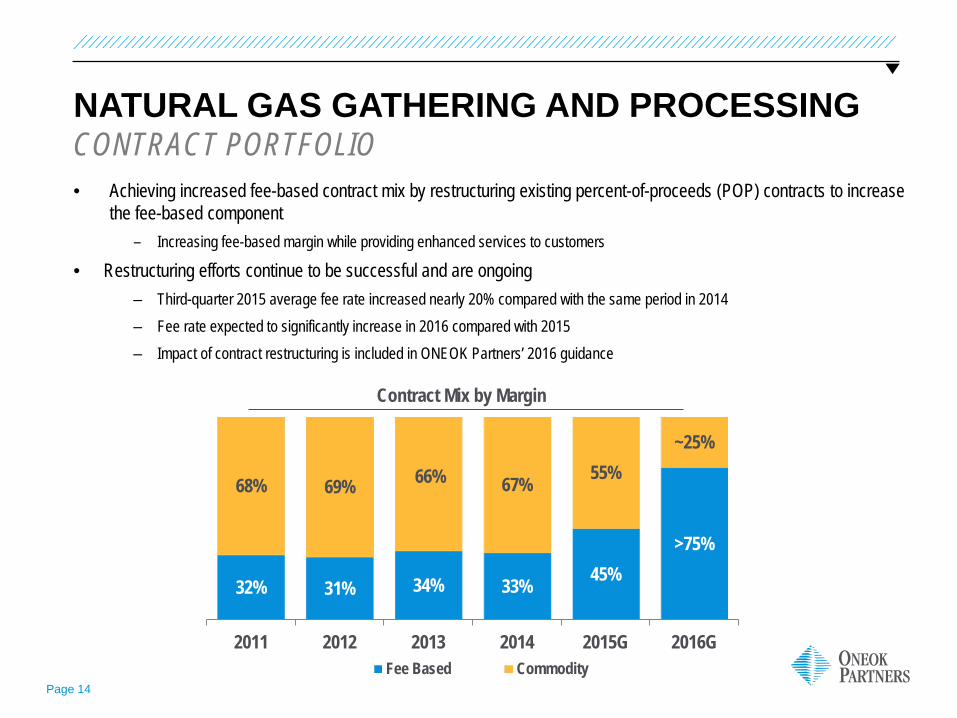
32% 31% 34% 33% 45% >75%
68% 69% 66% 67% 55% ~25%
2011 2012 2013 2014 2015G 2016GFee Based Commodity
NATURAL GAS GATHERING AND PROCESSING
• Achieving increased fee-based contract mix by restructuring existing percent-of-proceeds (POP) contracts to increase the fee-based component
– Increasing fee-based margin while providing enhanced services to customers
• Restructuring efforts continue to be successful and are ongoing – Third-quarter 2015 average fee rate increased nearly 20% compared with the same period in 2014 – Fee rate expected to significantly increase in 2016 compared with 2015 – Impact of contract restructuring is included in ONEOK Partners’ 2016 guidance
CONTRACT PORTFOLIO
Contract Mix by Margin
Page 15
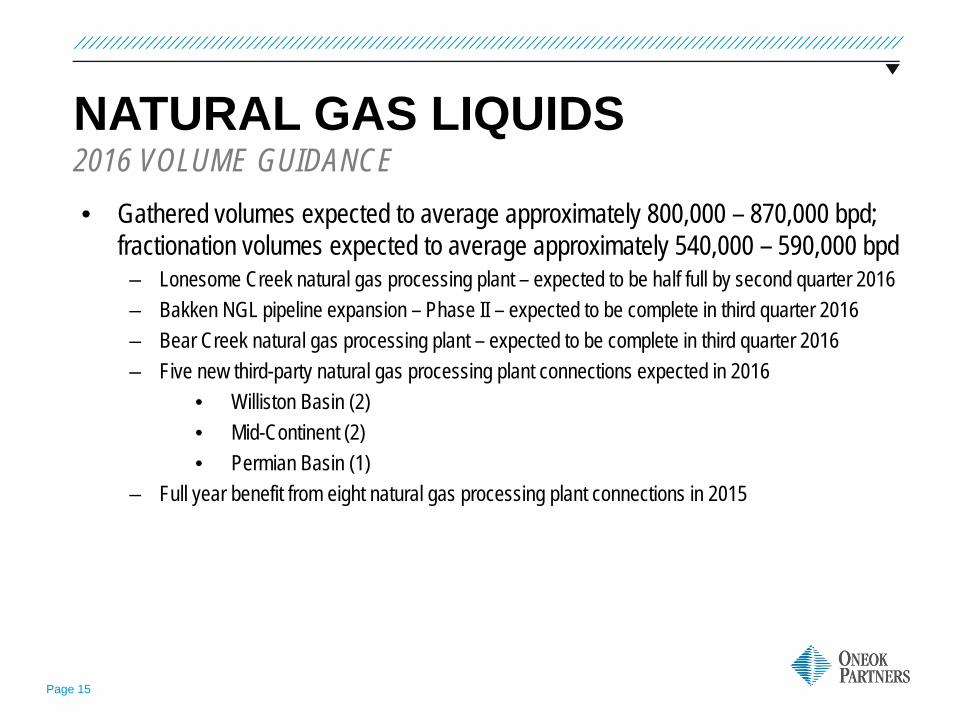
NATURAL GAS LIQUIDS 2016 VOLUME GUIDANCE • Gathered volumes expected to average approximately 800,000 – 870,000 bpd;
fractionation volumes expected to average approximately 540,000 – 590,000 bpd ‒ Lonesome Creek natural gas processing plant – expected to be half full by second quarter 2016 – Bakken NGL pipeline expansion – Phase II – expected to be complete in third quarter 2016 – Bear Creek natural gas processing plant – expected to be complete in third quarter 2016 – Five new third-party natural gas processing plant connections expected in 2016
• Williston Basin (2) • Mid-Continent (2) • Permian Basin (1)
– Full year benefit from eight natural gas processing plant connections in 2015
Page 16
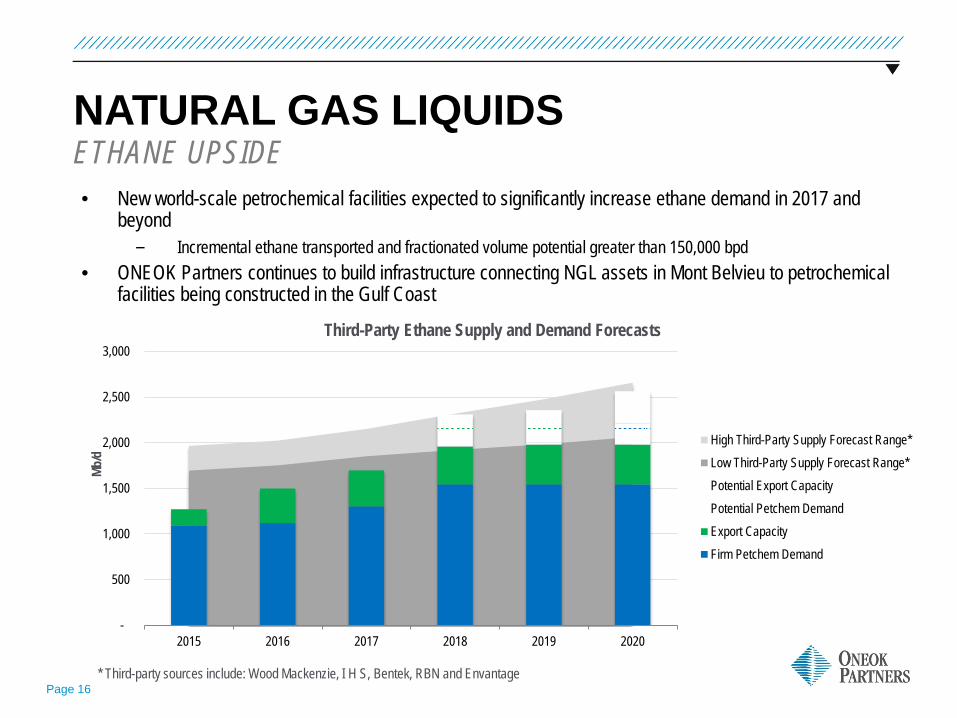
NATURAL GAS LIQUIDS ETHANE UPSIDE • New world-scale petrochemical facilities expected to significantly increase ethane demand in 2017 and
beyond – Incremental ethane transported and fractionated volume potential greater than 150,000 bpd
• ONEOK Partners continues to build infrastructure connecting NGL assets in Mont Belvieu to petrochemical facilities being constructed in the Gulf Coast
-
500
1,000
1,500
2,000
2,500
3,000
2015 2016 2017 2018 2019 2020
Mb/d
Third-Party Ethane Supply and Demand Forecasts
High Third-Party Supply Forecast Range*Low Third-Party Supply Forecast Range*Potential Export CapacityPotential Petchem DemandExport CapacityFirm Petchem Demand
* Third-party sources include: Wood Mackenzie, I H S, Bentek, RBN and Envantage
Page 17
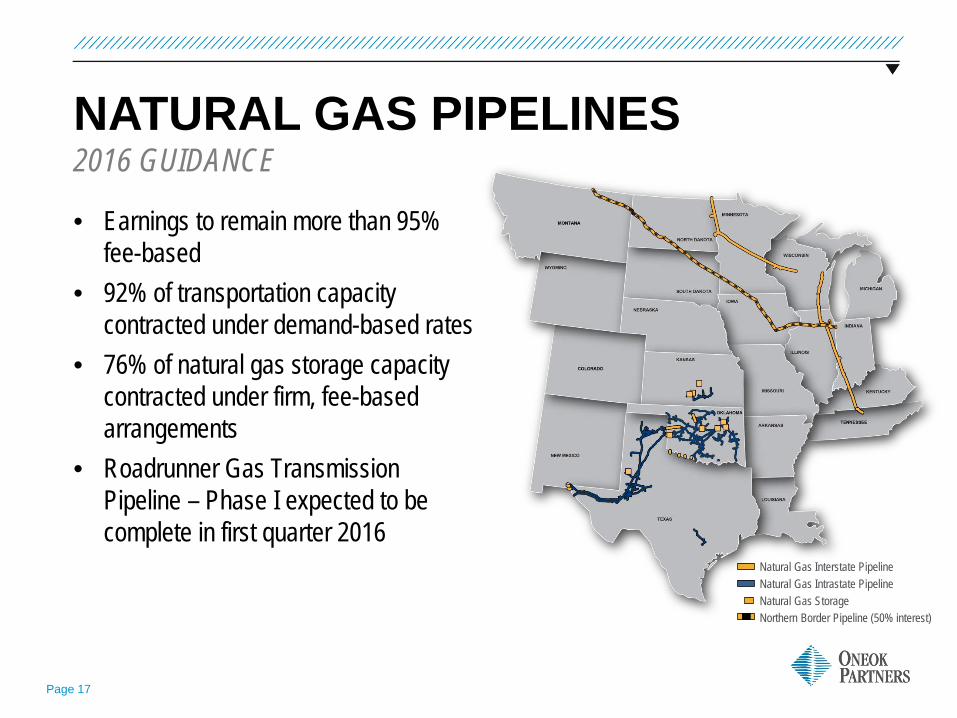
NATURAL GAS PIPELINES
• Earnings to remain more than 95% fee-based
• 92% of transportation capacity contracted under demand-based rates
• 76% of natural gas storage capacity contracted under firm, fee-based arrangements
• Roadrunner Gas Transmission Pipeline – Phase I expected to be complete in first quarter 2016
2016 GUIDANCE
Natural Gas Interstate Pipeline Natural Gas Intrastate Pipeline Natural Gas Storage Northern Border Pipeline (50% interest)
Page 18
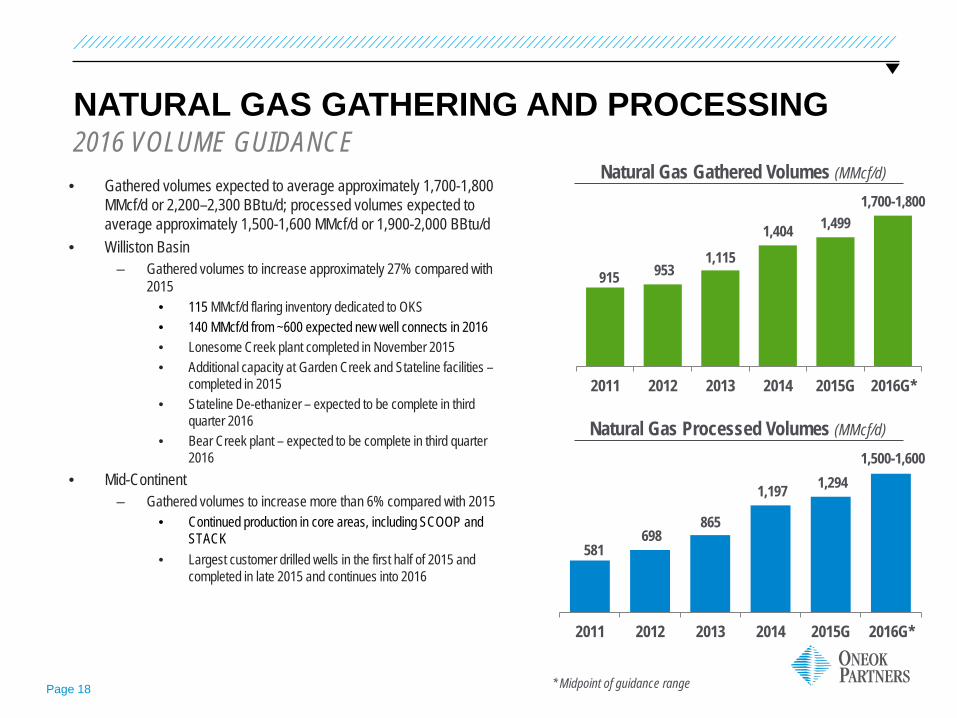
581 698
865
1,197 1,294 1,500-1,600
2011 2012 2013 2014 2015G 2016G*
Natural Gas Processed Volumes (MMcf/d)
NATURAL GAS GATHERING AND PROCESSING 2016 VOLUME GUIDANCE
• Gathered volumes expected to average approximately 1,700-1,800 MMcf/d or 2,200–2,300 BBtu/d; processed volumes expected to average approximately 1,500-1,600 MMcf/d or 1,900-2,000 BBtu/d
• Williston Basin – Gathered volumes to increase approximately 27% compared with
2015 • 115 MMcf/d flaring inventory dedicated to OKS • 140 MMcf/d from ~600 expected new well connects in 2016 • Lonesome Creek plant completed in November 2015 • Additional capacity at Garden Creek and Stateline facilities –
completed in 2015 • Stateline De-ethanizer – expected to be complete in third
quarter 2016 • Bear Creek plant – expected to be complete in third quarter
2016 • Mid-Continent
– Gathered volumes to increase more than 6% compared with 2015 • Continued production in core areas, including SCOOP and
STACK • Largest customer drilled wells in the first half of 2015 and
completed in late 2015 and continues into 2016
915 953 1,115
1,404 1,499 1,700-1,800
2011 2012 2013 2014 2015G 2016G*
Natural Gas Gathered Volumes (MMcf/d)
* Midpoint of guidance range
Page 19
-
100
200
300
400
500
600
700
800
900
1,000
2014 2015 2016 2017
Volu
me
MMcf
d
Available Production Gathered Volume
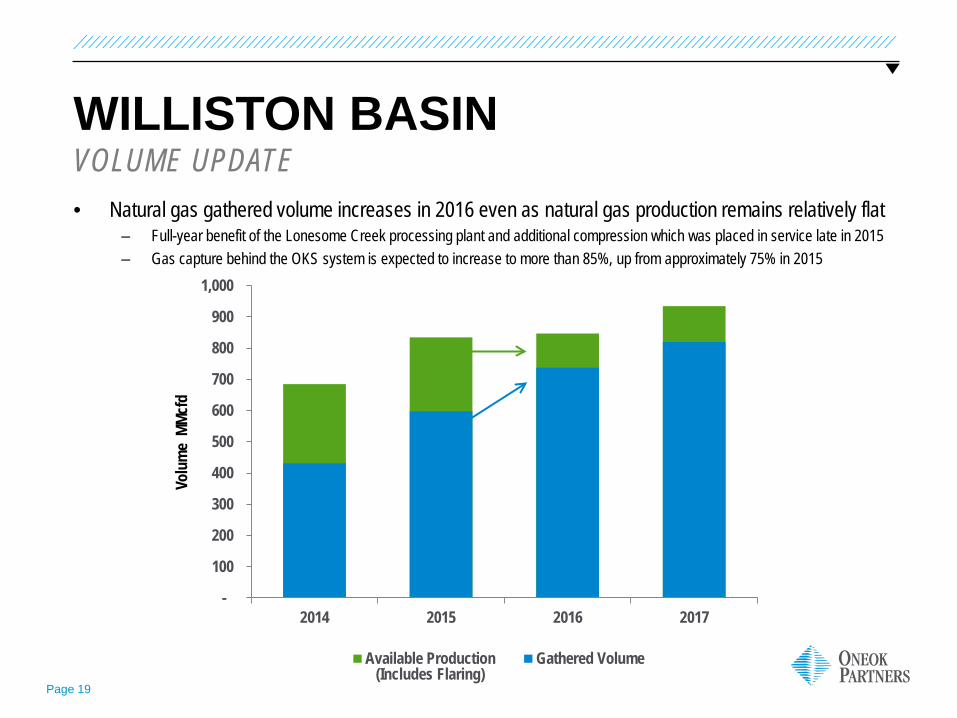
WILLISTON BASIN
• Natural gas gathered volume increases in 2016 even as natural gas production remains relatively flat – Full-year benefit of the Lonesome Creek processing plant and additional compression which was placed in service late in 2015 – Gas capture behind the OKS system is expected to increase to more than 85%, up from approximately 75% in 2015
VOLUME UPDATE
(Includes Flaring)
Page 20
300
400
500
600
700
800
900
2015 GatheredVolume Exit Rate
Flared VolumesAvailabe for
Capture
Natural Declines 2016 GatheredVolume Exit Rate
2016 AnnualAverage
Gathered VolumeWithout New
Wells
New Wells(Drilled & DUCs)
Prod
uctio
n Vo
lum
e MM
cfd
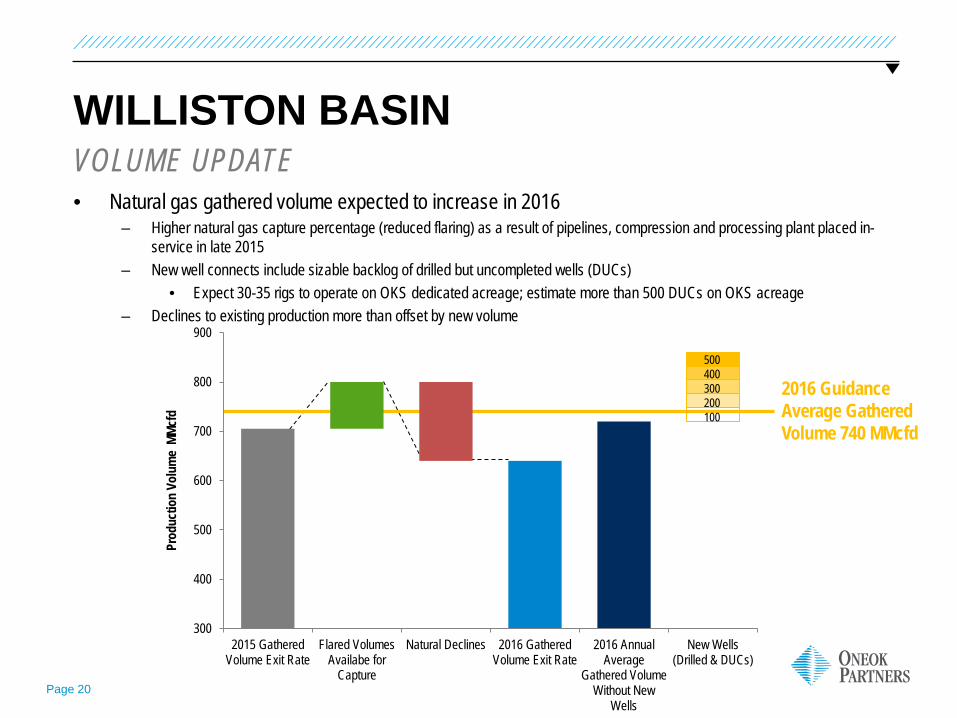
2016 Guidance Average Gathered Volume 740 MMcfd
WILLISTON BASIN
• Natural gas gathered volume expected to increase in 2016 – Higher natural gas capture percentage (reduced flaring) as a result of pipelines, compression and processing plant placed in-
service in late 2015 – New well connects include sizable backlog of drilled but uncompleted wells (DUCs)
• Expect 30-35 rigs to operate on OKS dedicated acreage; estimate more than 500 DUCs on OKS acreage – Declines to existing production more than offset by new volume
VOLUME UPDATE
500 400 300 200 100
Page 21
-
200
400
600
800
1,000
1,200
1,400
1,600
1,800
2,000
Jan-14 Jul-14 Jan-15 Jul-15 Jan-16 Jul-16 Jan-17 Jul-17
Volu
me
MMcf
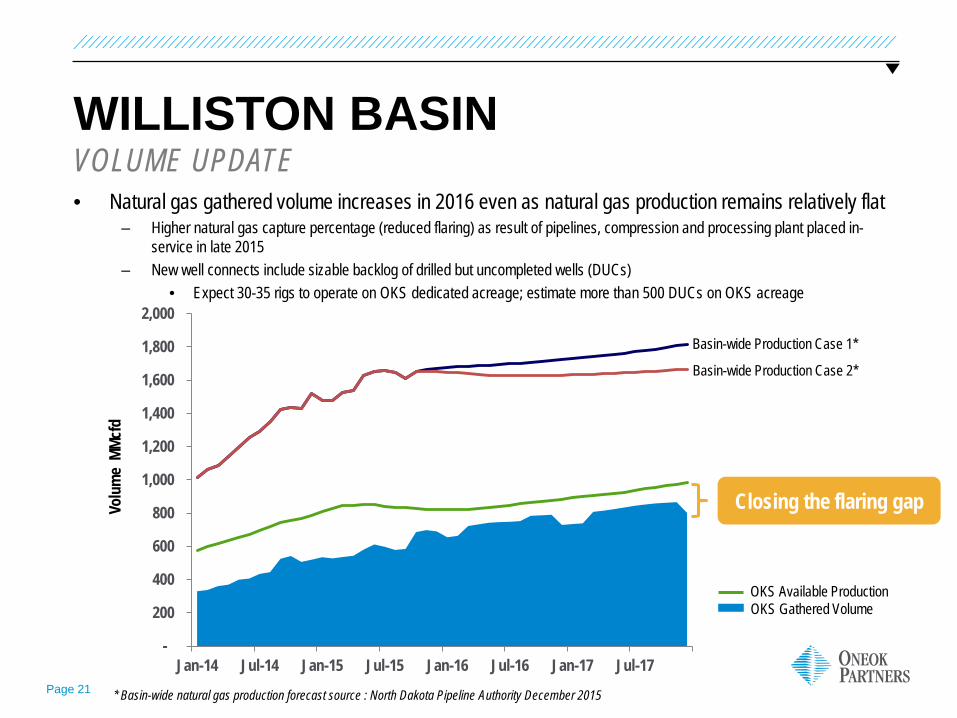
d WILLISTON BASIN • Natural gas gathered volume increases in 2016 even as natural gas production remains relatively flat
– Higher natural gas capture percentage (reduced flaring) as result of pipelines, compression and processing plant placed in-service in late 2015
– New well connects include sizable backlog of drilled but uncompleted wells (DUCs) • Expect 30-35 rigs to operate on OKS dedicated acreage; estimate more than 500 DUCs on OKS acreage
VOLUME UPDATE
* Basin-wide natural gas production forecast source : North Dakota Pipeline Authority December 2015
OKS Available Production OKS Gathered Volume
Basin-wide Production Case 1*
Basin-wide Production Case 2*
Closing the flaring gap
Page 22
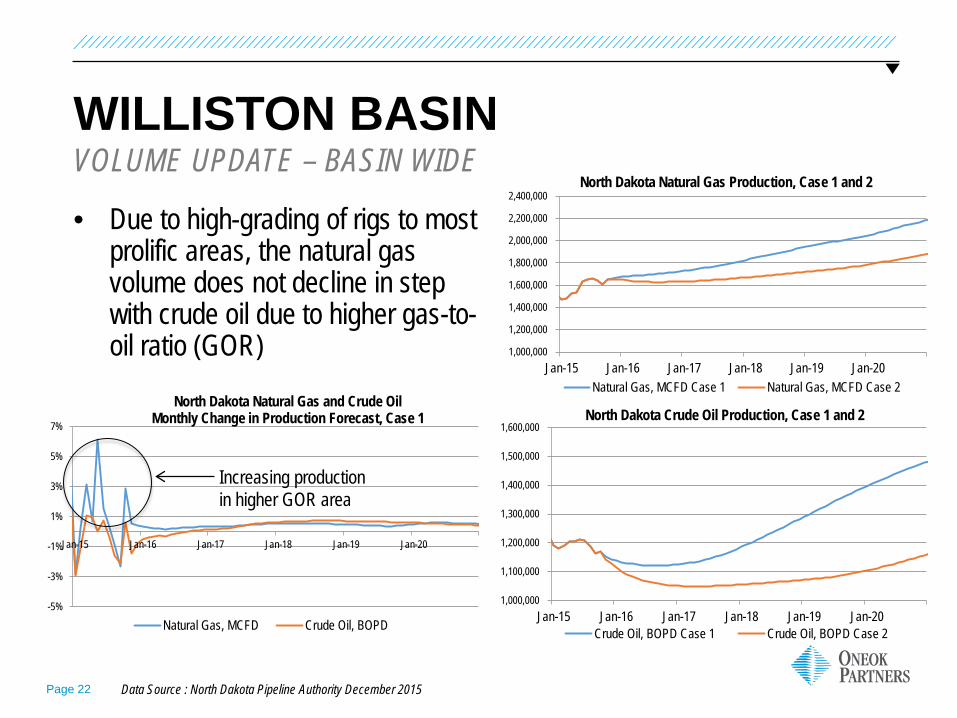
WILLISTON BASIN
• Due to high-grading of rigs to most prolific areas, the natural gas volume does not decline in step with crude oil due to higher gas-to-oil ratio (GOR)
VOLUME UPDATE – BASIN WIDE
Data Source : North Dakota Pipeline Authority December 2015
-5%
-3%
-1%
1%
3%
5%
7%
Jan-15 Jan-16 Jan-17 Jan-18 Jan-19 Jan-20
North Dakota Natural Gas and Crude Oil Monthly Change in Production Forecast, Case 1
Natural Gas, MCFD Crude Oil, BOPD
1,000,000
1,200,000
1,400,000
1,600,000
1,800,000
2,000,000
2,200,000
2,400,000
Jan-15 Jan-16 Jan-17 Jan-18 Jan-19 Jan-20
North Dakota Natural Gas Production, Case 1 and 2
Natural Gas, MCFD Case 1 Natural Gas, MCFD Case 2
1,000,000
1,100,000
1,200,000
1,300,000
1,400,000
1,500,000
1,600,000
Jan-15 Jan-16 Jan-17 Jan-18 Jan-19 Jan-20
North Dakota Crude Oil Production, Case 1 and 2
Crude Oil, BOPD Case 1 Crude Oil, BOPD Case 2
Increasing production in higher GOR area

FINANCIAL STRENGTH
Page 24
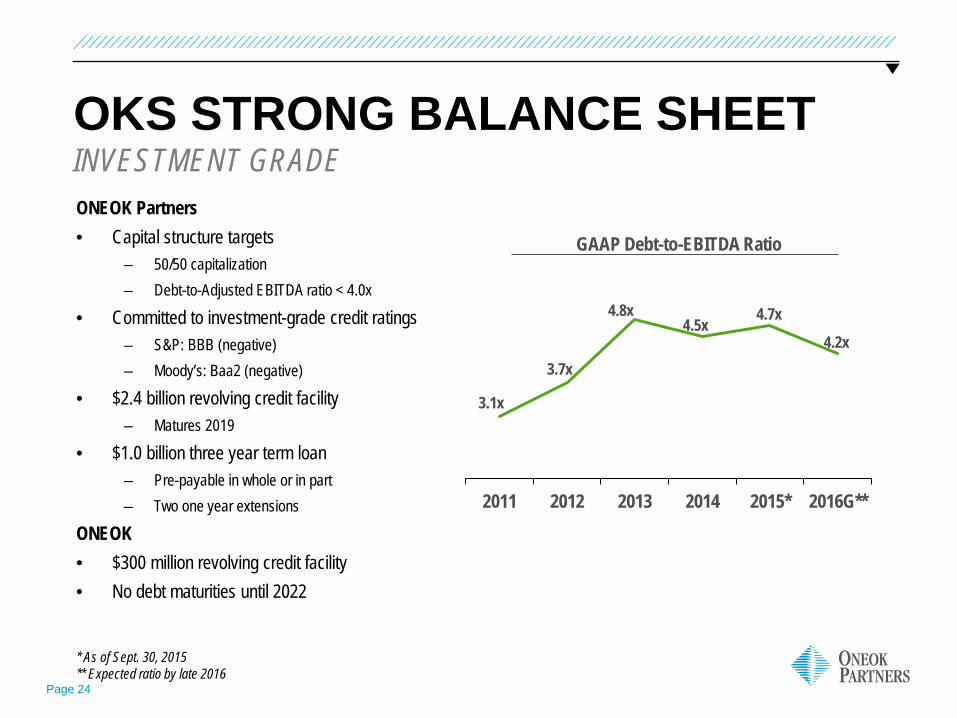
OKS STRONG BALANCE SHEET
ONEOK Partners • Capital structure targets
– 50/50 capitalization – Debt-to-Adjusted EBITDA ratio < 4.0x
• Committed to investment-grade credit ratings – S&P: BBB (negative) – Moody’s: Baa2 (negative)
• $2.4 billion revolving credit facility – Matures 2019
• $1.0 billion three year term loan – Pre-payable in whole or in part – Two one year extensions
ONEOK • $300 million revolving credit facility • No debt maturities until 2022
INVESTMENT GRADE
* As of Sept. 30, 2015 ** Expected ratio by late 2016
3.1x
3.7x
4.8x 4.5x 4.7x
4.2x
2011 2012 2013 2014 2015* 2016G**
GAAP Debt-to-EBITDA Ratio
ONEOK OVERVIEW AND 2016 GUIDANCE
Page 26
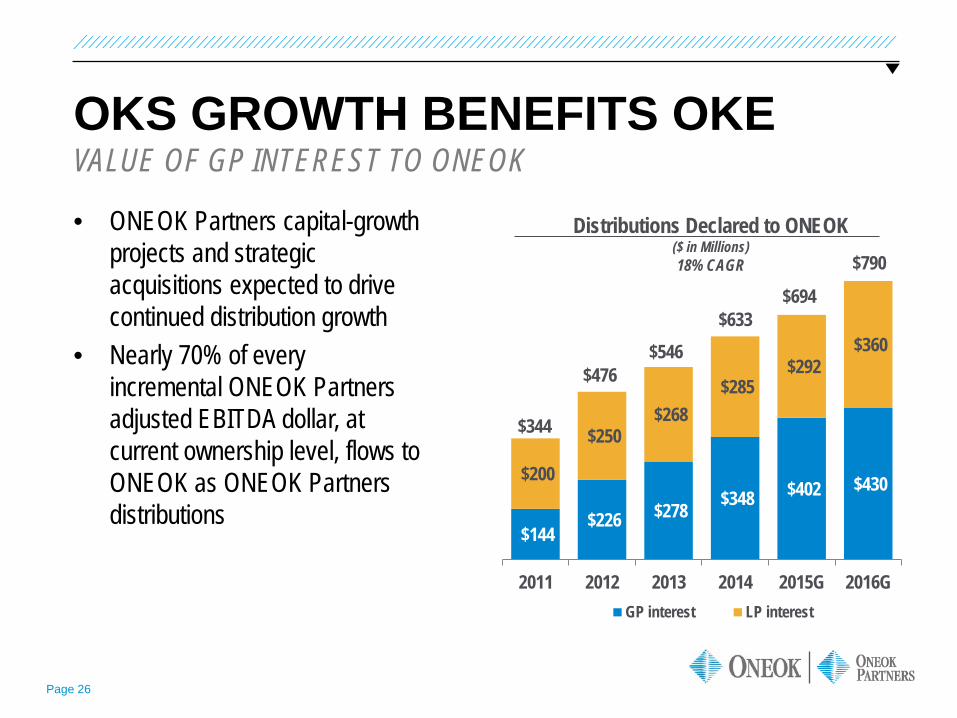
Distributions Declared to ONEOK ($ in Millions) 18% CAGR
$144 $226 $278 $348 $402 $430 $200
$250 $268
$285 $292
$360
2011 2012 2013 2014 2015G 2016GGP interest LP interest
$694
$790
OKS GROWTH BENEFITS OKE
• ONEOK Partners capital-growth projects and strategic acquisitions expected to drive continued distribution growth
• Nearly 70% of every incremental ONEOK Partners adjusted EBITDA dollar, at current ownership level, flows to ONEOK as ONEOK Partners distributions
VALUE OF GP INTEREST TO ONEOK
$633 $546
$476
$344
Page 27
ONEOK
ONEOK expects: • Dividend to remain flat • Cash flow available for dividends of approximately $675 million • Dividend coverage ratio of approximately 1.3x • Free cash flow after dividends and cash on hand totaling approximately $250
million available to support ONEOK Partners • No cash income taxes in 2016 • No debt maturities until 2022
2016 GUIDANCE SUMMARY
Page 28
KEY INVESTMENT CONSIDERATIONS PREMIER ENERGY COMPANIES ONEOK • Stable cash flow
– Cash flow underpinned by investment-grade MLP with fee-based business model – GP and LP distributions from ONEOK Partners drive significant cash flow generation and growth – Prudent financial practices results in financial strength and flexibility
ONEOK Partners • Stable cash flow
– Primarily fee based, non-discretionary services – Prudent financial practices: proactively manage commodity risk – Strong balance sheet and financial flexibility: maintain investment grade credit ratings with ample liquidity to support capital growth projects
• Strategic, integrated assets connecting prolific supply basins and key markets create opportunities – Non-discretionary services to producers, processors and customers – NGL infrastructure to support expected increased ethane demand beginning in 2017 – Natural gas infrastructure to supply growing natural gas exports to Mexico
• Focused on creating value for both customers and investors – Demonstrated financial discipline – Commitment to investment-grade credit ratings at ONEOK Partners
• Disciplined growth – Aligning capital growth projects with producer customer needs as a result of lower commodity prices
• Safe, reliable and environmentally responsible operator – Proven track record and commitment
Page 29
APPENDIX
APPENDIX – ONEOK PARTNERS BUSINESS SEGMENTS
Page 31
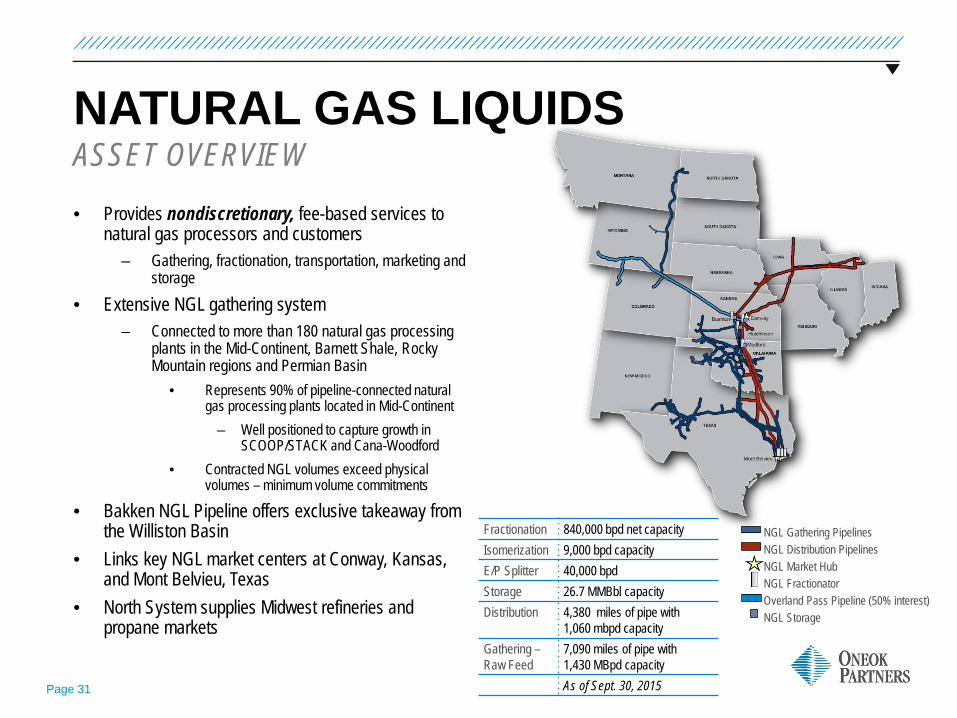
NATURAL GAS LIQUIDS
• Provides nondiscretionary, fee-based services to natural gas processors and customers
– Gathering, fractionation, transportation, marketing and storage
• Extensive NGL gathering system – Connected to more than 180 natural gas processing
plants in the Mid-Continent, Barnett Shale, Rocky Mountain regions and Permian Basin
• Represents 90% of pipeline-connected natural gas processing plants located in Mid-Continent
– Well positioned to capture growth in SCOOP/STACK and Cana-Woodford
• Contracted NGL volumes exceed physical volumes – minimum volume commitments
• Bakken NGL Pipeline offers exclusive takeaway from the Williston Basin
• Links key NGL market centers at Conway, Kansas, and Mont Belvieu, Texas
• North System supplies Midwest refineries and propane markets
ASSET OVERVIEW
Fractionation 840,000 bpd net capacity Isomerization 9,000 bpd capacity E/P Splitter 40,000 bpd Storage 26.7 MMBbl capacity Distribution 4,380 miles of pipe with
1,060 mbpd capacity Gathering – Raw Feed
7,090 miles of pipe with 1,430 MBpd capacity As of Sept. 30, 2015
NGL Gathering Pipelines NGL Distribution Pipelines NGL Market Hub NGL Fractionator Overland Pass Pipeline (50% interest) NGL Storage
Page 32
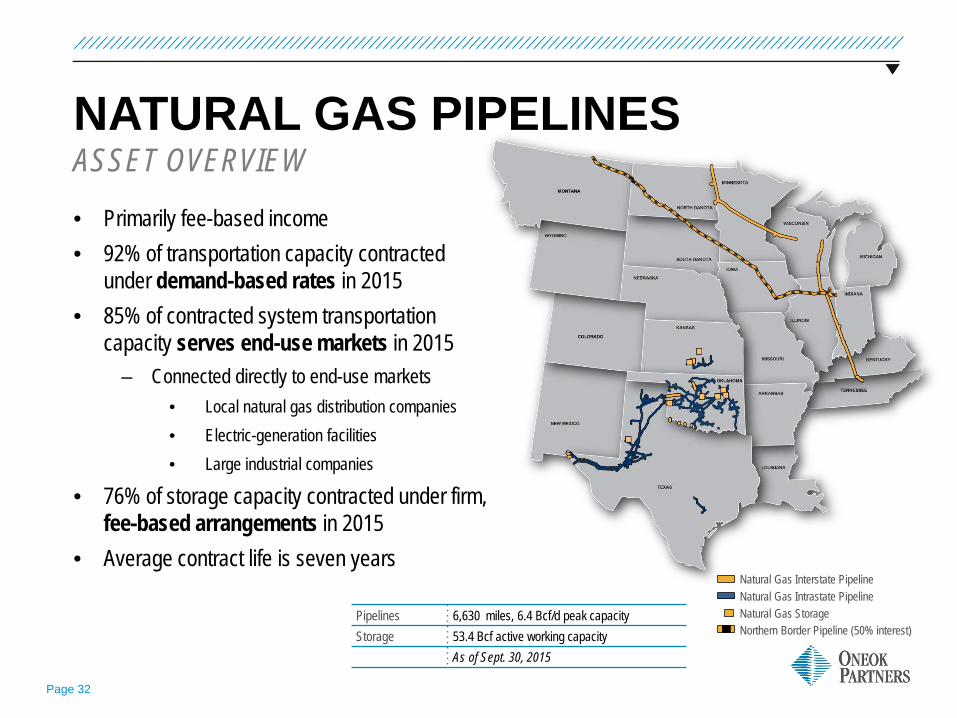
NATURAL GAS PIPELINES
• Primarily fee-based income • 92% of transportation capacity contracted
under demand-based rates in 2015 • 85% of contracted system transportation
capacity serves end-use markets in 2015 – Connected directly to end-use markets
• Local natural gas distribution companies • Electric-generation facilities • Large industrial companies
• 76% of storage capacity contracted under firm, fee-based arrangements in 2015
• Average contract life is seven years
ASSET OVERVIEW
Natural Gas Interstate Pipeline Natural Gas Intrastate Pipeline Natural Gas Storage Northern Border Pipeline (50% interest)
Pipelines 6,630 miles, 6.4 Bcf/d peak capacity Storage 53.4 Bcf active working capacity
As of Sept. 30, 2015
Page 33
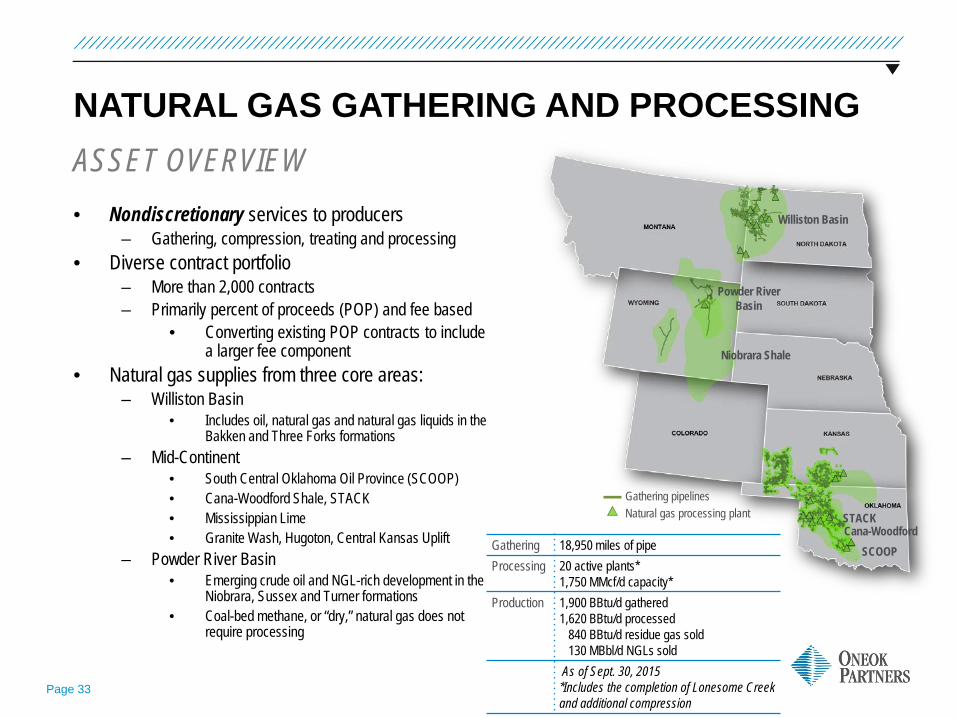
NATURAL GAS GATHERING AND PROCESSING
• Nondiscretionary services to producers – Gathering, compression, treating and processing
• Diverse contract portfolio – More than 2,000 contracts – Primarily percent of proceeds (POP) and fee based
• Converting existing POP contracts to include a larger fee component
• Natural gas supplies from three core areas: – Williston Basin
• Includes oil, natural gas and natural gas liquids in the Bakken and Three Forks formations
– Mid-Continent • South Central Oklahoma Oil Province (SCOOP) • Cana-Woodford Shale, STACK • Mississippian Lime • Granite Wash, Hugoton, Central Kansas Uplift
– Powder River Basin • Emerging crude oil and NGL-rich development in the
Niobrara, Sussex and Turner formations • Coal-bed methane, or “dry,” natural gas does not
require processing
ASSET OVERVIEW Williston Basin
Powder River Basin
STACK
Niobrara Shale
SCOOP
Gathering pipelines Natural gas processing plant
Cana-Woodford Gathering 18,950 miles of pipe Processing 20 active plants*
1,750 MMcf/d capacity* Production
1,900 BBtu/d gathered 1,620 BBtu/d processed 840 BBtu/d residue gas sold 130 MBbl/d NGLs sold As of Sept. 30, 2015 *Includes the completion of Lonesome Creek and additional compression
Volume Growth Continues in Challenging Environment
APPENDIX – 2015 VOLUME GUIDANCE
Page 35
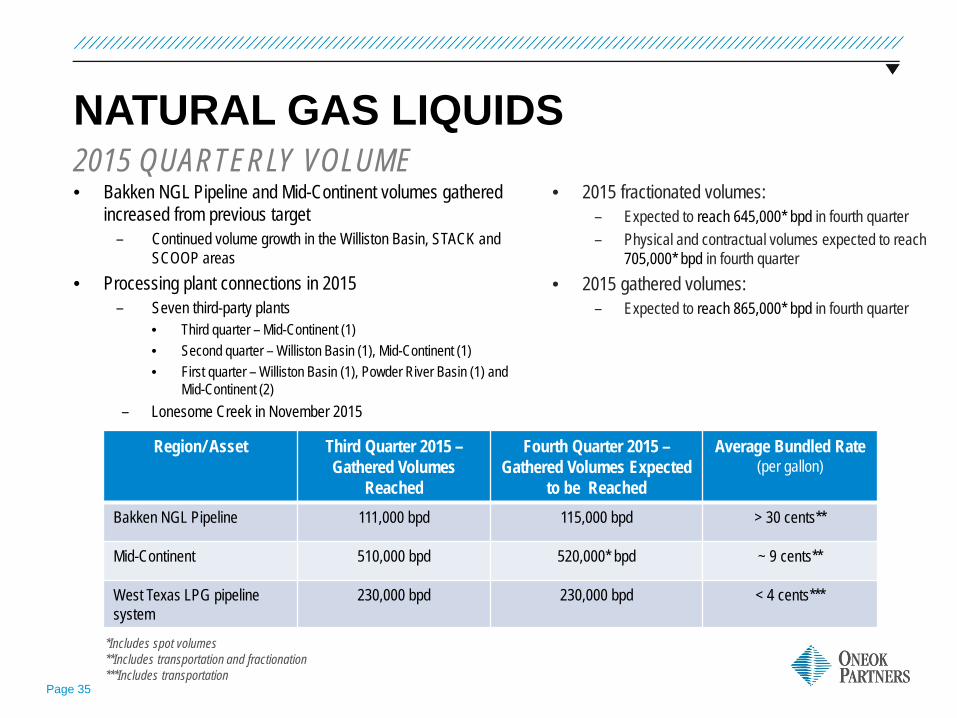
NATURAL GAS LIQUIDS • Bakken NGL Pipeline and Mid-Continent volumes gathered
increased from previous target – Continued volume growth in the Williston Basin, STACK and
SCOOP areas • Processing plant connections in 2015
– Seven third-party plants • Third quarter – Mid-Continent (1) • Second quarter – Williston Basin (1), Mid-Continent (1) • First quarter – Williston Basin (1), Powder River Basin (1) and
Mid-Continent (2) – Lonesome Creek in November 2015
2015 QUARTERLY VOLUME • 2015 fractionated volumes:
– Expected to reach 645,000* bpd in fourth quarter – Physical and contractual volumes expected to reach
705,000* bpd in fourth quarter • 2015 gathered volumes:
– Expected to reach 865,000* bpd in fourth quarter
Region/ Asset Third Quarter 2015 – Gathered Volumes
Reached
Fourth Quarter 2015 – Gathered Volumes Expected
to be Reached
Average Bundled Rate (per gallon)
Bakken NGL Pipeline 111,000 bpd 115,000 bpd > 30 cents**
Mid-Continent 510,000 bpd 520,000* bpd ~ 9 cents**
West Texas LPG pipeline system
230,000 bpd
230,000 bpd < 4 cents***
*Includes spot volumes **Includes transportation and fractionation ***Includes transportation
Page 36
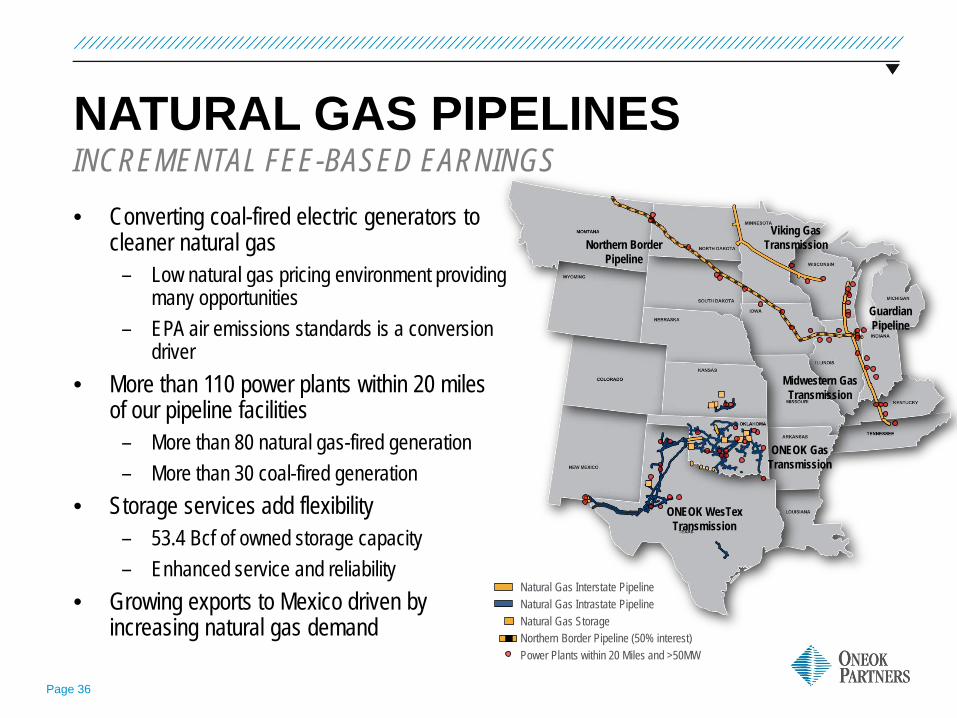
NATURAL GAS PIPELINES
• Converting coal-fired electric generators to cleaner natural gas
– Low natural gas pricing environment providing many opportunities
– EPA air emissions standards is a conversion driver
• More than 110 power plants within 20 miles of our pipeline facilities
– More than 80 natural gas-fired generation – More than 30 coal-fired generation
• Storage services add flexibility – 53.4 Bcf of owned storage capacity – Enhanced service and reliability
• Growing exports to Mexico driven by increasing natural gas demand
INCREMENTAL FEE-BASED EARNINGS
Natural Gas Interstate Pipeline Natural Gas Intrastate Pipeline Natural Gas Storage Northern Border Pipeline (50% interest) Power Plants within 20 Miles and >50MW
Midwestern Gas Transmission
Guardian Pipeline
Northern Border Pipeline
Viking Gas Transmission
ONEOK Gas Transmission
ONEOK WesTex Transmission
Page 37
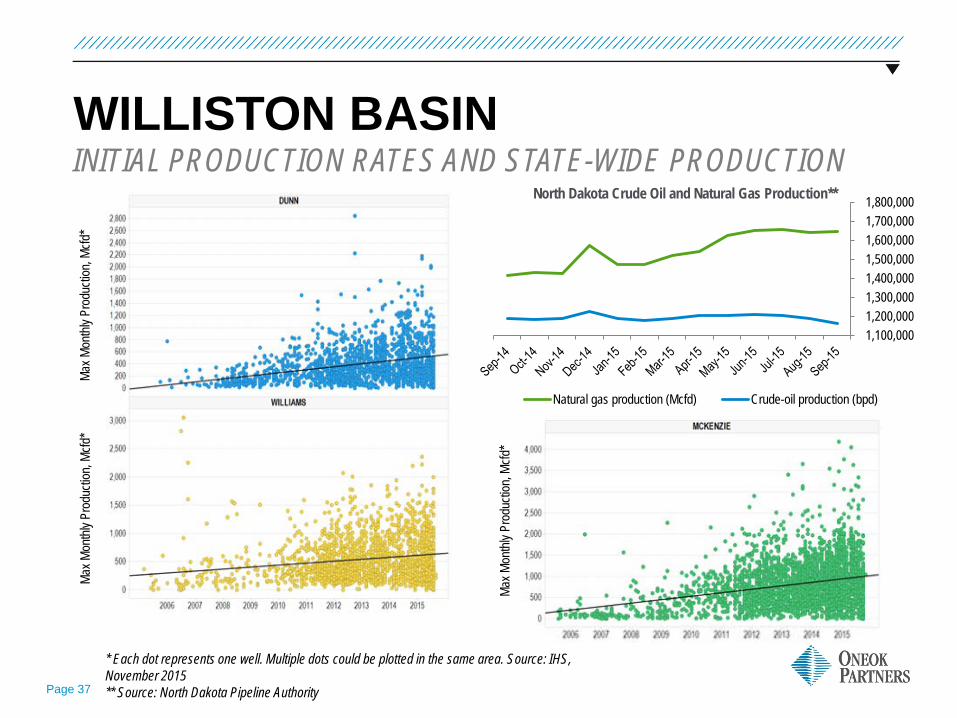
WILLISTON BASIN INITIAL PRODUCTION RATES AND STATE-WIDE PRODUCTION
Max M
onthl
y Pro
ducti
on, M
cfd*
Max M
onthl
y Pro
ducti
on, M
cfd*
Max M
onthl
y Pro
ducti
on, M
cfd*
* Each dot represents one well. Multiple dots could be plotted in the same area. Source: IHS, November 2015 ** Source: North Dakota Pipeline Authority
1,100,000 1,200,000 1,300,000 1,400,000 1,500,000 1,600,000 1,700,000 1,800,000North Dakota Crude Oil and Natural Gas Production**
Natural gas production (Mcfd) Crude-oil production (bpd)
Page 38
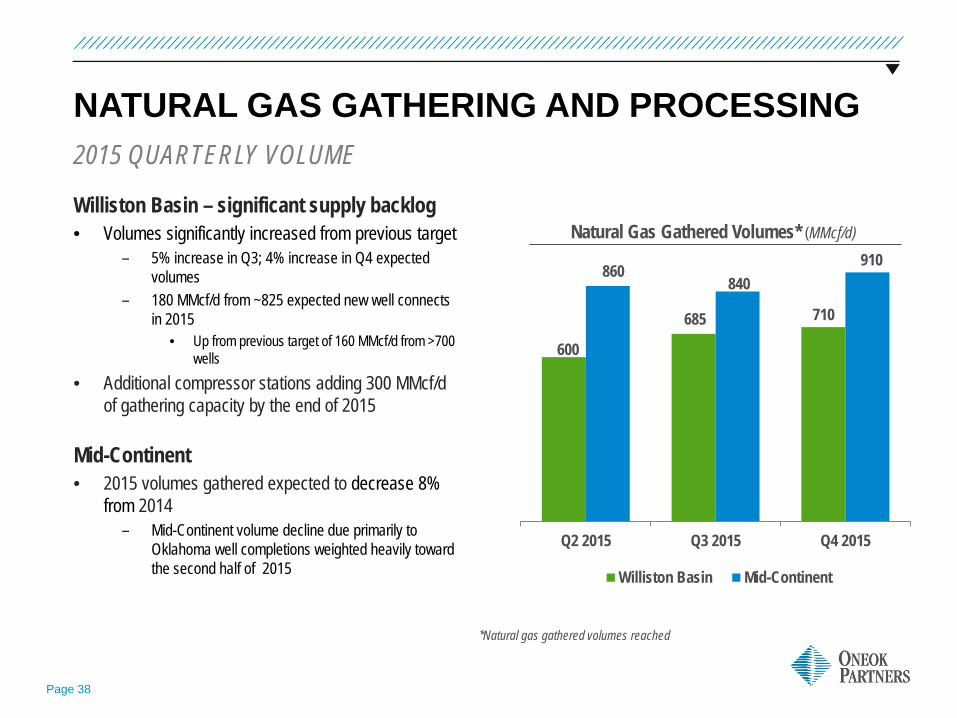
NATURAL GAS GATHERING AND PROCESSING
600
685 710
860 840
910
Q2 2015 Q3 2015 Q4 2015
Williston Basin Mid-Continent
2015 QUARTERLY VOLUME
Natural Gas Gathered Volumes* (MMcf/d) Williston Basin – significant supply backlog • Volumes significantly increased from previous target
– 5% increase in Q3; 4% increase in Q4 expected volumes
– 180 MMcf/d from ~825 expected new well connects in 2015
• Up from previous target of 160 MMcf/d from >700 wells
• Additional compressor stations adding 300 MMcf/d of gathering capacity by the end of 2015
Mid-Continent • 2015 volumes gathered expected to decrease 8%
from 2014 – Mid-Continent volume decline due primarily to
Oklahoma well completions weighted heavily toward the second half of 2015
*Natural gas gathered volumes reached
APPENDIX – NATURAL GAS GATHERING AND PROCESSING
Page 40
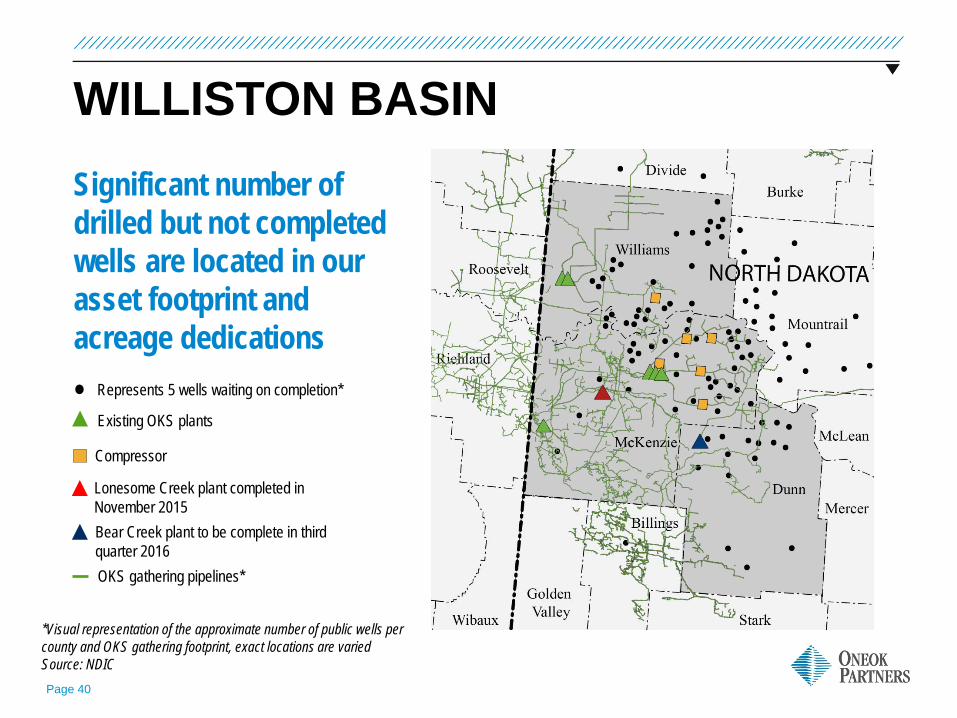
WILLISTON BASIN
*Visual representation of the approximate number of public wells per county and OKS gathering footprint, exact locations are varied Source: NDIC
Significant number of drilled but not completed wells are located in our asset footprint and acreage dedications
Lonesome Creek plant completed in November 2015
Compressor
Existing OKS plants
Represents 5 wells waiting on completion*
OKS gathering pipelines*
Bear Creek plant to be complete in third quarter 2016
Page 41
0
210
420
630
840
1,050
1,260
1,470
1,680
0%
5%
10%
15%
20%
25%
30%
35%
40%
2010 2011 2012 2013 2014 2015Gas Produced Percent of Gas Flared
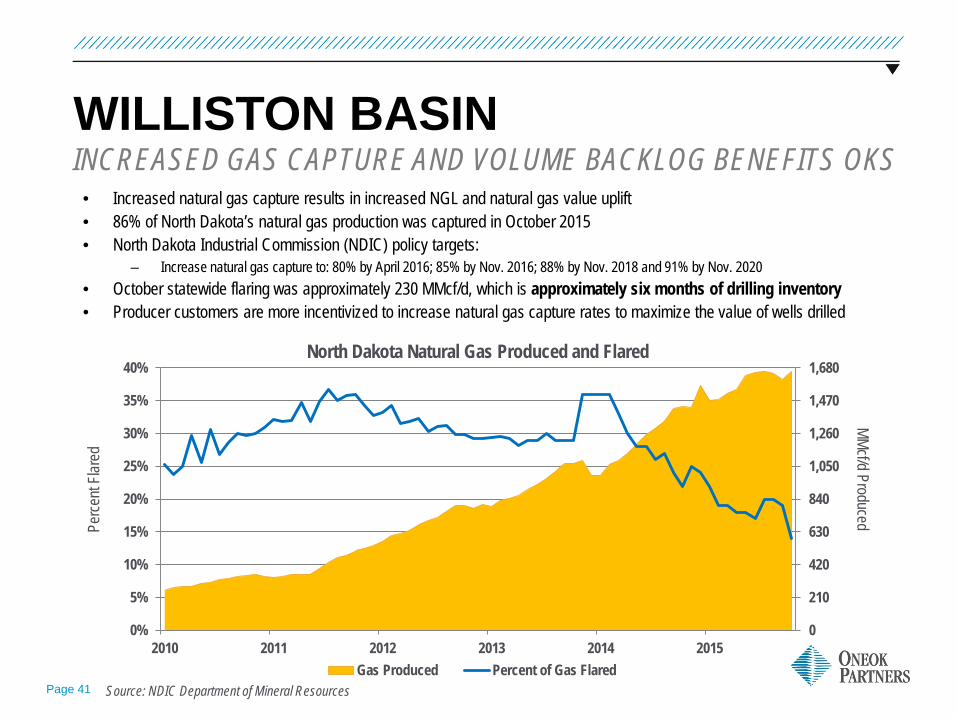
WILLISTON BASIN INCREASED GAS CAPTURE AND VOLUME BACKLOG BENEFITS OKS
Perce
nt Fla
red
MMcf/d Produced
North Dakota Natural Gas Produced and Flared
Source: NDIC Department of Mineral Resources
• Increased natural gas capture results in increased NGL and natural gas value uplift • 86% of North Dakota’s natural gas production was captured in October 2015 • North Dakota Industrial Commission (NDIC) policy targets:
– Increase natural gas capture to: 80% by April 2016; 85% by Nov. 2016; 88% by Nov. 2018 and 91% by Nov. 2020 • October statewide flaring was approximately 230 MMcf/d, which is approximately six months of drilling inventory • Producer customers are more incentivized to increase natural gas capture rates to maximize the value of wells drilled
Page 42
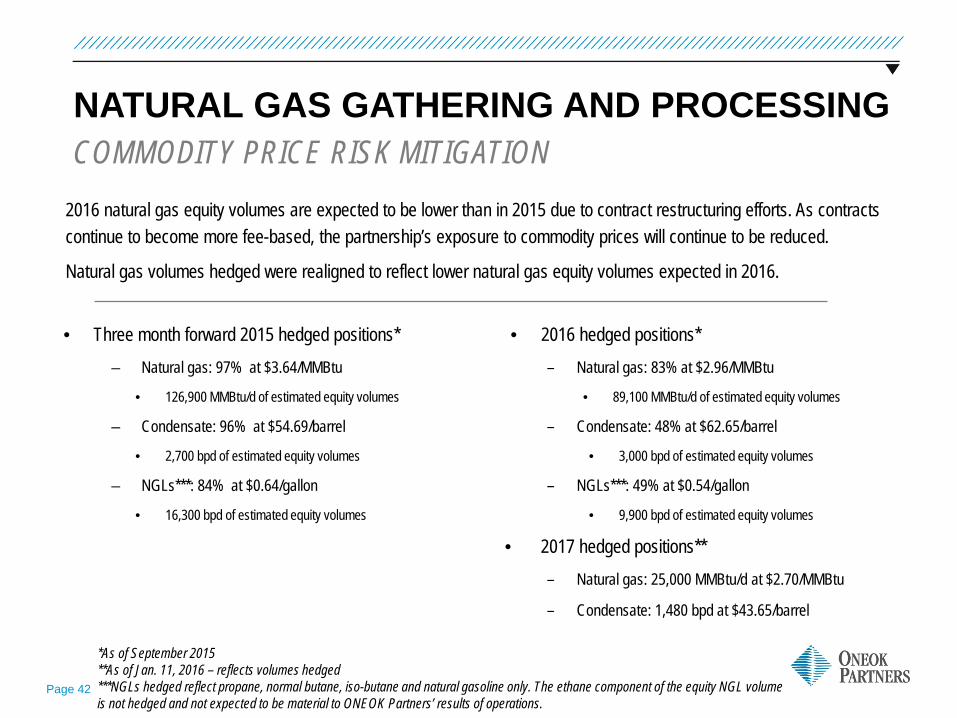
NATURAL GAS GATHERING AND PROCESSING COMMODITY PRICE RISK MITIGATION
• Three month forward 2015 hedged positions* – Natural gas: 97% at $3.64/MMBtu
• 126,900 MMBtu/d of estimated equity volumes
– Condensate: 96% at $54.69/barrel
• 2,700 bpd of estimated equity volumes
– NGLs***: 84% at $0.64/gallon
• 16,300 bpd of estimated equity volumes
• 2016 hedged positions* – Natural gas: 83% at $2.96/MMBtu
• 89,100 MMBtu/d of estimated equity volumes
– Condensate: 48% at $62.65/barrel
• 3,000 bpd of estimated equity volumes
– NGLs***: 49% at $0.54/gallon
• 9,900 bpd of estimated equity volumes
• 2017 hedged positions** – Natural gas: 25,000 MMBtu/d at $2.70/MMBtu
– Condensate: 1,480 bpd at $43.65/barrel
*As of September 2015 **As of Jan. 11, 2016 – reflects volumes hedged ***NGLs hedged reflect propane, normal butane, iso-butane and natural gasoline only. The ethane component of the equity NGL volume is not hedged and not expected to be material to ONEOK Partners’ results of operations.
2016 natural gas equity volumes are expected to be lower than in 2015 due to contract restructuring efforts. As contracts continue to become more fee-based, the partnership’s exposure to commodity prices will continue to be reduced.
Natural gas volumes hedged were realigned to reflect lower natural gas equity volumes expected in 2016.
Page 43
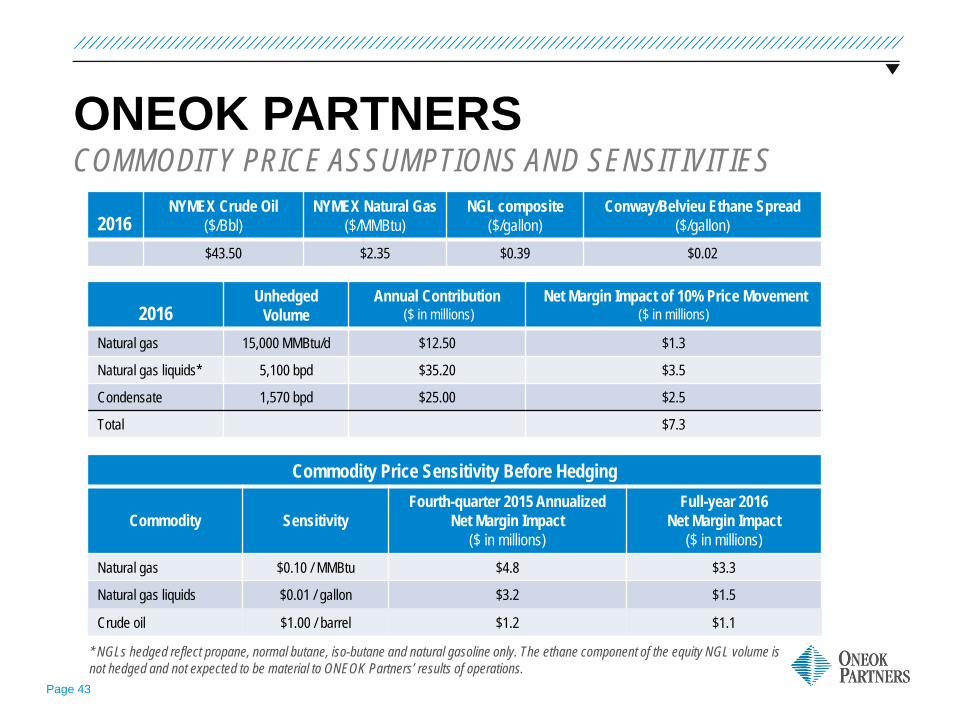
ONEOK PARTNERS COMMODITY PRICE ASSUMPTIONS AND SENSITIVITIES
2016 Unhedged
Volume Annual Contribution
($ in millions) Net Margin Impact of 10% Price Movement
($ in millions)
Natural gas 15,000 MMBtu/d $12.50 $1.3
Natural gas liquids* 5,100 bpd $35.20 $3.5
Condensate 1,570 bpd $25.00 $2.5
Total $7.3
2016 NYMEX Crude Oil
($/Bbl) NYMEX Natural Gas
($/MMBtu) NGL composite
($/gallon) Conway/Belvieu Ethane Spread
($/gallon) $43.50 $2.35 $0.39 $0.02
* NGLs hedged reflect propane, normal butane, iso-butane and natural gasoline only. The ethane component of the equity NGL volume is not hedged and not expected to be material to ONEOK Partners’ results of operations.
Commodity Price Sensitivity Before Hedging
Commodity Sensitivity Fourth-quarter 2015 Annualized
Net Margin Impact ($ in millions)
Full-year 2016 Net Margin Impact
($ in millions) Natural gas $0.10 / MMBtu $4.8 $3.3
Natural gas liquids $0.01 / gallon $3.2 $1.5
Crude oil $1.00 / barrel $1.2 $1.1
APPENDIX – DISCIPLINED GROWTH CONTINUES IN MULTIPLE BASINS
Page 45
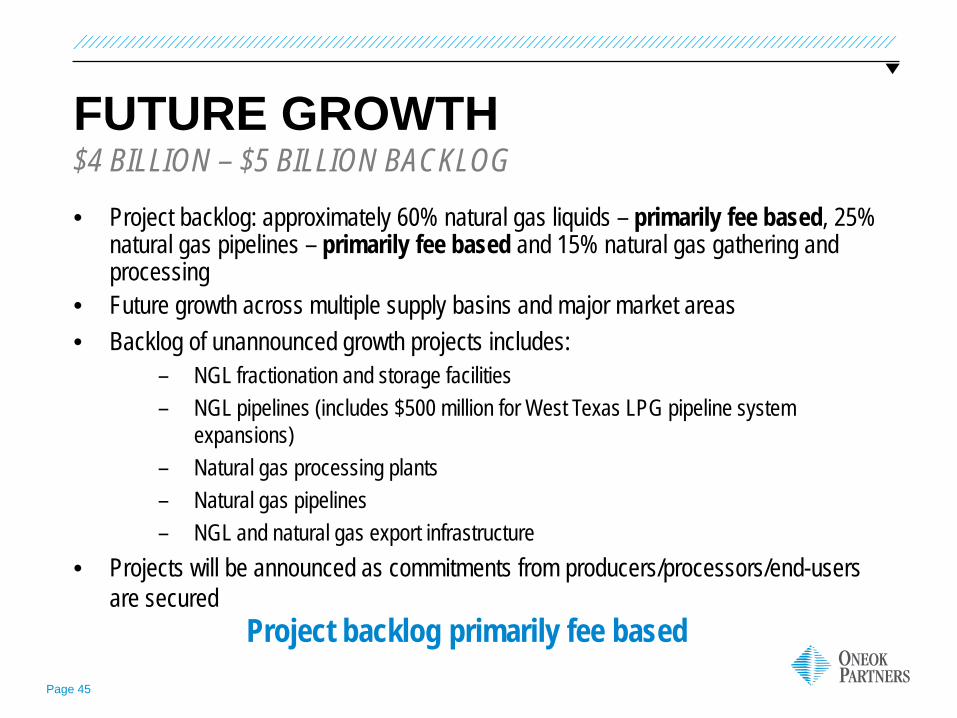
FUTURE GROWTH
• Project backlog: approximately 60% natural gas liquids – primarily fee based, 25% natural gas pipelines – primarily fee based and 15% natural gas gathering and processing
• Future growth across multiple supply basins and major market areas • Backlog of unannounced growth projects includes:
– NGL fractionation and storage facilities – NGL pipelines (includes $500 million for West Texas LPG pipeline system
expansions) – Natural gas processing plants – Natural gas pipelines – NGL and natural gas export infrastructure
• Projects will be announced as commitments from producers/processors/end-users are secured
$4 BILLION – $5 BILLION BACKLOG
Project backlog primarily fee based
APPENDIX – RECENT PROJECTS
Page 47
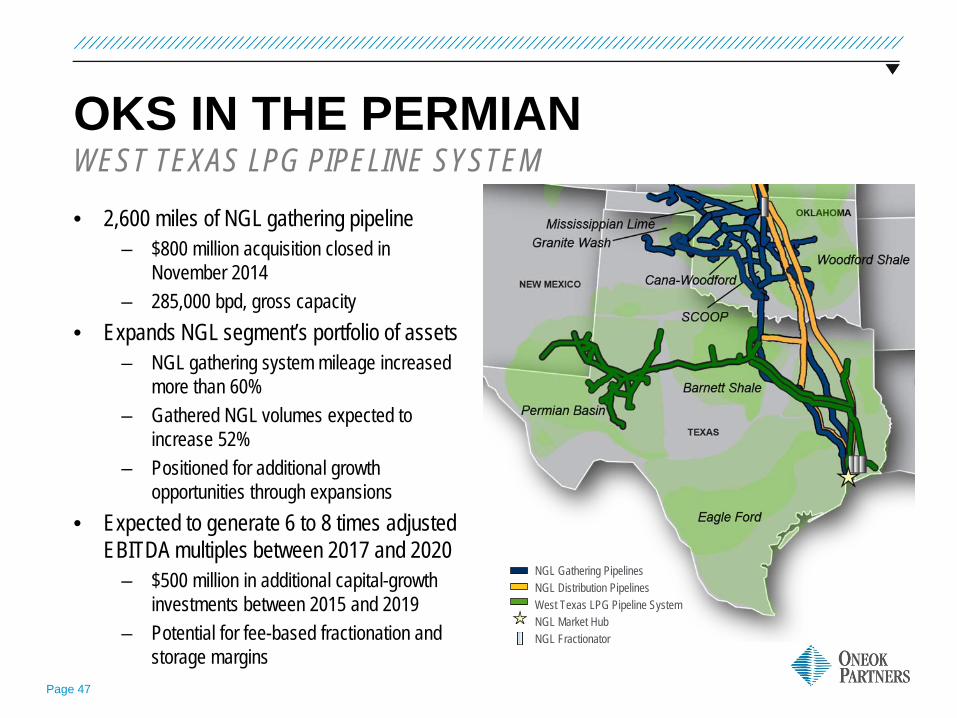
OKS IN THE PERMIAN
• 2,600 miles of NGL gathering pipeline – $800 million acquisition closed in
November 2014 – 285,000 bpd, gross capacity
• Expands NGL segment’s portfolio of assets – NGL gathering system mileage increased
more than 60% – Gathered NGL volumes expected to
increase 52% – Positioned for additional growth
opportunities through expansions • Expected to generate 6 to 8 times adjusted
EBITDA multiples between 2017 and 2020 – $500 million in additional capital-growth
investments between 2015 and 2019 – Potential for fee-based fractionation and
storage margins
WEST TEXAS LPG PIPELINE SYSTEM
NGL Gathering Pipelines NGL Distribution Pipelines West Texas LPG Pipeline System NGL Market Hub NGL Fractionator
Page 48
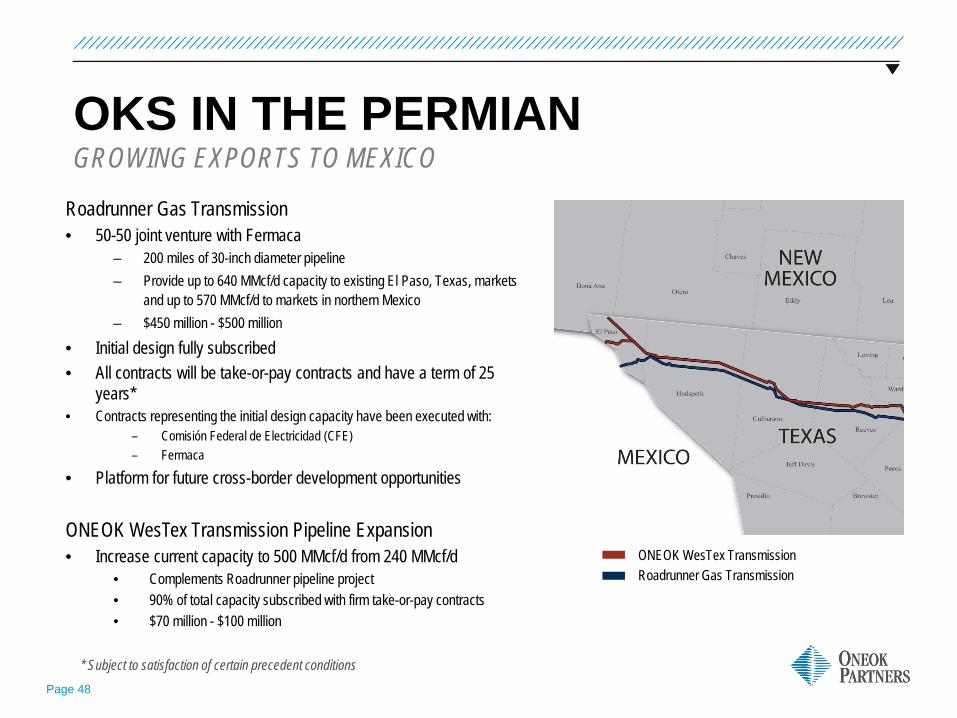
OKS IN THE PERMIAN GROWING EXPORTS TO MEXICO
Roadrunner Gas Transmission • 50-50 joint venture with Fermaca
– 200 miles of 30-inch diameter pipeline – Provide up to 640 MMcf/d capacity to existing El Paso, Texas, markets
and up to 570 MMcf/d to markets in northern Mexico – $450 million - $500 million
• Initial design fully subscribed • All contracts will be take-or-pay contracts and have a term of 25
years* • Contracts representing the initial design capacity have been executed with:
– Comisión Federal de Electricidad (CFE) – Fermaca
• Platform for future cross-border development opportunities ONEOK WesTex Transmission Pipeline Expansion • Increase current capacity to 500 MMcf/d from 240 MMcf/d
• Complements Roadrunner pipeline project • 90% of total capacity subscribed with firm take-or-pay contracts • $70 million - $100 million
* Subject to satisfaction of certain precedent conditions
ONEOK WesTex Transmission Roadrunner Gas Transmission
APPENDIX – ONEOK PARTNERS GROWTH PROJECTS
Page 50
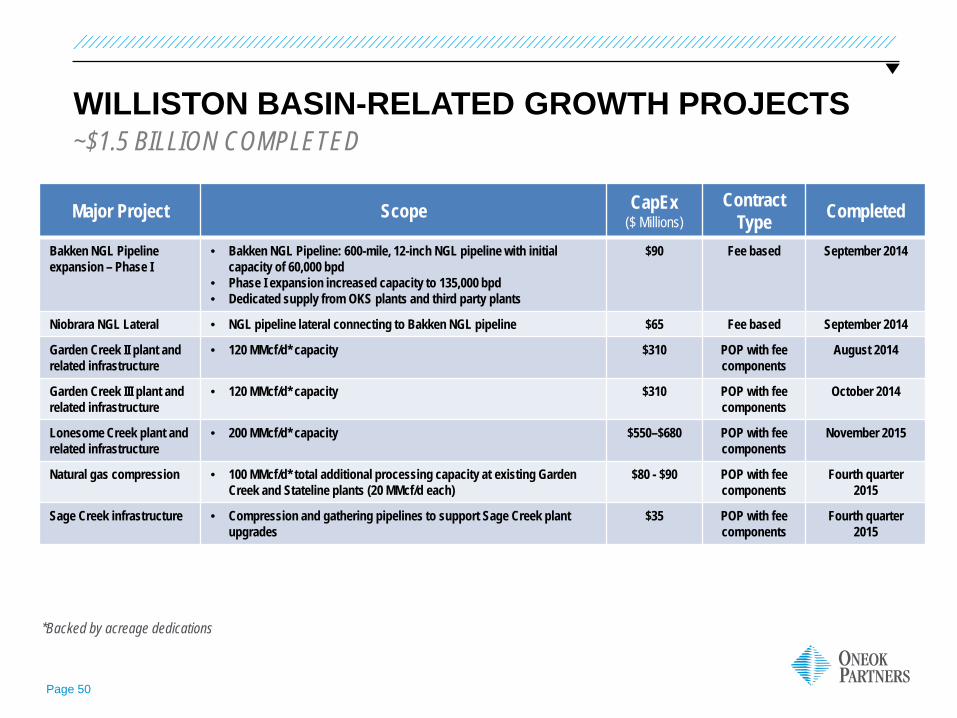
WILLISTON BASIN-RELATED GROWTH PROJECTS ~$1.5 BILLION COMPLETED
Major Project Scope CapEx ($ Millions)
Contract Type Completed
Bakken NGL Pipeline expansion – Phase I
• Bakken NGL Pipeline: 600-mile, 12-inch NGL pipeline with initial capacity of 60,000 bpd
• Phase I expansion increased capacity to 135,000 bpd • Dedicated supply from OKS plants and third party plants
$90 Fee based September 2014
Niobrara NGL Lateral • NGL pipeline lateral connecting to Bakken NGL pipeline $65 Fee based September 2014
Garden Creek II plant and related infrastructure
• 120 MMcf/d* capacity $310 POP with fee components
August 2014
Garden Creek III plant and related infrastructure
• 120 MMcf/d* capacity $310 POP with fee components
October 2014
Lonesome Creek plant and related infrastructure
• 200 MMcf/d* capacity $550–$680 POP with fee components
November 2015
Natural gas compression • 100 MMcf/d* total additional processing capacity at existing Garden Creek and Stateline plants (20 MMcf/d each)
$80 - $90 POP with fee components
Fourth quarter 2015
Sage Creek infrastructure • Compression and gathering pipelines to support Sage Creek plant upgrades
$35 POP with fee components
Fourth quarter 2015
*Backed by acreage dedications
Page 51
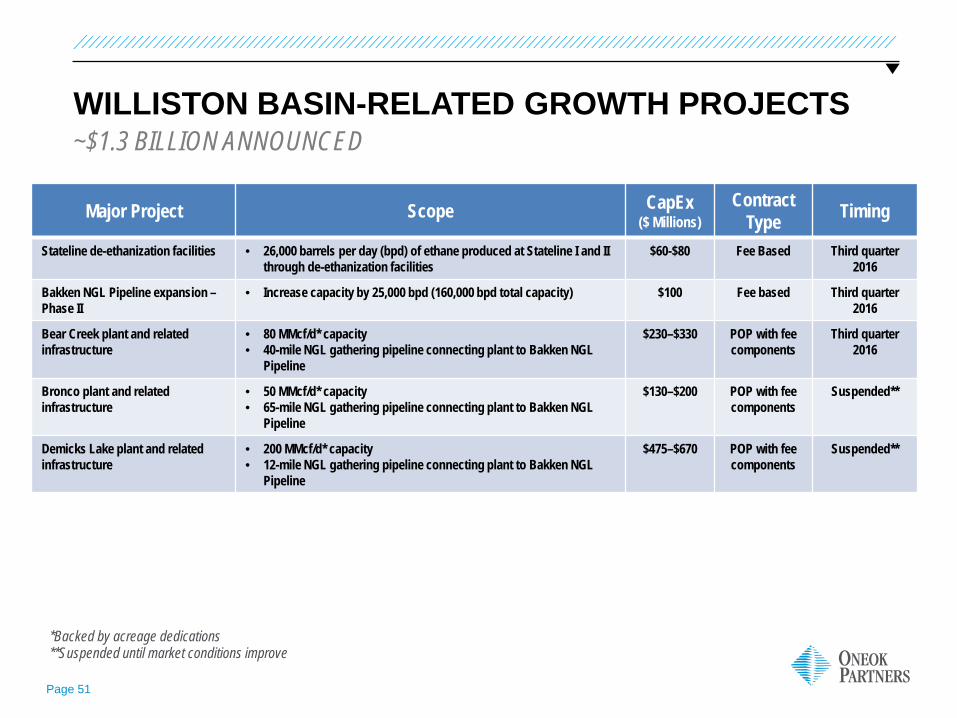
WILLISTON BASIN-RELATED GROWTH PROJECTS ~$1.3 BILLION ANNOUNCED
Major Project Scope CapEx ($ Millions)
Contract Type Timing
Stateline de-ethanization facilities • 26,000 barrels per day (bpd) of ethane produced at Stateline I and II through de-ethanization facilities
$60-$80 Fee Based Third quarter 2016
Bakken NGL Pipeline expansion – Phase II
• Increase capacity by 25,000 bpd (160,000 bpd total capacity) $100 Fee based Third quarter 2016
Bear Creek plant and related infrastructure
• 80 MMcf/d* capacity • 40-mile NGL gathering pipeline connecting plant to Bakken NGL
Pipeline
$230–$330 POP with fee components
Third quarter 2016
Bronco plant and related infrastructure
• 50 MMcf/d* capacity • 65-mile NGL gathering pipeline connecting plant to Bakken NGL
Pipeline
$130–$200 POP with fee components
Suspended**
Demicks Lake plant and related infrastructure
• 200 MMcf/d* capacity • 12-mile NGL gathering pipeline connecting plant to Bakken NGL
Pipeline
$475–$670 POP with fee components
Suspended**
*Backed by acreage dedications **Suspended until market conditions improve
Page 52
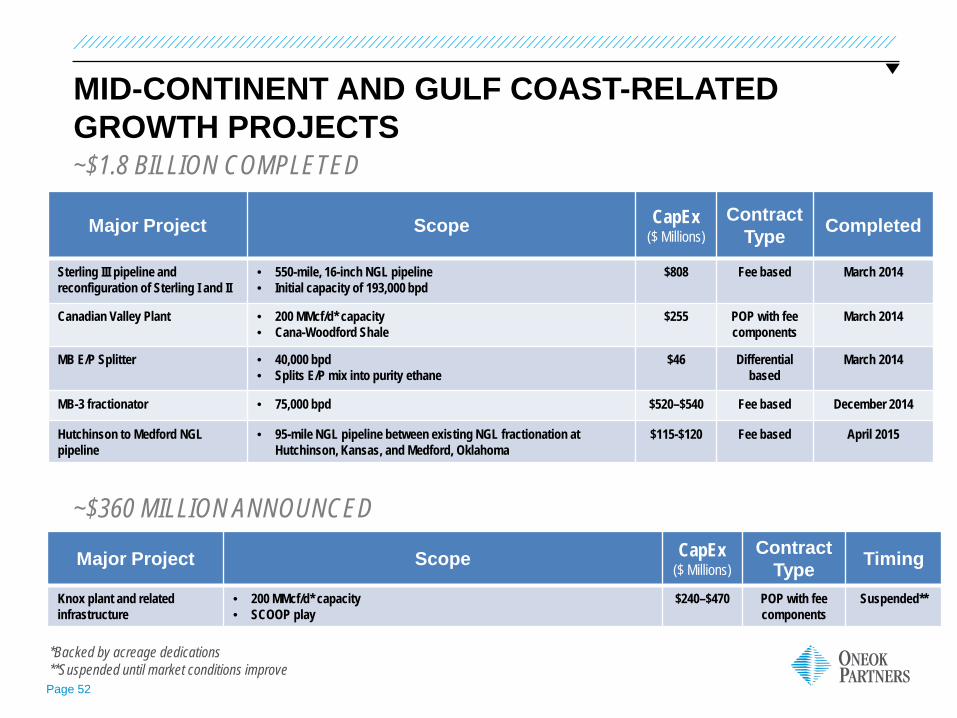
MID-CONTINENT AND GULF COAST-RELATED GROWTH PROJECTS ~$1.8 BILLION COMPLETED
Major Project Scope CapEx ($ Millions)
Contract Type Completed
Sterling III pipeline and reconfiguration of Sterling I and II
• 550-mile, 16-inch NGL pipeline • Initial capacity of 193,000 bpd
$808 Fee based March 2014
Canadian Valley Plant • 200 MMcf/d* capacity • Cana-Woodford Shale
$255 POP with fee components
March 2014
MB E/P Splitter • 40,000 bpd • Splits E/P mix into purity ethane
$46 Differential based
March 2014
MB-3 fractionator • 75,000 bpd $520–$540 Fee based December 2014
Hutchinson to Medford NGL pipeline
• 95-mile NGL pipeline between existing NGL fractionation at Hutchinson, Kansas, and Medford, Oklahoma
$115-$120 Fee based April 2015
*Backed by acreage dedications **Suspended until market conditions improve
~$360 MILLION ANNOUNCED
Major Project Scope CapEx ($ Millions)
Contract Type Timing
Knox plant and related infrastructure
• 200 MMcf/d* capacity • SCOOP play
$240–$470 POP with fee components
Suspended**
Page 53
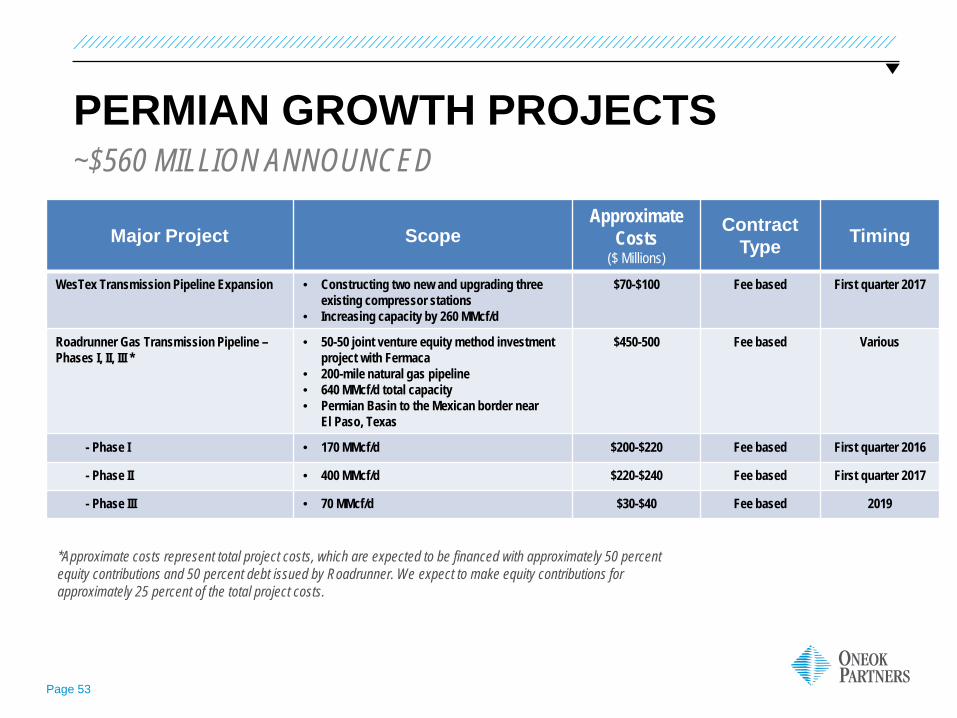
PERMIAN GROWTH PROJECTS ~$560 MILLION ANNOUNCED
Major Project Scope Approximate
Costs ($ Millions)
Contract Type Timing
WesTex Transmission Pipeline Expansion • Constructing two new and upgrading three existing compressor stations
• Increasing capacity by 260 MMcf/d
$70-$100 Fee based First quarter 2017
Roadrunner Gas Transmission Pipeline – Phases I, II, III *
• 50-50 joint venture equity method investment project with Fermaca
• 200-mile natural gas pipeline • 640 MMcf/d total capacity • Permian Basin to the Mexican border near
El Paso, Texas
$450-500 Fee based Various
- Phase I • 170 MMcf/d $200-$220 Fee based First quarter 2016
- Phase II • 400 MMcf/d $220-$240 Fee based First quarter 2017
- Phase III • 70 MMcf/d $30-$40 Fee based 2019
*Approximate costs represent total project costs, which are expected to be financed with approximately 50 percent equity contributions and 50 percent debt issued by Roadrunner. We expect to make equity contributions for approximately 25 percent of the total project costs.
Page 54
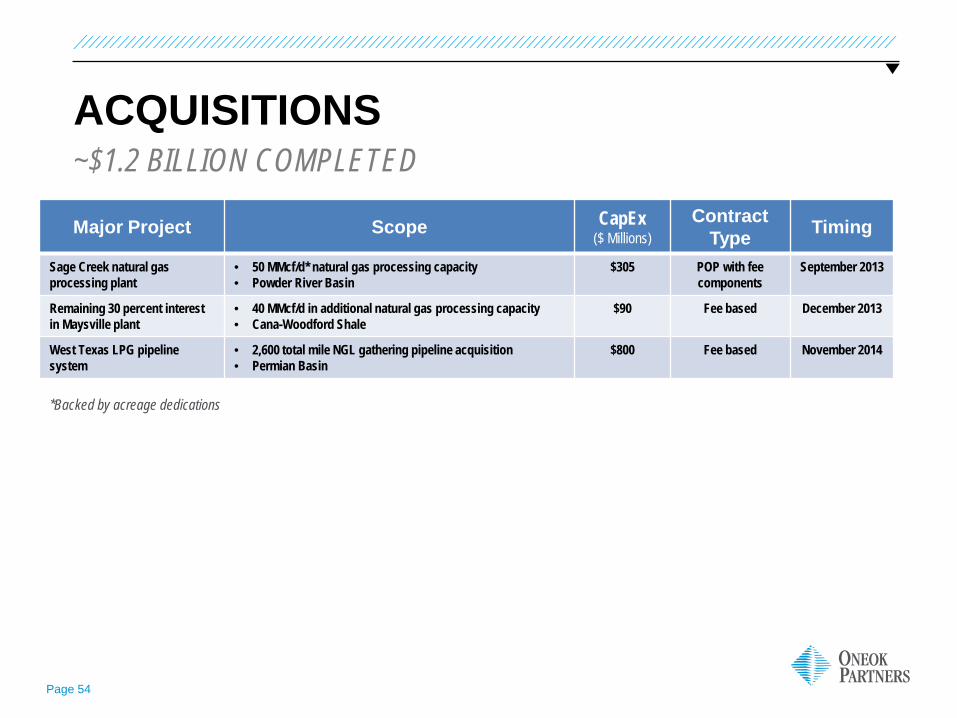
ACQUISITIONS ~$1.2 BILLION COMPLETED
Major Project Scope CapEx ($ Millions)
Contract Type Timing
Sage Creek natural gas processing plant
• 50 MMcf/d* natural gas processing capacity • Powder River Basin
$305 POP with fee components
September 2013
Remaining 30 percent interest in Maysville plant
• 40 MMcf/d in additional natural gas processing capacity • Cana-Woodford Shale
$90 Fee based December 2013
West Texas LPG pipeline system
• 2,600 total mile NGL gathering pipeline acquisition • Permian Basin
$800 Fee based November 2014
*Backed by acreage dedications
NON-GAAP RECONCILIATIONS – ONEOK
Page 56
NON-GAAP RECONCILIATIONS ONEOK has disclosed in this presentation anticipated cash flow available for dividends, free cash flow and dividend coverage ratio, all amounts that are non-GAAP financial measures. Management believes these measures provide useful information to investors as a measure of financial performance for comparison with peer companies; however, these calculations may vary from company to company, so the company’s computations may not be comparable with those of other companies. Cash flow available for dividends is defined as net income less the portion attributable to noncontrolling interests, adjusted for equity in earnings and distributions declared from ONEOK Partners, and ONEOK’s stand-alone depreciation and amortization, deferred income taxes and certain other items, less ONEOK’s stand-alone capital expenditures. Free cash flow is defined as cash flow available for dividends, computed as described, less ONEOK’s dividends declared. Dividend coverage ratio is defined as cash flow available for dividends divided by the dividends declared for the period. These non-GAAP measures should not be considered in isolation or as a substitute for net income, income from operations or other measures of financial performance determined in accordance with GAAP. These non-GAAP financial measures exclude some, but not all, items that affect net income. Additionally, these calculations may not be comparable with similarly titled measures of other companies. Reconciliations of cash flow available for dividends and free cash flow to net income are included in the tables.
ONEOK, INC.
Page 57
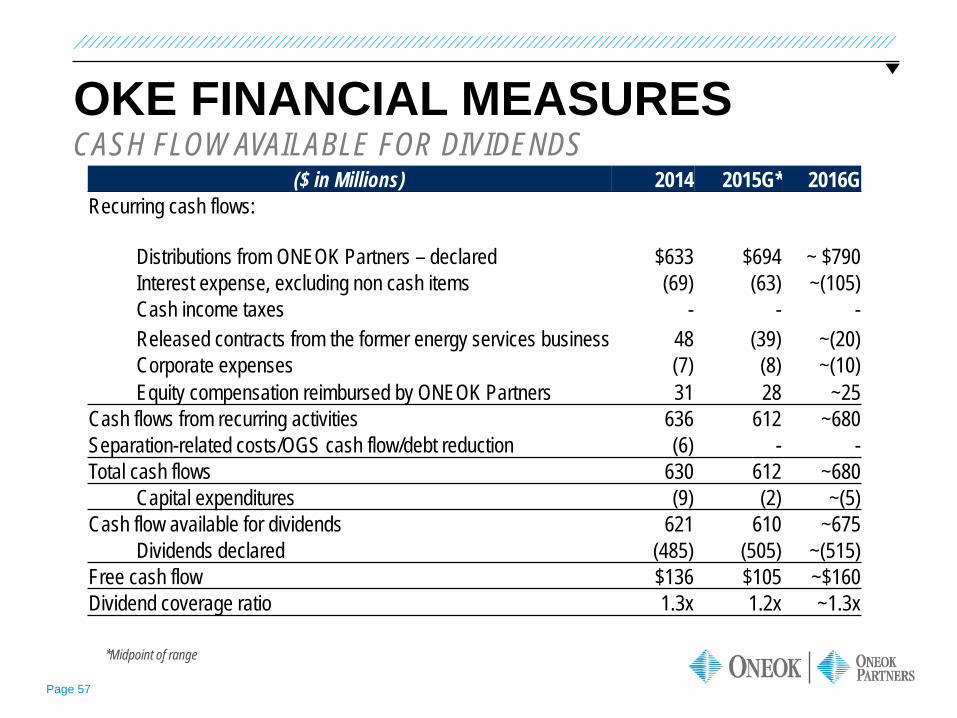
OKE FINANCIAL MEASURES CASH FLOW AVAILABLE FOR DIVIDENDS
($ in Millions) 2014 2015G* 2016G Recurring cash flows:
Distributions from ONEOK Partners – declared $633 $694 ~ $790 Interest expense, excluding non cash items (69) (63) ~(105) Cash income taxes - - - Released contracts from the former energy services business 48 (39) ~(20) Corporate expenses (7) (8) ~(10) Equity compensation reimbursed by ONEOK Partners 31 28 ~25
Cash flows from recurring activities 636 612 ~680 Separation-related costs/OGS cash flow/debt reduction (6) - - Total cash flows 630 612 ~680
Capital expenditures (9) (2) ~(5) Cash flow available for dividends 621 610 ~675
Dividends declared (485) (505) ~(515) Free cash flow $136 $105 ~$160 Dividend coverage ratio 1.3x 1.2x ~1.3x
*Midpoint of range
Page 58
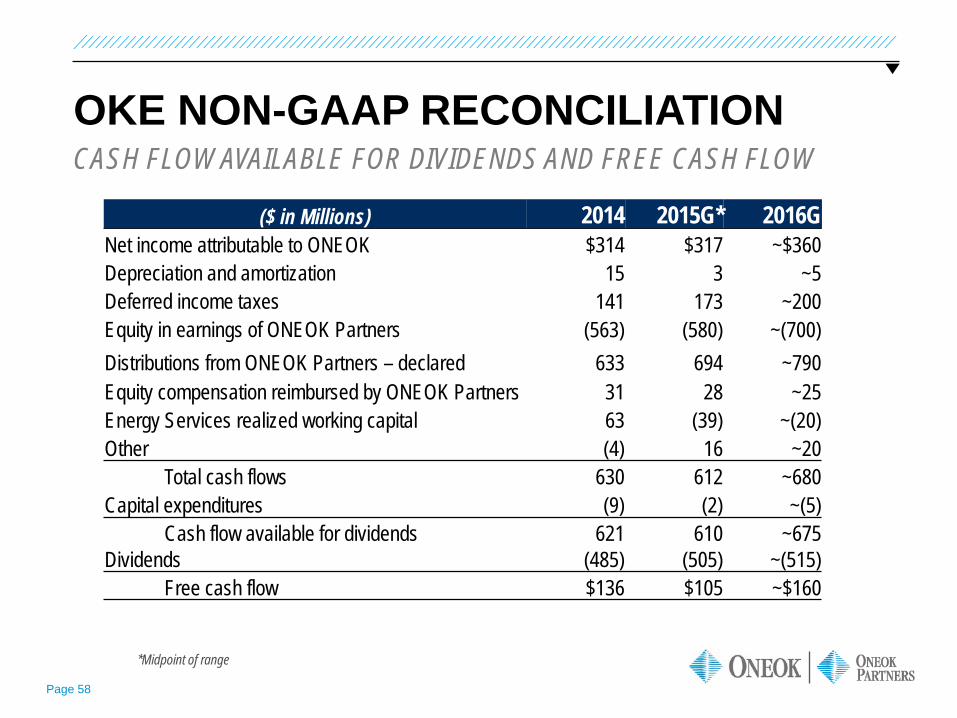
OKE NON-GAAP RECONCILIATION CASH FLOW AVAILABLE FOR DIVIDENDS AND FREE CASH FLOW
($ in Millions) 2014 2015G* 2016G Net income attributable to ONEOK $314 $317 ~$360 Depreciation and amortization 15 3 ~5 Deferred income taxes 141 173 ~200 Equity in earnings of ONEOK Partners (563) (580) ~(700) Distributions from ONEOK Partners – declared 633 694 ~790 Equity compensation reimbursed by ONEOK Partners 31 28 ~25 Energy Services realized working capital 63 (39) ~(20) Other (4) 16 ~20
Total cash flows 630 612 ~680 Capital expenditures (9) (2) ~(5)
Cash flow available for dividends 621 610 ~675 Dividends (485) (505) ~(515)
Free cash flow $136 $105 ~$160
*Midpoint of range
NON-GAAP RECONCILIATIONS – ONEOK PARTNERS
Page 60
NON-GAAP RECONCILIATIONS ONEOK Partners has disclosed in this presentation its historical and anticipated adjusted EBITDA, distributable cash flow (DCF) and cash distribution coverage ratio, which are non-GAAP financial metrics, used to measure the partnership’s financial performance and are defined as follows: Adjusted EBITDA is defined as net income adjusted for interest expense, depreciation and amortization, impairment charges, income taxes and allowance for equity funds used during construction and certain other items; DCF is defined as adjusted EBITDA, computed as described above, less interest expense, maintenance capital expenditures and equity earnings from investments, adjusted for cash distributions received and certain other items; and Cash distribution coverage ratio is defined as distributable cash flow to limited partners per limited partner unit divided by the distribution declared per limited partner unit for the period. The partnership believes the non-GAAP financial measures described above are useful to investors because they are used by many companies in its industry to measure financial performance and are commonly employed by financial analysts and others to evaluate the financial performance of the partnership and to compare the financial performance of the partnership with the performance of other publicly traded partnerships within its industry. Adjusted EBITDA, DCF and cash distribution coverage ratio should not be considered alternatives to net income, earnings per unit or any other measure of financial performance presented in accordance with GAAP.
These non-GAAP financial measures exclude some, but not all, items that affect net income. Additionally, these calculations may not be comparable with similarly titled measures of other companies. Furthermore, these non-GAAP measures should not be viewed as indicative of the actual amount of cash that is available for distributions or that is planned to be distributed for a given period nor do they equate to available cash as defined in the partnership agreement.
Reconciliations of adjusted EBITDA and DCF are included in the tables.
This presentation references forward-looking estimates of annual adjusted EBITDA and adjusted EBITDA investment multiples projected to be generated by capital-growth projects. A reconciliation of estimated adjusted EBITDA to GAAP net income is not provided because the GAAP net income generated by the individual capital-growth projects is not available without unreasonable efforts.
ONEOK PARTNERS
Page 61
OKS NON-GAAP RECONCILIATIONS ADJUSTED EBITDA AND DISTRIBUTABLE CASH FLOW
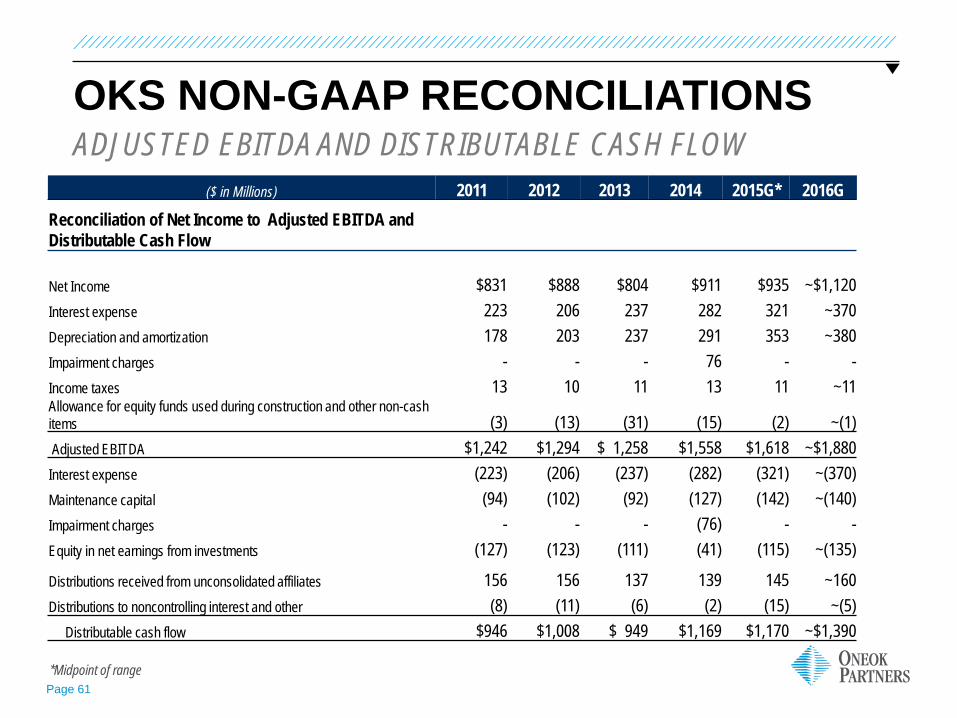
($ in Millions) 2011 2012 2013 2014 2015G* 2016G Reconciliation of Net Income to Adjusted EBITDA and Distributable Cash Flow
Net Income $831 $888 $804 $911 $935 ~$1,120 Interest expense 223 206 237 282 321 ~370 Depreciation and amortization 178 203 237 291 353 ~380 Impairment charges - - - 76 - - Income taxes 13 10 11 13 11 ~11 Allowance for equity funds used during construction and other non-cash items (3) (13) (31) (15) (2) ~(1) Adjusted EBITDA $1,242 $1,294 $ 1,258 $1,558 $1,618 ~$1,880 Interest expense (223) (206) (237) (282) (321) ~(370) Maintenance capital (94) (102) (92) (127) (142) ~(140) Impairment charges - - - (76) - - Equity in net earnings from investments (127) (123) (111) (41) (115) ~(135)
Distributions received from unconsolidated affiliates 156 156 137 139 145 ~160 Distributions to noncontrolling interest and other (8) (11) (6) (2) (15) ~(5) Distributable cash flow $946 $1,008 $ 949 $1,169 $1,170 ~$1,390
*Midpoint of range