U. S. Department of Energy’s Smart Grid Program Steve Bossart IEEE Pittsburgh Section June 20,...
57
U. S. Department of Energy’s Smart Grid Program Steve Bossart IEEE Pittsburgh Section June 20, 2012
-
Upload
angelica-price -
Category
Documents
-
view
218 -
download
0
Transcript of U. S. Department of Energy’s Smart Grid Program Steve Bossart IEEE Pittsburgh Section June 20,...

U. S. Department of Energy’s Smart Grid Program
Steve Bossart
IEEE Pittsburgh Section
June 20, 2012

2
Smart Grid Topics
• Definitions & Concepts• Smart Grids & Microgrids• Drivers & Value Proposition• Deployment Challenges• Smart Grid Field Projects
Metrics & Benefits Approach• Smart Grid Progress

3
Definitions & Concepts

4
What’s Different with Smart Grid
• Consumer engagement with resources to solve power issues locally
• Two-way power flow in Distribution• Two-way communications • Integration of Distributed generation and storage • Imperative to transform from passive to active
control in Distribution• Move from radial to network Distribution system• New ways for Distribution to become a
Transmission resource• Potential to transform transportation sector

5
5
Smart Grid Principal Characteristics
The Smart Grid will:
• Enable active participation by consumers• Accommodate all generation and storage options• Enable new products, services and markets• Provide power quality for the digital economy• Optimize asset utilization and operate efficiently• Anticipate & respond to system disturbances
(self-heal)• Operate resiliently against attack and natural disaster

6
Smart Grid Technologies
Integrated Communications
Advanced Control Methods
Decision Support & Improved Interfaces
Advanced Components
Sensors and Measurement
Integrated Communications

7
Smart Grid Key Success Factors
The Smart Grid is MORE:
• Reliable
• Secure
• Resilient
• Economic
• Efficient
• Environmentally friendly
• Safe

8
Context of Smart Grid
Smart Grid Enhanced by Smart Grid
Two-way communicationsSensorsControlsDecision support toolsComponents
TransformersPower electronicsConductors
Sensing, control, automation, power transformation, and
communications
Renewable energy resourcesElectric vehiclesEnergy storageDistributed generationGrid friendly appliances/devicesLoad control/demand response
Generation, storage, and load

9
Smart Grid & Microgrids

10
Definition by Microgrid Exchange Group
A microgrid is a group of interconnected loads and distributed energy resources within clearly defined electrical boundaries that acts as a single controllable entity with respect to the grid. A microgrid can connect and disconnect from the grid to enable it to operate in both grid-connected or island-mode.
Microgrid and OE’s Performance Target
Develop commercial scale (<10MW) microgrid systems capable of reducing outage time of required loads by >98% at a cost comparable to non-integrated baseline solutions (UPS + diesel genset), while reducing emissions by >20% and improving system energy efficiencies by >20%
OE’s 2020 Performance Target

11
Central Generation
Transmission Load
Distributed Generation E-Storage
Distribution
E-StorageDistributed Generation
Load
Microgrid
Microgrids Smart Grids

12
Case for Grid Modernization &
Value Proposition

13
13
Why Modernize the Grid?• Today’s grid is aging and outmoded• Unreliability is costing consumers billions of dollars• Today’s grid is vulnerable to attack and natural disaster• An extended loss of today’s grid could be catastrophic to our
security, economy and quality of life• Today’s grid does not address the 21st century power supply
challenges• Adverse trends associated with the grid
- Costs, reliability, peak loads, asset underutilization, TLRs, grid divorce• The benefits of a modernized grid are substantial
14
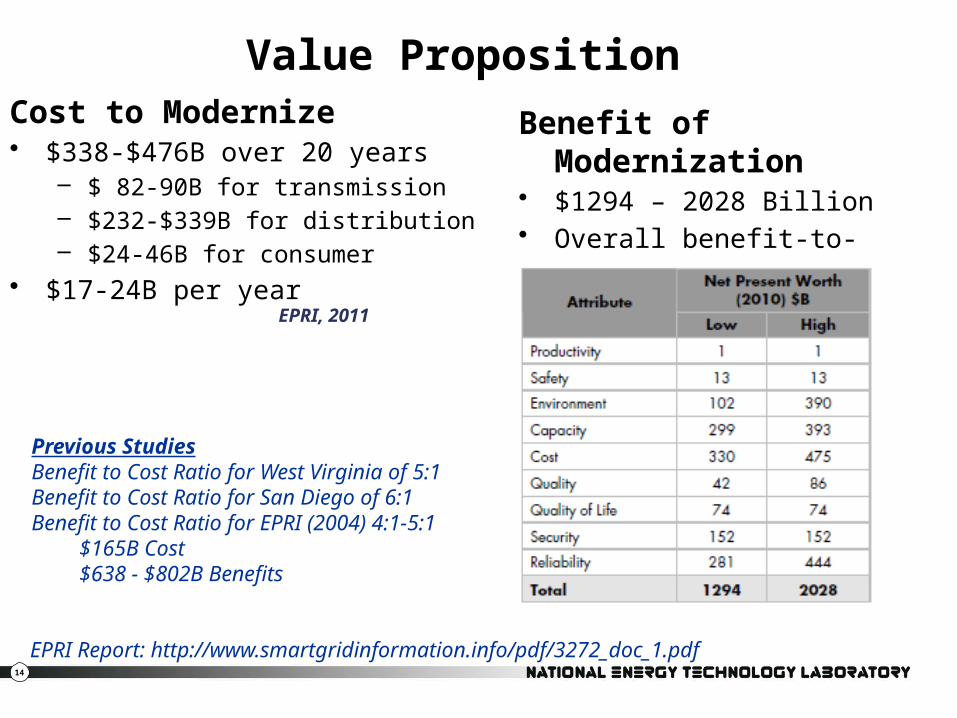
Value Proposition Cost to Modernize• $338-$476B over 20 years
– $ 82-90B for transmission – $232-$339B for distribution– $24-46B for consumer
• $17-24B per year
Benefit of Modernization• $1294 – 2028 Billion• Overall benefit-to-cost ratio
of 2.8 to 6.0
14
EPRI, 2011
Previous StudiesBenefit to Cost Ratio for West Virginia of 5:1Benefit to Cost Ratio for San Diego of 6:1Benefit to Cost Ratio for EPRI (2004) 4:1-5:1
$165B Cost$638 - $802B Benefits
EPRI Report: http://www.smartgridinformation.info/pdf/3272_doc_1.pdf

15
Who are the Beneficiaries?
• Utilities (What’s in it for my shareholders?)• Consumers (What’s in it for me?)• Society (What’s in it for us?)
We get what we reward!

16
Utility Value Proposition
Opportunities• Rate of return• Operational Benefits
– Outage restoration, billing, reduce T&D losses, optimize asset utilization, maintenance, planning
• Improved Customer Satisfaction
Cost• Risk of cost recovery
Utilities are the engine for investment in Smart Grid

17
Consumer Value Proposition
Opportunities• More reliable service• Reduce business loss• Energy bill savings• Transportation cost savings• Information, control, options• Sell resources into the market
Cost• “Consumer always pays”
Is this compelling?

18
Societal Value Proposition
Opportunities• Downward pressure on electricity prices• Improved reliability reducing consumer losses• Increased grid robustness improving grid security• Reduced emissions• New jobs and growth in GDP • Revolutionize the transportation sector• Reduce import of foreign oil
Cost• No incremental cost?
Does the societal value proposition make it compelling?

19
Smart Grid Implementation Challenges and Risks

20
Change Management
A significant change management effort is needed:• Why do we need to change?
• What is the vision?
• Who’s in charge?
• What is the value proposition?
• Consumer education, alignment, and motivation is critical• Metrics needed for accountability and to monitor progress• Active leadership by stakeholder groups needed
Move at the “Speed of Value”

21
Technical Challenges
• Interoperability and scalability• Large number of consumers actively involved• Decentralized operations with 2-way power flow• Getting the communications right• “Future proofing” the technologies• Cyber Security• Conversion of data to information to action• Market driven
Where will we find the skilled resources to solve these?

22
Regulatory Challenges• Time-based rates• Clear cost recovery policies• Policy changes that remove disincentives to utilities• Societal benefits included in business case• Increased utility commission workload• Consistency among state utility commissions• Potential cost of “carbon management”• Future proofing vs. stranded assets• Consumer privacy concerns• Least cost• Used and useful• New operating and market models

23
Smart Grid Field Projects

24
Programs created by statute Energy Infrastructure Security Act 2007:
– Smart Grid Investment Grants (Sec. 1306)– Smart Grid Regional Demonstrations
(Sec.1304)
Recovery Act Directed Programs: – Workforce Training - $100M
– Interconnection-wide Transmission Planning and Resource Analysis - $80M
– Interoperability Standards - $12M
Additional OE initiatives- State & Local Energy Assurance
- State Regulatory Assistance
Recovery Act – Grid Modernization
Top 10 States by Total Awarded
State Amt ($M)
NC 434
CA 419
TX 293
NY 276
FL 270
PA 265
MD 233
DC 213
AL 166
OH 146
One-time Appropriation, $4.5B in ARRA funds
$620M for demonstration projects
$3.425B for deployment projects
Investment Grants
Smart Grid Demos
Workforce Training
Resource Assessment &Transmission Planning
Smart Grid Interoperability Standards
Other

25
American Recovery and Reinvestment Act ($4.3B)
• Smart Grid Investment Grants (99 projects)– $3.4 billion Federal; $4.7 billion private sector– >800 PMUs covering almost 100% of transmission– 6500 distribution automation circuits– >15 million smart meters
• Smart Grid Demonstration Projects (32 projects)– $620 million Federal; $1 billion private sector– 16 storage projects– 16 regional demonstrations
Smart Grid ARRA Activities

26
Additional ARRA Smart Grid Activities
– Interoperability Framework by NIST ($10M)
– Transmission Analysis and Planning ($80M)
– State Electricity Regulator Assistance ($50M)
– State Planning for Smart Grid Resiliency ($55M)
– Workforce Development ($100M)
Smart Grid ARRA Activities (continued)

27
Technology Deployment
Customer Systems
Customer Systems
Customer Systems
Customer Systems
SGIG/SGDP Areas of Smart Grid Technology Deployment
Customer Systems
Advance Metering
Infrastructure
Electric Distribution
Systems
Electric Transmission
Systems
• Displays
• Portals
• Energy management
• Direct load controls
• Smart meters
• Data management
• Back office integration
• Switches
• Feeder optimization
• Equipment monitoring
• Energy Storage
• Wide area monitoring and visualization
• Synchrophasor Technology
• Energy Storage
Customer Systems
EquipmentManufacturing
• Energy devices
• Software
• Appliances

28
Schedule for Benefits Analysis
The DOE Metrics and Benefits work is transitioning into the reporting and analysis of impact metrics. See smartgrid.gov
Metrics and Benefits Plan
Build Metric Reporting and Analysis
We are here
Impact Metric Reporting and Analysis

29
Key Program Objectives
Key Stakeholders:
NARUC and PUCs
EEI/EPRI
NRECA/CRN
APPA
NASPI
Consumer Advocates
Utilities
Three Objectives:
Information Derived from
131 ARRA Smart Grid
Projects
Advancing the Business Case
Sharing Lessons-
Learned and Best Practices
Determining R&D Needs
• System Engineering
• Advanced Analytics

30
Consumer Behavior Studies

31
SGIG Consumer Behavior Studies:Study Population Statistics
• Total of ~145,000 customers are expected to “participate” as treatment or control customers• Plan to collect key demographic information on all treatment and
control customers (ideally), subject to survey response rates• Assuming 3 years worth of hourly interval usage meter data (1
year pre-treatment and 2 years post-treatment); this represents 3.9 billion data observations
• To put our SGIG analysis and evaluation effort into perspective:• ComEd’s CAP study included ~8,500 participants and ran for 12
months (June 2010 - May 2011)• CA Statewide Pricing Pilot included ~2,500 participants and ran
for 18 months (July 2002 – December 2003)
32
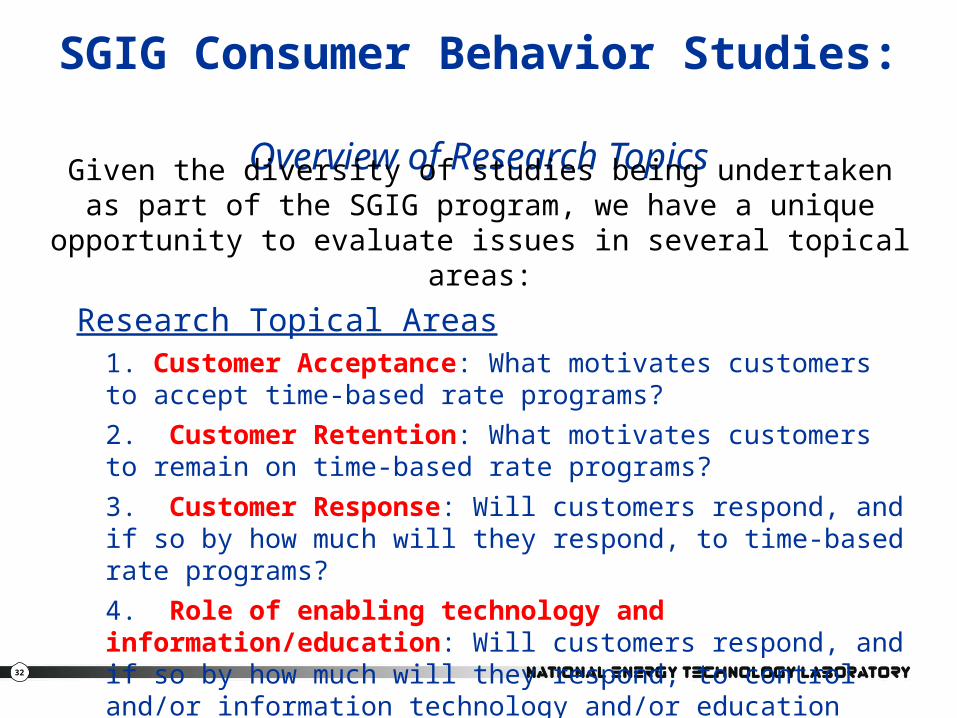
SGIG Consumer Behavior Studies: Overview of Research Topics
Given the diversity of studies being undertaken as part of the SGIG program, we have a unique opportunity to evaluate issues in
several topical areas:
Research Topical Areas1. Customer Acceptance: What motivates customers to accept time-based rate programs?
2. Customer Retention: What motivates customers to remain on time-based rate programs?
3. Customer Response: Will customers respond, and if so by how much will they respond, to time-based rate programs?
4. Role of enabling technology and information/education: Will customers respond, and if so by how much will they respond, to control and/or information technology and/or education alone?
33
Metrics and BenefitsApproach

34
DOE Analytical ApproachE
xam
ple
Improvesfeeder voltage regulation
Reduced feeder losses worth$60 per MWh
Automatic Voltage and VAR Control
• Capacitor controls
• Distribution Management System
Functions Mechanisms Benefits
What does the Smart Grid
do?
How does itdo that?
What “goodness”
results?
Monetary Value
What is the goodness
worth?
What are Smart Grid
technologies?
Assets
$6000

35
Smart Grid FunctionsSensing Control Protection
Wide Area Monitoring, Visualization, and Simulation
Power Flow Control Fault Current Limiting
Diagnosis & Notification of Equipment Condition
Automated Feeder Switching
Dynamic Capability Rating
Real-Time Load Measurement and Management
Automated Islanding and Reconnection
Adaptive Protection
Automated Voltage and VAR Control
Enhance Fault Protection
Real-Time Load Transfer
Customer Electric Use Optimization

36
Energy Storage Applications
Renewable Support Investment Deferral Ancillary Services Load Management
Renewables Energy Time Shift
Electric Supply Capacity Deferral
Area Regulation Electric Energy Time Shift
Renewables Capacity Firming
T&D Upgrade Deferral
Load Following Transmission Congestion Relief
Wind Generation Grid Integration, Short Duration
Substation Onsite Power
Electric Supply Reserve Capacity
Time-of-Use Energy Cost Management
Wind Generation Grid Integration, Long Duration
Electric Service Reliability
Voltage Support Demand Charge Management
Electric Service Power Quality
Transmission Support

37
Five Primary Analytical Focus Areas
Peak Demand and Electricity Consumption
• Advanced metering infrastructure
• Pricing programs & consumer devices
• Direct load control
Operations & Maintenance Savings
from Advanced Metering
• Meter reading• Service changes• Outage management
Distribution System Reliability
• Automated & remote operations
• Feeder switching Monitoring & health sensors
Energy Efficiency in Distribution Systems
• Voltage optimization• Conservation voltage
reduction• Line losses • Operational efficiency
Transmission System Operations & Reliability
• Application of synchrophasor technology for wide area monitoring, visualization, and control

38
Qualitative Feedback

39
Lessons Learned
Surveys
RecommendationsCorrective Actions
Root Cause
Preferences
Best PracticesCompliments
Anecdotes
Observations
Complaints

40
Variety of Stakeholders
Electric Service Provider• Decision makers• Operations &
maintenance• Planning • Engineering & design• Customer service• Traders• Purchasing• Regulatory support• Billing

41
Smart Grid Progress

42
SGIG Deployment Status
AMI and Customer System Assets
Distribution Assets Transmission Assets $-
$500
$1,000
$1,500
$2,000
$2,500
$3,000
$3,500
$4,000
$4,500
$5,000
$2,767
$888
$163
~$4,500
~$2,500
~$1,000
Total Investments in 99 SGIG Projectsas of March 19, 2012
Reported to date Estimated at completion
To
tal I
nv
es
tme
nts
(M
illio
ns
$)
9.3 of 15.5 million residential and commercial smart meters
Distribution automation equipment on 4,200 out of 6,500
circuits
195 out of over 800 networked phasor measurement units

43
Smart Meters Deployed in SGIG Projects

44
Status of Smart Grid Investments in SGIG Program

45
Automated Distribution Circuits in SGIG
There are approximately 81,200 distribution circuits in US6,500 circuits is about 8% of total distribution circuits

46
Phasor Measurement Units in SGIG Projects

47
Customer Devices in SGIG Projects

48
Customers with Smart Meters Enrolled in Pricing Programs in SGIG

49
Case Studies

50
eEnergy VermontA State-Wide Strategy for Smart Grid Development
Key Activities• Smart metering roll-out for outage management and time-based rates for
demand response. • Distribution system automation including switches, reclosers, SCADA, and
communications backbone systems.• Consumer behavior studies by Vermont Electric Cooperative (VEC)and
Central Vermont Public Service to assess customer acceptance, response, and retention.
Aims and Strategies• A collaborative effort involving all of the state’s electric distribution companies
to modernize Vermont’s electric grid and foster economic growth as part of the state’s “eState Initiative” with telecommunications and health care.
Results and Benefits • VEC’s outage management system has improved SAIFI by 50% and CAIDI
by 40% since installed in 2008.• VEC’s smart metering roll-out and outage management system has a 5 year
payback period from operational saving alone.• VEC received POWER Magazine’s first “Smart Grid Award” in August 2011 for
its pioneering efforts in outage management.• Restoration of the grid from Tropical storm Irene occurred quicker and with
greater customer awareness of repair schedules due to smart meters, web portals, and more effective outage management.
Utilities working together to
modernize the grid.
Facts & FiguresTotal Project Budget: $137,857,302
Federal Share: $69,928,650
Distribution Automation:
47 circuits and substations
Smart meters:311,380
Time-Based Rates:
1,500 customers targeted
Vermont Electric Cooperative’s Smart Grid Operations Center

51
Oklahoma Gas & ElectricReducing peak demand in Oklahoma
Key Activities• OG&E’s “Positive Energy Smart Grid Project” is installing 750,000
smart meters system-wide and distribution automation equipment on 40% of the circuits serving homes, offices, farms, and factories.
Aims and Strategies• Defer construction of two 165 MW power plants by lowering peak
demand using demand response programs that involve time-based rates and customer enabling technologies.
• Improve service and lower costs by operating automated capacitors and distribution switches.
Results and Benefits • Pilot demand response project of 3,000 customers during the
summer of 2010o 98% of participating customers saved money on their billso Measureable demand reductions from customers participating
in critical peak and variable peak pricing and who use the web portal, programmable communicating thermostats, and in-home displays
• Expect to lower operations and maintenance costs and improve service reliability and power quality.
Customer-Enabling
Technologies Used by OG&E
Facts & FiguresTotal Project Budget: $293,201,332
Federal Share: $130,000,000
Customers Served:766,866
Service Area: 30,000 square miles in Oklahoma and Western Arkansas
Generation Capacity: 6,600 MW
In-Home Display

52
City of NapervilleEmpowering Consumers in Illinois
Key Activities• Naperville’s “Smart Grid Initiative” completes a decade long efforts
to automate the city’s entire electric distribution grid.• Deploys smart meters city wide to all customers.• Provides consumer education programs to engage public
participation in shaping smart grid policies and programs.
Aims and Strategies• Strengthen reliability and reduce the frequency and duration of
power outages.• Empower consumers to manage their own power consumption
and costs to enhance energy efficiency, reduce peak, and reduce power purchase costs from wholesale suppliers.
Results and Benefits • Distribution automation investments have improved System
Average Interruption Duration Index each years since 1991 by from 15% to 55%.
• O&M costs from dispatching repair crews reduced by about 40%.• Enacted Naperville Smart Grid Consumer Bill of Rights.• Implemented Smart Grid Ambassadors Program
Consumer programs for
smart grid-savvy customers
Facts & FiguresTotal Project Budget: $21,988,220
Federal Share: $10,994,110
Distribution Automation:
Remaining 6 of 117 circuits
Smart meters:57,000
Time-based Rates:
1,500 customers targeted
Residents provide feedback on Naperville’s smart grid policies
and programs.

53
M2M Communications Agricultural Demand Response Program Saves Electricity in California
Key Activities• M2M Communications of Boise, Idaho, has developed a two-way,
web-to-wireless controller for irrigation pumps. The controller is part of an irrigation load control system that includes sensors, smart meters, and other monitoring equipment.
• M2M created the Peak Energy Agricultural Rewards (PEAR) program, a demand response program marketed to agricultural customers of California’s investor owned utilities.
Aims and Strategies• As part of the PEAR program, farmers can earn cash incentives
and avoid peak demand charges.• Water consumption and soil moisture can be monitored from a web
portal, enabling farmers to make informed decisions about possible participation in peak demand events.
• Farmers can schedule irrigation pump start up/shut off, saving water, time, and manpower, and improving overall efficiency.
Results and Benefits • DOE ARRA funds greatly contributed to M2M’s final R&D push to
get the controller to market.
• PG&E called four peak pricing events in 2011; PEAR program participation reduced summer peak demand by an average of 18 MW per event.
Reducing Peak Electric Demand and
Increasing Efficiency of Farm Operations
Facts & FiguresTotal project budget:
$4,342,340
Federal share: $2,171,170
Devices installed: 300
Total summer peak demand reduction in 2011: 72 MW
An irrigation pump connected to and controlled by M2M’s web-to-wireless controller

54
Operational Efficiency Improvements at Talquin Electric Cooperative
Background:• For over 70 years, members submitted their own meter
readings (highly inaccurate)• Rolling trucks 6,000 times/year for routine service
connection/reconnection and 9,000 times/year for non-payment problems ($40-$50/truck roll)
• Outage locations based on pattern of customer phone calls
TEC’s SmartGrid Program:• Deployed AMI to about 56,000 customers and upgraded 46
of 86 circuits with advanced capacitors for voltage control and outage management.
• With AMI, TEC avoided 8,800 truck rolls in 2011 for non-payment problems saving more than $350,000
• Expecting to avoid additional 5,500 truck rolls for routine service connections (savings of $200,000/year)
• Expecting to reduce outage durations from more precise pinpointing of faults and dispatching of repair crews to exact locations without guesswork.
Technician changes out analog meter with a smart meter
Facts & FiguresTotal Project Budget: $16,200,000
Federal Share: $ 8,100,000
Customers Served:57,000
Service Area: 2,600 square miles spanning 4 counties in northern Florida

55
Life After ARRA Smart Grid Program

56
Life After ARRA Smart Grid Program
Build and maintain momentum
• Make business case
• Identify, allocate, and quantify benefits
• Identify and quantify costs
• Address technical issues
• Address regulatory issues
• Address customers concerns

57
Contact InformationSteve Bossart
(304) 285-4643
Federal Smart Grid Website
www.smartgrid.gov
Smart Grid Clearinghouse
www.sgiclearinghouse.org/
Smart Grid Implementation Strategy
www.netl.doe.gov/smartgrid/index.html
Questions ?

![[PDF-553KB] Steve Bossart Energy Tech 2011](https://static.fdocuments.net/doc/165x107/6204ecc64c89d3190e0c9797/pdf-553kb-steve-bossart-energy-tech-2011.jpg)