U NIVERSITY OF M INNESOTA Measuring Student Perspectives on University Experiences.
33
UNIVERSITY OF MINNESOTA Measuring Student Perspectives on University Experiences
-
date post
20-Dec-2015 -
Category
Documents
-
view
217 -
download
2
Transcript of U NIVERSITY OF M INNESOTA Measuring Student Perspectives on University Experiences.

UNIVERSITY OF MINNESOTA
Measuring Student Perspectives on
University Experiences
Measuring Student Perspectives onUniversity Experiences
The focus of this report is on Student Experience, as reported in the 2001 Student Experiences Survey (SES).
The 2001 SES was administered to a random sample of students enrolled on the four campuses of the University of Minnesota spring semester 2001.

Background
During the past 10 years, the University of Minnesota has placed an emphasis upon improving the undergraduate experience on all campuses.
Starting in 1997, this emphasis was dramatically strengthened through the enhancement and expansion of existing programs and such new programs as:
• New Student Convocation• Freshman Seminars• Academy of Distinguished Teachers

The University’s efforts to measure student perspectives on campus experiences are important to the Compact Planning Process, the University’s Institutional Measures, and the specific goals of the President’s Undergraduate Education Initiative.
Background

The Compact Planning Process, which is premised upon a shared responsibility for articulating and realizing measurable outcomes, requires the persistent use of such evaluation and accountability tools as:
• surveys• institutional level performance measures• collegiate measures of efficiency and effectiveness
These measures initially serve to set performance benchmarks. Subsequently they demonstrate our success in meeting our goals as well as help create informed options for future investment and institutional renewal.
Background

2001 Student Experiences Survey
Respondents % of Sample
Crookston 102 (58.3%)Morris 145 (64.4%)Duluth 294 (58.8%)Twin Cities 401 (50.1%)Grad/Prof 415 (55.4%)
Response Scale
1 = very poor2 = poor3 = fair4 = good5 = very good6 = excellent
Survey Period: April – May 2001
Methodology: Electronic (Web)

It was just following the administration of the 1999 Student Satisfaction Survey that the University changed to a semester-based academic calendar and a new student information system (PeopleSoft).
Students, faculty, and staff are still accommodating themselves to these very significant changes. The first year (1999-00) was particularly difficult for many students.
We fully expected that student satisfaction as measured by the survey might suffer, and it did.
Background
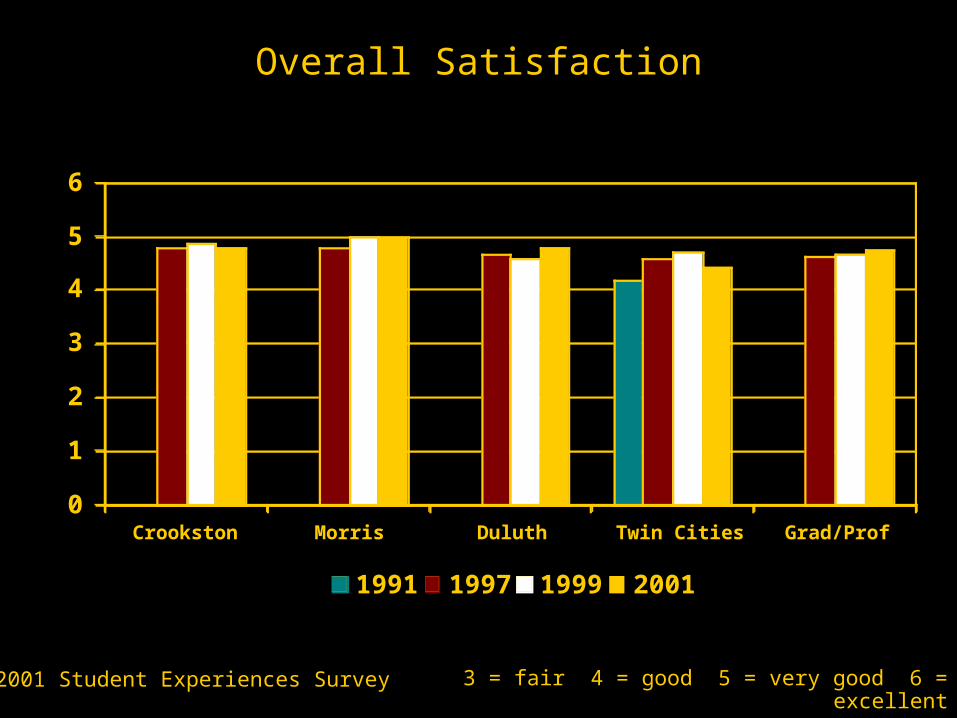
Overall Satisfaction
0
1
2
3
4
5
6
Crookston Morris Duluth Twin Cities Grad/Prof
1991 1997 1999 2001
2001 Student Experiences Survey 3 = fair 4 = good 5 = very good 6 = excellent
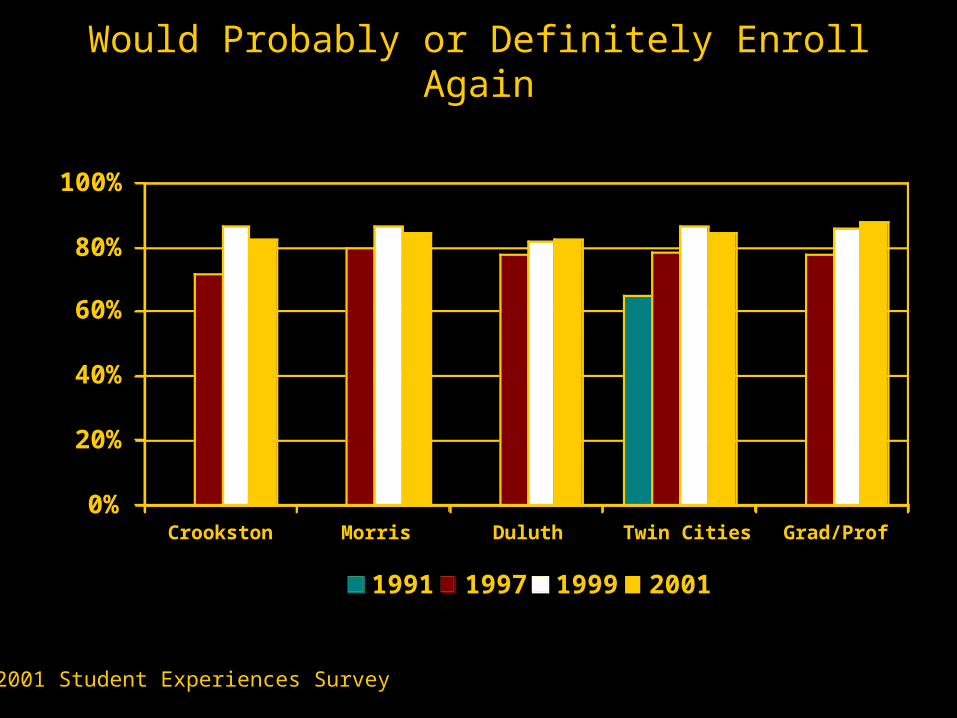
Would Probably or Definitely Enroll Again
0%
20%
40%
60%
80%
100%
Crookston Morris Duluth Twin Cities Grad/Prof
1991 1997 1999 2001
2001 Student Experiences Survey

Overall Quality of the University’s Academic ProgramsUndergraduates
0
1
2
3
4
5
6
Crookston Morris Duluth Twin Cities
1997 1999 2001
2001 Student Experiences Survey 3 = fair 4 = good 5 = very good 6 = excellent

Quality of Faculty in Major Field of StudyUndergraduates
0
1
2
3
4
5
6
Crookston Morris Duluth Twin Cities
1997 1999 2001
2001 Student Experiences Survey 3 = fair 4 = good 5 = very good 6 = excellent

Instruction: Quality of InstructionUndergraduates
0
1
2
3
4
5
6
Crookston Morris Duluth Twin Cities
1997 1999 2001
2001 Student Experiences Survey 3 = fair 4 = good 5 = very good 6 = excellent

Instruction: Availability of InstructorsUndergraduates
0
1
2
3
4
5
6
Crookston Morris Duluth Twin Cities
1997 1999 2001
2001 Student Experiences Survey 3 = fair 4 = good 5 = very good 6 = excellent

Instruction: Class SizeUndergraduates
0
1
2
3
4
5
6
Crookston Morris Duluth Twin Cities
1997 1999 2001
2001 Student Experiences Survey 3 = fair 4 = good 5 = very good 6 = excellent

Quality of ClassroomsUndergraduates
0
1
2
3
4
5
6
Crookston Morris Duluth Twin Cities
1997 1999 2001
2001 Student Experiences Survey 3 = fair 4 = good 5 = very good 6 = excellent

Availability of Places to Study on CampusUndergraduates
0
1
2
3
4
5
6
Crookston Morris Duluth Twin Cities
1997 1999 2001
2001 Student Experiences Survey 3 = fair 4 = good 5 = very good 6 = excellent

Overall Physical Environment of the CampusUndergraduates
0
1
2
3
4
5
6
Crookston Morris Duluth Twin Cities
1997 1999 2001
2001 Student Experiences Survey 3 = fair 4 = good 5 = very good 6 = excellent

Administration's Responsivenessto Concerns of Students
Undergraduates
0
1
2
3
4
5
6
Crookston Morris Duluth Twin Cities
1997 1999 2001
2001 Student Experiences Survey 3 = fair 4 = good 5 = very good 6 = excellent

Cost of Attending the UniversityUndergraduates
0
1
2
3
4
5
6
Crookston Morris Duluth Twin Cities
1997 1999 2001
2001 Student Experiences Survey 3 = fair 4 = good 5 = very good 6 = excellent

Overall SatisfactionStudents of Color
0
1
2
3
4
5
6
Crookston Morris Duluth Twin Cities Grad/Prof
Other Students of Color
2001 Student Experiences Survey 3 = fair 4 = good 5 = very good 6 = excellent

Overall SatisfactionStudents of Color
0
1
2
3
4
5
6
Crookston Morris Duluth Twin Cities
1997 1999 2001
2001 Student Experiences Survey
sampletoo
small
sampletoo
small
3 = fair 4 = good 5 = very good 6 = excellent

Overall Quality of the University’s Academic Programs Students of Color
0
1
2
3
4
5
6
Crookston Morris Duluth Twin Cities Grad/Prof
Other Students of Color
2001 Student Experiences Survey 3 = fair 4 = good 5 = very good 6 = excellent

“Took a course that required accessinginformation through the internet.”
0%
20%
40%
60%
80%
100%
Crookston Morris Duluth Twin Cities Grad/Prof
2001 Student Experiences Survey

“Accessed Course Materials Online.”
0%
20%
40%
60%
80%
100%
Crookston Morris Duluth Twin Cities Grad/Prof
2001 Student Experiences Survey

“E-mailed an Instructor with aQuestion about a Class.”
0%
20%
40%
60%
80%
100%
Crookston Morris Duluth Twin Cities Grad/Prof
2001 Student Experiences Survey

“Received an E-mail from an Instructorabout class material.”
0%
20%
40%
60%
80%
100%
Crookston Morris Duluth Twin Cities Grad/Prof
2001 Student Experiences Survey

Crookston
Activity 1997 1999 2001
Hours attending class 17.9 17.9 15.7
Hours in extracurricular activities 3.9 4.5 4.2
Hours Studying 13.2 17.0 14.1
Hours paid University job 3.6 6.4 3.8
Hours paid Non-University job 11.0 6.8 8.5
Total 49.6 52.6 46.3

Duluth
Activity 1997 1999 2001
Hours attending class 15.2 14.8 15.3
Hours in extracurricular activities 3.6 3.3 3.3
Hours Studying 15.6 15.2 14.4
Hours paid University job 3.2 3.5 3.2
Hours paid Non-University job 8.6 10.0 8.4
Total 46.2 46.8 44.6

Morris
Activity 1997 1999 2001
Hours attending class 16.5 16.2 14.8
Hours in extracurricular activities 6.2 4.1 4.6
Hours Studying 18.4 17.9 14.1
Hours paid University job 4.9 3.7 4.4
Hours paid Non-University job 3.5 4.2 4.5
Total 49.5 46.1 42.4

Twin Cities
Activity 1997 1999 2001
Hours attending class 15.0 14.6 14.9
Hours in extracurricular activities 3.1 2.9 3.6
Hours Studying 18.0 16.9 16.1
Hours paid University job 4.7 4.5 4.5
Hours paid Non-University job 10.0 10.6 10.2
Total 50.8 49.5 49.3

Calendar Preference?
Quarters Semesters
Undergraduate
Crookston 57.6% 42.4%
Morris 51.8% 48.2%
Duluth 52.2% 47.8%
Twin Cities 56.4% 43.6%
Graduate 52.4% 47.6%

The overall goal of the University’s initiative to improve the undergraduate educational experience is to create a richer and deeper set of intensive learning experiences and academic connections that are strongly correlated with retention, graduation rates, and student satisfaction.
A challenge for the Board of Regents and the administration is to continually review performance as it relates to Institutional Initiatives with the aid of the Institutional Measures and to adjust goals and benchmarks as appropriate.
Conclusion

Conclusion
The University’s efforts to improve undergraduate education on all four campuses are on-going.
So too is its monitoring of initiatives to improve undergraduate education and its measurement of student satisfaction with their undergraduate experience, student interest in the University, and student success.