
u Holcomb Generation Expansion Project - Kansas …€¦ · · 2012-02-17FINAL REPORT Holcomb...
71
u FINAL REPORT Holcomb Generation Expansion Project August 24, 2006 Coal Technology Selection Study Project 144102 © Black & Veatch 2006. All Rights Reserved.
-
Upload
nguyenlien -
Category
Documents
-
view
216 -
download
1
Transcript of u Holcomb Generation Expansion Project - Kansas …€¦ · · 2012-02-17FINAL REPORT Holcomb...

u
FINAL REPORT
Holcomb Generation Expansion Project
August 24, 2006
Coal Technology Selection Study
Project 144102 © Black & Veatch 2006. All Rights Reserved.

Holcomb Unit Addition Coal Technology Selection Study
Table of Contents
August 24, 2006 TC-1 © Black & Veatch 2006 Final Report All Rights Reserved
Table of Contents
1.0 Executive Summary .................................................................................................. 1-1 1.1 Conventional Coal Fired Technologies ........................................................... 1-1 1.2 IGCC Technologies ......................................................................................... 1-2
1.2.1 Gasification Process Description ................................................................ 1-2 1.2.2 Gasification Technologies .......................................................................... 1-2 1.2.3 Gasification Suppliers................................................................................. 1-3 1.2.4 Effect of Fuel Characteristics on Gasifier Selection................................... 1-3
1.3 IGCC Industry Activity.................................................................................... 1-4 1.4 Technology Screening Performance and Cost Estimates ................................ 1-5 1.5 Environmental Considerations......................................................................... 1-5 1.6 Economic Analysis .......................................................................................... 1-6 1.7 Recommendations and Conclusions ................................................................ 1-7
2.0 Conventional Coal Fired Technologies (PC and CFB) ............................................. 2-1 2.1 Pulverized Coal................................................................................................ 2-1 2.2 Fluidized Bed................................................................................................... 2-3 2.3 PC Comparison with CFB ............................................................................... 2-7
2.3.1 Environmental............................................................................................. 2-7 2.3.2 Operational.................................................................................................. 2-8 2.3.3 Availability and Reliability......................................................................... 2-9 2.3.4 Technology Maturity .................................................................................. 2-9
2.4 CFB Experience in the United States............................................................. 2-11
3.0 IGCC Technologies and Industry Activity................................................................ 3-1 3.1 Gasification Technologies and Suppliers......................................................... 3-1 3.2 Entrained Flow Gasification Process Description ........................................... 3-4 3.3 Gasification Technology Suppliers.................................................................. 3-7 3.4 Gasifier Technology Selection......................................................................... 3-8 3.5 Commercial IGCC Experience ...................................................................... 3-10 3.6 Effect of Fuel Characteristics on Gasifier Selection...................................... 3-15 3.7 IGCC Performance and Emissions Considerations ....................................... 3-16 3.8 Gasification Wastewater Treatment............................................................... 3-17 3.9 Acid Gas Removal Technology..................................................................... 3-18 3.10 Equivalent Availability .......................................................................... 3-19
3.10.1 First Generation IGCC Plants ................................................................. 3-19

Holcomb Unit Addition Coal Technology Selection Study
Table of Contents
August 24, 2006 TC-2 © Black & Veatch 2006 Final Report All Rights Reserved
3.10.2 Second Generation IGCC Plants............................................................. 3-20 3.11 Other Commercial Entrained Bed Gasification Experience .................. 3-21 3.12 Current Announced Electric Generation Industry Activity ................... 3-22
3.12.1 American Electric Power Company........................................................ 3-22 3.12.2 Duke Energy (Cinergy/PSI and Vectren) ............................................... 3-23 3.12.3 Excelsior Energy, Inc.............................................................................. 3-24 3.12.4 Southern Company and Orlando Utilities Commission.......................... 3-25 3.12.5 Global Energy Projects ........................................................................... 3-26 3.12.6 The ERORA Group, LLC....................................................................... 3-27 3.12.7 Energy Northwest ................................................................................... 3-28 3.12.8 NRG Northeast........................................................................................ 3-28 3.12.9 Summary of Proposed Projects............................................................... 3-29
4.0 Technology Screening Performance and Cost Estimates.......................................... 4-1 4.1 Assumptions..................................................................................................... 4-1
4.1.1 Overall Assumptions................................................................................... 4-1 4.1.2 Thermal Unit Cycle Arrangement Assumptions......................................... 4-2 4.1.3 IGCC Cycle Arrangement Assumptions..................................................... 4-3
4.2 Performance Cases........................................................................................... 4-4 4.2.1 Thermal Unit Cases..................................................................................... 4-4 4.2.2 IGCC Cases................................................................................................. 4-4
4.3 Emissions ......................................................................................................... 4-7 4.4 Capital Costs .................................................................................................... 4-7
4.4.1 Owner’s Costs............................................................................................. 4-7 4.4.2 Project Costs ............................................................................................... 4-9
4.5 Nonfuel O&M Costs ...................................................................................... 4-10
5.0 Economic Analysis.................................................................................................... 5-1 5.1 Economic Criteria ............................................................................................ 5-1 5.2 Busbar Analysis ............................................................................................... 5-1
6.0 Recommendations and Conclusions.......................................................................... 6-1

Holcomb Unit Addition Coal Technology Selection Study
Table of Contents
August 24, 2006 TC-3 © Black & Veatch 2006 Final Report All Rights Reserved
List of Tables Table 1-1. Summary of Unit Cost and Performance Estimates ...................................... 1-5 Table 1-2. Estimated Emissions...................................................................................... 1-6 Table 1-3. Busbar Results ............................................................................................... 1-7 Table 2-1. PC and CFB Boiler Comparison ................................................................. 2-10 Table 3-1. Comparison of Key Gasifier Design Parameters......................................... 3-10 Table 3-2. IGCC Projects--All Fuels ............................................................................ 3-11 Table 3-3. Coal-Based IGCC Demonstration Plants .................................................... 3-12 Table 3-4. As-Received Coal Properties of Typical Coals ........................................... 3-15 Table 3-5. Coal/Coke Fueled IGCC Plant Equivalent Availabilities ........................... 3-20 Table 3-6. Estimated Equivalent Availabilities for Shell IGCC Without Spare........... 3-21 Table 4-1. PRB Coal - Quality Parameters..................................................................... 4-1 Table 4-2. Supercritical PC Performance Estimates....................................................... 4-5 Table 4-3. Subcritical PC Performance Estimates.......................................................... 4-5 Table 4-4. CFB Performance Estimates.......................................................................... 4-6 Table 4-5. 3-on-1 GE 7FB IGCC Performance Estimates.............................................. 4-6 Table 4-6. Estimated Emissions...................................................................................... 4-7 Table 4-7. Potential Owner’s Costs ................................................................................ 4-8 Table 4-8. Estimated Capital Costs (2006 $) ................................................................ 4-10 Table 4-9. O&M Consumables Assumptions (2006 $) ................................................ 4-10 Table 4-10. Estimated O&M Costs at Average Ambient Conditions (2006 $) ............ 4-11 Table 5-1. Economic Criteria.......................................................................................... 5-1 Table 5-2. Fuel Forecasts ($/MBtu)................................................................................ 5-1 Table 5-3. Summary of Busbar Model Inputs ................................................................ 5-2 Table 5-4. Busbar Results ............................................................................................... 5-2
List of Figures Figure 2-1. Fluidized Bed Technologies......................................................................... 2-3 Figure 2-2. Environmental Benefits of CFB Technology............................................... 2-5 Figure 2-3. Typical CFB Unit......................................................................................... 2-6 Figure 3-1. IGCC Process Flow Diagram....................................................................... 3-4 Figure 3-2. GE 7FA Syngas Flow Rate .......................................................................... 3-6 Figure 3-3. Potential Areas for Integration ................................................................... 3-14

Holcomb Unit Addition Coal Technology Selection Study
Acronym List
August 24, 2006 AC-1 © Black & Veatch 2006 Final Report All Rights Reserved
Acronym List
ACI Activated Carbon Injection AEP American Electric Power AFBC Atmospheric Fluidized Bed Combustion AGR Acid Gas Removal ASU Air Separation Unit BACT Best Available Control Technology BFB Bubbling Fluidized Bed Ca/S Calcium to Sulfur CaO Calcium Oxide CaS Calcium Sulfide CaSO4 Calcium Sulfate CC Combined Cycle CCPI Clean Coal Power Initiative CCRB Clean Coal Review Board CFB Circulating Fluidized Bed CO Carbon Monoxide CO2 Carbon Dioxide COP ConocoPhillips COS Carbonyl Sulfide CTG Combustion Turbine Generator DA Deaerator DLN Dry-low NOx
DOE Department of Energy EIS Environmental Impact Statement EPC Engineering, Procurement, and Construction EPRI Electric Power Research Institute FBC Fluidized Bed Combustion FEED Front End Engineering Design FGD Flue Gas Desulfurization FWH Feed Water Heater GE General Electric GEC Gasification Engineering Corporation H2S Hydrogen Sulfide H2SO4 Sulfuric Acid HCl Hydrogen Chloride HCN Hydrogen Cyanide

Holcomb Unit Addition Coal Technology Selection Study
Acronym List
August 24, 2006 AC-2 © Black & Veatch 2006 Final Report All Rights Reserved
Hg Mercury HHV Higher Heating Value HP High-Pressure HRSG Heat Recovery Steam Generator HTHR High Temperature Heat Recovery IGCC Integrated Gasification Combined Cycle ISO International Standards Organization KBR Kellogg Brown and Root LHV Lower Heating Value LP Low-Pressure LSB Last-Stage Blade MDEA Methyl Diethanol Amine MHI Mitsubishi Heavy Industries N2 Nitrogen NEPA National Environmental Policy Act NGCC Natural Gas-fired Combined Cycle NH3 Ammonia NOx Oxides of Nitrogen NPHR Net Plant Heat Rate O2 Oxygen O&M Operations and Maintenance OUC Orlando Utilities Commission PC Pulverized Coal petcoke Petroleum Coke PM Particulate Matter PPA Power Purchase Agreement PRB Powder River Basin PSDF Power Systems Development Facility PUCO Public Utilities Commission of Ohio RFP Request for Proposal SCR Selective Catalytic Reduction SO2 Sulfur Dioxide SNCR Selective Noncatalytic Reduction SPG Siemens Power Generation STG Steam Turbine Generator SPG Siemens Power Generation SWEPCO Southwestern Electric Power Company

Holcomb Unit Addition Coal Technology Selection Study
Acronym List
August 24, 2006 AC-3 © Black & Veatch 2006 Final Report All Rights Reserved
syngas Synthetic Gas TC Tandem Compound TRIG™ Transport Reactor Integrated Gasification US United States VWO Valves Wide Open WHB Waste Heat Boiler ZLD Zero Liquid Discharge 4F Four-Flow
Units of Measure ¢ cents $ dollar % percent ° F degrees Fahrenheit Btu British thermal unit ft foot ft3 cubic feet h hour in. HgA inches mercury absolute kW kilowatt lb pound ltpd long tons per day (2,200 lb/day) m3 cubic meters MBtu million British thermal unit mg milligrams MW megawatt MWh megawatt-hour ppb parts per billion ppm parts per million ppmvd parts per million volumetric dry psia pounds per square inch absolute psig pounds per square inch gauge scf standard cubic feet sec second stpd short tons per day (2,000 lb/day) tpd tons per day yr year
Holcomb Generation Expansion Project Coal Technology Selection Study
1.0 Executive Summary
August 24, 2006 1-1 © Black & Veatch 2006 Final Report All Rights Reserved
1.0 Executive Summary
Black & Veatch was retained to perform a coal technology selection study for the Holcomb Generation Expansion Project (Holcomb). The study compared subcritical and supercritical pulverized coal (PC), circulating fluid bed (CFB), and integrated gasification combined cycle (IGCC). Performance and cost estimates were based on the use of Powder River Basin (PRB) coal in western Kansas. A busbar economic analysis was also performed.
1.1 Conventional Coal Fired Technologies Coal is the most widely used fuel for the production of power, and most coal
burning power plants use PC boilers. PC units have the advantage of utilizing a proven technology with a high reliability level. These units can be very large, up to 1,300 MW, and the economies of scale result in low busbar costs. PC units are relatively easy to operate and maintain.
During the 1980s, fluid bed combustion (FBC) rapidly emerged as a viable alternative to PC-fueled units for the combustion of solid fuels. FBC was applied to the electric utility industry because of its perceived environmental advantages over competing combustion technologies. Sulfur dioxide (SO2) emissions could be controlled from FBC units without the use of external scrubbers, and oxides of nitrogen (NOx) emissions from FBC units were inherently low. Furthermore, FBC units were touted as being “fuel flexible,” with the capability of firing a wide range of solid fuels with varying heating value, ash content, and moisture content. CFB boilers are the most common type of FBC for coal fired projects.
Even though CFB boilers have been providing steam for reheat turbine electric power generation for more than 20 years, the steaming capacities have been limited to less than 150 MW in most cases. Unit size has recently increased, and there are several reheat boilers now in service, supporting electrical generation up to nearly 300 MW. Units such as these are currently in service or under construction and are designed to burn solid fuels ranging from low volatile anthracite, petroleum coke (petcoke), subbituminous coal, high volatile bituminous coal, and high moisture lignite.
PC boilers are operating with steaming capacities sufficient to support up to 1,300 MW of electrical generation. Realization of the economies of scale for PC boilers has led to the construction of units predominantly larger than 250 MW; these units are designed to operate with supercritical steam conditions to reduce fuel costs and flue gas emissions.

Holcomb Generation Expansion Project Coal Technology Selection Study
1.0 Executive Summary
August 24, 2006 1-2 © Black & Veatch 2006 Final Report All Rights Reserved
1.2 IGCC Technologies IGCC is a relatively new coal fired power conversion technology. It is being
strongly considered by many utilities that are contemplating adding coal fired generation in the short-term planning horizon.
1.2.1 Gasification Process Description Gasification consists of partially oxidizing a carbon containing feedstock (solid or
liquid) at a high temperature (2,500 to 3,000° F) to produce a synthetic gas (syngas) consisting primarily of carbon monoxide (CO) and hydrogen. A small portion of the carbon is completely oxidized to carbon dioxide (CO2) to generate sufficient heat for the endothermic gasification reactions. The gasifier operates in a reducing environment that converts most of the sulfur in the feed to hydrogen sulfide (H2S). A small amount of the sulfur is converted to carbonyl sulfide (COS). Some sulfur remains in the ash, which is melted and then quenched to produce slag.
An IGCC plant includes an air separation unit (ASU) that cryogenically separates oxygen from nitrogen. The oxygen is used as the oxidant in the gasifier to produce low heating value gas (200 to 300 Btu/scf higher heating value [HHV]). High-pressure (HP) nitrogen from the ASU is used to dilute the syngas heating value to approximately 125 to 150 Btu/scf lower heating value (LHV) for NOx control. Significant cleanup of the syngas is required before it enters the combustion turbine generator (CTG) combustor.
1.2.2 Gasification Technologies Currently, there are four main types of gasifiers: • Entrained flow gasifiers • Fixed bed (or moving bed) gasifiers • Fluid bed gasifiers • Transport bed gasifiers Entrained flow and fixed bed gasifiers generally use high purity oxygen. Fluid
bed and transport gasifiers use air. The use of high purity oxygen significantly reduces equipment size and is more economical for large-scale IGCC.
At the present time, entrained flow gasifiers are generally considered to be the best choice for high capacity gasification to produce a syngas suitable for CTG fuel for power generation.

Holcomb Generation Expansion Project Coal Technology Selection Study
1.0 Executive Summary
August 24, 2006 1-3 © Black & Veatch 2006 Final Report All Rights Reserved
1.2.3 Gasification Suppliers Today there are three major entrained bed coal gasification technology suppliers: • ConocoPhillips (COP), which licenses “E-Gas” (which was developed by
Dow). COP purchased this technology from Global Energy in August 2003. • General Electric (GE), which purchased Texaco gasification technology from
ChevronTexaco in June 2004. • Shell, which developed its gasification technology in conjunction with
Prenflo. The COP and GE gasifiers are refractory lined coal-water slurry feed. Shell and
Krupp jointly developed a waterwall type gasifier with dry, pulverized coal feed specifically for IGCC power generation.
Coal-based IGCC projects using these gasification technologies are in various early stages of development in the United States. As these projects progress, the engineering, procurement, and construction (EPC) terms and conditions will be developed. Potential IGCC owners are stating a need for the EPC contractor to provide overall project guarantees that will “wrap” the supplied technology and equipment. EPC contractors have indicated that they intend to address this issue.
1.2.4 Effect of Fuel Characteristics on Gasifier Selection There are three general coal feedstocks typically considered for domestic IGCC
projects: Pittsburgh No. 8, Illinois No. 6, and PRB. Petcoke is a fourth solid fuel feedstock that is frequently considered for IGCC applications. Petcoke is a lower cost fuel, but it is not as readily obtainable as coal. Coal-based operating experience has been focused almost exclusively on bituminous coals (e.g., Pittsburgh No. 8 and Illinois No. 6); there is also extensive experience with petcoke. Subbituminous (i.e., PRB) coals have been tested only in a limited fashion, but, because of the nature of the US coal market and the abundance of PRB coal, there is strong interest in using it for IGCC applications.
All three of the major gasification technologies (offered by COP, GE, and Shell) can operate on bituminous coals and petcoke; Shell gasification technology has a strong economic advantage over COP and GE when 100 percent PRB coal is used. The Shell gasification technology dries the coal during milling; therefore, the high moisture content of low rank coals such as PRB does not affect gasifier performance. The COP and GE gasification technologies slurry the coal during milling. The inherent moisture in low rank coals such as PRB is in addition to the 35 percent (by weight) liquid water in the slurry. For PRB coal containing 30 percent (by weight) inherent moisture, the total water content of the slurry to the gasifier is 54.5 percent (by weight). The heat required to

Holcomb Generation Expansion Project Coal Technology Selection Study
1.0 Executive Summary
August 24, 2006 1-4 © Black & Veatch 2006 Final Report All Rights Reserved
evaporate this water in the gasifier is provided by combusting carbon in the coal to CO2, which greatly reduces the fuel value of the syngas.
This study reviews the three commercially available entrained flow gasification technologies. Since PRB will be the fuel for the Holcomb project, the cost and performance data developed for the more detailed comparison is based upon the Shell technology.
1.3 IGCC Industry Activity There have been approximately 18 IGCC projects throughout the world, some of
which are no longer operating. Of these, nine were coal-based, two are petcoke-based, six are oil-based, and one is sludge-based. Two of the coal-based IGCC plants, Cool Water in California and the Dow Chemical Plaquemine Plant in Louisiana, were small demonstration projects and have been decommissioned. Another small coal IGCC demonstration project was Sierra Pacific’s Piñon Pine Project in Nevada. This project, based on a fluid bed technology, was not successful.
Of the six operating coal IGCC plants, one is a 40 MW plant that co-produces methanol using a Noell gasifier, one is a 350 MW lignite cogeneration plant that has 26 Lurgi fixed bed gasifiers, and four are commercial-scale, entrained flow gasification demonstration projects, ranging in capacity from 250 to 300 MW and located in Florida, Indiana, The Netherlands, and Spain. Each of the four entrained flow gasification demonstration projects was a government-subsidized IGCC demonstration. Each of these IGCC plants consists of a single train (one ASU, one gasifier, one gas treating train, and one combined cycle (CC) composed of one CTG, one heat recovery steam generator (HRSG), and one steam turbine generator [STG]), with net outputs between 250 and 300 MW. Each plant experienced numerous problems during its first years of operation.
The operation of these four commercial coal-fueled IGCC plants has adequately demonstrated capacity, efficiency, and environmental performance. Uncertainty remains regarding plant availability and capital and operations and maintenance (O&M) costs. The complexity and relative immaturity of the IGCC process increases opportunities for deficiencies in design, vendor-supplied equipment, construction, operation, and maintenance. Recent gasification technology ownership changes and the formation of alliances to provide IGCC plants have developed an interest in coal-based IGCC applications among US energy companies. Major industry participants such as American Electric Power (AEP) and Duke Energy (formerly Cinergy) are considering implementing IGCC projects. In addition, numerous smaller companies are pursuing IGCC using state and federal grants. Two coal-fueled IGCC projects are currently under construction worldwide. Foundations for fuel storage buildings are being built to supply

Holcomb Generation Expansion Project Coal Technology Selection Study
1.0 Executive Summary
August 24, 2006 1-5 © Black & Veatch 2006 Final Report All Rights Reserved
the proposed 600 MW Global Energy plant in Lima, Ohio. Construction of the main plant is scheduled to begin soon. Mitsubishi Heavy Industries (MHI) is building a 250 MW demonstration plant for its air-blown IGCC technology in Japan. Startup of this plant is scheduled for 2007, with the completion of the demonstration period by March 2010.
1.4 Technology Screening Performance and Cost Estimates Black & Veatch developed performance and cost estimates for four baseload
generation technology options. The performance and cost data were utilized in a busbar screening tool discussed in Section 6.0. For purposes of this evaluation, it was critical that the technologies be evaluated on a consistent basis relative to each other. The four baseload technologies considered were as follows:
• PC - supercritical • PC - subcritical • CFB • IGCC The size of the unit was assumed to be a nominal 700 MW (net) at the plant
boundary, fueled with PRB coal. The cost estimates have assumed that this expansion is an add-on project to a brownfield site. A summary of cost and performance estimates is shown in Table 1-1.
1.5 Environmental Considerations Changes in regulations and legislation could affect future generation choices. An
example of one such change is the mercury reduction requirement, to begin in 2010. For purposes of this screening evaluation, the estimated emissions listed in Table
1-2 have been utilized. Final permit levels may vary on a case-by-case basis.
Table 1-1. Summary of Unit Cost and Performance Estimates
Technology Supercritical
PC Subcritical
PC CFB IGCC Net Plant Heat Rate (NPHR), Btu/kWh (HHV)
9,086 9,289 9,396 8,962
Specific Project Cost, $/kW (2006) 1,877 1,830 1,934 2,247 Fixed O&M Costs, $/kW (2006) 22.15 22.00 24.99 34.20 Nonfuel Variable O&M Costs, $/MWh (2006)
1.96 1.93 1.93 6.12

Holcomb Generation Expansion Project Coal Technology Selection Study
1.0 Executive Summary
August 24, 2006 1-6 © Black & Veatch 2006 Final Report All Rights Reserved
Table 1-2. Estimated Emissions
Supercritical PC Subcritical PC CFB IGCC NOx, lb/MBtu1 0.07 0.07 0.07 0.06 SO2, lb/MBtu2 0.10 0.10 0.10 0.015 PM, lb/MBtu3 0.012 0.012 0.012 0.007 Hg, lb/MWh4 20 x 10-6 20 x 10-6 20 x 10-6 10x10-6 Notes: 1. NOx values are consistent with recent permit applications. IGCC does not include selective catalytic
reduction (SCR). 2. SO2 values are consistent with recent permit applications. 3. Particulate matter (PM) values are filterable. 4. Hg values are based on testing at the Holcomb site with activated carbon injection (ACI) (for PC and
CFB) and are based on experience at Eastman for IGCC.
1.6 Economic Analysis A busbar analysis was developed to compare the four technologies. Key
economic criteria utilized in the busbar evaluation are described below. The total project cost includes both the EPC cost as well as the Owner’s costs.
For this screening analysis, the Owner’s costs have been estimated as a flat 35 percent of the EPC capital cost. This cost was assumed to account for escalation from 2006 to the mid-point of construction, as well as for interest during construction. Permitting and project development costs were also assumed to be covered. Potential Owner’s costs are described in Table 4-7. In addition, a 6 percent Owner’s risk contingency was added to the IGCC costs to account for issues in the first few years of operation, such as added personnel required for startup and commissioning, debottlenecking of processes, and streamlining operations.
The analysis was based upon a 90 percent capacity factor for a 700 MW (net) unit, or 5,518,800 MWh per year. The annual average-day conditions were utilized for performance estimates.
Fuel forecasts for natural gas and typical PRB coal for a western Kansas site were developed and are provided in Table 5-2.
A present worth discount rate of 8.5 percent and a levelized fixed charge rate of 10.5 percent were used for the analysis.
The results are presented in Table 1-3. From this analysis, it is clear that a PC unit is the preferred technology. While subcritical PC has a lower busbar cost, the two cases are within 1 percent of each other, and for practical purposes can be viewed as essentially the same.

Holcomb Generation Expansion Project Coal Technology Selection Study
1.0 Executive Summary
August 24, 2006 1-7 © Black & Veatch 2006 Final Report All Rights Reserved
Table 1-3. Busbar Results
30-Year Levelized
Busbar Cost, 30-Year Levelized
Annual Cost, Case Description ¢/kWh $1,000,000
1 Supercritical PC 4.64 256.2 2 Subcritical PC 4.60 254.0 3 CFB 4.82 265.8 4 IGCC 6.91 381.3
Results are based on economic criteria from Table 5-1, fuel forecasts from Table 5-2, and the inputs from Table 5-3.
1.7 Recommendations and Conclusions The economic analysis, as provided in Table 1-3, indicates the lowest cost
technologies are the conventional PC and CFB units. The IGCC levelized busbar cost is roughly 50 percent higher than those of the PC and CFB.
To date, only two commercial nonsubsidized IGCC plants with a primary application of power generation have been built: the Delaware City Refinery, which utilizes petcoke, and the Negishi Refinery in Japan, which utilizes heavy oil. Both of these plants achieved commercial operation after 2000, are located in refineries, and utilize byproducts of the refining process as their fuel source. Currently, no IGCC plant is operating on PRB coal, the fuel source selected for use at the Holcomb site, although the Dow Plaquemine demonstration project operated on PRB coal from 1987 until 1995. To date, the largest IGCC power plant built is the 550 MW Sarlux plant that operates on oil. The Lima petcoke-based IGCC plant is in the early stages of construction and is expected to be about 600 MW in size. Construction of an IGCC plant in the immediate future, as would be the case for the Holcomb units, would entail a substantially greater degree of uncertainty about construction cost and operating reliability compared to a PC fired plant.
While IGCC technology remains promising and has been targeted for development in several locations, at this point, IGCC could not meet the required in-service dates needed by the Holcomb participants. In the 2013 time frame, significantly more data will be available regarding the cost and performance of second generation oxygen-blown entrained flow based technology (COP, GE, and Shell) as well as from demonstration projects of less proven gasification technologies (Siemens, MHI, and TRIG). This additional data could support commercial operation dates for a third generation of IGCC plants in the 2016 to 2020 time frame.

Holcomb Generation Expansion Project Coal Technology Selection Study
1.0 Executive Summary
August 24, 2006 1-8 © Black & Veatch 2006 Final Report All Rights Reserved
The other two technologies evaluated, PC (either super or subcritical) and CFB, are commercially available for consideration for a new 700 MW coal-fired generating facility at Holcomb. The emissions of regulated pollutants from these two technologies are very similar. The most fuel efficient technology is supercritical PC, which is at least 3 percent more efficient than CFB technology. CFB is expected to be slightly more expensive, as measured by the levelized busbar cost of power, than PC.
Within the accuracy of the evaluation, the subcritical and supercritical PCs are assumed to be equivalent. Supercritical PC is the preferred technology (rather than subcritical PC) for the three 700 MW net units to be located at the existing Holcomb station site because it is more efficient, which reduces the coal consumption by approximately 215 tons per day (tpd) per unit. This yields more than 2 percent fewer total emissions because of the reduced fuel burn rate.
For these reasons, supercritical PC is the technology selected for new power generation at Holcomb.
Holcomb Generation Expansion Project Coal Technology Selection Study
2.0 Conventional Coal Fired Technologies
August 24, 2006 2-1 © Black & Veatch 2006 Final Report All Rights Reserved
2.0 Conventional Coal Fired Technologies (PC and CFB)
This section contains a summary-level comparison of CFB and PC technologies, along with a review of CFB experience in the United States, and a discussion of the issues related to scaling-up CFB unit sizes.
The function of a steam generator is to provide controlled release of heat from the fuel and efficient transfer of heat to the feedwater and steam. The transfer of heat produces main steam at the pressure and temperature required by the HP turbine. Conventional coal fired steam generator design has evolved into two basic combustion and heat transfer technologies. Suspension firing of coal in a PC unit and combustion of crushed coal in a CFB unit are the predominant coal fired technologies in operation today.
2.1 Pulverized Coal Coal is the most widely used fuel for the production of power, and most coal-
burning power plants use PC boilers. PC units have the advantage of utilizing a proven technology with a high reliability. These units can be very large, up to 1,300 MW, and the economies of scale can result in low busbar costs. PC units are relatively easy to operate and maintain.
New generation PC boilers can be designed at supercritical steam pressures of 3,600 to 4,500 psig, compared to the steam pressure of 2,400 psig for conventional subcritical boilers. The increase in pressure from subcritical to supercritical pressure can decrease the heat rate by about 2.2 percent. This increase in efficiency comes at a cost, however, and the economics of the decision between subcritical and supercritical design depend on the cost of fuel, expected unit capacity factor, environmental factors, and the cost of capital.
With PC technology, coal that is sized to roughly 20 mm top size is fed to the pulverizers, which finely grind the coal to a size of no less than 70 percent through a 200 mesh screen (70 microns). This pulverized coal is conveyed to the coal burners suspended in the primary air stream. At the burner, this mixture of primary air and coal is further mixed with secondary air and, with the presence of sufficient heat for ignition, the coal burns in suspension with the expectation that combustion will be complete before the burner flame contacts the back wall or side walls of the furnace. Current pulverized fuel combustion technology also includes features to minimize unintended products of combustion, such as NOx and other air toxics such as CO.
Because of the high combustion temperature of PC at the burners, the furnace enclosure is constructed of membrane waterwalls to absorb the radiant heat of

Holcomb Generation Expansion Project Coal Technology Selection Study
2.0 Conventional Coal Fired Technologies
August 24, 2006 2-2 © Black & Veatch 2006 Final Report All Rights Reserved
combustion. This heat absorption in the furnace is used to evaporate the preheated boiler feedwater that is circulated through the membrane furnace walls. The steam from the evaporated feedwater is separated from the liquid feedwater and routed to additional heat transfer surfaces in the steam generator. Once the products of coal combustion (ash and flue gas) have been cooled sufficiently by the waterwall surfaces so that the ash is no longer molten but is in solid form, heat transfer surfaces, predominantly of the convective type, absorb the remaining heat of combustion. These convective heat transfer surfaces are the superheaters, reheaters, and economizers located within the steam generator enclosure downstream of the furnace. The final section of boiler heat recovery is in the air preheater, where the flue gas leaving the economizer surface is further cooled by regenerative or recuperative heat transfer to the incoming combustion air.
Though the steam generating surfaces are designed to preclude the deposition of molten or sticky ash products, on-line cleaning systems are provided to enable the removal of ash deposits as they occur. These on-line cleaners are typically soot blowers that utilize either HP steam or air to dislodge ash deposits from heat transfer surfaces or, in cases with extreme ash deposition, utilize high pressure water to remove molten ash deposits from evaporative steam generator surfaces. The characteristics of the coal, such as ash content and the ash chemical composition, dictate the type, quantity, and frequency of use of these on-line ash cleaning systems. Ash characteristics also dictate steam generator design regarding the maximum flue gas temperatures that can be tolerated entering convective heat transfer surfaces. The design must ensure that ash in the flue gas stream has been sufficiently cooled so that it will not rapidly agglomerate or bond to convective heat transfer surfaces. For very hard and erosive ash components, the flue gas velocities must be sufficiently slow so that the ash will not rapidly erode heat transfer surfaces.
With PC combustion technology, the majority of the solid ash components in the coal will be carried in the flue gas stream all the way through the furnace and convective heat transfer components so that they may be collected by particulate removal equipment downstream of the air preheaters. Typically, no less than 80 percent of the total ash will be carried out of the steam generator for collection downstream. Approximately 15 percent of the total fuel ash is collected from the furnace hopper (bottom ash), and 5 percent is collected in hoppers located below the steam generator economizer and regenerative air heaters.

Holcomb Generation Expansion Project Coal Technology Selection Study
2.0 Conventional Coal Fired Technologies
August 24, 2006 2-3 © Black & Veatch 2006 Final Report All Rights Reserved
2.2 Fluidized Bed During the 1980s, FBC rapidly emerged as a viable alternative to PC-fueled units
for the combustion of solid fuels. Initially used in the chemical and process industries, FBC was applied to the electric utility industry because of its perceived advantages over competing combustion technologies. SO2 emissions could be controlled from FBC units without the use of external scrubbers, and NOx emissions from FBC units are inherently low. Furthermore, FBC units are “fuel flexible,” with the capability of firing a wide range of solid fuels with varying heating value, ash content, and moisture content. Additionally, slagging and fouling tendencies were minimized in the FBC units because of low combustion temperatures.
There are several types of fluid bed technology, as illustrated on Figure 2-1. Pressurized FBC is not currently being pursued and will not be discussed here. Atmospheric FBC (AFBC) is generally divided into two categories: bubbling and circulating. A typical AFBC is composed of fuel and bed material contained within a refractory lined, heat absorbing vessel. The composition of the bed during full load operation is typically in the range of 98 percent bed material and only 2 percent fuel. The bed becomes fluidized when air or other gas flows upward at a velocity sufficient to expand the bed. At low fluidizing velocities (3 to 10 ft/sec), relatively high solid densities are maintained in the bed, and only a small fraction of the solids are entrained from the bed. A fluid bed that is operated in this velocity range is referred to as a bubbling fluidized bed (BFB).
Figure 2-1. Fluidized Bed Technologies
Alternative Fluidized Bed Technologies
Pressurized Beds
Atmospheric Beds
BubblingBeds
CirculatingBeds

Holcomb Generation Expansion Project Coal Technology Selection Study
2.0 Conventional Coal Fired Technologies
August 24, 2006 2-4 © Black & Veatch 2006 Final Report All Rights Reserved
If the fluidizing velocity is increased, smaller particles are entrained in the gas stream and transported out of the bed. The bed surface, well-defined for a BFB combustor, becomes more diffuse and solids densities are reduced in the bed. A fluid bed that is operated at velocities in the range of 13 to 22 ft/sec is referred to as a circulating fluidized bed, or CFB. The CFB has better environmental characteristics and higher efficiency than BFB and is generally the AFBC technology of choice for fossil fuel applications greater than 50 MW.
The primary coal fired boiler alternative to a PC boiler is a CFB boiler. In a CFB unit, a portion of the combustion air is introduced through the bottom of the bed. The bed material normally consists of fuel, limestone (for sulfur capture), and ash. The bottom of the bed is supported by water-cooled membrane walls with specially designed air nozzles that distribute the air uniformly. The fuel and limestone are fed into the lower bed. In the presence of fluidizing air, the fuel and limestone quickly and uniformly mix under the turbulent environment and behave like a fluid. Carbon particles in the fuel are exposed to the combustion air. The balance of combustion air is introduced at the top of the lower, dense bed. Staged combustion and low combustion temperature limit the formation of thermal NOx. The bed fluidizing air velocity is greater than the terminal velocity of most of the particles in the bed and, thus, fluidizing air carries the particles through the combustion chamber to the particulate separators at the furnace exit. The captured solids, including any unburned carbon and unused calcium oxide (CaO), are re-injected directly back into the combustion chamber without passing through an external recirculation. This internal solids circulation provides longer residence time for fuel and limestone, resulting in good combustion and improved sulfur capture.
Commercial CFB units offer greater fuel diversity than PC units, operate at competitive efficiencies, and, when coupled with a polishing SO2 scrubber, operate with emissions below the current levels mandated by federal standards. As opposed to conventional PC technology that was first utilized in the 1920s, CFB is a commercially proven technology that has been in reliable electric utility service in the United States for only the past 20 years.
By the late 1980s, the transition had been made from small industrial sized boilers to several electrical utility reheat boilers in operation in a size range from 75 to 165 MW. Several reheat boilers up to 300 MW are currently in service, and boiler suppliers are offering boiler designs to provide steam generation sufficient to support up to 600 MW, with full commercial guarantees. Fuels for these applications range from petcoke and bituminous coal to high ash refuse from bituminous coal preparation and cleaning plants, and high moisture fuels such as lignite.

Holcomb Generation Expansion Project Coal Technology Selection Study
2.0 Conventional Coal Fired Technologies
August 24, 2006 2-5 © Black & Veatch 2006 Final Report All Rights Reserved
An environmentally attractive feature of CFB is that SO2 can be removed in the combustion process by adding limestone to the fluid bed. The CaO formed from the calcination of limestone reacts with SO2 to form calcium sulfate (CaSO4), which is removed from the flue gas with a conventional particulate removal device. CFB combustion temperature is controlled at approximately 1,600º F, compared to approximately 2,500 to 3,000º F for conventional PC boilers. Combustion at the lower temperature has several benefits. First, the lower temperature minimizes the sorbent (typically limestone) requirement, because the required calcium to sulfur (Ca/S) molar ratio for a given SO2 removal efficiency is minimized in this temperature range. Second, 1,550 to 1,600º F is well below the ash fusion temperatures of most fuels, so the fuel ash never reaches its softening or melting points. The slagging and fouling problems that are characteristic of PC units are significantly reduced, if not eliminated. Finally, the lower temperature reduces NOx emissions by nearly eliminating thermal NOx. Figure 2-2 illustrates the benefits of a lower combustion temperature for CFBs.
Figure 2-2. Environmental Benefits of CFB Technology

Holcomb Generation Expansion Project Coal Technology Selection Study
2.0 Conventional Coal Fired Technologies
August 24, 2006 2-6 © Black & Veatch 2006 Final Report All Rights Reserved
Since combustion temperatures are below ash fusion temperatures, the design of a CFB boiler is not as dependent on ash properties as is a conventional PC boiler. With proper design considerations, a CFB boiler can fire a wider range of fuels with less operating difficulty.
A typical CFB arrangement is illustrated schematically on Figure 2-3. In a CFB, primary air is introduced into the lower portion of the combustion chamber, where the heavy bed material is fluidized and retained. The upper portion of the combustor contains the less dense material that is entrained with the flue gas from the bed. Typically, secondary air is introduced at higher levels in the combustor to ensure complete combustion and to reduce NOx emissions. The combustion gas generated in the combustor flows upward with a considerable portion of the solids inventory entrained. These entrained solids are separated from the combustion gas in hot cyclone-type dust collectors or in mechanical particulate separators and are continuously returned to the combustion chamber by a recycle loop. The cyclone separator and recycle loop may include additional heat recovery surface to control bed temperature and steam temperature and to minimize refractory requirements.
Figure 2-3. Typical CFB Unit
Holcomb Generation Expansion Project Coal Technology Selection Study
2.0 Conventional Coal Fired Technologies
August 24, 2006 2-7 © Black & Veatch 2006 Final Report All Rights Reserved
The combustion chamber of a CFB unit generally consists of membrane-type welded waterwalls that provide most of the evaporative boiler surface. Heat transfer to evaporative surfaces is primarily convection and conduction from the bed material that contacts the evaporative wall surfaces or division panel surfaces located in the upper combustor. The lower third of the combustor is refractory lined to protect the waterwalls from erosion in the high velocity dense bed region.
The fuel size for a CFB boiler is much coarser than the pulverized fuel needed for suspension firing in a PC boiler. Compared to the typical 70 micron particle size for a PC unit, the typical fuel size for a CFB is approximately 5,000 microns. Especially for high ash fuels, the use of larger fuel sizing reduces auxiliary power and pulverizer maintenance requirements and eliminates the high cost of pulverizer installation.
Ash removal from the CFB boiler is from the bottom of the combustor and also from fly ash that is entrained in the flue gas stream, similar to PC boilers. With a CFB boiler, the ash split between bottom ash and fly ash is roughly 50 percent bed ash and 50 percent fly ash. All of the ash drains from CFB boilers are typically retained in a dry condition without the need for water impounded hoppers or water submerged conveyors that are typically utilized for PC boiler bottom ash collection and conveying.
2.3 PC Comparison with CFB The technical characteristics of the two competing boiler technologies were
addressed in the previous section. The characteristics listed in Table 2-1 are summarized in the following subsections.
2.3.1 Environmental Environmental impacts are categorized as flue gas emissions, solid waste
production, and water consumption: • Flue Gas Emissions--In the United States, PC and CFB technologies will be
required to meet similar emissions levels. • Solid Waste Production--Solid waste production for the two technologies will be
similar, except that the bottom ash from the PC boiler would be transported in a wetted condition because of the bottom ash collection technology that includes either water impounded bottom ash hoppers or submerged conveyors below the furnace bottom. Bed ash extraction from a CFB is a dry process, where the ash is collected in a granular form and cooled with a combination of fluidizing cooling air and water jacketed screw coolers. The quantity of sorbent required for sulfur removal will affect the relative volume of solid waste.
Holcomb Generation Expansion Project Coal Technology Selection Study
2.0 Conventional Coal Fired Technologies
August 24, 2006 2-8 © Black & Veatch 2006 Final Report All Rights Reserved
• Water Consumption--Water consumption for the two technologies would be essentially identical for boiler drum blowdown to maintain boiler water quality, but, when steam is used for soot blowing, the boiler water makeup requirements may be slightly higher because of the higher soot blowing steam demand of the PC boiler technology.
2.3.2 Operational Operational impacts are categorized as auxiliary power, maintenance, fuel
flexibility, startup, and load ramping: • Auxiliary Power--The power requirements of the primary air fans of the CFB
boiler provide the motive power to fluidize and to circulate the bed material. This is a higher power requirement than that of the primary air fans for a PC boiler application. Since CFB boilers do not need pulverizers, the power savings from this normally results in the auxiliary power requirements for the two boiler technologies being relatively similar, with the CFB generally being slightly higher.
• Maintenance--The major maintenance requirements of CFB boilers are refractory repairs caused by the erosive effects of the bed materials circulating through the boiler components. Initial CFB boiler applications experienced significant refractory maintenance requirements. Subsequent refractory system improvements, materials, and installation techniques have provided significant reductions in these maintenance requirements. The major maintenance requirements of PC boilers and their auxiliaries are often associated with pulverizers, soot blowers, and associated heat transfer surface damage caused by soot blower erosion in areas where excessive soot blowing is needed to prevent accumulation of agglomerating ash deposits. CFB boilers do not have pulverizers and have significantly fewer soot blowers, since the coal ash temperature is not elevated to the point where it becomes molten or agglomerating. The O&M costs of PC and CFB are similar.
• Fuel Flexibility--CFB boilers have the capability of superior fuel flexibility compared to PC boilers. Since the combustion temperature of CFB boilers is below the ash initial deformation temperature, the slagging and fouling characteristics of alternative fuels are not of concern. As long as the CFB boiler auxiliaries, such as fuel feed equipment and ash removal equipment, are provided with sufficient capacity, a wide range of fuel heating values and ash content can be utilized. The capacity of the sorbent feed equipment also needs to be designed for the range of fuel sulfur content that is expected to occur. Because of the long

Holcomb Generation Expansion Project Coal Technology Selection Study
2.0 Conventional Coal Fired Technologies
August 24, 2006 2-9 © Black & Veatch 2006 Final Report All Rights Reserved
fuel residence time in the CFB boiler combustion loop, a wide range of fuel volatile matter content can also be utilized. A CFB boiler can efficiently burn fuels in ranges of volatility well below those required in a PC boiler.
• Startup--Because of the large mass of bed material and larger quantity of refractory in a CFB boiler compared to a PC boiler, CFB boilers are somewhat less suited for numerous startups and cycling service than are PC boilers. The large mass of bed material results in significantly higher thermal inertia with a CFB boiler compared to a PC boiler. Startup from cold conditions can be extended for several hours. This higher thermal inertia can also result in unstable bed performance during periods of rapid load changes. Especially in the case where sorbent feed for flue gas desulfurization (FGD) is being optimized, baseload operation is preferred to enable consistent bed inventory and to ensure consistent desulfurization and sorbent utilization. CFB boilers have some advantage with hot and warm restarts, because the refractory and bed hold a significant amount of heat.
• Load Ramping--CFB boilers are generally capable of ramp rates of 2 to 3 percent per minute, but may be restricted to 1 to 2 percent per minute to control steam conditions, SO2 emissions, and limestone stoichiometry fluctuations. PC boilers are generally capable of ramp rates of 5 percent per minute.
2.3.3 Availability and Reliability Over the past 20 years that CFB boilers have been utilized for steam generation
for electric power generation, the availability and reliability have improved and are considered to be equivalent to PC boilers. Several improvements in the refractory system design, fuel and sorbent feed system design, and ash extraction equipment design have been made that adequately address the initial problems encountered with these system components. Since the CFB boiler systems do not have pulverizers, do not have multiple burner systems with a large number of moving or controlled components, and have significantly fewer soot blowers, many of the high maintenance components of conventional PC boilers are not found in CFB boilers.
2.3.4 Technology Maturity Though CFB boilers have been operating to provide steam for reheat turbine
electric power generation for more than 20 years, the steaming capacities have been limited to less than 150 MW in most cases. This size has recently increased to the point where there are several reheat boilers in service supporting electrical generation up to nearly 300 MW gross output. These units are currently in service or under construction

Holcomb Generation Expansion Project Coal Technology Selection Study
2.0 Conventional Coal Fired Technologies
August 24, 2006 2-10 © Black & Veatch 2006 Final Report All Rights Reserved
and are designed to burn the full range of solid fuels, including low volatile anthracite, petcoke, subbituminous coal, high volatile bituminous coal, and high moisture lignite. The largest unit currently under construction is in Italy; it is designed for an electrical output of 320 MW. CFB boiler manufacturers are currently proposing to supply units with capacities in excess of 400 MW electrical output. PC boilers have been installed and are operating with steaming capacities sufficient to support up to 1,300 MW of electrical generation. Because of economies of scale for PC boilers and their auxiliaries, PC boilers installed in recent years have been predominantly larger than 250 MW and have been designed to operate with supercritical steam pressure conditions and high steam temperatures to reduce fuel costs and flue gas emissions.
Table 2-1 compares PC and CFB across several different parameters.
Table 2-1. PC and CFB Boiler Comparison
Evaluation Parameter PC Boiler CFB Boiler Environmental NOx SCR Selective noncatalytic reduction
(SNCR) SO2 FGD Limestone injection and
polishing FGD Particulate Fabric filter Fabric filter Operation Auxiliary Power Base Slightly higher Maintenance Base Slightly higher Fuel Flexibility Within design coals Better Startup and Load Ramping Base, 5 percent per
minute 4 hours additional startup time,
2 to 3 percent per minute Availability and Reliability Base Same Technology Maturity Well established Recently constructed in
300 MW size Capital Costs Base Slightly higher Fixed O&M Costs Base Slightly higher Variable O&M (Nonfuel) Costs Base Typically slightly higher Net Plant Heat Rate (NPHR) Base Higher

Holcomb Generation Expansion Project Coal Technology Selection Study
2.0 Conventional Coal Fired Technologies
August 24, 2006 2-11 © Black & Veatch 2006 Final Report All Rights Reserved
2.4 CFB Experience in the United States The first utility-grade AFBC unit, which was constructed in Rivesville, West
Virginia, in 1976, was a 30 MW (electric) Foster Wheeler BFB unit. One of the first utility-grade CFB units was the Tri-State Nucla project, completed in 1987. This 110 MW unit from Foster Wheeler was a US Department of Energy (DOE) Clean Coal Demonstration Project. In the late 1980s and early to mid-1990s, a significant number of CFB units came on line. In the early 1990s, the industry began to view CFB as a mature technology. In recent years, several units in the 200 to 300 MW have been constructed, with more under development. The early US CFB units were predominantly fired on bituminous coals. Around 1995, the trend reversed, and almost all CFB units since that time have fired waste coals, lignites, or opportunity fuels such as petcoke and biomass. The field of international CFB vendors has consolidated to four dominant players: Alstom, Foster Wheeler, Lurgi, and Kvaerner Pulping. Alstom and Foster Wheeler have dominated the US and international markets for units above 150 MW. Lurgi does not actively market in the United States.
CFB units have been increasing in size over the last 15 years, with the largest operating CFB units at 300 MW (JEA Northside). The largest unit under construction is the ENEL Sulcis Unit in Sardinia, Italy. This Alstom unit is the equivalent of 340 MW, consisting of a 220 MW repowering of an existing unit and additional process steam requirements.
Three vendors, Alstom, Foster Wheeler, and Lurgi, have developed designs for single units in the 500 to 600 MW range. Alstom and Foster Wheeler have 600 MW designs, while Lurgi’s largest design is 500 MW.

Holcomb Generation Expansion Project Coal Technology Selection Study
3.0 IGCC Technologies and Industry Activity
August 24, 2006 3-1 © Black & Veatch 2006 Final Report All Rights Reserved
3.0 IGCC Technologies and Industry Activity
IGCC is a promising technology for coal-fueled generation, offering the potential for lower emissions than conventional coal-fueled generation technologies. Its capabilities to provide low emissions and co-produce hydrogen as well as power have led it to be considered as a core technology for the future in the US DOE Vision 21 program and the Electric Power Research Institute (EPRI) roadmap.
The technological and commercial maturity of IGCC is advancing, as evidenced by the changes in technology ownership and the commercial alliances announced over the past 2 years, which are expected to facilitate commercial offerings. These advances, along with both high prices and high price volatility for natural gas, have resulted in a heightened interest in IGCC.
In the near term, reliability is expected to be lower for an IGCC plant than for a PC or CFB plant with respect to producing electricity from coal. IGCC plants without spare gasifiers are expected to achieve long-term annual availabilities in the 80 to 85 percent range on coal versus approximately 90 percent for PC and CFB. IGCC availability on coal during initial startup and the first several years of operation is expected to be significantly lower. However, power generation availability can be increased by firing the CC on a backup fuel, when syngas is not available from coal gasification.
Cost, schedule, and plant availability issues cause IGCC projects to have higher financial risk than conventional PC or CFB power generation projects. Details regarding the guarantee levels for cost, schedule, and performance; the associated liquidated damages clauses and risk premium; and availability assurances are not well defined at this time. It is expected that definitions of acceptable arrangements for both the owners and contractors will evolve as projects are developed over the next few years.
3.1 Gasification Technologies and Suppliers Gasification is a mature technology with a history that dates back to the 1800s. The first patent was granted to Lurgi GmbH in Germany in 1887. By 1930, coal gasification had become widespread, and, in the 1940s, commercial coal gasification was used to provide “town” gas for streetlights in both Europe and the United States. Currently, there are four main types of gasifiers:
• Entrained flow • Fixed bed • Fluid bed • Transport bed

Holcomb Generation Expansion Project Coal Technology Selection Study
3.0 IGCC Technologies and Industry Activity
August 24, 2006 3-2 © Black & Veatch 2006 Final Report All Rights Reserved
The following list includes the most notable technology suppliers by type: • Entrained flow gasifiers:
– COP (E-Gas, formerly Global Energy, originally Dow-Destec). – GE (formerly ChevronTexaco, originally Texaco). – MHI. – Shell. – Siemens GSP (formerly Noell).
• Fixed bed (or moving bed) gasifiers: – BGL (slagging, Global Energy, formerly British Gas Lurgi). – Lurgi (dry bottom).
• Fluid bed gasifiers: – Carbona (formerly Tampella). – HTW (formerly High Temperature Winkler). – KRW. – Lurgi.
• Transport bed gasifiers: – Kellogg Brown and Root (KBR).
Entrained flow gasifiers have been operating on oil feedstock since the 1950s and on coal and petcoke feedstock since the 1980s. Entrained flow gasifiers operate at high pressure and high temperature, have very low fuel residence times, and have high capacities. Fixed bed gasifiers have operated on coal feedstock since the 1940s. Compared to entrained flow gasifiers, fixed bed gasifiers operate at lower pressure and temperature, have much longer fuel residence times, and lower capacity. Fluid bed gasifiers have operated on coal since the 1920s. Compared to entrained flow gasifiers, fluid bed gasifiers operate at lower pressure and temperature, use air instead of oxygen, have longer fuel residence times, and have lower capacities. Transport bed gasifiers have only recently been tested on a small scale. Compared to entrained flow gasifiers, transport gasifiers operate at lower pressure and temperature, use air instead of oxygen, have longer fuel residence times, and have lower capacities. Limestone is fed with coal to fluid bed and transport bed gasifiers for capturing sulfur as calcium sulfide (CaS), which is typically oxidized to CaSO4 for landfill disposal. Entrained flow and fixed bed gasifiers treat the syngas from gasification to remove sulfur-containing constituents as elemental sulfur or sulfuric acid (H2SO4), which can be sold. The ash from fluid bed, transport bed, and dry bottom fixed bed gasifiers is leachable and is typically landfilled. Entrained flow and slagging fixed bed gasifiers operate above the ash fusion temperature and produce a nonleachable slag that can be sold.

Holcomb Generation Expansion Project Coal Technology Selection Study
3.0 IGCC Technologies and Industry Activity
August 24, 2006 3-3 © Black & Veatch 2006 Final Report All Rights Reserved
Entrained flow and fixed bed gasifiers generally use high purity oxygen as the oxidant. Fluid bed and transport gasifiers use air. Since high purity oxygen does not contain the large concentration of nitrogen present in air, equipment size can be reduced commensurately. Higher gasifier operating pressures are also more economical for the smaller gas flow rates and equipment size associated with high purity oxygen use. Entrained flow gasifiers have higher operating temperatures and lower residence times than fluid and transport bed gasifiers. These conditions require the use of high purity oxygen for entrained flow gasifiers. An oxygen purity of 95 percent by volume is the optimum for entrained flow gasifiers producing syngas for CTG fuel. Oxygen purities of 98 percent or higher are required when the syngas is used to produce chemicals and liquid fuels. Entrained flow gasifiers are relatively new technologies compared to fluid bed and fixed bed gasifiers. Entrained flow gasifiers have been operating successfully on solid fuels since the mid-1980s to produce chemicals and, since the mid-1990s, to produce electricity in four 250 to 300 MW IGCC plants located in Europe (two units) and the United States (two units).
Transport bed gasification technology is a recent development that has not yet been demonstrated on a commercial scale. The Southern Company and KBR have been testing a 30 tpd air-blown transport reactor integrated gasification (TRIG) system at the US DOE-funded Power Systems Development Facility (PSDF) at Wilsonville, Alabama. TRIG employs KBR catalytic cracking technology, which has been used successfully for more than 50 years in the petroleum refining industry. On October 14, 2004, the US DOE awarded $235 million to the Southern Company and the Orlando Utilities Commission to build a 285 MW IGCC Plant at the Stanton Energy Center in Florida to demonstrate TRIG CC technology under the Clean Coal Power Initiative (CCPI) program. The total cost of this plant is estimated to be $557 million. The proposed plant will gasify subbituminous coal. Southern Company estimates that the plant heat rate will be 8,400 Btu/kWh (HHV coal). The demonstration plant is scheduled to start up in 2010. Results from this commercial-scale demonstration plant should determine whether TRIG technology will be competitive with entrained flow gasifier technology.
At this time, based upon their characteristics and level of development, entrained flow gasifiers are the best choice for high capacity gasification for power generation.

Holcomb Generation Expansion Project Coal Technology Selection Study
3.0 IGCC Technologies and Industry Activity
August 24, 2006 3-4 © Black & Veatch 2006 Final Report All Rights Reserved
3.2 Entrained Flow Gasification Process Description A commercially available IGCC process flow diagram is shown on Figure 3-1.
Figure 3-1. IGCC Process Flow Diagram
Gasification consists of partially oxidizing a carbon-containing feedstock (solid or liquid) at a high temperature (2,500 to 3,000° F) to produce a syngas consisting primarily of CO and hydrogen. A portion of the carbon is completely oxidized to CO2 to generate sufficient heat for the endothermic gasification reactions. (The CO2 proportion in the syngas from the gasifier ranges from 1 percent for the dry feed Shell gasifier to more than 15 percent for the slurry feed COP and GE gasifiers.) The gasifier operates in a reducing environment that converts most of the sulfur in the feed to hydrogen sulfide (H2S). A small amount of sulfur is converted to carbonyl sulfide (COS). Some sulfur remains in the ash, which is melted and then quenched to produce slag. Other minor syngas constituents include ammonia (NH3), hydrogen cyanide (HCN), hydrogen chloride (HCl), and entrained ash, which contains unconverted carbon. In IGCC applications, the gasifier pressure is typically 450 to 550 psig. This pressure is determined by the CTG syngas supply pressure requirements. GE gasifiers operate at higher pressures, up to 1,000 psig, and the excess syngas pressure is let down in an expander to produce additional power.

Holcomb Generation Expansion Project Coal Technology Selection Study
3.0 IGCC Technologies and Industry Activity
August 24, 2006 3-5 © Black & Veatch 2006 Final Report All Rights Reserved
A fluxant is fed with the coal to control the slag viscosity so that it will flow out of the gasifier. Fluxant addition is less than 2 percent of the coal feed. The fluxant can be limestone, PC boiler ash, or, in some cases, dirt. The required fluxant composition and proportion will vary with the coal feed composition. The gasification process operators must know the feed coal composition and make fluxant adjustments when the coal composition changes. Too little fluxant can allow excessive slag to accumulate in the gasifier, which could damage the refractory and eventually choke the gasifier. Too much fluxant can produce long cylindrical slag particles instead of small slag granules when the slag is quenched in the lockhopper. These long thin slag particles will plug up the slag lockhopper. Solid fuel feeds to the gasifier can be dry or slurried. Solid fuels slurried in water do not require the addition of steam for temperature moderation. While slurries typically use water, oil can also be used. Steam is added to the oxygen as a temperature moderator for dry solid feed gasifiers, solid feeds slurried in oil, and oil feed gasifiers.
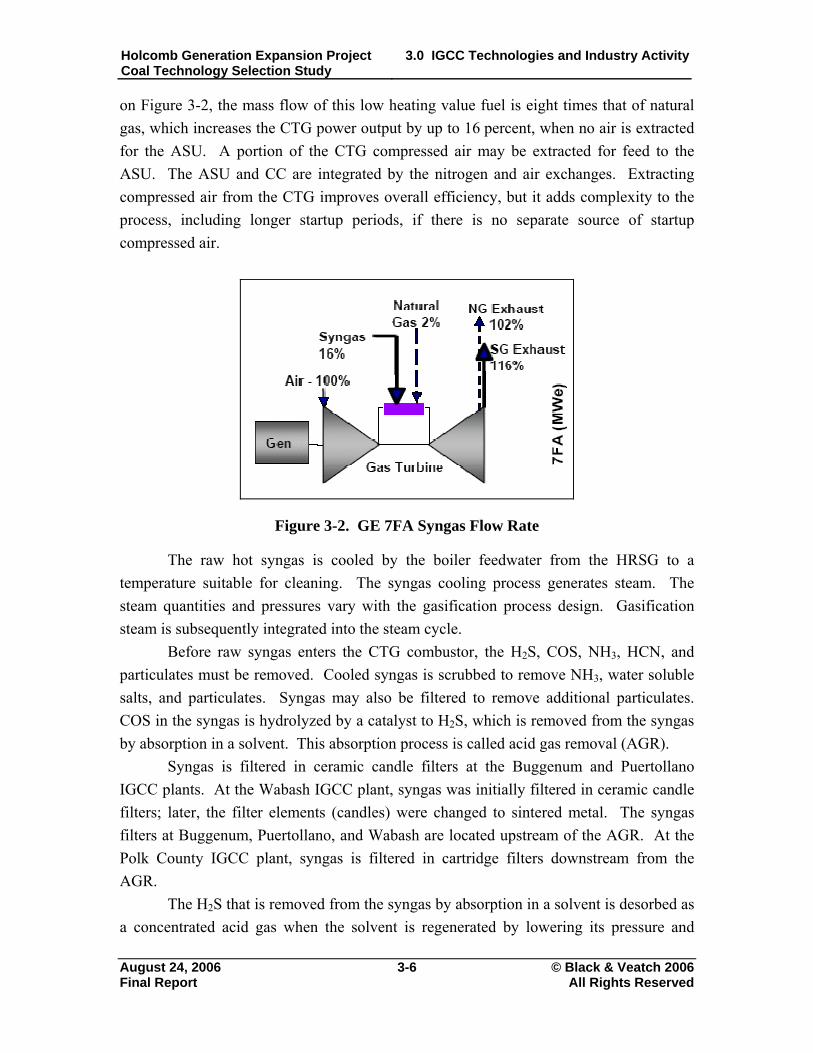
Entrained flow gasifiers use oxygen to produce syngas heating values in the range of 250 to 300 Btu/scf on an HHV basis. An oxygen concentration of 95 percent by volume is the economic optimum for IGCC plants using entrained flow gasifiers that only produce power. (Higher oxygen concentrations are optimum when most of the syngas is used to produce hydrogen.) Oxygen is produced cryogenically by compressing air, cooling and drying the air, removing CO2 from the air, chilling the feed air with product oxygen and nitrogen, reducing the air pressure to provide autorefrigeration and liquefy the air at -300° F, and separating the liquid oxygen and liquid nitrogen by distillation. Air compression consumes a significant amount of power, between 13 and 17 percent of the IGCC gross power output. Hydrogen in syngas prevents the use of dry low NOx (DLN) combustors in the CTGs. The dilution of the syngas to reduce flame temperature is required for NOx control. Syngas can be diluted by adding water vapor and/or nitrogen. Water vapor can be added to the syngas by evaporating water using low level heat. Nitrogen can be added by compressing excess nitrogen from the ASU and adding it to the syngas, either upstream of the CTG or by injection into the CTG. Syngas dilution for NOx control increases the mass flow through the CTG, which also increases power output. GE CTGs, as illustrated on Figure 3-2, inject this diluent nitrogen separately from the syngas into the same ports used for steam or water injection. For MHI and Siemens Power Generation (SPG, formerly known as Siemens Westinghouse or SW) CTGs, diluent nitrogen is premixed with the syngas. The nitrogen supply pressure required for injection into a GE 7FA is 330 psia versus 450 to 500 psia for mixing with the syngas for the MHI 501F and the SPG SGT6-5000F (previously referred to as the SW 501FD). As illustrated
Holcomb Generation Expansion Project Coal Technology Selection Study
3.0 IGCC Technologies and Industry Activity
August 24, 2006 3-6 © Black & Veatch 2006 Final Report All Rights Reserved
on Figure 3-2, the mass flow of this low heating value fuel is eight times that of natural gas, which increases the CTG power output by up to 16 percent, when no air is extracted for the ASU. A portion of the CTG compressed air may be extracted for feed to the ASU. The ASU and CC are integrated by the nitrogen and air exchanges. Extracting compressed air from the CTG improves overall efficiency, but it adds complexity to the process, including longer startup periods, if there is no separate source of startup compressed air.
Figure 3-2. GE 7FA Syngas Flow Rate
The raw hot syngas is cooled by the boiler feedwater from the HRSG to a temperature suitable for cleaning. The syngas cooling process generates steam. The steam quantities and pressures vary with the gasification process design. Gasification steam is subsequently integrated into the steam cycle. Before raw syngas enters the CTG combustor, the H2S, COS, NH3, HCN, and particulates must be removed. Cooled syngas is scrubbed to remove NH3, water soluble salts, and particulates. Syngas may also be filtered to remove additional particulates. COS in the syngas is hydrolyzed by a catalyst to H2S, which is removed from the syngas by absorption in a solvent. This absorption process is called acid gas removal (AGR).
Syngas is filtered in ceramic candle filters at the Buggenum and Puertollano IGCC plants. At the Wabash IGCC plant, syngas was initially filtered in ceramic candle filters; later, the filter elements (candles) were changed to sintered metal. The syngas filters at Buggenum, Puertollano, and Wabash are located upstream of the AGR. At the Polk County IGCC plant, syngas is filtered in cartridge filters downstream from the AGR. The H2S that is removed from the syngas by absorption in a solvent is desorbed as a concentrated acid gas when the solvent is regenerated by lowering its pressure and

Holcomb Generation Expansion Project Coal Technology Selection Study
3.0 IGCC Technologies and Industry Activity
August 24, 2006 3-7 © Black & Veatch 2006 Final Report All Rights Reserved
increasing its temperature. Descriptions of commercial AGR systems are provided in Section 3.9. The acid gas stream is converted to elemental sulfur in the Claus sulfur recovery process. The primary chemical reaction in the Claus process is the reaction of H2S and SO2 to produce elemental sulfur and water. This reaction requires a catalyst and is performed in two stages. The SO2 is produced by oxidizing (burning) one third of the H2S in the feed gas. External fuel is only needed to initially heat up the Claus thermal reactor and initiate combustion of the acid gas. Under normal operation, the oxidation of H2S provides sufficient heat to maintain the reaction. The sulfur is formed as a vapor. The S2 form of sulfur reacts with itself to produce S6 and S8, which are subsequently condensed. This condensed liquid sulfur is separated from the residual gas and stored in a pit at 275 to 300° F. As required, the liquid sulfur is pumped from the pit to railcars for shipment. Solid sulfur can be produced in blocks or pellets by cooling the liquid sulfur to ambient temperature. The residual (tail gas) is primarily CO2 and nitrogen, which are compressed and reinjected into the syngas upstream of the AGR.
3.3 Gasification Technology Suppliers Today, there are three major entrained flow coal gasification technology suppliers:
• COP, which licenses E-Gas technology that was developed by Dow. COP purchased this technology from Global Energy in August 2003.
• GE, which purchased Texaco gasification technology from ChevronTexaco in June 2004. GE offers both Quench and Radiant (high temperature heat recovery [HTHR]) cooler gasifiers.
• Shell, which developed its gasification technology in conjunction with Prenflo. Prenflo technology is no longer licensed.
The other entrained flow gasifiers listed in Section 3.1 are not currently strong competitors in the utility-scale IGCC market because of the relative maturity of the technology. MHI is developing an air-blown, two-stage entrained flow gasifier with dry feed. MHI is also working on a 250 MW demonstration project in Japan. Siemens has one small IGCC plant (Schwarze Pumpe). Its technology has been geared toward biomass and industrial processing on a smaller scale, but it seems to be making an entry into the utility-scale power generation market. Siemens has announced plans to build a 1,000 MW coal IGCC in Germany as a first step to commercializing its newly acquired IGCC technology. Multiple other GSP coal gasification projects are currently being implemented, including three in China. The COP and GE gasifiers are refractory lined with coal-water slurry feed. Shell and Krupp-Koppers jointly developed a waterwall type gasifier with dry, PC feed
Holcomb Generation Expansion Project Coal Technology Selection Study
3.0 IGCC Technologies and Industry Activity
August 24, 2006 3-8 © Black & Veatch 2006 Final Report All Rights Reserved
specifically for IGCC power generation in the late 1970s for a 150 long tons per day (ltpd) demonstration plant near Hamburg, West Germany. During the 1990s, Shell and Krupp-Koppers licensed their gasification technology separately. The Puertollano, Spain IGCC plant, which was built in the mid-1990s, uses Krupp-Kopper’s Prenflo gasification technology. In the late 1990s, Krupp-Koppers merged with Uhde; Uhde reached an agreement with Shell to license Shell gasification technology and no longer offer the Prenflo gasification process. Uhde has incorporated its Prenflo experience into Shell’s coal gasification process technology. Each of the three commercial entrained flow coal gasification technologies generates similar syngas products. All three gasifiers react the coal with oxygen at high pressure and high temperature to produce syngas consisting primarily of hydrogen and CO. The raw syngas from the gasifier also contains CO2, water, H2S, COS, NH3, HCN, and other trace impurities. The syngas exits the gasifier reactor at approximately 2,500 to 2,900° F. Each of the COP, GE, and Shell gasification processes cools the hot syngas from the gasifier reactor differently. In the COP process, the hot syngas is partially quenched with coal slurry, resulting in a second stage of coal gasification. The raw syngas from the COP gasifier may also contain methane and products of coal devolatilization and pyrolysis because of its two-stage gasification process. The partially quenched syngas is cooled with recycled syngas to solidify the molten fly slag and then further cooled to produce HP steam in a vertical shell and tube heat exchanger. (Syngas flow is down through the tubes. Boiler water and steam flow is up through the shell side.) Unconverted coal is filtered from the cooled syngas and recycled to the gasifier first stage. GE has two methods for cooling the hot syngas from the gasifier: radiant cooling to produce HP steam via HTHR and water quench followed by low-pressure (LP) steam generation. In the Shell process, hot syngas is cooled with recycled syngas to solidify the molten fly slag and then further cooled in a convective cooler to produce high temperature steam. The cooled, raw syngas is cleaned by various treatments, including filtration, scrubbing with water, catalytic conversion, and scrubbing with solvents, as discussed in Section 3.9. The clean syngas that is used as CTG fuel contains hydrogen, CO, CO2, water, and parts per million (ppm) concentrations of H2S and COS.
3.4 Gasifier Technology Selection Table 3-1 provides process design characteristic data for the COP, GE, and Shell gasification technologies for systems that would generally be considered for a facility of this size and type. The Shell gasification technology has the highest cold gas efficiency,

Holcomb Generation Expansion Project Coal Technology Selection Study
3.0 IGCC Technologies and Industry Activity
August 24, 2006 3-9 © Black & Veatch 2006 Final Report All Rights Reserved
because the gasifier feed coal is injected into the gasifier dry, whereas with the COP and GE gasifiers, the feed is a slurry of coal in water. However, the Shell dry feed coal gasification process has a higher capital cost. Cooling the hot syngas to produce HP steam also contributes to higher IGCC efficiency, but with a higher capital cost. Shell and COP generate HP steam from syngas cooling. GE offers both HP steam generation using radiant and convective syngas coolers and LP steam generation using its quench process, which has a significantly lower capital cost. The COP and GE gasifiers are refractory lined, while the Shell gasifier has an inner water tube wall (membrane). The refractory lined gasifiers have a lower capital cost, but the refractory requires frequent repair and replacement. The COP and GE gasifier burners typically require more frequent replacement than the Shell gasifier burners.
It is worth mentioning that gasifier sizing issues exist with respect to the Shell and GE Quench technologies. Shell has stated that its maximum gasifier capacity is 5,000 short tons per day (stpd) of dried coal, which is large enough to supply syngas to two GE 7FB or Siemens SGT6-5000F CTGs. GE offers gasifiers in three standard sizes: 750, 900, and 1,800 ft3. The largest quench gasifier that GE currently offers is the 900 ft3 size. The maximum capacity of this quench gasifier is less than 2,500 tpd of as-received coal and does not produce enough syngas for a GE 7FB or Siemens SGT6-5000F CTG. The largest radiant gasifier that GE currently offers is 1,800 ft3 and will supply sufficient syngas for a GE 7FB or Siemens SGT6-5000F CTG. COP currently offers a gasifier that will supply sufficient syngas for a GE 7FB or Siemens SGT6-5000F CTG.
Overall, energy conversion efficiencies for IGCC plants vary with the gasification technology type, system design, level of integration, and coal composition. The gasifier efficiency of converting the coal fuel value to the syngas fuel value, after sulfur removal, is known as the cold gas efficiency, which is generally expressed in HHV. The values for cold gas efficiency in Table 3-1 are indicative of the range of achievable performance for coal and petcoke. Cold gas efficiency for the Shell dry coal feed process is about 3 percent higher than the coal-water slurry feed gasification processes for low moisture coal. This difference increases with coal moisture content. HP steam generation from syngas cooling increases IGCC efficiency by about 2 percent over that of water quench.

Holcomb Generation Expansion Project Coal Technology Selection Study
3.0 IGCC Technologies and Industry Activity
August 24, 2006 3-10 © Black & Veatch 2006 Final Report All Rights Reserved
Table 3-1. Comparison of Key Gasifier Design Parameters
COP GE Quench GE Radiant Shell Gasifier Feed Type
Slurry Slurry Slurry Dry N2 Carrier
Gasifier Burners Two Stage: First Stage--Two horizontal burners Second Stage--One horizontal feed injector without O2
Single Stage--One vertical burner
Single Stage--One vertical burner
Single Stage--Four to eight horizontal burners
Gasifier Vessel Refractory lined Refractory lined
Refractory lined
Waterwall membrane
Syngas Quench Coal Slurry and Recycle Gas
Water None Recycle Gas
Syngas Heat Recovery
Firetube HP waste heat boiler (WHB)
Quench LP WHB
Radiant HP WHB
Watertube HP WHB
Coal Cold Gas Efficiency, HHV
71 to 80 percent 69 to 77 percent
69 to 77 percent
78 to 83 percent
Coal Flexibility Middle Low Low High Capacity, stpd 3,000 to 3,500 1,500 to 2,000 2,500 to 3,000 4,000 to 5,000
3.5 Commercial IGCC Experience There have been approximately 18 IGCC projects throughout the world, as listed in Table 3-2. Of these, 15 were based on entrained flow gasification technology. Nine of the projects were coal-based, two are petcoke-based, one is sludge-based, and the other six are oil-based. Two of the coal-based IGCC plants, Cool Water in California and the Dow Chemical Plaquemine Plant in Louisiana, were small demonstration projects and have been decommissioned. Another small coal IGCC demonstration project was Sierra Pacific’s Piñon Pine Project in Nevada. This project, based on KRW fluid bed technology, was not successful.
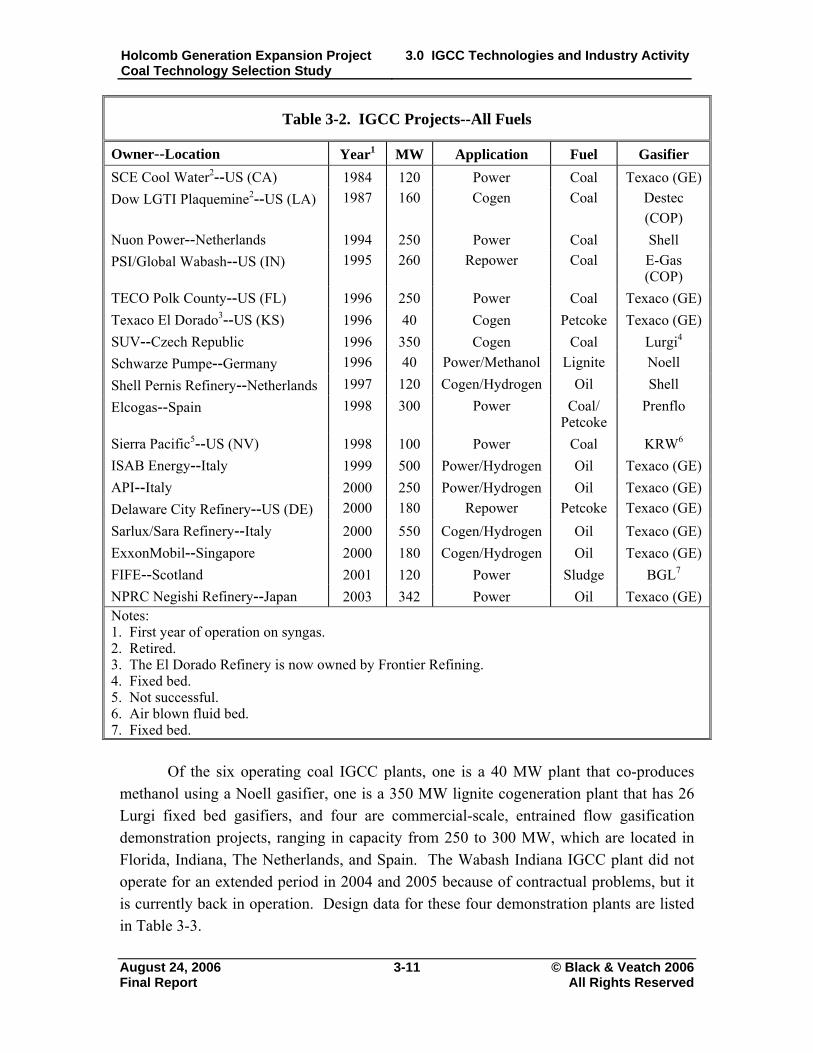
Holcomb Generation Expansion Project Coal Technology Selection Study
3.0 IGCC Technologies and Industry Activity
August 24, 2006 3-11 © Black & Veatch 2006 Final Report All Rights Reserved
Table 3-2. IGCC Projects--All Fuels
Owner--Location Year1 MW Application Fuel Gasifier SCE Cool Water2--US (CA) 1984 120 Power Coal Texaco (GE) Dow LGTI Plaquemine2--US (LA) 1987 160 Cogen Coal Destec
(COP) Nuon Power--Netherlands 1994 250 Power Coal Shell PSI/Global Wabash--US (IN) 1995 260 Repower Coal E-Gas
(COP) TECO Polk County--US (FL) 1996 250 Power Coal Texaco (GE) Texaco El Dorado3--US (KS) 1996 40 Cogen Petcoke Texaco (GE) SUV--Czech Republic 1996 350 Cogen Coal Lurgi4
Schwarze Pumpe--Germany 1996 40 Power/Methanol Lignite Noell Shell Pernis Refinery--Netherlands 1997 120 Cogen/Hydrogen Oil Shell Elcogas--Spain 1998 300 Power Coal/
Petcoke Prenflo
Sierra Pacific5--US (NV) 1998 100 Power Coal KRW6 ISAB Energy--Italy 1999 500 Power/Hydrogen Oil Texaco (GE) API--Italy 2000 250 Power/Hydrogen Oil Texaco (GE) Delaware City Refinery--US (DE) 2000 180 Repower Petcoke Texaco (GE) Sarlux/Sara Refinery--Italy 2000 550 Cogen/Hydrogen Oil Texaco (GE) ExxonMobil--Singapore 2000 180 Cogen/Hydrogen Oil Texaco (GE) FIFE--Scotland 2001 120 Power Sludge BGL7
NPRC Negishi Refinery--Japan 2003 342 Power Oil Texaco (GE) Notes: 1. First year of operation on syngas. 2. Retired. 3. The El Dorado Refinery is now owned by Frontier Refining. 4. Fixed bed. 5. Not successful. 6. Air blown fluid bed. 7. Fixed bed.
Of the six operating coal IGCC plants, one is a 40 MW plant that co-produces
methanol using a Noell gasifier, one is a 350 MW lignite cogeneration plant that has 26 Lurgi fixed bed gasifiers, and four are commercial-scale, entrained flow gasification demonstration projects, ranging in capacity from 250 to 300 MW, which are located in Florida, Indiana, The Netherlands, and Spain. The Wabash Indiana IGCC plant did not operate for an extended period in 2004 and 2005 because of contractual problems, but it is currently back in operation. Design data for these four demonstration plants are listed in Table 3-3.

Holcomb Generation Expansion Project Coal Technology Selection Study
3.0 IGCC Technologies and Industry Activity
August 24, 2006 3-12 © Black & Veatch 2006 Final Report All Rights Reserved
Table 3-3. Coal-Based IGCC Demonstration Plants1
Project Nuon Power Wabash TECO Polk County Elcogas
Location Buggenum, Netherlands Indiana Florida Puertollano, Spain
Technology Shell E-Gas (COP) Texaco (GE) Prenflo (Krupp)
Startup Year 1994 1995 1996 1998 Net Output, design, MW 252 262 250 300 LHV Efficiency, net design, % 43.1 39.2 41.2 42.2 Height, ft 246 180 295 262 Fuel, design Coal Coal Coal 50% coal/ 50% petcoke Fuel Consumption, tpd 2,000 2,200 2,200 2,600 Fuel Feed Dry N2 lock hopper Wet slurry Wet slurry Dry N2 lock hopper Syngas HHV, Btu/scf 300 276 266 281 CTG Model Siemens V94.2 GE 7FA GE 7FA Siemens V94.3
Firing temperature, °F 2,012 2,300 2,300 2,300 Combustors Twin vertical silos Multiple cans Multiple cans Twin horizontal silos
CTG Output, design, MW 155 192 192 200 STG Output, design, MW 128 105 121 135 Auxiliary Power, design, MW 31 35.4 63 35 Net Output, design, MW 252 262 250 300 Net Output, achieved, MW 252 252 250 300 NPHR, design, Btu/kWh HHV 8,240 9,030 8,600 8,230 NPHR, achieved, Btu/kWh HHV 8,240 8,600 9,100 8,230
1 Information taken from “Operating experience and improvement opportunities for coal-based IGCC plants,” Holt, Neville from Science Reviews – Materials at High Temperatures, Spring 2003.

Holcomb Generation Expansion Project Coal Technology Selection Study
3.0 IGCC Technologies and Industry Activity
August 24, 2006 3-13 © Black & Veatch 2006 Final Report All Rights Reserved
Table 3-3 (Continued). Coal-Based IGCC Demonstration Plants
Project Nuon Power Wabash TECO Polk County Elcogas
Location Buggenum, Netherlands Indiana Florida Puertollano, Spain
Technology Shell E-Gas (COP) Texaco (GE) Prenflo (Krupp)
NPHR Note -- Adjusted for HRSG feedwater heaters
Adjusted for gas/gas heat exchanger
--
ASU Pressure, psi 145 72.5 145 145
Nitrogen Usage Syngas saturator Vented CTG NOx control Syngas saturator NOx Control Saturation and N2
dilution Saturation + steam injection
N2 dilution to
combustors Saturation and N2 dilution
NOx, 6% O2, mg/Nm3 25 100-125 100-125 150 Slag Removal Lock-hopper Continuous Lock-hopper Lock-hopper Recycle Gas Quench 50% of gas, to 1,650° F Some in second stage None 67% of gas, to 1,475° F Integration
Water/steam Yes Yes Yes Yes N2 Side ASU/CTG Yes No Yes Yes Air Side ASU/CTG Yes No No Yes Add Air Compressor Yes Yes Yes No
Gas Cleanup Particulate Removal Cyclone/ceramic candle
filter Sintered metal candle filter
Water wash Ceramic candle filter
Chloride Removal Water scrubbing Water scrubbing Water scrubbing Water scrubbing COS Hydrolysis Yes Yes Retrofit in 1999 Yes AGR Process Sulfinol MDEA MDEA MDEA Sulfur Recovery Claus + SCOT TGR Claus + Tail Gas Recycle H2SO4 Plant Claus + Tail Gas Recycle SO2, 6% O2, mg/Nm3 35 40 40 25

Holcomb Generation Expansion Project Coal Technology Selection Study
3.0 IGCC Technologies and Industry Activity
August 24, 2006 3-14 © Black & Veatch 2006 Final Report All Rights Reserved
Each of the four projects was a government-subsidized IGCC demonstration, two in the United States and two in Europe. Each of these IGCC plants consists of a single train (one ASU, one gasifier, one gas treating train, and one CC consisting of one CTG, one HRSG, and one STG). Wabash has a spare gasifier. Each plant experienced numerous problems during its first years of operation, as discussed further in Section 5.0.
Table 3-3 also summarizes the integration in each plant. Basically, there are three major areas for potential integration:
• Water and steam between the power generation area and the gasification island. High- and low-level heat rejection from the gasification process is utilized to produce CC power.
• The nitrogen side of the ASU and CTG. Waste nitrogen is mixed with the syngas to reduce NOx formation and to increase power output.
• The air side of the ASU and the CTG. Air is extracted from the CTG compressor to reduce the auxiliary power and increase efficiency.
Figure 3-3 depicts potential areas of integration. The European plants have been highly integrated, partly in response to higher fuel prices, while the US plants have been less integrated. Both the Nuon Power Buggenum, Netherlands plant and the Elcogas Puertollano, Spain plant experienced operating difficulties as a result of the highly integrated design; however, most of these issues have been resolved.
Figure 3-3. Potential Areas for Integration

Holcomb Generation Expansion Project Coal Technology Selection Study
3.0 IGCC Technologies and Industry Activity
August 24, 2006 3-15 © Black & Veatch 2006 Final Report All Rights Reserved
The operation of these four commercial coal-fueled IGCC plants has adequately demonstrated capacity, efficiency, and environmental performance, but uncertainty remains regarding availability, reliability, and cost. The complexity and relative immaturity of the IGCC process increases opportunities for deficiencies in design, vendor-supplied equipment, construction, operation, and maintenance. The high risks of capital cost overruns and low availability in the first few years of operation have presented obstacles to the development of nonsubsidized coal-fueled IGCC projects. At present, there are several coal-based IGCC projects being developed in the United States that expect to receive subsidies; however, no coal-fueled IGCC projects are currently under construction. These projects are discussed in Section 3.9.
3.6 Effect of Fuel Characteristics on Gasifier Selection There are three general coal feedstocks typically considered for IGCC projects: Pittsburgh No. 8, Illinois No. 6, and PRB. Petcoke is a fourth solid fuel feedstock that is frequently considered for IGCC applications. Petcoke is a lower cost fuel, but it is not as readily obtainable as coal. Historically, anthracite and lignite coals have not been seriously evaluated for IGCC projects, nor have waste coals such as gob (coal mine waste) and culm (waste produced when anthracite is mined and prepared for market, primarily rock and some coal). Coal-based operating experience has been focused almost exclusively on bituminous coals (e.g., Pittsburgh No. 8 and Illinois No. 6), and there is also extensive experience with petcoke. Subbituminous (i.e., PRB) coals have been tested only in a limited fashion, but due to the nature of the US coal market and the abundance of PRB coal, there is strong interest in using it for IGCC applications. It has been determined that PRB will be the coal fuel for the Holcomb project. Typical design values for the primary coals are listed in Table 3-4. The specifications for PRB coal in Table 3-4 are intended to be representative of Campbell County, Wyoming coal resources.
Table 3-4. As-Received Coal Properties of Typical Coals
Coal Type Characteristics Pittsburgh No. 8 Illinois No. 6 PRB Heat Content, Btu/lb (HHV) 12,300 10,200 8,400 Moisture, percent 8.0 14.1 29.4 Ash, percent 12.0 15.7 6.0 Sulfur, percent 4.0 4.3 0.34

Holcomb Generation Expansion Project Coal Technology Selection Study
3.0 IGCC Technologies and Industry Activity
August 24, 2006 3-16 © Black & Veatch 2006 Final Report All Rights Reserved
The high moisture content in PRB coal is reduced to 2 to 5 percent (by weight) during milling/drying in the Shell gasification process so that there is minimal impact on gasifier performance. The mill is swept with hot nitrogen or flue gas from combusted syngas. The dried, pulverized coal is separated from the wet gas and conveyed with dry nitrogen to an elevated silo; then it is sent to a lockhopper, where it is pressurized above the gasifier operating pressure and sent to a feed bin; and, finally, it is sent to the gasifier. After drying, the coal is kept under a nitrogen atmosphere to prevent fires until it is inside the gasifier.
In the COP and GE gasification processes, the high inherent moisture in PRB coal approximately doubles the total water content in the coal slurry per pound of dry coal to the gasifier. Vaporizing all of this water requires the combustion of more than 10 percent of the carbon in the coal to CO2, which reduces gasifier efficiency. In the COP gasification process, a portion of the coal slurry is injected into the hot raw gas from the first stage, where the coal is partially oxidized. This second-stage quench partially gasifies the injected coal. The unreacted, dry coal is filtered out of the gas and recycled to the first stage. This dry recycle step improves gasifier efficiency for PRB coal relative to the GE gasification process, but the COP gasification process is much less efficient and more expensive than the Shell gasification process for PRB coal.
In the GE gasification process, all of the inherent water in the coal and the liquid water in the slurry must be evaporated in the gasifier by combusting more CO to CO2, which results in a lower cold gas efficiency than the COP and Shell gasification processes. Therefore, the GE gasification process has not been considered economical for PRB coal. A Shell gasifier can operate on any of the three general coal feedstocks. One design option is to size the syngas production components according to the worst-case fuel properties. This will result in additional capital cost, but will allow the plant to achieve the same net plant output on syngas when operating on any of the fuels. A second option is to minimize the capital expense; some examples of this include designing for a Pittsburgh No. 8 fuel and either derating if other fuels are used or co-firing natural gas with the syngas.
3.7 IGCC Performance and Emissions Considerations IGCC net power output decreases with increasing ambient temperature, but this reduction is less than that of a natural gas combined cycle (NGCC) plant. The reduction in CTG air compressor capacity resulting from increased ambient temperature can be compensated for by increased nitrogen injection, which results in constant CTG power output, but increased auxiliary power consumption. Plant auxiliary power consumption

Holcomb Generation Expansion Project Coal Technology Selection Study
3.0 IGCC Technologies and Industry Activity
August 24, 2006 3-17 © Black & Veatch 2006 Final Report All Rights Reserved
also increases slightly with the ambient temperature for ASU air compression and cooling tower fans. The CO and NOx emissions estimates are based on CTGs firing syngas with nitrogen dilution, but without SCR or CO oxidation catalyst in the HRSG. Space will be allowed for addition of the SCR and CO oxidation catalysts in the future. The CO and NOx emissions estimates are listed below:
• 25 ppmvd CO in the CTG exhaust gas. • 15 ppmvd NOx (at 15 percent by volume O2) in the CTG exhaust gas.
The SO2 emissions estimate was based on a 25 ppm molar concentration of sulfur as H2S and COS in the syngas. Sulfur removal efficiencies of greater than 99 percent are achievable for an IGCC plant processing high sulfur coal or petcoke. During normal operation, a coal-fueled IGCC plant will have air emissions approaching those of an NGCC plant. Flaring during startups, shutdowns, and upsets can result in significant SO2 emissions; however, the entrained flow gasification technologies under consideration can be started up and shut down without sour gas flaring under normal conditions. Sour gas flaring during upsets cannot be eliminated, but can be minimized by appropriate process design and operating procedures. Syngas will flow through sulfur impregnated carbon, which is estimated to lower the syngas mercury concentration below 5 ppb by weight. Up to 40 percent of the mercury in the coal may be removed upstream of the sulfur impregnated carbon by scrubbing, which would reduce the mercury concentration to the inlet of the sulfur impregnated carbon to 30 to 42 ppb by weight. Eastman Chemical Company’s coal gasification plant has used sulfur impregnated carbon beds for mercury removal since its startup in 1993. Eastman reports 90 to 95 percent mercury removal with a bed life of 18 to 24 months.
3.8 Gasification Wastewater Treatment There are two general categories of plant wastewater: • Streams that contain metals from the as-received coal, referred to as
gasification wastewater streams. • Streams that do not contain these metals, referred to as balance-of-plant
wastewater streams. The gasification wastewater streams will be combined and treated separately from
the balance-of-plant wastewater streams. Accurate specification of the process wastewater composition has been a problem on other operating gasification plants because of the wide variation in coal composition. The wastewater treatment design should accommodate variation in wastewater composition.

Holcomb Generation Expansion Project Coal Technology Selection Study
3.0 IGCC Technologies and Industry Activity
August 24, 2006 3-18 © Black & Veatch 2006 Final Report All Rights Reserved
There are three basic options for treating gasification wastewater streams: • The open discharge concept, which consists of metals precipitation, followed
by biological treatment to produce an effluent suitable for discharge. • The zero liquid discharge (ZLD) concept, which consists of lime softening,
followed by evaporation and crystallization to produce a solid salt for landfill disposal.
• Discharge to a municipal sewage treatment facility or other receiving stream. This option is generally considered impractical because the coal gasification wastewater exceeds typical pretreatment limitations.
Biological treatment of the gasification wastewater can be problematic because the diverse contaminants are believed to be sufficiently variable so that the operation would be unreliable, which could result in violations of expected permit requirements. The open discharge system would cost approximately the same as the ZLD option and is not a proven technology in this application. The operating costs are equivalent between the ZLD and open discharge systems. However, ZLD requires additional LP steam that could otherwise be used to generate an additional 2 to 5 MW of electricity.
3.9 Acid Gas Removal Technology Sulfur in coal is converted to H2S and COS during gasification. The molar ratio
of H2S to COS in the raw syngas from the gasifier varies according to the gasifier type, from approximately 13 to 1 for the Shell gasifier to approximately 26 to 1 for the COP and GE gasifiers. The resulting syngas is treated to meet CTG fuel and air emissions permit requirements. The requirement is for total sulfur in the clean syngas to be less than 25 ppm by weight, which is equivalent to 15 ppm by mole of COS and H2S.
The two primary solvents considered for IGCC AGR are Selexol and methyl diethanol amine (MDEA). Selexol solvent is a mixture of dimethyl ethers of polyethylene glycol, CH3(CH2CH2O)nCH3, where n is between 3 and 9. UOP licenses Selexol technology for treating syngas from gasification. Selexol is a physical solvent. Its capacity to absorb sulfur compounds (including H2S) and to absorb CO2 increases with increasing pressure and decreasing temperature.
MDEA (HOC2H4)2NCH3 is a chemical solvent, specifically a selective amine used to remove H2S, while leaving most of the CO2 in the syngas. MDEA forms a chemical bond with H2S and CO2. MDEA’s performance is nearly independent of operating pressure. Typical absorber operating temperatures with amines are between 80 and 120° F. Lower absorber operating temperatures increase both H2S solubility and selectivity over CO2.

Holcomb Generation Expansion Project Coal Technology Selection Study
3.0 IGCC Technologies and Industry Activity
August 24, 2006 3-19 © Black & Veatch 2006 Final Report All Rights Reserved
The higher absorber operating pressures and higher syngas CO2 concentrations for the COP and GE gasification processes favor the use of Selexol, while MDEA is generally favored for the Shell gasification process.
3.10 Equivalent Availability In the near term, an IGCC plant is not expected to be as reliable as a PC or CFB plant with respect to producing electricity from coal. IGCC plants without spare gasifiers are expected to achieve long-term annual equivalent availabilities in the 80 to 85 percent range versus approximately 90 percent for PC and CFB plants. Based on past experience, IGCC availability during initial startup and the first several years of operation is expected to be significantly lower than the long-term targets. This can be mitigated by firing the CTGs with backup fuel (such as natural gas or low sulfur fuel oil). The equivalent availability of the CC portion of an IGCC plant is expected to be above 90 percent. The equivalent availability of an IGCC plant can be increased by providing a spare gasifier. Spare gasifier economics depend on the gasifier technology, cost of backup fuel, and plant dispatch economics. The next generation of coal-fueled IGCC plants should take advantage of the lessons learned from existing operating plants, but significant startup problems should be expected.
3.10.1 First Generation IGCC Plants Solids-related problems (erosion, pluggage, unstable flows, and syngas cooler tube leaks) caused significant gasification downtime for all four of the coal-based IGCC plants. Gasifier burner and refractory maintenance also resulted in significant downtime for the COP and GE gasifiers. For the Buggenum and Puertollano plants, CTG problems related to syngas combustion and startup air extraction were significant. Since the problems were identified, plant modifications and O&M improvements have greatly improved performance; these plants now produce electricity at design rates and close to design efficiencies. Estimated annual equivalent availabilities for producing electricity from coal (syngas operation) are listed in Table 3-5 for all four of the coal-based IGCC plants discussed in Section 3.5. These equivalent availabilities are for electricity production from coal or petcoke; power generation from firing the CTG on backup fuel is excluded. Gasification process availability for each of these plants was poor during the first several years of operation and continues to be a problem. The complexity and relative technological immaturity of large-scale commercial gasification processes increase opportunities for deficiencies in design, vendor-supplied equipment, construction, and O&M. During the first several years of plant operation, most of these deficiencies were corrected, and the plant staff has optimized the plant O&M as they have “moved up the

Holcomb Generation Expansion Project Coal Technology Selection Study
3.0 IGCC Technologies and Industry Activity
August 24, 2006 3-20 © Black & Veatch 2006 Final Report All Rights Reserved
gasification learning curve.” Design improvements are expected to be introduced on future IGCC plants, which should improve equivalent availability.
Table 3-5. Coal/Coke Fueled IGCC Plant Equivalent Availabilities
IGCC Plant Nuon Global TECO ElcogasLocation Buggenum, Wabash, Polk County, Puertollano,
Netherlands Indiana Florida Spain Gasifier Shell COP E-Gas GE HTHR Prenflo
Net Output 252 MW 262 MW 250 MW 300 MW Startup Year 1994 1995 1996 1998
Year after Startup IGCC Equivalent Availability (percent) 1 23 20 35 16 2 29 43 67 38 3 50 60 60 59 4 60 40 75 62 5 61 70 69 66 6 60 69 74 58 7 57 75 68 NA 8 67 78 81 9 73 -- 82 10 78 -- 11 NA
Note: 1. Data is based upon available information. Data reporting methodology varies somewhat between the
plants. 2. Wabash Years 5-8 IGCC equivalent availability is estimated as 95 percent of reported syngas
availability. 3. Wabash availability excludes periods when the plant was shut down because of no product demand
(24 percent in Year 7 [2002] and 16 percent in Year 8 [2003], shutdown in Year 9 [2004], and Year 10 [2005]).
3.10.2 Second Generation IGCC Plants The next, or second, generation of entrained flow gasification IGCC plants is
expected to have improved availability compared to the first generation plants. The assumed long-term IGCC unit equivalent availability is 80 to 85 percent for Shell technology without a spare gasifier. If additional coal-fueled equivalent availability is critical to the project, the GE Quench technology with a spare gasifier is expected to provide long-term availability (from 85 to 90 percent). Selecting the GE technology

Holcomb Generation Expansion Project Coal Technology Selection Study
3.0 IGCC Technologies and Industry Activity
August 24, 2006 3-21 © Black & Veatch 2006 Final Report All Rights Reserved
would potentially eliminate PRB as a viable fuel option, although GE is working to address this issue. Table 3-6 contains a projection of IGCC equivalent availabilities for the Shell case without a spare. Experience gained from existing operating coal IGCC plants was used to formulate these projections.
Table 3-6. Estimated Equivalent Availabilities for Shell IGCC Without Spare
IGCC Equivalent Availability (percent) Year after Startup Low High
1 40 to 70 2 50 to 75 3 60 to 80 4 70 to 83
5 and following 80 to 85 Gasifiers with the water quench process have lower capital costs than gasifiers
with HTHR. It is not practical to operate with a hot spare for gasifiers that use HTHR, because the HTHR requires a shutdown to switch gasifiers. Long-term IGCC unit forced outage rates are expected to range from 10 to 15 percent without a spare gasifier and from 5 to 10 percent with a hot spare gasifier. The CTG(s) can operate on backup fuel when syngas is not available. The CC availability is expected to exceed 90 percent. It appears that the prevailing sentiment in the gasification community is that the economics of a spare gasifier will be difficult to justify in most power generation applications. For many utilities, there is reduced power demand in the spring and/or fall of the year that would allow for annual planned outages. Because there are three gasifier/CTG trains, these would not typically be full plant outages, but would reduce the available output from the plant by one third for an extended time. Full plant planned outages would be required approximately every 6 years for steam turbine maintenance, similar to that required for a PC or CFB plant. The annual planned outages are a contributing factor to the lower expected equivalent availability of an IGCC plant compared to a PC or CFB plant.
3.11 Other Commercial Entrained Bed Gasification Experience GE water quench type gasifiers have been in commercial operation on coal or petcoke since 1983, producing syngas for chemical production. Two plants of note are the Eastman Chemical Plant in Kingsport, Tennessee, and the Ube Ammonia Plant in Japan. The syngas from these two plants is used to produce acetyl chemicals and

Holcomb Generation Expansion Project Coal Technology Selection Study
3.0 IGCC Technologies and Industry Activity
August 24, 2006 3-22 © Black & Veatch 2006 Final Report All Rights Reserved
ammonia, respectively. Kingsport has two gasifiers; one is normally operated and the other is a spare. Ube has four gasifiers; three are normally operated and one is a spare. Ube originally gasified crude oil, then switched to refinery residuals, then to coal, and has been gasifying a total of 1,650 tpd of petcoke since 1996. At Kingsport and Ube, an average syngas availability of 98 percent is achieved by rapid switchover to the spare gasifier, which is on hot standby, and the high level of resources (e.g., O&M) applied to the gasification process. The Eastman Kingsport plant has occasionally been referred to as an IGCC plant. This is incorrect because it produces no power; the Eastman plant produces syngas for chemical production, with no power generation. The economics of chemical production at the Eastman facility are different from the economics of the power market. As such, a fully redundant gasifier is warranted at the Eastman facility. Eastman has made gasification one of its focus areas, as evidenced by its formation of the Eastman Gasification Services Company.
3.12 Current Announced Electric Generation Industry Activity Major industry participants, such as AEP and Cinergy, are considering
implementing IGCC projects. In addition, numerous smaller companies are pursuing gasification projects using state and federal grants. Two coal-fueled IGCC projects are currently under construction worldwide. Foundations for fuel storage buildings are being built to supply the proposed 600 MW Global Energy plant in Lima, Ohio. Construction of the main plant is scheduled to begin soon. MHI is building a 250 MW demonstration plant for its air-blown IGCC technology in Japan. Startup of this plant is schedule for 2007, with the completion of the demonstration period by March 2010.
The eight projects described below were selected because of their perceived stage of development and their applicability to IGCC projects. The data contained in the descriptions comes from publicly available sources. There is generally not enough data to describe the scope of work associated with the cost estimates provided, nor to compare them with costs presented in this study.
3.12.1 American Electric Power Company On August 31, 2004, AEP announced that it would build at least one baseload
IGCC facility. AEP is the nation’s largest electricity generator and owns more than 36,000 MW of generating capacity. Coal and lignite provide approximately 27,000 MW of this capacity. AEP’s Ohio operating company filed for cost recovery March 18, 2005, with the Public Utilities Commission of Ohio (PUCO) to build an IGCC plant in Meigs County, Ohio. AEP also has filed with the West Virginia Public Service Commission for

Holcomb Generation Expansion Project Coal Technology Selection Study
3.0 IGCC Technologies and Industry Activity
August 24, 2006 3-23 © Black & Veatch 2006 Final Report All Rights Reserved
approval of cost recovery for an IGCC plant adjacent to its Mountaineer Plant in New Haven, West Virginia. The company has identified a third potential site for an IGCC plant in Lewis County, Kentucky.
On September 29, 2005, AEP announced that it had signed an agreement with GE Energy and Bechtel Corporation to develop the front end engineering design (FEED) for a new, coal fired, electric generating plant in Meigs County, Ohio that would employ an IGCC design. AEP expects that this preliminary engineering phase for the 600 MW plant will require 10 to 12 months. The proposed plant will have two gasifiers using the GE entrained flow gasification process with two GE CTGs and a steam turbine. It will be fueled by Eastern coal and will use AEP coal-delivery infrastructure already in place. Transmission interconnection studies are under way for the three proposed sites.
On April 10, 2006, PUCO approved AEP’s request to recover preconstruction costs, estimated to be $23.7 million, associated with the IGCC facility. Phase One cost recovery will include costs related to the company’s preconstruction costs or the costs incurred prior to AEP entering into an EPC contract. PUCO found that the costs of the IGCC plant are costs that AEP will incur to assist the company in meeting its “provider of last resort obligation” to all consumers in its certified territory. The expected cost of the 600 MW IGCC has been estimated as $1.033 billion.
On May 31, 2006, AEP’s Southwestern Electric Power Company (SWEPCO) proposed plans to build a new baseload coal- or lignite-fueled plant by 2011 to meet the long-term generation needs of its customers. Two potential sites are being considered for the new coal- or lignite-fueled plant: the company’s Henry W. Pirkey Power Plant in Hallsville, Texas, and a site near Fulton in Hempstead County, Arkansas, near Texarkana. SWEPCO is considering IGCC and ultra-supercritical PC.
On August 17, 2006, AEP announced that it had signed a second agreement with GE Energy and Bechtel Corporation to proceed with the FEED for the proposed, 630 MW IGCC plant in Mason County, West Virginia, located next to the existing Mountaineer power plant. The FEED process for the West Virginia project is expected to conclude in mid-December 2006.
3.12.2 Duke Energy (Cinergy/PSI and Vectren) On October 26, 2004, PSI Energy, Cinergy’s Indiana subsidiary, signed a letter of
intent with GE and Bechtel Corporation to study the feasibility of an IGCC plant. This letter of intent was the first step toward reaching a contract to design and construct the plant. This plant was the first one announced under the GE/Bechtel alliance.
On September 21, 2005, Vectren Corp. and Cinergy/PSI announced that they will work together on plans for a clean coal power plant that would generate about 600 MW

Holcomb Generation Expansion Project Coal Technology Selection Study
3.0 IGCC Technologies and Industry Activity
August 24, 2006 3-24 © Black & Veatch 2006 Final Report All Rights Reserved
of electrical capacity. Cinergy and Vectren say they are looking at several sites in Indiana, but the preferred site is PSI’s 160 MW Edwardsport coal fired generating plant near Vincennes.
On March 10, 2006, Cinergy and Duke Energy merged under and retained the Duke Energy name. On March 22, 2006, an agreement was signed with GE and Bechtel to begin a FEED, which is expected to take 12 months to complete. The estimated cost of the project has been reported to be in the range of $900 million.
3.12.3 Excelsior Energy, Inc. On June 10, 2004, COP and Excelsior Energy, Inc., signed a development and
technology licensing agreement for an IGCC plant utilizing COP E-Gas technology. Excelsior’s Mesaba Energy Project will be located in northeastern Minnesota in an area known as the Iron Range.
Excelsior has been engaged in the development of this project since 2001. The Mesaba Energy Project has received broad-based support from state government, labor, business, and political leaders within Minnesota and in Washington, DC. Supportive legislation passed in Minnesota provides the project with an exemption from the certificate of need process for initial and future generation and transmission.
On October 26, 2004, the US DOE announced that the Excelsior Energy team had been selected to receive a $36 million award as part of the 2002 CCPI. At that time, the estimated total cost for the coal-based demonstration project was reported to be $1.18 billion (the basis for this number is unclear). This project was one of two selected to demonstrate advanced power generation systems using IGCC technology. Excelsior Energy has also been awarded $10 million in funding from a Minnesota renewable energy account.
On August 29, 2005, Excelsior Energy announced that it had selected a preferred and an alternate site. The preferred site is in Itasca County, Minnesota. Approval of site selection must be obtained from the Minnesota Public Utilities Commission. Excelsior Energy has secured an option for more than 1,000 acres. The project cost for a single 600 MW 2-on-1 IGCC facility was reported as $1.5 billion, with up to 1,000 construction jobs over the 4 year construction period.
Construction is slated to begin in late 2006. Excelsior Energy will own the project, and COP will license the technology and operate the project. Power will be sold to Northern States Power, an Xcel Energy company. Fluor has been selected as the EPC contractor, and Siemens is also a member of the team.
On October 5, 2005, the US DOE announced its intent to prepare an Environmental Impact Statement (EIS). In an October 2005 presentation, the total

Holcomb Generation Expansion Project Coal Technology Selection Study
3.0 IGCC Technologies and Industry Activity
August 24, 2006 3-25 © Black & Veatch 2006 Final Report All Rights Reserved
project cost was identified as $1.97 billion (the basis for this number is unclear, but likely includes O&M and fuel for the demonstration period), with the project expected to be operational in 2012 and producing up to 600 MW (net) of electricity. Unique features of the project include the first application of the COP full-slurry quench and integration between the ASU and the CTG. The project is expected to be able to utilize bituminous and sub-bituminous coals as well as petcoke blends. The design heat rate, utilizing bituminous coal, would be 8,600 Btu/kWh. The project includes a 12 month demonstration phase.
The March 27, 2006, issue of GHG Transactions & Technologies reported that the project will capture between 20 and 30 percent of the CO2 emissions when it begins operation. On May 22, 2006, funding was received from the US DOE.
3.12.4 Southern Company and Orlando Utilities Commission On October 21, 2004, Secretary of Energy Spencer Abraham announced a $235
million grant from the US DOE for the development of an IGCC project led by Southern Company. The plant will be located near Orlando at the Orlando Utilities Commission’s (OUC) Stanton Energy Center. The total cost for the coal-based demonstration project is reported to be $557 million (the basis for this number is unclear, but it has been stated that this would include O&M and fuel for 4 years of demonstration), of which the US DOE will contribute $235 million as the federal cost share. The partnership of Southern with OUC and KBR will contribute $322 million. This project, along with the Excelsior Energy project, was one of two selected to demonstrate the advanced power generation systems of IGCC technology.
Two air-blown, coal-based transport gasifiers will be designed and constructed for a 285 MW (net) baseloaded, TRIG CC refueling application. The CC will consist of a modified GE 7FA CTG, HRSG, and STG and will have a design heat rate of 8,400 Btu/kWh. To serve peaking needs, output can be increased to 311 MW (net) by firing natural gas in the HRSG. Using two gasifiers for the demonstration plant will limit the extent of scale-up required from the PSDF pilot plant. The plant will be 100 percent coal fired using low sulfur PRB subbituminous coal. The HRSG will include an SCR for NOx control.
On August 11, 2005, the US DOE announced its intent to prepare an EIS. A National Environmental Policy Act (NEPA) Record of Decision is expected in November 2006. In February 2006, Southern Company formally signed the cooperative agreement for the project with the US DOE. Initial funding of $13.8 million will support project activities through March 2007. The team anticipates 2 years for project definition and

Holcomb Generation Expansion Project Coal Technology Selection Study
3.0 IGCC Technologies and Industry Activity
August 24, 2006 3-26 © Black & Veatch 2006 Final Report All Rights Reserved
FEED, followed by 1 year of detailed design. Operation is slated for mid-2010, with demonstrations complete in June 2015.
3.12.5 Global Energy Projects Global Energy, who owns and operates the Wabash IGCC plant, has had two
IGCC projects under development for some time. The first was to be a 540 MW US DOE-funded Clean Coal Technology Project called Kentucky Pioneer Energy. The second project would be very similar to Kentucky Pioneer, only without any US DOE funding; it was to be the 600 MW Lima Energy plant in Lima, Ohio. Both projects were originally designed with British Gas Lurgi fixed bed gasifier technology (instead of entrained flow technology), and both have been delayed.
Lima Energy plans to build an IGCC power station at the former Lima Locomotive Works on South Main Street. The plan, announced in 1999, has been delayed repeatedly, first by permit issues, then from an inability to get customers to commit to buying electricity from the 540 MW plant, and, more recently, because of financing concerns relating to the initial fixed bed gasification technology (the new design incorporates entrained flow technology). The project was reported to cost $575 million (the basis for this number is unclear). Lima Energy hopes to raise $512 million through Ohio Air Quality Development Authority bonds to finance construction.
On September 18, 2004, Global Energy, Lima Energy’s parent company, announced that the company had finally sold all of its projected power output, ensuring a 20 year, $2.7 billion revenue stream. That, along with the financial backing to get the plant built, was the key hurdle that needed to be cleared before construction could start. On November 22, 2004, the Ohio Power Siting Board approved Lima Energy’s request to change the gasifier technology listed on the permit from a slagging fixed bed to a COP slurry fed entrained flow. Lima Energy asserted that financing was more readily obtainable with the revised technology.
In October 2005, Global Energy announced that it was beginning construction of a 600 MW IGCC facility in Lima, Ohio, with the fuel storage building. Industrial Construction Company, Inc., has been selected to construct the building, which will have a footprint of 100,000 square feet and will approach 100 feet in height and be capable of storing 75,000 tons of fuel. Roberts & Schaefer Company is engineering the solid material handling scope of the facility and will serve as construction manager for this project.
Gasification will convert solid petcoke feedstock into synthetic gas, which, after purification, will be both the fuel for the gas turbine power generation and the feedstock to produce synthetic gas products, such as hydrogen and synthetic natural gas.

Holcomb Generation Expansion Project Coal Technology Selection Study
3.0 IGCC Technologies and Industry Activity
August 24, 2006 3-27 © Black & Veatch 2006 Final Report All Rights Reserved
Construction, which will accelerate in 2006, will involve several hundred workers over 3 years. Global Energy indicates that commercial operation of the IGCC facility is expected in late 2008. The current published cost estimate is $775 million.
Permanent staffing will be in excess of 100, about half of which will be in operations. The project has all of its permits and approvals and has sold 100 percent of the electric power under long-term contract. The project has qualified for tax-exempt bond financing as an Air Quality Facility under the Ohio Air Quality Development Authority. The facility will be designed and constructed under contract to Gasification Engineering Corporation (GEC), a Global Energy company. GEC will subcontract major engineering and construction management and will handle direct purchase of major equipment.
3.12.6 The ERORA Group, LLC In 2004, the ERORA Group began developing the Taylorville Energy Center, a
677 MW minemouth IGCC project in Illinois based on GE technology. The reported project cost is $1.1 billion (the basis for this number is unclear), with a projected construction start in 2007 and a commercial operation date in 2010. Permits for the mine have been acquired, and the air permit application has been filed. The Illinois Clean Coal Review Board (CCRB) and the Illinois Department of Economic Opportunity awarded ERORA a $5.75 million grant for feasibility studies, as well as engineering and design studies.
On April 5, 2005, Eastman Chemical Company and ERORA entered into an agreement to study the feasibility of chemicals co-production at the proposed IGCC facility. Initially envisioned as a PC facility in 2003, ERORA received a grant from the Illinois CCRB to study the potential for coal gasification. The co-production of chemicals from syngas has the potential to significantly improve the economics of power generation. The project is expected to be based on a 2-on-1 7FB CC with three gasifiers (two, plus one full spare).
On January 23, 2006, ERORA signed a license agreement with GE Energy, authorizing the use of GE’s gasification technology for the project. GE also has been selected to provide the process design for the gasification portion of the facility and the power island.
ERORA is developing a similar project in Henderson County, Kentucky, known as Cash Creek. ERORA hopes to break ground in 2007.

Holcomb Generation Expansion Project Coal Technology Selection Study
3.0 IGCC Technologies and Industry Activity
August 24, 2006 3-28 © Black & Veatch 2006 Final Report All Rights Reserved
3.12.7 Energy Northwest Energy Northwest has performed a feasibility study on IGCC for 300 to 600 MW
of electricity to be installed in western Washington State. On July 27, 2005, the Board of Commissioners passed a resolution to proceed with the project development, starting with permitting. The approval is contingent upon permitting and execution of a power purchase agreement.
On October 27, 2005, Energy Northwest announced the selection of the Port of Kalama (Port) for a proposed 600 MW IGCC complex slated for initial operation in 2012. The agency’s Executive Board approved a 50 year lease for an 80 acre industrial site owned by the Port. The IGCC complex will produce its own “synthesis gas” to fuel two 300 MW power plants: one owned by public power interests, the other under private financing and ownership.
Construction of the complex, officially named the Pacific Mountain Energy Center, is expected to draw several hundred workers and create approximately 100 permanent jobs. The site provides adequate space for future expansion.
The estimated design and procurement cost for the power complex is approximately $1.2 billion. The costs would include $35 million to make the facility compatible with potential future technologies to remove and capture CO2 from the feedstocks to allow sequestration of CO2, if and when it becomes commercially feasible.
Energy Northwest stated that the next major step will likely be a 20 month process to secure environmental certification for the site by the Washington Energy Facility Site Evaluation Council. Energy Northwest issued a request for qualifications in March of 2006 and expects to have an agreement with an EPC contractor by May of 2007, resulting in a commercial operation date of 2012.
3.12.8 NRG Northeast On June 21, 2006, NRG announced plans for a major expansion over the next
decade. In the northeast, NRG’s plan calls for the addition of three IGCC plants. NRG recently completed a year-long process to evaluate and choose a technology provider and to assess both site feasibility and economic viability; initiated the permitting process for each of the sites; and developed a specific development and action plan for each site.
NRG expects to contract almost all of the output from the three IGCC projects through state administered processes. The contracts will range up to 20 years in length. These processes will begin as early as the fourth quarter of 2006 and are currently anticipated to be completed in the first half of 2007. Further development of each proposed plant is contingent upon successful completion of the request for proposal (RFP) process for that particular state.

Holcomb Generation Expansion Project Coal Technology Selection Study
3.0 IGCC Technologies and Industry Activity
August 24, 2006 3-29 © Black & Veatch 2006 Final Report All Rights Reserved
Indications are that NRG has selected Shell as the gasification technology provider. The selected sites are at NRG’s Indian River (Delaware), Montville (Connecticut), and Huntley (New York) plants. Each project is expected to produce approximately 630 MW (net) at a cost of between $1.4 and $1.6 billion. The development process is expected to require from 6 and 10 years to complete. Each project would create 85 to 100 jobs at the plant and could create up to 1,000 construction jobs during a 40-month build-out.
3.12.9 Summary of Proposed Projects The development activities of the eight companies discussed in the previous
subsections represent advances in the development of new IGCC plants within the US. Entrained flow gasification technology has been selected by six of the companies.
Southern Company and OUC are moving forward with a commercial demonstration of a transport bed gasifier. Energy Northwest has not selected a vendor at this stage, but all indications are that it will be a COP, GE, or Shell entrained flow gasification technology.
The AEP, Duke, and ERORA projects are all based on bituminous coal. The Global Energy Lima project is based on petcoke. Excelsior Energy and Energy Northwest anticipate a blend of fuels that would include PRB coal with petcoke. The Southern Company/OUC project is based on 100 percent PRB coal, but it is a commercial demonstration project for a new gasification technology, and the demonstration will not be complete until 2015. The fuel supply for the NRG sites has not been identified, but could include bituminous coal, petcoke, and PRB. If the AEP SWEPCO project moves forward with IGCC technology, the fuel would be either PRB coal or lignite.

Holcomb Generation Expansion Project Coal Technology Selection Study
4.0 Technology Screening Performance and Cost Estimates
August 24, 2006 4-1 © Black & Veatch 2006 Final Report All Rights Reserved
4.0 Technology Screening Performance and Cost Estimates
Black & Veatch developed performance and cost estimates of four baseload generation technology options. The performance and cost data were utilized in a busbar screening tool discussed in Section 5.0. For purposes of this evaluation, it was critical that the technologies be evaluated on a consistent basis relative to each other. The following four baseload technologies were considered:
• PC - supercritical • PC - subcritical • CFB • IGCC The plant size was assumed to be a nominal 700 MW (net) at the plant boundary.
The cost estimates have assumed that this project would be an additional unit on a brownfield site, although existing infrastructure was not specifically considered.
4.1 Assumptions Black & Veatch developed a list of assumptions for each technology. These
assumptions are provided in the following subsections.
4.1.1 Overall Assumptions The plant location would be in western Kansas. For the basis of the estimates, an
elevation of 2,915 feet (the elevation of Holcomb, Kansas) was selected. Project conditions include the following:
• Ambient pressure--13.21 psia. • Hot day--94° F dry bulb, 73° F wet bulb. • Average day--52° F dry bulb, 43° F wet bulb. • PRB coal, with generic properties as listed in Table 4-1, was assumed.
Table 4-1. PRB Coal - Quality Parameters
Btu/lb 8,400 Moisture, percent 30.0 Ash, percent 5.5 Sulfur, percent 0.35

Holcomb Generation Expansion Project Coal Technology Selection Study
4.0 Technology Screening Performance and Cost Estimates
August 24, 2006 4-2 © Black & Veatch 2006 Final Report All Rights Reserved
The condenser design basis assumed was as follows: • Wet heat rejection system (based on Black & Veatch heat rejection design). • Hot day backpressure--2.6 in. HgA. • Average day backpressure--1.7 in. HgA.
The units were designed for a minimum of 700 MW (net) at the plant boundary for the hot day conditions. Therefore, the plant would be able to produce at least 700 MW (net) at the plant boundary at any ambient temperature less than the hot day.
4.1.2 Thermal Unit Cycle Arrangement Assumptions The following assumptions are common to all three thermal cycles: supercritical
PC, subcritical PC, and CFB: • PRB coal used for boiler efficiency. • Turbine driven boiler feed pump(s). • Eight feedwater heaters (FWH) (three HP, one deaerator [DA], four LP). • Tandem compound (TC), four-flow (4F), 33.5 inch last-stage blades (LSB),
3,600 rpm, combined casing HP/IP.
4.1.2.1 Supercritical PC Cycle Arrangement. The assumptions for the supercritical arrangement are as follows:
• Supercritical STG and boiler. • SCR, fabric filter, semi-dry spray dryer absorber (SDA) FGD, and ACI for
mercury control. • Auxiliary power was assumed to be 6.0 percent. • Throttle conditions--3,500 psig/1,080° F/1,080° F at 95 percent valves wide
open (VWO). • Throttle conditions--3,675 psig/1,080° F/1,080° F at VWO.
4.1.2.2 Subcritical PC Cycle Arrangement. The subcritical PC assumptions are identical to those for the supercritical PC, except for the throttle conditions:
• Subcritical STG and boiler. • SCR, fabric filter, semi-dry SDA FGD, and ACI. • Auxiliary power was assumed to be 6.0 percent. • Throttle conditions--2,400 psig/1,080° F/1,080° F at 95 percent VWO. • Throttle conditions--2,520 psig/1,080° F/1,080° F at VWO.

Holcomb Generation Expansion Project Coal Technology Selection Study
4.0 Technology Screening Performance and Cost Estimates
August 24, 2006 4-3 © Black & Veatch 2006 Final Report All Rights Reserved
4.1.2.3 CFB Cycle Arrangement. The CFB assumptions are quite similar to those for the subcritical PC, except that three CFB boilers were assumed to supply a single STG:
• Subcritical STG. • Three subcritical CFB coal boilers. • SNCR, fabric filter, polishing dry FGD, and ACI. • Auxiliary power was assumed to be 7.0 percent. • Throttle conditions--2,400 psig/1,080° F/1,080° F at 95 percent VWO. • Throttle conditions--2,520 psig/1,080° F/1,080° F at VWO.
4.1.3 IGCC Cycle Arrangement Assumptions IGCC application has different issues that need to be considered. Unlike
conventional PC and CFB units, an IGCC unit cannot be sized to match a selected net plant output. The constraints are similar to that of a conventional natural gas fired simple or CC unit. The CTGs come in discrete sizes and are much more sensitive to changes in elevation and ambient temperature than thermal plants.
Currently, the most economical IGCC configurations are based on state-of-the-art conventional “F” class CTGs modified to fire syngas. The GE 7FB and the SPG SGT6-5000F CTGs are the most likely models to be incorporated into an IGCC. At ISO conditions (sea level, 59° F, 60 percent relative humidity), these CTGS are rated at 232 MW when firing syngas. A single 7FB or SGT6-5000F in an IGCC configuration produces a nominal 300 MW (net) at ISO conditions. Hence, a 3-on-1 IGCC configuration will produce a nominal 900 MW (net) at ISO conditions. The net output will vary somewhat depending on the gasification technology employed, as well as with the degree of integration.
To achieve a nominal 700 MW (net) from the Holcomb site, a 3-on-1 IGCC configuration is required. Starting with a nominal 900 MW (net, ISO) plant and adjusting for Shell gasification technology, as well as site-specific elevation and temperature, results in a nominal 800 MW (net) IGCC at an average annual temperature at the Holcomb site. On a peak summer day, this output is further degraded to a nominal 750 MW (net). The output is further reduced when the backup fuel (natural gas) is fired. These differences in plant output have been factored into the economic evaluation.
The following was assumed: • PRB coal used for gasifier feedstock. • Three Shell gasifiers. • Three GE 7251(FB) CTGs with syngas combustors. • TC 2F, 33.5 LSB, 3,600 rpm, combined casing HP/IP.

Holcomb Generation Expansion Project Coal Technology Selection Study
4.0 Technology Screening Performance and Cost Estimates
August 24, 2006 4-4 © Black & Veatch 2006 Final Report All Rights Reserved
• 100 percent syngas fuel with natural gas backup. • Inlet air evaporative cooling above 59° F. • Three-pressure reheat HRSG with duct firing. • Wet deaerating condenser. • Throttle conditions--1,550 psig/1,000° F/1,000° F. • For this evaluation, the STG was designed for normal pressure on the average
day during syngas operation. • Maximum duct firing was defined as firing to either maximum STG pressure
or maximum HRSG temperature limit, whichever came first. Black & Veatch estimated performance for the 7FB at the site elevation for the 52
and 94° F ambient cases on both syngas and natural gas.
4.2 Performance Cases Multiple performance cases were run for each of the four technologies.
4.2.1 Thermal Unit Cases Three performance cases were run for each thermal cycle at full-load conditions.
These cases, presented in Tables 4-2, 4-3, and 4-4, are as follows: • Hot day case (capacity design case)--VWO. • Rated average ambient case--95 percent VWO. • Average ambient case--700 MW net plant output (VWO).
4.2.2 IGCC Cases Two cases were run for the IGCC burning syngas and one case was run for the
IGCC burning a mix of syngas and natural gas. These cases, presented in Table 4-5, are as follows:
• Syngas hot day case--Evaporative cooling, no duct firing. • Syngas average ambient case--No evaporative cooling, no duct firing. • Mix of syngas and natural gas average ambient case--No evaporative cooling,
no duct firing. This case assumes that one gasifier is unavailable and that one of the CTGs is operating on natural gas. The performance is a composite of the two CTGs burning syngas and one CTG burning natural gas.

Holcomb Generation Expansion Project Coal Technology Selection Study
4.0 Technology Screening Performance and Cost Estimates
August 24, 2006 4-5 © Black & Veatch 2006 Final Report All Rights Reserved
Table 4-2. Supercritical PC Performance Estimates
Case Hot Day Average Average Steam Turbine Load--VWO, percent 100 95 100 Throttle Pressure, psig 3,675 3,500 3,633 Backpressure, in. HgA 2.6 1.7 1.8 Heat to Steam, MBtu/h 5,370 5,138 5,316 Boiler Efficiency (HHV), percent 83.58 83.58 83.58 Fuel Input, MBtu/h 6,426 6,147 6,360 Gross Output, kW 744,680 719,606 744,680 Total Auxiliary Load, kW 44,680 43,176 44,680 Net Power Output, kW 700,000 674,430 700,000 Net Turbine Heat Rate, Btu/kWh 7,212 7,140 7,138 Net Plant Heat Rate (HHV), Btu/kWh 9,180 9,087 9,086 Net Plant Efficiency (HHV), percent 37.17 37.55 37.55
Table 4-3. Subcritical PC Performance Estimates
Case Hot Day Average Average Steam Turbine Load--VWO, percent 100 95 100 Throttle Pressure, psig 2,520 2,400 2,495 Backpressure, in. HgA 2.6 1.7 1.8 Heat to Steam, MBtu/h 5,483 5,248 5,435 Boiler Efficiency (HHV), percent 83.58 83.58 83.58 Fuel Input, MBtu/h 6,560 6,279 6,502 Gross Output, kW 744,680 718,149 744,680 Total Auxiliary Load, kW 44,680 43,089 44,680 Net Power Output, kW 700,000 675,060 700,000 Net Turbine Heat Rate, Btu/kWh 7,363 7,308 7,298 Net Plant Heat Rate (HHV), Btu/kWh 9,372 9,301 9,289 Net Plant Efficiency (HHV), percent 36.41 36.68 36.73

Holcomb Generation Expansion Project Coal Technology Selection Study
4.0 Technology Screening Performance and Cost Estimates
August 24, 2006 4-6 © Black & Veatch 2006 Final Report All Rights Reserved
Table 4-4. CFB Performance Estimates
Case Hot Day Average Average Steam Turbine Load--VWO, percent 100 95 100 Throttle Pressure, psig 2,520 2,400 2,495 Backpressure, in. HgA 2.6 1.7 1.8 Heat to Steam, MBtu/h 5,543 5,306 5,497 Boiler Efficiency (HHV), percent 83.58 83.58 83.58 Fuel Input, MBtu/h 6,632 6,348 6,577 Gross Output, kW 752,688 725,666 752,688 Total Auxiliary Load, kW 52,688 50,796 52,688 Net Power Output, kW 700,000 674,870 700,000 Net Turbine Heat Rate, Btu/kWh 7,364 7,311 7,303 Net Plant Heat Rate (HHV), Btu/kWh 9,474 9,406 9,396 Net Plant Efficiency (HHV), percent 36.02 36.28 36.32
Table 4-5. 3-on-1 GE 7FB IGCC Performance Estimates
Case Hot Day Average Average Fuel Syngas Syngas Syngas/ Natural Gas Evaporative Cooler On Off Off Duct Firing Off Off Off Throttle Pressure, psig 1,445 1,485 800 Inlet Temperature, °F 73 52 52 Backpressure, in. HgA 2.3 1.7 0.9 CTG Output (each), kW 199,000 216,000 216,000/165,600 CTG Heat Rate, Btu/kWh (LHV) 8,442 8,287 8,287/9,259 CTG Fuel Input, MBtu/h (LHV) 1,680 1,790 1,790/1,533 Duct Burner Fuel Input, MBtu/h (LHV) 0 0 0 Fuel Input, MBtu/h (LHV) 5,040 5,370 5,113 Coal Input, MBtu/h (HHV) 6,736 7,177 4,785 Gross Output, kW 932,700 1,001,500 897,000 Total Auxiliary Load, kW 185,400 200,600 139,900 Net Power Output, kW 747,300 800,900 757,100 Net Plant Heat Rate (HHV), Btu/kWh 9,014 8,962 8,517 Net Plant Efficiency (HHV), percent 37.9 38.1 40.1

Holcomb Generation Expansion Project Coal Technology Selection Study
4.0 Technology Screening Performance and Cost Estimates
August 24, 2006 4-7 © Black & Veatch 2006 Final Report All Rights Reserved
4.3 Emissions For purposes of this screening evaluation, the emissions estimates listed in Table
4-6 have been utilized. Final permit levels may vary on a case-by-case basis.
Table 4-6. Estimated Emissions
Supercritical PC Subcritical PC CFB IGCC NOx, lb/MBtu1 0.07 0.07 0.07 0.06 SO2, lb/MBtu2 0.10 0.10 0.10 0.015 PM, lb/MBtu3 0.012 0.012 0.012 0.007 Hg, lb/MWh4 20 x 10-6 20 x 10-6 20 x 10-6 10x10-6 Notes: 1. NOx values are consistent with recent permit applications. IGCC does not include SCR. 2. SO2 values are consistent with recent permit applications. 3. PM values are filterable. 4. Hg values are based on testing at the Holcomb site with ACI (for PC and CFB) and are based on
experience at Eastman for IGCC.
4.4 Capital Costs The cost estimates in this report include estimated costs for equipment and
materials, construction labor, engineering services, construction management, indirects and other costs. The estimates were based on Black & Veatch proprietary estimating templates and experience. These estimates are screening-level estimates prepared for the purpose of project screening, resource planning, comparison of alternative technologies, etc. The information is consistent with recent experience and market conditions, but as demonstrated over the last few years, the market is dynamic and unpredictable. Power plant costs are subject to continued volatility in the future, and the estimates in this report should be considered primarily for comparative purposes. The air quality control systems for each technology were selected to meet typical recent best available control technology (BACT) levels for criteria pollutants, including NOx, SO2, and PM10. ACI injection for mercury control was included. CO2 and PM2.5 controls were not included in the estimates.
4.4.1 Owner’s Costs The sum of the capital cost and the Owner’s cost equals the total project cost or
the total capital requirement for the project. Typically, the scope of work for EPC costs is the base plant, which is defined as being within the fence boundary with distinct terminal points. Typical Owner’s costs that may apply are listed in Table 4-7.

Holcomb Generation Expansion Project Coal Technology Selection Study
4.0 Technology Screening Performance and Cost Estimates
August 24, 2006 4-8 © Black & Veatch 2006 Final Report All Rights Reserved
Table 4-7. Potential Owner’s Costs
Project Development: ● Site selection study ● Land purchase/options/rezoning ● Transmission/gas pipeline rights of way ● Road modifications/upgrades ● Demolition (if applicable) ● Environmental permitting/offsets ● Public relations/community development ● Legal assistance
Utility Interconnections: ● Natural gas service (if applicable) ● Gas system upgrades (if applicable) ● Electrical transmission ● Supply water ● Wastewater/sewer (if applicable)
Spare Parts and Plant Equipment: ● Air quality control systems materials,
supplies, and parts ● Acid gas treating materials, supplies and
parts ● Combustion and steam turbine materials,
supplies, and parts ● HRSG, gasifier and/or boiler materials,
supplies, and parts ● Balance-of-plant equipment/tools ● Rolling stock ● Plant furnishings and supplies
Owner’s Project Management: ● Preparation of bid documents and
selection of contractor/s and suppliers ● Provision of project management ● Performance of engineering due
diligence ● Provision of personnel for site
construction management
Plant Startup/Construction Support: ● Owner’s site mobilization ● O&M staff training ● Initial test fluids and lubricants ● Initial inventory of chemicals/reagents ● Consumables ● Cost of fuel not recovered in power
sales ● Auxiliary power purchase ● Construction all-risk insurance ● Acceptance testing ● Supply of trained operators to support
equipment testing and commissioning
Taxes/Advisory Fees/Legal: ● Taxes ● Market and environmental consultants ● Owner's legal expenses:
● Power Purchase Agreement ● Interconnect agreements ● Contracts--procurement and
construction ● Property transfer
Owner’s Contingency: ● Owner's uncertainty and costs pending
final negotiation: ● Unidentified project scope increases● Unidentified project requirements ● Costs pending final agreement (e.g.,
interconnection contract costs)
Financing: ● Financial advisor, lender’s legal,
market analyst, and engineer ● Development of financing sufficient to
meet project obligations or obtain alternate sources of lending
● Interest during construction ● Loan administration and commitment
fees ● Debt service reserve fund

Holcomb Generation Expansion Project Coal Technology Selection Study
4.0 Technology Screening Performance and Cost Estimates
August 24, 2006 4-9 © Black & Veatch 2006 Final Report All Rights Reserved
For this screening analysis, the Owner’s costs have been estimated as a flat 35 percent of the EPC capital cost. This cost was assumed to account for escalation from 2006 to the mid-point of construction, as well as for interest during construction. Permitting and project development costs were also assumed to be covered. An allowance for interconnections, such as transmission, water, natural gas, and rail, has not been included. Interconnection costs can be major cost contributors to a project and should be evaluated in greater detail during the site selection
For the IGCC project, the Owner’s risk contingency has been estimated at 6 percent of the EPC cost. This contingency will cover unexpected repairs and modifications needed during the initial years of operation. To attain high availability, it was assumed that the Owner would have to aggressively correct deficiencies and implement enhancements as they are identified. Some of the costs for correcting deficiencies may be recovered from the EPC contractor, but the Owner should expect to have significant initial operating costs that will not be reimbursed by the EPC contractor. Depending on the contracting arrangement and guarantees obtained, some of this responsibility/liability might be accepted by the EPC contractor, but it was assumed that the EPC contractor would pass on these costs to the Owner.
4.4.2 Project Costs Project cost estimates are presented in Table 4-8. Owners have generally
experienced greater liability and costs for startup and initial operations with IGCC applications. Consequently, a startup risk contingency has been included in the Owner’s costs as an estimate to cover the period from mechanical completion to long-term availability and performance levels. These costs include additional staffing to operate the plant, engineering and vendor resources, as well as out-of-scope plant modifications required for proper plant operation.
Market-based capital costs were developed from the assumptions listed in Section 4.1. An EPC cost basis was utilized. The values presented in Table 4-9 are reasonable for today’s market. The market for power generation equipment is currently dynamic, and prices and costs can and do vary considerably according to supply and demand. The capital costs were developed in a consistent manner and are reasonable relative to one another.

Holcomb Generation Expansion Project Coal Technology Selection Study
4.0 Technology Screening Performance and Cost Estimates
August 24, 2006 4-10 © Black & Veatch 2006 Final Report All Rights Reserved
Table 4-8. Estimated Capital Costs (2006 $)
Supercritical
PC Subcritical
PC CFB IGCC Net Output, MW 700 700 700 801 EPC Cost, $1,000 973,300 949,000 1,002,600 1,323,700Specific EPC Cost, $/kW 1,390 1,356 1,432 1,653 Owner’s Cost, $1,000 340,700 332,200 350,900 463,300 Owner’s Risk Contingency, $1,000 0 0 0 79,400 Project Cost, $1,000 1,314,000 1,281,200 1,353,500 1,866,400Specific Project Cost, $/kW 1,877 1,830 1,934 2,330 Note: Net output shown for average ambient temperature
4.5 Nonfuel O&M Costs The O&M estimates have been derived from other detailed estimates developed
by Black & Veatch and are based on vendor estimates and recommendations, actual performance information gathered from units in service, and representative costs for staffing, materials, and supplies. Plant staffing was assumed to provide operating and routine maintenance. For the CC options, additional maintenance related to periodic overhauls and major inspections was assumed to be provided through maintenance contracts or contract services. These outage maintenance costs, though periodic and dependent on the hours of operation and number of starts, have been annualized in the outage maintenance cost category.
Table 4-9 lists the assumed costs of major consumables. Summary estimates of fixed and variable nonfuel O&M costs are provided in Table 4-10.
Table 4-9. O&M Consumables Assumptions (2006 $)
Ash Disposal Costs, $/ton 6
Limestone Costs, $/ton 22
Lime Costs, $/ton 90
Ammonia Costs, $/ton 400
Urea Costs, $/ton 380
Catalyst Cost/Unit of Volume, $/m3 6,500
Brominated ACI, $/ton 1,600

Holcomb Generation Expansion Project Coal Technology Selection Study
4.0 Technology Screening Performance and Cost Estimates
August 24, 2006 4-11 © Black & Veatch 2006 Final Report All Rights Reserved
Table 4-10. Estimated O&M Costs at Average Ambient Conditions (2006 $)
Supercritical
PC Subcritical
PC CFB IGCC Staff Count 60 60 71 145 Net Output, MW 700 700 700 801 Fixed Costs, $1,000 15,500 15,400 17,500 27,400 Fixed Costs, $/kW 22.15 22.00 24.99 34.20 Variable Costs, $1,000 10,800 10,650 10,650 33,800 Capacity Factor, percent 90 90 90 78.66 Annual Generation, MWh 5,518,700 5,518,700 5,518,700 5,518,700Nonfuel Variable Costs, $/MWh 1.96 1.93 1.93 6.12 Note: Net output shown for average ambient temperature.

Holcomb Generation Expansion Project Coal Technology Selection Study
5.0 Economic Analysis
August 24, 2006 5-1 © Black & Veatch 2006 Final Report All Rights Reserved
5.0 Economic Analysis
A busbar analysis was developed to compare the four technologies. The economic criteria, summary of inputs, and results are presented in this section.
5.1 Economic Criteria The economic criteria utilized for the busbar analysis are summarized in
Table 5-1. The spreadsheets were created to allow changes in assumptions to automatically update the analysis. A forecast for the delivered price of a typical PRB coal to the western Kansas site was developed and is shown in Table 5-2. A natural gas price forecast is also included in Table 5-2, since natural gas is the assumed backup fuel for the IGCC.
Table 5-1. Economic Criteria
Owner’s Cost Adder, Percent of EPC Cost, percent 35.0
Owner’s IGCC Risk Contingency, Percent of EPC Cost, percent 6.0
Capacity Factor, percent 90.0
General Inflation, percent 3.0
Present Worth Discount Rate, percent 8.5
Levelized Fixed Charge Rate, percent 10.5
5.2 Busbar Analysis The economic criteria from Table 5-1 and the fuel forecasts from Table 5-2, along
with the key cost and performance data listed in Table 5-3, were utilized in a 30 year levelized busbar analysis.
Performance was based on the annual average day. The projected capacity factor for the 700 MW unit is 90 percent. Because the IGCC configuration produces approximately 800 MW (net), its capacity factor was adjusted so that it produces the same MWhs of generation as that of the PC and CFB options. Natural gas pricing is required for the IGCC as a backup fuel. The analysis assumes an IGCC equivalent availability of 50 percent in the first year of operation, 60 percent in the second year, 75 percent in the third year, and 85 percent from then on. Thus, natural gas would be required during the first 3 years of operation. An assumed 20 percent premium was added to the natural gas prices to account for the sporadic need for high volumes of gas.

Holcomb Generation Expansion Project Coal Technology Selection Study
5.0 Economic Analysis
August 24, 2006 5-1 © Black & Veatch 2006 Final Report All Rights Reserved
Table 5-2. Fuel Forecasts ($/MBtu)
Year PRB Coal Natural Gas 2011 1.220 7.20 2012 1.190 7.45 2013 1.249 7.70 2014 1.265 7.96 2015 1.278 8.24 2016 1.340 8.51 2017 1.361 8.80 2018 1.392 9.10 2019 1.416 9.40 2020 1.445 9.71 2021 1.525 10.04 2022 1.684 10.37 2023 1.752 10.71 2024 1.754 11.07 2025 1.792 11.43 2026 1.836 11.80 2027 1.881 12.19 2028 1.927 12.59 2029 1.975 13.00 2030 2.024 13.42 2031 2.073 13.85 2032 2.125 14.30 2033 2.154 14.76 2034 2.208 15.23 2035 2.263 15.72 2036 2.320 16.22 2037 2.378 16.74 2038 2.437 17.28 2039 2.498 17.83 2040 2.560 18.39

Holcomb Generation Expansion Project Coal Technology Selection Study
5.0 Economic Analysis
August 24, 2006 5-2 © Black & Veatch 2006 Final Report All Rights Reserved
Table 5-3. Summary of Busbar Model Inputs
Supercritical PC
Subcritical PC CFB IGCC
Capital Cost, 2006 $1,000 973,300 949,000 1,002,600 1,323,700Owner’s Cost Adder, percent 35 35 35 41 Project Cost, Installed $1,000 1,314,000 1,281,200 1,353,500 1,866,400Fixed O&M, 2006 $/kW 22.15 22.00 24.99 34.20 Variable O&M, 2006 $/MWh 1.96 1.93 1.93 6.12 Fixed O&M, 2011 $/kW 25.68 25.50 28.97 39.65 Variable O&M, 2011 $/MWh 2.27 2.24 2.24 7.09 Average Day--52° F Net Plant Power Output, kW 700,000 700,000 700,000 800,900 Net Plant Heat Rate, Btu/kWh
(HHV) 9,086 9,289 9,396 8,962
Capacity Factor (based on 5,518,700 MWh/yr), %
90 90 90 78.66
The results are presented in Table 5-4.
Table 5-4. Busbar Results
30 Year Levelized
Busbar Cost, 30 Year Levelized
Annual Cost, Case Description ¢/kWh $1,000,000
1 Supercritical PC 4.64 256.2 2 Subcritical PC 4.60 254.0 3 CFB 4.82 265.8 4 IGCC 6.91 381.3
Results are based on economic criteria from Table 5-1, fuel forecasts from Table 5-2, and the inputs from Table 5-3.
From the analysis, it is clear that a PC unit is the preferred technology. While
subcritical PC has a lower busbar cost, the two cases are within 1 percent of each other and for practical purposes can be viewed as essentially the same.

Holcomb Generation Expansion Project Coal Technology Selection Study
6.0 Recommendations and Conclusions
August 24, 2006 6-1 © Black & Veatch 2006 Final Report All Rights Reserved
6.0 Recommendations and Conclusions
The economic analysis, as provided in Table 5-4, indicates that the lowest cost technologies are the conventional PC and CFB units. The IGCC levelized busbar cost is roughly 50 percent higher than those of the PC and CFB.
To date, only two commercial nonsubsidized IGCC plants with a primary application of power generation have been built: the Delaware City Refinery, which utilizes petcoke, and the Negishi Refinery in Japan, which utilizes heavy oil. Both of these plants achieved commercial operation after 2000, are located in refineries, and utilize byproducts of the refining process as their fuel source. Currently, no IGCC plant is operating on PRB coal, the fuel source selected for use at the Holcomb site, although the Dow Plaquemine demonstration project operated on PRB coal from 1987 until 1995. To date, the largest IGCC power plant that has been built is the 550 MW Sarlux plant that operates on oil. The Lima petcoke-based IGCC plant is in the early stages of construction and is expected to be about 600 MW in size. Construction of an IGCC plant in the immediate future, as would be the case for the Holcomb units, would entail a substantially greater degree of uncertainty about construction cost and operating reliability compared to a PC fired plant.
While IGCC technology remains promising and has been targeted for development in several locations, at this point, IGCC could not meet the required in-service dates needed by the Holcomb participants. In the 2013 time frame, significantly more data will be available regarding the cost and performance of second generation oxygen-blown entrained flow based technology (COP, GE, and Shell) as well as from demonstration projects of less proven gasification technologies (Siemens, MHI, and TRIG). This additional data could support commercial operation dates for a third generation of IGCC plants in the 2016 to 2020 time frame.
The other two technologies evaluated, PC (either super or subcritical) and CFB, are commercially available for consideration for a new 700 MW coal-fired generating facility at Holcomb. The emissions of regulated pollutants from these two technologies are very similar. The most fuel efficient technology is supercritical PC, which is at least 3 percent more efficient than CFB technology. CFB is expected to be slightly more expensive, as measured by the levelized busbar cost of power, than PC.
Within the accuracy of the evaluation, the subcritical and supercritical PC are assumed to be equivalent. Supercritical PC is the preferred technology (rather than subcritical PC) for the three 700 MW net units to be located at the existing Holcomb station site because it is more efficient, which reduces the coal consumption by

Holcomb Generation Expansion Project Coal Technology Selection Study
6.0 Recommendations and Conclusions
August 24, 2006 6-2 © Black & Veatch 2006 Final Report All Rights Reserved
approximately 215 tpd per unit. This yields more than 2 percent fewer total emissions because of the reduced fuel burn rate.
For these reasons, supercritical PC is the technology selected for new power generation at Holcomb.