Type Purpose/Description - gov.bc.ca
32
TABLE 2.1 MINISTRY OF SUSTAINABLE RESOURCE MANAGEMENT INDICATORS OF FISH SUSTAINABILITY: MANAGED AND RARE FISH IN FOREST ENVIRONMENTS TYPES AND PURPOSES OF ENVIRONMENTAL MONITORING PROGRAMS (modified from MacDonald et al., 1991). Print Date: 04/25/02 C:\WINDOWS\Desktop\Fish Sustainability Indicators\Report\Final\Tables_R0.doc Revision Date: 04/25/02 Type Purpose/Description Basic/General Baseline/Inventory Assess existing environmental quality Establish a database for planning, or for future monitoring programs Status Assess environmental conditions or quality over space Trend Assess environmental conditions or quality over time Targeted/Specific Environmental effects monitoring (EEM) Assess impacts or effects from one or more stressors Compliance Compare environmental quality variables to legal standards (e.g., regulatory limits) Standards development Collect monitoring data for the purposes of developing standards (typically from reference or control locations) Validation Validate methods, standards, variables (e.g., indicators or indices), model predictions Implementation Determine if required or recommended management activities or practices are being implemented Effectiveness Determine if management activities or practices have the desired or expected effect(s) REV 0 – Issued for Report
Transcript of Type Purpose/Description - gov.bc.ca

TABLE 2.1
MINISTRY OF SUSTAINABLE RESOURCE MANAGEMENT INDICATORS OF FISH SUSTAINABILITY: MANAGED AND RARE FISH IN FOREST ENVIRONMENTS
TYPES AND PURPOSES OF ENVIRONMENTAL MONITORING PROGRAMS
(modified from MacDonald et al., 1991). Print Date: 04/25/02 C:\WINDOWS\Desktop\Fish Sustainability Indicators\Report\Final\Tables_R0.doc Revision Date: 04/25/02
Type Purpose/Description
Basic/General Baseline/Inventory Assess existing environmental quality
Establish a database for planning, or for future monitoring programs Status Assess environmental conditions or quality over space Trend Assess environmental conditions or quality over time Targeted/Specific Environmental effects monitoring (EEM)
Assess impacts or effects from one or more stressors
Compliance Compare environmental quality variables to legal standards (e.g., regulatory limits) Standards development Collect monitoring data for the purposes of developing standards (typically from reference or
control locations) Validation Validate methods, standards, variables (e.g., indicators or indices), model predictions Implementation Determine if required or recommended management activities or practices are being implemented Effectiveness Determine if management activities or practices have the desired or expected effect(s)
REV 0 – Issued for Report

TABLE 2.2
MINISTRY OF SUSTAINABLE RESOURCE MANAGEMENT INDICATORS OF FISH SUSTAINABILITY: MANAGED AND RARE FISH IN FOREST ENVIRONMENTS
SUMMARY OF NUMBER AND TYPES OF TIMES, LOCATIONS AND VARIABLES
PREFERRED FOR DIFFERENT MONITORING PROGRAMS Print Date: 04/25/02
C:\WINDOWS\Desktop\Fish Sustainability Indicators\Report\Final\Tables_R0.doc Revision Date: 04/25/02
Type Sample times Sample locations Variables (Emphasis) Status and trend
≥10 sample years Usually evenly spaced
Representative sample(s) of ≥10, and usually ≥100 locations Indicators > Supplementary >Stress
Standards development
One or a few years
Representative sample of ≥10, and usually ≥100, reference locations, or ≥10, and usually ≥30, locations along a stress or response gradient
Indicators ≥ Supplementary > Stress
Validation (of standards)
One or a few years
≥10 Impact locations (usually fewer than for standards development)
Indicators = Stress > Supplementary
EEM Various ≥10 locations total Few Impact locations plus larger representative sample of reference locations, or Locations along a stress gradient
Indicators = Stress > Supplementary
NOTES: See Table 2.1 for description of program types. EEM = Environmental Effects Monitoring. Indicators = response indicators; Supplementary = natural supplementary or modifying factors or variables. Impact locations and locations along a gradient should usually be judgementally selected. REV 0 – Issued for Report .

TABLE 3.1
MINISTRY OF SUSTAINABLE RESOURCE MANAGEMENT INDICATORS OF FISH SUSTAINABILITY: MANAGED AND RARE FISH IN FOREST ENVIRONEMENT
RED LISTED FISH SPECIES OF B.C.
(adapted from CDC website http://srmwww.gov.bc.ca/cdc/trackinglists/red_blue.htm.) Print Date: 04/25/02
C:\WINDOWS\Desktop\Fish Sustainability Indicators\Report\Final\Tables_R0.doc Revision Date: 04/25/02
Scientific Name Common Name Distribution * Cottus species 2 Cultus Lake Sculpin Specific Acipenser medirostris Green Sturgeon Specific Acipenser transmontanus population 1
White Sturgeon (Kootenay River population)
Specific
Acipenser transmontanus population 2
White Sturgeon (Columbia River population)
Specific
Acipenser transmontanus population 3
White Sturgeon (Nechako River population)
Specific
Acipenser transmontanus population 4
White Sturgeon (Fraser River population)
Specific
Coregonus artedi Cisco (lake herring) Limited Coregonus autumnalis Arctic Cisco Limited Coregonus nasus Broad Whitefish Limited Thymallus arcticus population 1 Arctic Grayling, Williston Watershed
population Limited
Spirinchus species 1 Pygmy Longfin Smelt Widespread? Notropis atherinoides Emerald Shiner Limited Notropis hudsonius Spottail Shiner Limited Rhinichthys osculus Speckled Dace Limited Rhinichthys species 4 Nooksack River Dace Specific Rhinichthys umatilla Umatilla Dace ? Catostomus species 4 Salish Sucker ? Lota lota population 1 Burbot, lower Kootenay population Specific Lota lota population 2 Burbot, lower Columbia population Specific Gasterosteus species 1 Giant Black Stickleback ? Gasterosteus species 2 Enos Lake Limnetic Stickleback Specific Gasterosteus species 3 Enos Lake Benthic Stickleback Specific Gasterosteus species 4 Paxton Lake Limnetic Stickleback Specific Gasterosteus species 5 Paxton Lake Benthic Stickleback Specific Gasterosteus species 16 Vananda Creek Limnetic Stickleback Specific Gasterosteus species 17 Vananda Creek Benthic Stickleback Specific Pungitius pungitius Ninespine Stickleback Limited
NOTES: CDC = Data Conservation Center. *Distribution adapted from on Scott and Crossman (1973) and Haas and Porter (2001) and CDC (2000) for general geographic regions of BC.
REV 0 – Issued for Report

TABLE 3.2
MINISTRY OF SUSTAINABLE RESOURCE MANAGEMENT INDICATORS OF FISH SUSTAINABILITY: MANAGED AND RARE FISH IN FOREST ENVIRONEMENT
BLUE LISTED (vulnerable) FISH SPECIES OF B.C.
(adapted from CDC website http://srmwww.gov.bc.ca/cdc/trackinglists/red_blue.htm.)
Print Date: 04/25/02 C:\WINDOWS\Desktop\Fish Sustainability Indicators\Report\Final\Tables_R0.doc Revision Date: 04/25/02
Scientific Name Common Name Distribution Cottus bairdi, hubbsi Mottled Sculpin, hubbsi subspecies Similkameen and Kettle
R.? Cottus bairdi punctulatus Mottled Sculpin, punctulatus subspecies Similkameen and Kettle
R. ? Cottus confusus Shorthead Sculpin Flathed R. Southeast
B.C. Hiodon alosoides Goldeye Northeast B.C. (i.e Liard
R.) Coregonus sardinella Least Cisco Northern B.C. Oncorhynchus clarki lewisi Cutthroat Trout, lewisi subspecies Widespread Oncorhynchus clarki clarki Cutthroat Trout, clarki subspecies Widespread Salvelinus confluentus Bull Trout Widespread Interior Salvelinus malma Dolly Varden Widespread Stenodus leucichthys Inconnu Widespread Thaleichthys pacificus Eulachon Coastal Acrocheilus alutaceus Chiselmouth Sporadic (mostly lakes) Hybognathus hankinsoni Brassy Minnow Sporadic (Lower Fraser,
mid Fraser, Parsnip/Peace R.
Margariscus margarita Pearl Dace Northeast B.C. (Peace and Slave R.).
Catostomus platyrhynchus Mountain Sucker South Similkameen and North Thompson R.
NOTES: CDC = Data Conservation Center. *Distribution adapted from on Scott and Crossman (1973) and Haas and Porter (2001) and CDC (2000) for general geographic regions of BC.
REV 0 – Issued for Report

TABLE 3.3
MINISTRY OF SUSTAINABLE RESOURCE MANAGEMENT INDICATORS OF FISH SUSTAINABILITY: MANAGED AND RARE FISH IN FOREST ENVIRONMENTS
A LIST OF THE METHODS USED TO COLLECT FISH
OF DIFFERENT MANAGEMENT CATEGORIES IN BRITISH COLUMBIA. (Adapted from Department of Fisheries and Oceans - Pacific Region - www.pac.dfo-mpo.gc.ca/ops/fm/salmon/stock.htm)
Print Date: 04/25/02
C:\WINDOWS\Desktop\Fish Sustainability Indicators\Report\Final\Tables.doc Revision Date: 04/25/02
Collection Gear or Method Managed Fish
Ecologically Interesting
(sentinel) Fish
Rare Fish
Fish Trapping X X X Electrofishing X X X Angling/ Trolling X X X Trawl/Tow Net X X X Seine Net (freshwater) X X X Underwater Observation X X X Creel Census X X NA Gill Net (freshwater) X X NA Trammel Net X X NA Collection of Fish Eggs and Larvae
X X NA
Tagging X X NA Radio Tracking X X NA Acoustic Assessment X X NA Fish Wheel X NA NA Fence Count X NA NA Redd Count X NA NA Helicopter Count X NA NA Seine Net (saltwater) X NA NA
Gill Net (saltwater) X NA NA Sampling with Toxicant NA ? NA
REV 0 – Issued for Report

TABLE 3.4
MINISTRY OF SUSTAINABLE RESOURCE MANAGEMENT INDICATORS OF FISH SUSTAINABILITY: MANAGED AND RARE FISH IN FOREST ENVIRONMENTS
The historical data regarding fish habitat, abundance and distribution
Fisheries Information Summary System Fish and habitat data for approximately 28,000 waterbodies. Fish distribution data for approximately 15,000 waterbodies throughout B.C.
Watersheds B.C. GIS database interface - (uses FISS) under development Fisheries Data Warehouse Database interface - (uses FISS) Fish Wizard (B.C. Fisheries) Map based display of summary data (uses FISS) FDISMap/ FishMap GIS data entry/ data retrieval system (uses FFHI)
Fish and Fish Habitat Database
Biological and Conservation Data System (BCD) – Conservation Data Centre Consists of over 30 types of files linked to manual files and GIS. Records are based on published and unpublished reports, field surveys, and collection records.
Provincial Release Records Hatchery Data and Lake Data Angling Guide Management System Data from creel surveys Steelhead Harvest Analysis Results from the steelhead harvest questionnaire Salmonid Escapement Database Pacific salmon catch data from Fisheries and Oceans Salmonid Enhancement Program Mark Recovery Database Pacific salmon data from Fisheries and Oceans Fisheries Project Registry Data from 3772 projects (by 11 different agencies in BC) Provincial Fishing Permit Records Data Archived in Victoria and/or at Regional Offices Department of Fisheries and Oceans - Stock Status Reports Pacific salmon data from Fisheries and Oceans
Fish Abundance and Distribution Data Sources
Research Reports e.g. Thesis and non-thesis - archived at UBC Department of Zoology /Native Fish Research Water survey of Canada Monitoring Program (SEAMS/EMS) Water quality/quantity data River Data Plotted water levels for around 50 waterbodies in BC B.C. Watershed Atlas 18,000 watersheds defined in B.C. 1:250,000 Land Use Mapping (BTM) Land use and land cover information 1:20,000 Base Mapping (TRIM) Road, stream and topographic information Depth Maps Depth of lakes B.C. Water Quality Records BC MWLAP- water quality data for 124 bodies of water
Fish Habitat Data
B.C. In View Aerial Photographs Journal/Magazine Articles Various Ministry of Transportation and Highways Fisheries resources at stream crossings B.C. Land Inventory Fisheries resources adjacent to development applications B.C. Ministry of Agriculture Fisheries resources adjacent to agriculture B.C. Ministry of Water Land and Air Protection Environmental Trends, Red and Blue listed species, watershed restoration projects, parks, etc. B.C. Ministry of Sustainable Resource Management Fisheries Inventory B.C. Municipalities (Permits for Drinking Water, Sewer Outfalls, Water Diversions, Roads and Bridges, Land Development and Public Transit R.O.W.)
Fish and fish habitat adjacent to developments
Forest/Fish Renewal B.C. Studies Fish and fish habitat adjacent to areas to be harvested Fisheries Inventory Reports (FFHI) Data from Reconnaissance 1:20,000 surveys Aluminium Smelting (Alcan) Company Fish and fish habitat adjacent to developments Hydroelectric (B.C. Hydro) Projects Fish and fish habitat near hydro developments Mining Companies Fish and fish habitat near proposed mines Forest Harvest Companies Fish and fish habitat adjacent to areas to be harvested Land Development Companies Fish and fish habitat adjacent to developments Oil Exploration Companies Fish and fish habitat adjacent to developments Oil/Gas Transmission Companies Fisheries resources at stream crossings Electricity Transmission Companies Fisheries resources at stream crossings Telephone (Voice and Data transmission) Companies Fisheries resources at stream crossings Engineering/ Environmental Consulting Companies Private libraries, databases, project files Agriculture Companies Fish and fish habitat near agriculture developments
Other Potential Sources
Construction Supply Companies (e.g. gravel/concrete) Fish and fish habitat adjacent to gravel pits, etc.
REV 0 – Issued for Report

TABLE 3.5
MINISTRY OF SUSTAINABLE RESOURCE MANAGEMENT INDICATORS OF FISH SUSTAINABILITY: MANAGED AND RARE FISH IN FOREST ENVIRONMENTS
STEPS IN THE DEVELOPMENT AND APPLICATION OF AN
INDEX OF BIOTIC INTEGRITY (IBI) FOR FISH COMMUNITIES (from Hughes and Oberdorff,1999)
Print Date: 04/25/02 C:\WINDOWS\Desktop\Fish Sustainability Indicators\Report\Final\Tables.doc Revision Date: 04/25/02
1 Select a relatively homogeneous region. A region may be an ecoregion, basin, or fish faunal region that is homogeneous with respect to a combination of environmental characteristics (e.g., climate physiography, soil, vegetation) and potential fish species.
2 Determine the reference condition(s). References may be based on a set of minimally disturbed reference streams, a disturbance gradient, historical data, paleoecological information, and professional judgement. Expectations will likely differ for water body size, gradient, temperature, or other naturally limiting variables.
3 List candidate metrics and assign species to trophic, tolerance, and habitat guilds. Regional fish texts usually provide this information, at least in developed countries.
4 Sample fish assemblages. This is best done (a) when they are least variable yet most limited by anthropogenic stressors and (b) in a manner yielding a representative collection of species and proportionate abundances, but that (c) is cost-effective.
5 Tabulate numbers of individuals by species. Also, determine the total number of individuals collected at each reach.
6 Calculate values for each candidate IBI metric. Typically these are proportions or percents of individuals, or numbers of species in particular categories.
7 Develop scoring criteria. These are based on previously available information from step 2 or from fish data collected at minimally disturbed sites in step 4. Scoring criteria may be continuous (0-1 or 0-10) or based on classes (1, 3, 5 or 0, 5, 10).
8 Calculate metric scores and add these to obtain an IBI score. 9 Evaluate metric and index scores. Consider differences between expected and obtained scores,
compare variance results from repeated samples, and assess responsiveness to environmental stressors. Modify or reject metrics that are highly variable or unresponsive, and recalculate if necessary.
10 Interpret IBI scores as indicating an acceptable, marginally impaired, or highly impaired fish assemblage; or as excellent, good, fair, poor, or very poor.
NOTE: Steps or statements applicable to community indicators in general are shown in bold. REV 0 – Issued for Report

TABLE 3.6
MINISTRY OF SUSTAINABLE RESOURCE MANAGEMENT INDICATORS OF FISH SUSTAINABILITY: MANAGED AND RARE FISH IN FOREST ENVIRONMENTS
COMMUNITY INDICATORS OR METRIC USED IN INDICES OF BIOTIC INTEGRITY (IBI) IN
MIDWESTERN U.S. STREAMS, AND SUBSTITUTIONS FOR OTHER AREAS (from Hughes and Oberdorff,1999)
Print Date: 04/25/02 C:\WINDOWS\Desktop\Fish Sustainability Indicators\Report\Final\Tables.doc Revision Date: 04/25/02
Indicator/Metric Scoring criteria1 Substitution 5 3 1 Richness Total no. species Reference based No. native species No. darter species Reference based No. benthic species No. sunfish species Reference based No. water column species No. sucker species Reference based No. salmonids Habitat (sensitivity) guilds No. intolerant species Reference based % sculpins % green sunfish <5 5-20 >20 % tolerant species Trophic guilds % omnivores <20 20-45 >45 No change % insectivorous cyprinids >45 20-45 <20 % insectivorous species % piscivores >5 1-5 <1 No change Abundance Total no. fish (N) Reference based CPUE, density, biomass2 Reproduction and condition % hybrids 0 >0-1 >1 Reproductive guilds % external deformities 0-2 >2-5 >5 No change NOTE: Metrics or indicators (or their substitutes) directly applicable to B.C. are shown in bold. Absolute values for scoring
criteria may not apply to B.C. 1— Scoring criteria are 1=poor, 3=intermediate, 5=good. For reference-based scoring, 1=deviates strongly from reference,
3=deviates somewhat from reference, 5=similar to reference. 2— CPUE=Catch-per-unit-effort, density =no. fish per unit area or length; both could be expressed in terms of biomass (i.e., g
or kg) rather than numbers of fish. REV 0 – Issued for Report

TABLE 3.7
MINISTRY OF SUSTAINABLE RESOURCE MANAGEMENT INDICATORS OF FISH SUSTAINABILITY: MANAGED AND RARE FISH IN FOREST ENVIRONMENTS
POPULATION INDICATORS AND DATA IDENTIFIED FOR MANAGED FISH SPECIES BY VARIOUS
FISH/FORESTRY PROGRAMS IN B.C.
Print Date: 04/25/02 C:\WINDOWS\Desktop\Fish Sustainability Indicators\Report\Final\Tables.doc Revision Date: 04/25/02
Category Indicator
Distribution • Percentage of salmonid stocks extinct, at moderate to high risk of extinction or of special concern – ETR.
• Extent to which productive habitats of selected fish species (e.g. salmon or species guilds are distributed throughout the range of their habitat – IFPA.
Abundance • Population levels and changes over time of selected (aquatic) species and species guilds - CCFM.
• Population sizes and reproductive success of salmon species by drainage (MF)
• Animal population trends for selected [aquatic] species of economic importance [e.g., salmon].CCFM
• Salmon Escapement estimate by region – CSAS. • Redd Locations – NIFC • Number of Kokanee spawners in streams that feed Okanagan Lake
(by 5 year increment) - ETR. • Steelhead and coho escapement in selected rivers - LRMP.
Survival (= Age/Growth) • Change in number of fish by life stages, by species – PNWEIWG.
NOTES: CCFM = Canadian Council of Forest Ministers (1995) CSAS = Canadian Stock Assessment Secretariat ETR = Environmental Trends Reporting (BC MELP, 2000) IFPA = Adams Lake Innovative Forest Practices Agreement (Keystone Wildlife Research, 2001) LRMP = Land and Resource Management Plan (Kamloops IMC, 1999) MF = Model Forests (McGregor Model Forest Assoc., 1998; Beasely and Wright, 2000) NIFC - Northwest Indian Fisheries Commission PNWEIWG = The Pacific Northwest Environmental Indicators Work Group (Eclipse, 1998)
REV 0 – Issued for Report

TABLE 3.8
MINISTRY OF SUSTAINABLE RESOURCE MANAGEMENT INDICATORS OF FISH SUSTAINABILITY: MANAGED AND RARE FISH IN FOREST ENVIRONMENTS
POPULATION INDICATORS AND DATA IDENTIFIED FOR NON-COMMERICAL, RARE, THREATENED
AND VULNERABLE SPECIES BY VARIOUS FISH/FORESTRY PROGRAMS IN B.C
Print Date: 04/25/02 C:\WINDOWS\Desktop\Fish Sustainability Indicators\Report\Final\Tables.doc Revision Date: 04/25/02
Category Indicator
Distribution • Presence of red and blue listed fish species - MF. • Number of aquatic species at risk (red and blue listed) - LRMP. • Fish species at risk identified and protected. – Forest Certification
and LRMP. • Number of fish species classified as threatened endangered or
vulnerable ETR. SFR • Frequency of occurrence of selected [aquatic] indicator species –
CCFM. • Change in number of fish by life stages, by species. PNWEIWG • Fish species lists, habitat attributes and distribution of fish species -
LRMP. Forest Certification Abundance • Population size of selected species at risk - MF.
• Reproductive size of selected species at risk - MF • Bull trout populations that are “stable” and “declining” (classified
by watershed grouping) -ETR. • Adult Fish Survey (relative abundance) - EEM
Survival (=Age/Growth • Age distribution of white sturgeon (percentage of white sturgeon populations that are juveniles, sub-adults, adults) - ETR.
• Adult Fish Survey (age structure) - EEM Reproductive Capacity • Adult Fish Survey (reproduction) - EEM NOTES: CCFM = Canadian Council of Forest Ministers (1995)
CSAS = Canadian Stock Assessment Secretariat ETR = Environmental Trends Reporting (BC MELP, 2000) IFPA = Adams Lake Innovative Forest Practices Agreement (Keystone Wildlife Research, 2001) LRMP = Land and Resource Management Plan (Kamloops IMC, 1999) MF = Model Forests (McGregor Model Forest Assoc., 1998; Beasely and Wright, 2000) NIFC - Northwest Indian Fisheries Commission PNWEIWG = The Pacific Northwest Environmental Indicators Work Group (Eclipse, 1998) SFR = State of Forests Reporting (MOF, 2000)
REV 0 – Issued for Report

TABLE 4.1
MINISTRY OF SUSTAINABLE RESOURCE MANAGEMENT INDICATORS OF FISH SUSTAINABILITY: MANAGED AND RARE FISH IN FOREST ENVIRONMENTS
WATER QUALITY INDICATORS SELECTED OR RECOMMENDED BY FISH/FORESTRY PROGRAMS
AND INDICATOR WORKSHOPS
Print Date: 04/25/02 C:\WINDOWS\Desktop\Fish Sustainability Indicators\Report\Final\Tables.doc Revision Date: 04/25/02
Indicator Measure Biological Water Quality • Biological Water Quality Index - Percentage of water rated excellent, good, fair,
poor (possible parameters would include fish community and benthic macroinvertebrate species or taxa composition and richness) –PNWEIWG, PSFA, ETR
• Benthic Index of Biotic Integrity (B-IBI) – MWLAP (Cariboo, Skeena, Okanagan, Vancouver Island, Lower Mainland Regions).
• Changes in distribution and abundance of aquatic fauna - MF. General Chemical Water Quality
• Chemical Water Quality - Percentage of waters rated excellent, good, fair, poor (i.e. relative to BC Water Quality Objectives) (e.g. temperature, dissolved oxygen, biological oxygen demand, pH, ammonia/nitrate nitrogen, total phosphorus, total suspended solids, metals, organics and bacteria) - PNWEIWG, PSFA, ETR, FRAP
Electrochemical Variables
• Alkalinity, Conductivity, Turbidity, TDS amd TSS (as one component in provincial water quality index) - PNWEIWG, PSFA, SFR, FRAP, MF.
• Alkalinity, pH, Conductivity,- Rosenfeld, 2001 • Oxygen as a measure of the Chemical Water Quality Index – PNWEIWG, PSFA,
ETR, FRAP • Oxygen as a measure of nutrient loading by drainage – MF • Time Series monitoring of the proportion of sites below dissolved oxygen and pH
guidelines – BC MELP, 1996; DFO, 1995. • Low oxygen monitoring for winter kill risk asssessment in relation to stocking
programs (Lirette and Chapman, 1993).. • Water temperature (e.g., max-min) PNWEIWG, PSFA, FPC, NIFC. MF, FRAP,
IFPA Biological Productivity
• Trophic level classification TP, TN chlorophyll a and secchi depth – MELP BC Lake Surveys MELP
• Nutrient loading by drainage, levels of dissolved oxygen and water nutrients in harvested vs. control streams, rates of marine to terrestrial nutrient (nitrogen) transfer. MF
Fluvial Erosion
• TSS, turbidity (as one component in provincial water quality index) - PNWEIWG, PSFA, SFR, FRAP, MF.
• Time Series monitoring of the % of of sites below turbidity guidelines – MELP, 1996; DFO, 1995.
• Turbidity, true colour over adequate timeframe, relative to natural variability - IFPA.
• Turbidity as part of trophic level classification – MELP BC Lake Survey. NOTES: CCFM = Canadian Council of Forest Ministers (1995)
ETR = Environmental Trends Reporting (MELP, 2000) FDW = Fisheries Data Warehouse FRAP = Fraser River Action Plan IFPA = Adams Lake Innovative Forest Practices Agreement (Keystone Wildlife Research, 2001) LRMP = Land and Resource Management Plan (Kamloops IMC, 1999) MF = Model Forests (McGregor Model Forest Assoc., 1998; Beasely and Wright, 2000) NIFC = Northwest Indian Fisheries Commission PNWEIWG = The Pacific Northwest Environmental Indicators Work Group (Eclipse1998) PSFA = Pacific Salmon Fishery Agreement (Green Mountain Institute, 1998) SFR = State of Forests Reporting (MOF, 2000)
REV 0 – Issued for Report

TABLE 4.2
MINISTRY OF SUSTAINABLE RESOURCE MANAGEMENT INDICATORS OF FISH SUSTAINABILITY: MANAGED AND RARE FISH IN FOREST ENVIRONMENTS
CANDIDATE METRICS AND THEIR EXPECTED DIRECTION OF RESPONSE
(from Karr and Chu 1999)
Print Date: 04/25/02 C:\WINDOWS\Desktop\Fish Sustainability Indicators\Report\Final\Tables.doc Revision Date: 04/25/02
Category Metric Definition Expected Impact Response
Taxa Richness & Composition
No. of Taxa Total number of different taxa Decrease
No. of Ephemeroptera Taxa
Total number of different Ephemeroptera taxa
Decrease
No. of Plecoptera Taxa Total number of different Plecoptera taxa
Decrease
No. of Trichoptera Taxa
Total number of different Trichoptera taxa
Decrease
No. of Long-lived Taxa
Total number of long-lived taxa Decrease
% Long Lived Relative abundance of individuals in long lived taxa
Decrease
% Oligochaetes Relative abundance of Oligochaetes Increase % Chironomids Relative Abundance of
Chironomidae Increase
Tolerants / Intolerants
No. of Intolerant Taxa Total number of intolerant taxa Decrease
% Tolerants Relative abundance of tolerant individuals
Increase
% Sediment Tolerants Relative abundance of sediment tolerant individuals
Increase
% Sediment Intolerants Relative abundance of sediment intolerant individuals
Decrease
Feeding / Habit Metrics
% Predators Relative abundance of predators Decrease
No. of Clinger Taxa Total number of clinger taxa Decrease Populations Attributes
% Dominance (3 taxa) Measures the relative abundance of the three most abundant taxa
Increase
REV 0 – Issued for Report

TABLE 4.3
MINISTRY OF SUSTAINABLE RESOURCE MANAGEMENT INDICATORS OF FISH SUSTAINABILITY: MANAGED AND RARE FISH IN FOREST ENVIRONMENTS
SCALE OF APPLICATION FOR PHYSICAL AND HYDROLOGICAL HABITAT VARIABLES
Print Date: 04/25/02 C:\WINDOWS\Desktop\Fish Sustainability Indicators\Report\Final\Tables.doc Revision Date: 04/25/02
Type Approach Spatial Scale Examples
Broad Scale (Macro-Mesohabitat)
Involves delineation of the stream system in shorter segments, types or reaches based on physical characteristics. Initial division based on channel gradient, geology, surrounding topography, hydrological regime based on map sources and historical information
Drainage basin to reach level
Blackwater macrohabitat predictive models of fish distribution (Porter et al. 1998. Rosgen classification (Rosgen, 1996) River Habitat survey (Fox et al. 1996). Reconnaissance level survey (Thorne and Easton, 1994). Habitat mapping (Maddock & Bird, 1996)
Micro habitat Uses analysis of small scale variables (e.g. substrate, water depth, current velocities) to identify quantity and quality physical habitat for target species.
Reach to Patch Scale
IFIM (Tennent, 1976) PHABSIM (Bovee, 1996)
Empirical habitat models
Regression models are developed to predict biological characteristics based on physical features
Reach to Patch Scale
Habitat quality index (Binns & Eiserman, 1979)
REV 0 – Issued for Report

TABLE 4.4
MINISTRY OF SUSTAINABLE RESOURCE MANAGEMENT INDICATORS OF FISH SUSTAINABILITY: MANAGED AND RARE FISH IN FOREST ENVIRONMENTS
PHYSICAL HABITAT AND HYDROLOGY INDICATORS SELECTED OR RECOMMENDED BY
FISH/FORESTRY PROGRAMS IN BC AND INDICATOR WORKSHOPS (adapted from Gustavson and Brown, 2002).
Print Date: 04/25/02 C:\WINDOWS\Desktop\Fish Sustainability Indicators\Report\Final\Tables.doc Revision Date: 04/25/02
FLOW REGIME Flow Hydrology • Stream discharge characterization: % of waterbodies with minimal, moderate, extreme changes
in hydrology from historical patterns (captures low and high flow extremes-derivation) PNWEIWG.
• Trends in flow regimes - FC. • Peak and flow trends relative to historic average - LRMP. • Water flows (peak / low) -MF. • Changes to peak stream flows – WAP; • Stream flow, measured over adequate time frame, relative to natural range and variability -
IFPA. • Water discharge and gravel depositions scour depths and locations - NIFC. • Peak Flow Based on Structural Stage - Adams Lake IFPA. • Surface area of open water within management unit and monthly precipitation at coastal versus
inland sites -MF. Instream Flow • % of water with instream flow meeting species flow requirements – PNEIWG and PSFA.
• Percentage of stream miles with instream flow meeting instream water rights, seasonal flow requirements for salmonids, and/or sufficient to allow salmonid access – PNWEIWG.
PHYSICAL HABITAT Channel Structure and Habitat Quality/Quantity
• Physical habitat assessment (channel and riparian character, change in pool-riffle ratio, change in stream width-depth ratio, stream morphology assessment, woody debris, stream discharge, and channel morphology) PNWEIWG.
• Channelization, armourization or dyking of over 50% of the fish frequented length of the stream – Lower Fraser Valley.
• Channel change over time and stream audit comparisons of harvested to control streams for morphology (e.g., channel width, bed material size, substrate size, organic debris) -MF.
• Channel width - NIFC.
• Fish Habitat Risk Index – based on 3 indicators – riparian buffer function, vegetation structure on erodible soils, and sediment filtration. Adams Lake IFPA.
• Habitat condition of red and blue listed species - FC. • Habitat availability for selected species at risk and presence - MF. • Number of spawning, rearing sites and wetlands identified and protected- FC. • Redd locations – NIFC. • Habitat complexity as measured by variance of thalwag depth -PSFA. • Frequency and volume of pools – NIFC. • Density of pools - MF. • Coarse woody debris presence and density- MF. • Coarse woody debris in streams that is added or removed- FC, PSFA • Distribution and characterization of large woody debris per historically anadromous salmonid
stream mile – PNWEIWG. • In-channel piece volume per stream surface area and Volume of large woody debris in channel -
NIFC. • % change in spawning areas – PNWEIWG.
Substrate Characteristics • Sediment loading rates – PNWEIWG, PSFA • Sedimentation and particle size distribution in 1st and 2nd order streams -MF. • Sediment delivery processes and rates, streambed elevation, sediment transport rates in channel,
particle size of surface substrate, percent fines in spawning riffles - NIFC..
- Page 1 of 2 -
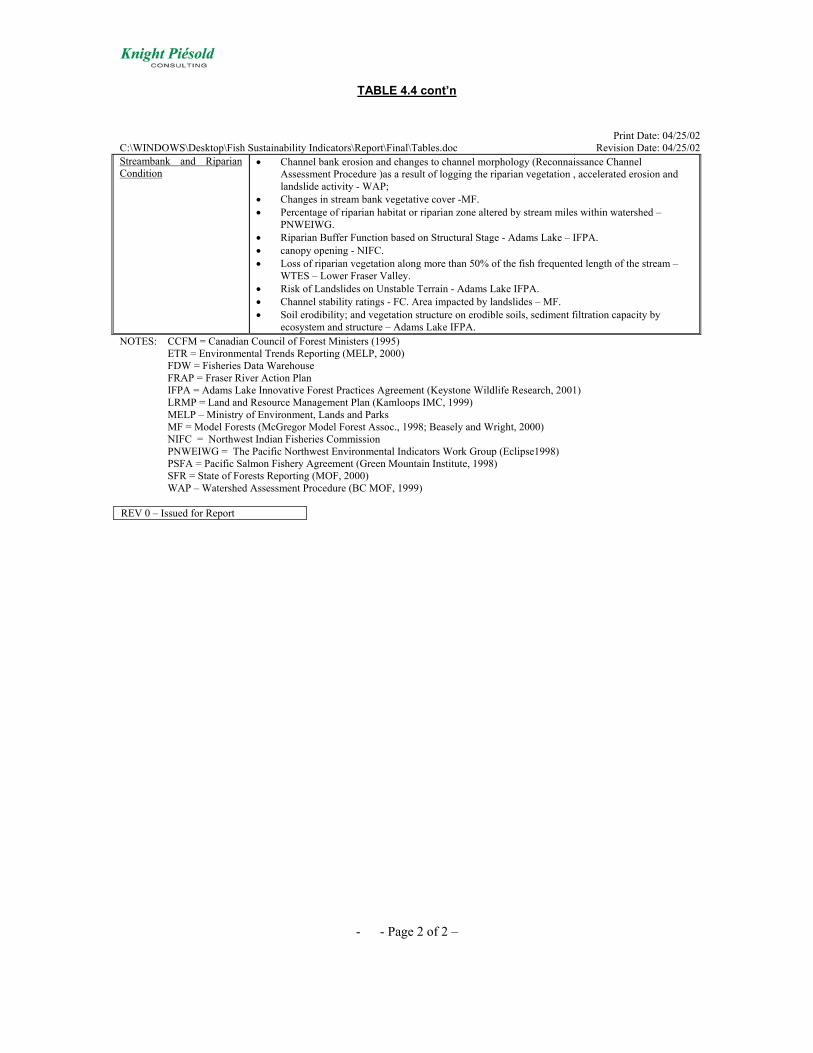
TABLE 4.4 cont’n
Print Date: 04/25/02
C:\WINDOWS\Desktop\Fish Sustainability Indicators\Report\Final\Tables.doc Revision Date: 04/25/02 Streambank and Riparian Condition
• Channel bank erosion and changes to channel morphology (Reconnaissance Channel Assessment Procedure )as a result of logging the riparian vegetation , accelerated erosion and landslide activity - WAP;
• Changes in stream bank vegetative cover -MF. • Percentage of riparian habitat or riparian zone altered by stream miles within watershed –
PNWEIWG. • Riparian Buffer Function based on Structural Stage - Adams Lake – IFPA. • canopy opening - NIFC. • Loss of riparian vegetation along more than 50% of the fish frequented length of the stream –
WTES – Lower Fraser Valley. • Risk of Landslides on Unstable Terrain - Adams Lake IFPA. • Channel stability ratings - FC. Area impacted by landslides – MF. • Soil erodibility; and vegetation structure on erodible soils, sediment filtration capacity by
ecosystem and structure – Adams Lake IFPA. NOTES: CCFM = Canadian Council of Forest Ministers (1995)
ETR = Environmental Trends Reporting (MELP, 2000) FDW = Fisheries Data Warehouse FRAP = Fraser River Action Plan IFPA = Adams Lake Innovative Forest Practices Agreement (Keystone Wildlife Research, 2001) LRMP = Land and Resource Management Plan (Kamloops IMC, 1999) MELP – Ministry of Environment, Lands and Parks MF = Model Forests (McGregor Model Forest Assoc., 1998; Beasely and Wright, 2000) NIFC = Northwest Indian Fisheries Commission PNWEIWG = The Pacific Northwest Environmental Indicators Work Group (Eclipse1998) PSFA = Pacific Salmon Fishery Agreement (Green Mountain Institute, 1998) SFR = State of Forests Reporting (MOF, 2000) WAP – Watershed Assessment Procedure (BC MOF, 1999)
REV 0 – Issued for Report
- - Page 2 of 2 –

I:\RRID\AIB\DTREDGER\Fish Indicators KP Report\[Table 4.5_R0.xls]Stream Attributes_R0
Habitat Component Physical Stream Attribute or Indicator
BC
RIC
4
WR
P FH
AP5
FPC
CA
P6
PNSH
IWG
Wor
ksho
p7
FHIIS
WG
Wor
ksho
p8
EMA
P W
este
rn P
ilot9
Coa
st R
ange
REM
AP10
Snoh
omis
h Pi
lot11
OD
FW12
PAC
FISH
13
NM
FS14
EPA
Cle
an W
ater
Act
15
EPA
RB
P H
QI16
USF
S R
M E
core
gion
17
Tong
ass
Nat
. For
est18
Tota
ls
Landscape/Stream Network Basin Size and Slope X X X 3Stream Order X X X X X 5Lake Influences/Watershed Area X 1Latitude/Elevation/Orientation 0Reach Gradient X X X X X X X 7Geology X 1
Flow Regime Instream Flow X X X X X X X 7Intermittent Flow X X X X 4Flow Hydrology X X X X X 5Depth & Velocity X 1Flood Frequency and Magnitude X 1Drought Frequency and Magnitude X 1Flow Variability X 1
Channel Structure/Habitat Space Channel Type/Geomorphology X X X X X 5Bankfull Depth X X X X X 5Bankfull Width X X X X X X 6Wetted Width X X X X X X 6Bankfull Width/Depth Ratios X X X X X 5Channel Confinement X X X X 4Sinuosity X X X X X X 6Channel Disturbance X X X X X X 6Large Woody Debris X X X X X X X X X X X X X X 14Thalweg Profile X X X X X 5Aquatic Habitat Type X X X X X X 6Spawning Area (pool tail-outs) X X 2Pool Habitat Area/Depth X X X X 4Pool Frequency & Spacing X X X X X X X 7Redd Scour, Dewatering, or Freezing X 1Fish Concealment Features X X X X X 5Overhead Cover X X 2Boulder Cover X X 2Pool Quality/LWD Cover (complex pools) X X X 3Riffle Frequency X 1Floodplain, Side, or Off-channel Habitats X X X X X X 6Pool-riffle Ratios X 1Wetlands X X 2
Sedimentation & Substrate Sediment Loading Rates X X X 3Substrate Quality X X X X X 5Substrate Composition X X X X 4Substrate Mobility (D values) X X X 3Substrate Mean Diameter X X 2% Surface Fines X X X X 4% Embeddedness X X X X 4Residual Pool Depth (pool infilling) X X X X X X X X 8Spawning Gravel Quality & Quantity X X 2
Streambank and Riparian Condition Bank Stability X X X X X X X X 8Lower Bank Angle (undercut) X X X X 4% Alteration X 1Riparian Disturbance Measure X X X X 4Aspect X X 2Human Disturbance X X X 3Canopy Cover/Closure X X X X X 5Vegetation Structure and Complexity X X X X X 5
Totals 24 24 14 12 7 28 28 7 9 8 13 6 14 8 6
Notes:1. Checklist is based on a subjective evaluation and is for illustrative purposes only. Please consult the reference material for detailed information on the specific application of the variable.2. X = quantitative, semi-quantitative, or qualitative application of the habitat variable.3. Shaded areas identify habitat variables that are supported by numeric criteria.
5. Johnston, N.T. and P.A. Slaney. 1996. Watershed Restoration Technical Circular No. 8, Fish Habitat Assessment Procedures, Level 1 Field Assessment6. Province of British Columbia. 1996. Channel Assessment Procedure Guidebook. Forest Practices Code, Guidebook. B.C. Min. For., Victoria, B.C.
8. Eclipse Environmental Consulting. 1998. Workshop Report: Salmon Habitat Indicators and Data Sharing Workshop. Sponsored by the Fish Habitat Inventory and Information Working Group. Vancouver, BC.
10. Herger, L.G. and G. Hayslip. 2000. Ecological condition of streams in the Coast Range ecoregion of Oregon and Washington. EPA-910-R-00-002. U.S. Environmental Protection Agency, Region 10, Seattle, Washinigton. 11. Ward, W.J. 1999. Pacific Northwest Salmon Habitat Indicators Pilot Project, Snohomish River Basin. Washington State Department of Ecology.12. Foster, S.C., C.H. Stein, and K.K. Jones. 2001. A guide to interpreting stream survey reports. Edited by P.A. Bowers. Information Reports 2001-06. Oregon Department of Fish and Wildlife, Portland.
Rev 0 - Issued for Report
06/25/0212/06/01
Print Date:Revision Date:
16. Barbour, M.T., J. Gerritsen, B.D. Snyder, and J.B. Stribling. 1999. Rapid Bioassessment Protocols for Use in Streams and Wadeable Rivers: Periphyton, Benthic Macroinvertebrates and Fish, Second Edition. EPA 841-B-99-002. U.S. Environmental Protection Agency; Office of Water; Washington, D.C. 17. Overton, C. Kerry; Radko, Michael A.; Nelson, Rodger L. 1993. Fish habitat conditions: using the Northern/Intermountain Regions' inventory procedures for detecting differences on two differently managed watersheds. Gen. Tech. Rep. INT-300. Ogden, UT: U.S. Department of Agriculture, Forest Service, Intermountain Research Station. 14 p.
4. Resources Inventory Committee, 2001. Reconnaissance (1:20 000) Fish and Fish Habitat Inventory Standards and Procedures, Version 2.0. Prepared by BC Fisheries Information Services Branch for the Resources Inventory Committee.
9. Peck, D.V., J.M. Lazorchak, and D.J. Klemm (editors). Unpublished draft. Environmental Monitoring and Assessment Program -Surface Waters: Western Pilot Study Field Operations Manual for Wadeable Streams. EPA/XXX/X-XX/XXXX. U.S. Environmental Protection Agency, Washington, D.C.
13. FS (Forest Service) and BLM (Bureau of Land Management). 1995. Environmental assessment for the implementation of interim strategies for managing anadromous fish-producing watersheds in eastern Oregon and Washington, Idaho, and portions of California (PACFISH). U.S. Department of Agriculture, Forest Service and the U.S. Department of the Interior, Bureau of Land Management, Washington, D.C.
18. Coghill, K. 1996. Unpublished report: An evaluation of the statistical power of existing stream survey dat on the Tongass National Forest, with recommendations for an improved monitoring program. PNW Research Station, JunAK. 9p.
7. PNWEIWG (Pacific Northwest Environmental Indicator Work Group). 1998. Toward "A Small, but Powerful" Set of Regional Salmon Habitat Indicators for the Pacific Northwest. Prepared for the Pacific Northwest Salmon Habitat Indicators Work Group by the Green Mountain Institute for Environmental Democracy.
TABLE 4.5MINISTRY OF SUSTAINABLE RESOURCE MANAGEMENT
INDICATORS OF FISH SUSTAINABILITY: MANAGED AND RARE FISH IN FOREST ENVIRONMENTS
CHECKLIST OF PHYSICAL STREAM ATTRIBUTES AND INDICATORS USED IN SELECTED INVENTORY AND MONITORING PROGRAMSIN BRITISH COLUMBIA, THE U.S. PACIFIC NORTHWEST, AND ALASKA
14. NMFS (National Marine Fisheries Service). 1996. Making Endangered Species Act determinations of effect for individual or grouped actions at the watershed scale. U.S. Department of Commerce, National Oceanic and Atmospheric Administration, National Marine Fisheries Service, Portland, Oregon. 15. Bauer, Stephen B. and Stephen C. Ralph. 1999. Aquatic habitat indicators and their application to water quality objectives within the Clean Water Act. EPA-910-R-99-014. US Environmental Protection Agency, Region 10, Seattle Wa.

TABLE 4.6
MINISTRY OF SUSTAINABLE RESOURCE MANAGEMENT
INDICATORS OF FISH SUSTAINABILITY: MANAGED AND RARE FISH IN FOREST ENVIRONMENTS
SHORT-LIST OF POTENTIAL PHYSICAL HABITAT AND HYDROLOGY INDICATORS.
Print Date: 04/25/02 C:\WINDOWS\Desktop\Fish Sustainability Indicators\Report\Final\Tables.doc Revision Date: 04/25/02
Habitat Component Indicator
Flow Regime Amount of Useable Habitat Space
Bankful Width to Depth Ratio
Variance In Thalweg Depths
Large Woody Debris
Residual Pool Depth
Channel Structure
and Habitat Space
Pool Frequency and Area
Substrate Composition And Size
Sedimentation and Substrate Residual Pool Volume Filled with Fine Sediment
Riparian and Streambank Canopy Cover and Streambank Stability REV 0 – Issued for Report

TABLE 5.1
MINISTRY OF SUSTAINABLE RESOURCE MANAGEMENT INDICATORS OF FISH SUSTAINABILITY: MANAGED AND RARE FISH IN FOREST ENVIRONMENTS
RELEVANCE AND SENSITIVITY OF DIRECT INDICATORS OF FISH SUSTAINABILITY, STATUS AND TRENDS
Print Date: 04/25/02 C:\WINDOWS\Desktop\Fish Sustainability Indicators\Report\Final\Tables_R0.doc Revision Date: 04/25/02
Indicator Relevance/sensitivity Comments Managed Non-
commercial
Individual Least relevant direct indicator(s) Condition 2-3 4 May be sensitive to enrichment/food availability
Population Most relevant for managed species and some rare species Distribution 1-2 2-3 Abundance 1 2 Most relevant population indicator, if only freshwater life stages considered
Growth 2 3 Age structure 2 3
Reproductive capacity 2 3
These three indicators can collectively be used to predict abundance. However, density dependence and other trade-offs may occur, which limits the usefulness of each as a stand-alone indicator.
Community Most relevant for non-commercial species Sentinel taxa, guilds 3 1-2 Gravel spawners, cold-water species, salmonids most sensitive?
Richness 3 1-2 More relevant, but less sensitive than sentinel taxa, guilds? NOTES: Scale: 1(highly relevant/sensitive) to 4 (not relevant/sensitive).
Individual and population indicators were scored as more relevant/sensitive for managed versus non-commercial species to account for additional stress from recreational or commercial fishing.
REV 0 – Issued for Report

TABLE 5.2
MINISTRY OF SUSTAINABLE RESOURCE MANAGEMENT INDICATORS OF FISH SUSTAINABILITY: MANAGED AND RARE FISH IN FOREST ENVIRONMENTS
SAMPLE COLLECTION AND ANALYSIS COSTS FOR DIRECT INDICATORS OF FISH SUSTAINABILITY AND STATUS
Print Date: 04/25/02 C:\WINDOWS\Desktop\Fish Sustainability Indicators\Report\Final\Tables_R0.doc Revision Date: 04/25/02
Indicator Field Lab Equip-ment
Comments
Individual Fewer fish, lower sampling effort required? Condition 2-4 1 3-4 Weight and length can be measured in field
Population Distribution 2-4 1 2-4 Fewer fish, lower sampling effort required? Abundance 4 1 3-4 More frequent (i.e., <annual) sampling required for some life stages
Greater sampling effort required for abundance than for other population indicators?
Growth 2-4 2-3 3-4 Age structure 3-4 2-3 3-4
Fish must be aged in lab; fish may have to be sacrificed for age determination (e.g., with otoliths)
Reproductive capacity 3-4 2-3 3-4 Ova must be counted in lab, although ovaries can be weighed in field Fish must be sacrificed
Community All measurements can be made in field Sentinel taxa, guilds 3-4 1 3-4 Abundance-based indicators may require greater sampling effort
Richness 2-4 1 2-4 NOTES: Scale: 1 (=low cost) to 4 (=high cost).
Smpling frequency can be assumed annual (=1) with exceptions as noted. Lab includes measurement/analysis (Cost≥2, if required); Cost=1 if only data analysis/summary required. An additional "penalty" was added to Lab costs for growth, age structure and reproductive capacity to account for the fact that fish may or must be sacrificed. Equipment costs will usually be greater for larger streams, lakes and fish.
REV 0 – Issued for Report

TABLE 5.3
MINISTRY OF SUSTAINABLE RESOURCE MANAGEMENT INDICATORS OF FISH SUSTAINABILITY: MANAGED AND RARE FISH IN FOREST ENVIRONMENTS
DATA AVAILABILITY FOR DIRECT INDICATORS OF FISH SUSTAINABILITY AND STATUS
Print Date: 04/25/02 C:\WINDOWS\Desktop\Fish Sustainability Indicators\Report\Final\Tables_R0.doc Revision Date: 04/25/02
Indicator Managed Other Comments Individual Literature standards available for some species
Condition 3 4 Weight, length routinely measured, but rarely (?) reported, recorded Population Data availability greatest for salmonids
Distribution 2 2-3 Abundance 2-3 3
Growth 3-4 4 Age structure 3-4 4
Age measured, reported, recorded less frequently than weight, length
Reproductive capacity 3-4 4 Less frequently measured, reported, recorded Community Data may be available for selected watersheds
Requirements for standards development greater than for any other indicator? Sentinel taxa, guilds 4 4 Useful abundance data virtually non-existent
Richness 4 3-4 Data may be available at drainage/watershed levels NOTES: Scale: 1 (extensive data available) to 4 (little or no available data) .
Data availability includes data for status and trend monitoring, and for development and validation of standards.
REV 0 – Issued for Report

TABLE 5.4
MINISTRY OF SUSTAINABLE RESOURCE MANAGEMENT INDICATORS OF FISH SUSTAINABILITY: MANAGED AND RARE FISH IN FOREST ENVIRONMENTS
OVERALL EVALUATION OF USEFULNESS OF DIRECT INDICATORS FOR ASSESSING SUSTAINABILITY AND STATUS OF MANAGED FISH SPECIES
Print Date: 04/25/02 C:\WINDOWS\Desktop\Fish Sustainability Indicators\Report\Final\Tables_R0.doc Revision Date: 04/25/02
Indicator Relevance/ Sensitivity
Costs Data Availability
Overall usefulness
Individual Condition 2-3 1-3 3 3
Population Distribution 1-2 2-3 2 1-2 Abundance 1 3-4 2-3 1-2
Growth 2 3-4 3-4 2 Age structure 2 3-4 3-4 2
Reproductive capacity 2 3-4 3-4 2 Community
Sentinel taxa, guilds 3 3-4 4 3 Richness 3 2-3 4 3
NOTES: Scales for relevance/sensitivity, costs and data availability provided in Tables 5.1 to 5.3. Overall usefulness: 1= highly useful, with only minor limitations; 4= not useful, and/or with severe limitations. These evaluations are also largely applicable to bull trout.
REV 0 – Issued for Report

TABLE 5.5
MINISTRY OF SUSTAINABLE RESOURCE MANAGEMENT INDICATORS OF FISH SUSTAINABILITY: MANAGED AND RARE FISH IN FOREST ENVIRONMENTS
OVERALL EVALUATION OF USEFULNESS OF DIRECT INDICATORS FOR ASSESSING SUSTAINABILITY AND STATUS OF NON-COMMERCIAL
SPECIES Print Date: 04/25/02 C:\WINDOWS\Desktop\Fish Sustainability Indicators\Report\Final\Tables_R0.doc Revision Date: 04/25/02
Indicator Relevance/ sensitivity
Costs Data Availability
Overall Usefulness
Individual Condition 4 1-3 4 4
Population Distribution 2-3 2-3 2-3 2-3 Abundance 2 3-4 3 3
Growth 3 3-4 3-4 3-4 Age structure 3 3-4 3-4 3-4
Reproductive capacity 3 3-4 4 3-4 Community
Sentinel taxa, guilds 1-2 3-4 4 2 Richness 1-2 2-3 3-4 2
NOTES: Scales for relevance/sensitivity, costs and data availability provided in Tables 5.1 to 5.3. Overall usefulness: 1= highly useful, with only minor limitations; 4= not useful, and/or with severe limitations. Population indicators would be most useful for some rare species, and community indicators more useful for others.
REV 0– Issued for Report

TABLE 5.6
MINISTRY OF SUSTAINABLE RESOURCE MANAGEMENT INDICATORS OF FISH SUSTAINABILITY: MANAGED AND RARE FISH IN FOREST ENVIRONMENTS
RELEVANCE AND SENSITIVITY OF INDIRECT INDICATORS OF FISH SUSTAINABILITY, STATUS AND TRENDS
Print Date: 04/25/02 C:\WINDOWS\Desktop\Fish Sustainability Indicators\Report\Final\Tables_R0.doc Revision Date: 04/25/02
Indicator Relevance Sensitivity Overall This review U.S. EPA This review U.S. EPA This review Biological water quality Streams Lakes Streams Lakes Streams Lakes
Benthic invertebrates 1 2 1 1
2-3
1 1 2-3
Plankton, Periphyton, Chlorophyll a 2 1 2 1-2 2-3 1-3 1-2 1-3 Chemical water quality
Chemical water quality index 2-3 2-3 NA 2-3 2-3 NA 2-3 2-3 pH 3 2 3-4 3 2-3 3 3 2-3
Conductivity, TDS 1-2 2 NA 2-3 2-3 NA 1-3 2-3 Turbidity, TSS 1-2 4 1-2 1 4 1-3 1-2 4
Nutrients 3 1 3 1-2 1-2 1-3 2 1-2 Temperature 1 1-2 1-3 1 3 1-2 1 1-3
Dissolved oxygen 1-3 1-2 1 1-2 1 1-3 1-2 1-2
Stream flow (streams) Peak flows 2-3 2-3 NA 1-3 2-3 Low flows 2 2 NA 1-3 2
Instream flow 1-2 NA 1 NA 1 Physical habitat (streams)
Width*:depth 1 2 1 1-2 1 Variance in thalweg depths 2 2 1 1-2 2
Large woody debris 2 1 1-2 1-4 1-2 Residual pool depth 1 1 1 1-2 1
Pool frequency and area 1 1 1 1-2 1 Substrate composition 1 1-2 1 1-2 1
Bank stability* 2 2 1 1-2 1-1 Canopy cover* 2 2 1-2 1-3 1-2
NOTES: Scale: 1(highly relevant/sensitive) to 4 (not relevant/sensitive); S=streams; L=lakes. EPA = MacDonald et al. (1991); see Box 1 for details; refers to streams only. Relevance and sensitivity ranks were based on both cold- and warm-water species. Sensitivity from MacDonald et al. (1991) was based on their sensitivities to forest harvest, road construction and grazing. Our ranks reflect sensitivity to any stressor, except that a range (e.g., 1-2) is provided when an indicator may be more specific than general. * Derived from map-based data on a coarse scale.
REV 0 – Issued for Report

TABLE 5.7
MINISTRY OF SUSTAINABLE RESOURCE MANAGEMENT INDICATORS OF FISH SUSTAINABILITY: MANAGED AND RARE FISH IN FOREST ENVIRONMENTS
SAMPLE COLLECTION AND ANALYSIS COSTS FOR INDIRECT INDICATORS OF FISH SUSTAINABILITY AND STATUS
Print Date: 04/25/02 C:\WINDOWS\Desktop\Fish Sustainability Indicators\Report\Final\Tables_R0.doc Revision Date: 04/25/02
Indicator Frequency Field (per time) Lab Equipment This review U.S. EPA This review U.S. EPA This review U.S. EPA This review U.S. EPA Biological water quality
Benthic invertebrates 1 L-M 1-2 L-M 3 M-H 2 L-M Plankton, Periphyton, Chlorophyll a 1-2 L-M 1-3 L 3-4 H 1-2 L-M
Chemical water quality Chemical water quality index NA 2-3 NA 4 NA 2-3 NA
pH 2-3 L-M 1 L 1 L 2 L Conductivity, TDS 2-3 NA 1 NA 1 NA 1-2 NA
Turbidity, TSS 4 H 1-2 L-M 1-2 L-M 2 L-M Nutrients 2 L-H 2 L 2-3 M 1 L
Temperature 3 L-M 1 L 1 L 1-2 L Dissolved oxygen 2 L-M 1-2 L 1 L 2 L-M
Stream flow Peak flows NA H 2-3 M-H NA H 1or 4* M-H Low flows NA M 2-3 M-H NA L-H 1or 4* M-H
Instream flow 3 NA 2-3 NA NA NA 1or 4* NA Physical habitat (streams)
Width:depth 1 L 1-2 M 1 L 1 L Variance in thalweg depths 1 L 3-4 M 2-3 M 2 M
Large woody debris 1 L 2-3 M 1 L 1 L Residual pool depth 1 L 2-3 M 1 L-M 1 L-M
Pool frequency and area 1 L 2-3 M 2 M 1 L Substrate composition 1 L 2-3 M 2 M 1 L
Bank stability 1 L 1-2 L-M 1 L 1 L Canopy cover 1 L 1-2 L-M 1 L-M 1 L-M
NOTES: Cost: 1(low cost) to 4 (highcost) L=Low; M=Medium; H=High. Frequency: 1=Annual or less frequent; 2=several times annually; 3=monthly; 4=more frequently. *1 = sites with existing WSC stations; 4 = sites with no stations.
REV 0 – Issued for Report

TABLE 5.8
MINISTRY OF SUSTAINABLE RESOURCE MANAGEMENT INDICATORS OF FISH SUSTAINABILITY: MANAGED AND RARE FISH IN FOREST ENVIRONMENTS
DATA AVAILABILITY FOR INDIRECT INDICATORS OF FISH SUSTAINABILITY AND STATUS
Print Date: 04/25/02 C:\WINDOWS\Desktop\Fish Sustainability Indicators\Report\Final\Tables_R0.doc Revision Date: 04/25/02
Indicator Data availability for: Monitoring Standards Development Managed species Non-commercial/rare species Biological water quality Streams Lakes Streams Lakes Streams Lakes
Benthic invertebrates 3 4 3 4 3 4 Plankton/periphyton 3-4 3-4 3-4 3-4 3-4 1-3
Chlorophyll a 3-4 1-2* 1-2 1-2 2-3 2-3 Chemical water quality
Chemical water quality index 1-4 2-4 2-4 3-4 3-4 pH 1-2* 1-2 2-3 2-3 3-4
Conductivity 1-2* 1-2 2-3 2-3 2-4 Turbidity, TSS 1-2* 1-2 2-3 2-3 3-4
Nutrients 2-4 2-3 1-2 2-3 1-3 Temperature 1* 1-2 1-3 1-2 2-3
Dissolved oxygen 1-2* 1-2 1-3 1-3 1-2 Stream flow (Stream)
Peak flows 2-3 NA NA Base flows 2-3 NA NA
Instream flow 2-3 2-3 3-4 Physical habitat (streams)
Width:depth 1-2 2-3 2-3 Variance in thalweg depths 3-4 3-4 3-4
Large woody debris 2-3 2-3 2-3 Residual pool depth 2-3 2-3 3-4
Pool frequency and area 2-3 2-3 3-4 Substrate composition 2-3 2-3 2-3
Bank stability 1-2 2-3 2-3 Canopy cover 1-2 2-3 3-4
NOTES: Scale: 1 (extensive data available) to 4 (little or no available data). Water quality criteria were assumed to be standards; most are based on tests conducted on salmonids. Data availability includes data for status and trend monitoring, and for development and validation of standards. * Based on AECD (Perrin and Blyth, 1998).
REV 0 – Issued for Report

TABLE 5.9
MINISTRY OF SUSTAINABLE RESOURCE MANAGEMENT INDICATORS OF FISH SUSTAINABILITY: MANAGED AND RARE FISH IN FOREST ENVIRONMENTS
OVERALL USEFULNESS OF INDIRECT INDICATORS FOR ASSESSING SUSTAINABILITY AND STATUS OF FISH AND FISH HABITAT IN STREAMS
Print Date: 04/25/02 C:\WINDOWS\Desktop\Fish Sustainability Indicators\Report\Final\Tables_R0.doc Revision Date: 04/25/02
Indicator Relevance/ Sensitivity
Costs Data availability
Managed Species Other species Biological water quality
Benthic invertebrates 1 1-3 3 3 Plankton, Periphyton, Chlorophyll a 1-2 1-4 3-4 4?
Chemical water quality
Chemical water quality index 2-3 2-4 1-4 1-4
pH 3 1-3 1-2 2-3 conductivity, TDS 1-3 1-3 1-2 2-3
Turbidity, TSS 1-2 1-4 1-2 2-3 Nutrients 1-3 1-3 2-4 2-4
Temperature 1 1-2 1 1-2 Dissolved oxygen 1-2 1-2 1-2 2-3
Stream flow Peak flows 2-3 1or 4* 1-2 1-2 Low flows 2 1or 4* 1-2 1-2
Instream flow 1-2 1or 4* 2 3-4 Physical habitat (streams)
Width:depth 1 1-2 1-2 1-2 Variance in thalweg depths 2 1-4 3-4 3-4
Large woody debris 1-2 2-3 3 3-4 Residual pool depth 1 2-3 2-3 3-4
Pool frequency and area 1 2-3 2-3 3-4 Substrate composition 1 2-3 2-3 3-4
Bank stability 1-2 1-2 1-2 2-3 Canopy cover 1-2 1-2 1-2 2-3
NOTES: Scale: 1(highly relevant/sensitive) to 4 (not relevant/sensitive). Cost: 1(low cost) to 4 (highcost) Data: 1 (extensive data available) to 4 (little or no available data). * 1 = sites with existing WSC stations; 4 = sites with no stations.
REV 0 – Issued for Report
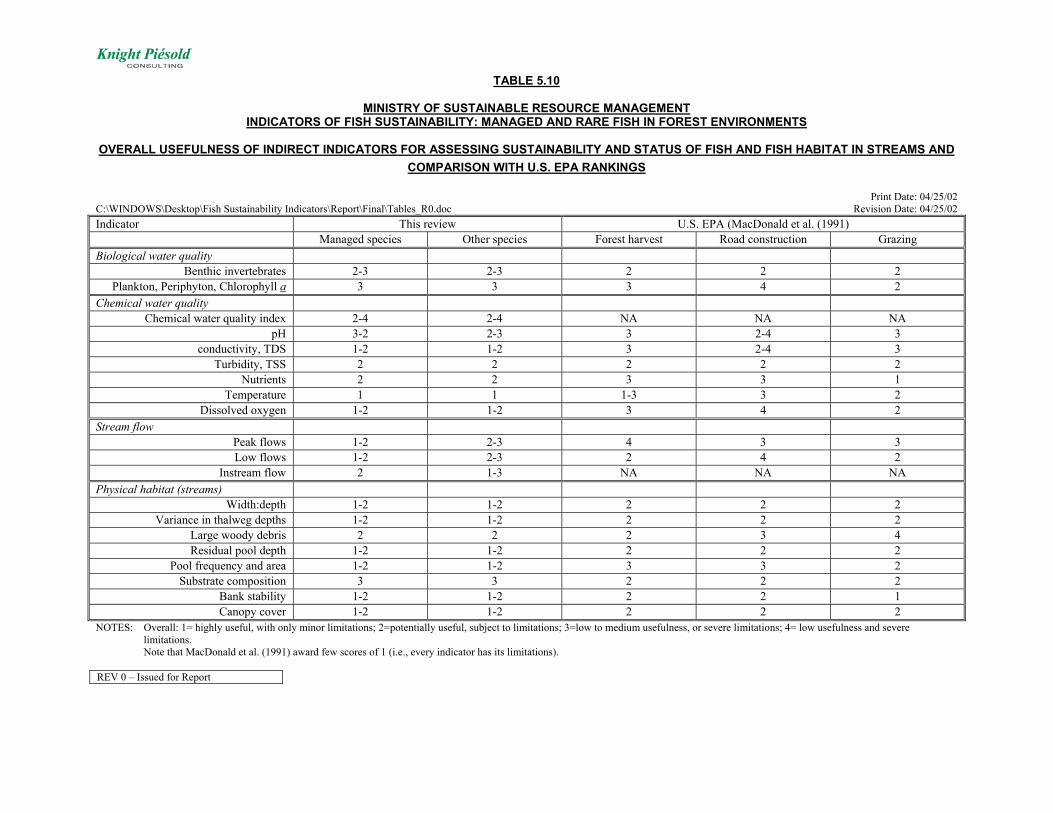
TABLE 5.10
MINISTRY OF SUSTAINABLE RESOURCE MANAGEMENT INDICATORS OF FISH SUSTAINABILITY: MANAGED AND RARE FISH IN FOREST ENVIRONMENTS
OVERALL USEFULNESS OF INDIRECT INDICATORS FOR ASSESSING SUSTAINABILITY AND STATUS OF FISH AND FISH HABITAT IN STREAMS AND
COMPARISON WITH U.S. EPA RANKINGS Print Date: 04/25/02 C:\WINDOWS\Desktop\Fish Sustainability Indicators\Report\Final\Tables_R0.doc Revision Date: 04/25/02
Indicator This review U.S. EPA (MacDonald et al. (1991) Managed species Other species Forest harvest Road construction Grazing
Biological water quality Benthic invertebrates 2-3 2-3 2 2 2
Plankton, Periphyton, Chlorophyll a 3 3 3 4 2
Chemical water quality Chemical water quality index 2-4 2-4 NA NA NA
pH 3-2 2-3 3 2-4 3 conductivity, TDS 1-2 1-2 3 2-4 3
Turbidity, TSS 2 2 2 2 2 Nutrients 2 2 3 3 1
Temperature 1 1 1-3 3 2 Dissolved oxygen 1-2 1-2 3 4 2
Stream flow Peak flows 1-2 2-3 4 3 3 Low flows 1-2 2-3 2 4 2
Instream flow 2 1-3 NA NA NA
Physical habitat (streams) Width:depth 1-2 1-2 2 2 2
Variance in thalweg depths 1-2 1-2 2 2 2 Large woody debris 2 2 2 3 4 Residual pool depth 1-2 1-2 2 2 2
Pool frequency and area 1-2 1-2 3 3 2 Substrate composition 3 3 2 2 2
Bank stability 1-2 1-2 2 2 1 Canopy cover 1-2 1-2 2 2 2
NOTES: Overall: 1= highly useful, with only minor limitations; 2=potentially useful, subject to limitations; 3=low to medium usefulness, or severe limitations; 4= low usefulness and severe limitations. Note that MacDonald et al. (1991) award few scores of 1 (i.e., every indicator has its limitations).
REV 0 – Issued for Report

TABLE 5.11
MINISTRY OF SUSTAINABLE RESOURCE MANAGEMENT INDICATORS OF FISH SUSTAINABILITY: MANAGED AND RARE FISH IN FOREST ENVIRONMENTS
OVERALLUSEFULNESS OF INDIRECT INDICATORS FOR ASSESSING SUSTAINABILITY AND STATUS OF FISH AND FISH HABITAT IN LAKES
Print Date: 04/25/02 C:\WINDOWS\Desktop\Fish Sustainability Indicators\Report\Final\Tables_R0.doc Revision Date: 04/25/02
Indicator Relevance/ sensitivity
Costs Data availability Overall Rank
Managed species
Other species
Managed Species
Other Species
Biological water quality Benthic invertebrates 2-3 3 3 3 3 3
Plankton, Periphyton, Chlorophyll a
2 3 3 3 3 3
Chemical water quality Chemical water quality index 2-3 2-4 3 3 2 2
pH 2-3 1-3 2 2 1-2 1-2 Conductivity, TDS 2-3 1-3 2 2 1-2 1-2
Turbidity, TSS 4 1-4 2 2 2-3 2-3 Nutrients 1 2 2 2 1-2 1-2
Temperature 2 1 1 1 1-2 1-2 Dissolved oxygen 2 1-2 2 2 1-2 1-2
NOTES: Overall: 1= highly useful, with only minor limitations; 2=potentially useful, subject to limitations; 3=low to medium usefulness, or severe limitations; 4= low usefulness and severe limitations. Cost: 1(low cost) to 4 (highcost) Data: 1 (extensive data available) to 4 (little or no available data).
REV 0 – Issued for Report

TABLE 6.1
MINISTRY OF SUSTAINABLE RESOURCE MANAGEMENT INDICATORS OF FISH SUSTAINABILITY: MANAGED AND RARE FISH IN FOREST ENVIRONMENTS
RECOMMENDED TIER I INDICATORS
FOR ASSESSING FISH SUSTAINABILITY AND STATUS IN B.C. Print Date: 04/25/02
C:\WINDOWS\Desktop\Fish Sustainability Indicators\Report\Final\Tables_R0.doc Revision Date: 04/25/02
Suitable for use for: Indicator Managed
species1 Rare species Non-commercial
species Direct indicators
Population—distribution
Yes Bull trout4 No
Population—abundance
Yes Bull trout4 No
Indirect indicators Temperature Streams Bull trout4 No?
Instream flow(s)2 Streams Bull trout4 No Physical habitat3 Streams Bull trout4 No
Chlorophyll a Lakes? No? No? Nutrients Lakes? No? No?
NOTES: Tier I indicators are indicators for which data exist for a reasonably extensive subset of locations or regions "?"=data exist for the indicator, which is a measure of fish habitat. Inferring the status of fish populations or communities from those data may be problematic 1—Applicable to freshwater life stages of Pacific salmon and steelhead, and to freshwater-resident rainbow trout; less applicable, or not applicable, to other managed salmonids (e.g., cutthroat trout, whitefish, Dolly Varden) and non-salmonids (e.g., walleye). 2—Applies to locations with existing Water Survey of Canada (WSC) and other discharge stations and data; establishing new stations would be costly. 3—Effectively, any habitat indicators or variables recorded as part of Channel Assessment Procedures (CAP) and/or provided in the B.C. Watershed Atlas 4—Bull trout is useful only for interior areas.
REV 0 – Issued for Report
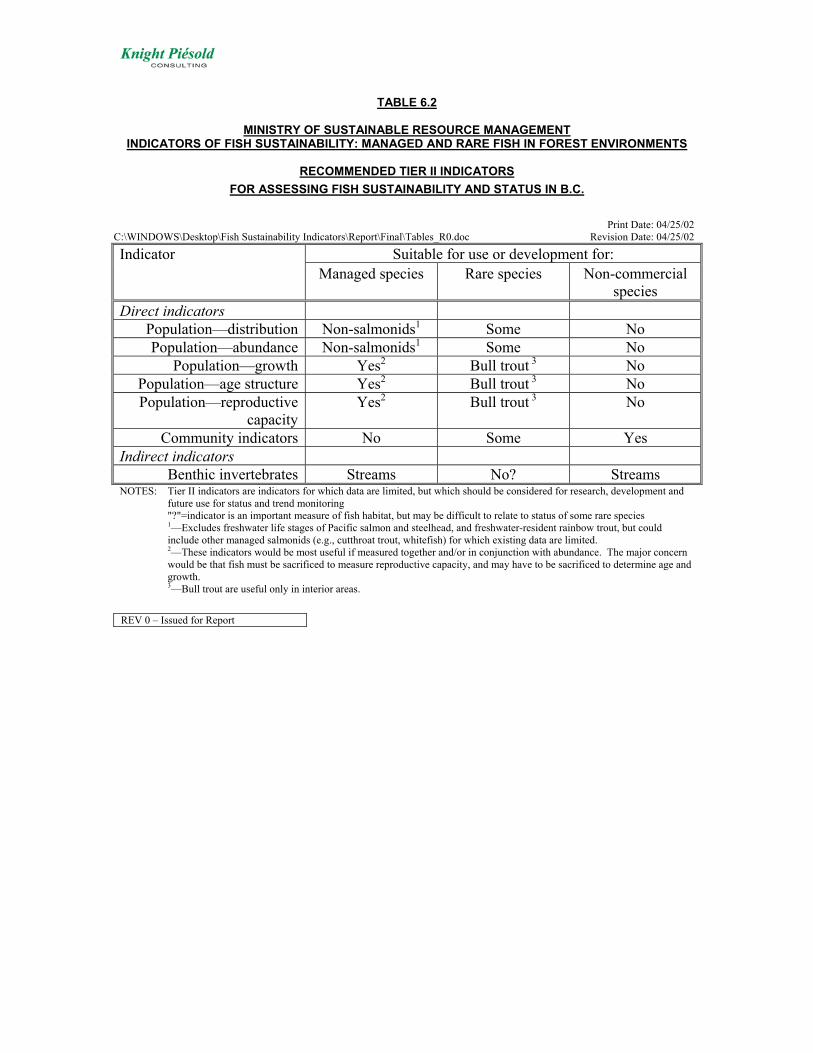
TABLE 6.2
MINISTRY OF SUSTAINABLE RESOURCE MANAGEMENT INDICATORS OF FISH SUSTAINABILITY: MANAGED AND RARE FISH IN FOREST ENVIRONMENTS
RECOMMENDED TIER II INDICATORS
FOR ASSESSING FISH SUSTAINABILITY AND STATUS IN B.C.
Print Date: 04/25/02
C:\WINDOWS\Desktop\Fish Sustainability Indicators\Report\Final\Tables_R0.doc Revision Date: 04/25/02
Suitable for use or development for: Indicator Managed species Rare species Non-commercial
species Direct indicators
Population—distribution Non-salmonids1 Some No Population—abundance Non-salmonids1 Some No
Population—growth Yes2 Bull trout 3 No Population—age structure Yes2 Bull trout 3 No Population—reproductive
capacity Yes2 Bull trout 3 No
Community indicators No Some Yes Indirect indicators
Benthic invertebrates Streams No? Streams NOTES: Tier II indicators are indicators for which data are limited, but which should be considered for research, development and
future use for status and trend monitoring "?"=indicator is an important measure of fish habitat, but may be difficult to relate to status of some rare species 1—Excludes freshwater life stages of Pacific salmon and steelhead, and freshwater-resident rainbow trout, but could include other managed salmonids (e.g., cutthroat trout, whitefish) for which existing data are limited. 2—These indicators would be most useful if measured together and/or in conjunction with abundance. The major concern would be that fish must be sacrificed to measure reproductive capacity, and may have to be sacrificed to determine age and growth. 3—Bull trout are useful only in interior areas.
REV 0 – Issued for Report

TABLE 6.3
MINISTRY OF SUSTAINABLE RESOURCE MANAGEMENT INDICATORS OF FISH SUSTAINABILITY: MANAGED AND RARE FISH IN FOREST ENVIRONMENTS
IMPORTANT AND/OR INEXPENSIVE SUPPLEMENTARY OR MODIFYING VARIABLES FOR
ASSESSING FISH SUSTAINABILITY AND STATUS Print Date: 04/25/02
C:\WINDOWS\Desktop\Fish Sustainability Indicators\Report\Final\Tables_R0.doc Revision Date: 04/25/02
Map-based variables Field-based variables Streams Lakes Streams Lakes
Biogeographical or geological region (i.e. ecoregion)
Watershed or drainage basin unit Elevation
Temperature, pH, conductivity, dissolved oxygen
Turbidity Chlorophyll a Stream order Stream gradient
Lake area Mean depth? Depth, width,
velocity, and other habitat variables *
Mean depth, littoral:profundal
area, littoral slope? NOTE: These are variables that can be measured in any fish status and trend monitoring program for relatively low cost.
* CAP, WAP, FHA variables
REV 0 – Issued for Report

27
TABLE 6.4
MINISTRY OF SUSTAINABLE RESOURCE MANAGEMENT INDICATORS OF FISH SUSTAINABILITY: MANAGED AND RARE FISH IN FOREST ENVIRONMENTS
COMPARISON OF RECOMMENDED INDICATORS TO HYPOTHETICAL IDEAL INDICATOR FOR ASSESSING SUSTAINABILITY AND STATUS OF FISH
AND FISH HABITAT
Print Date: 04/25/02
C:\WINDOWS\Desktop\Fish Sustainability Indicators\Report\Final\Tables_R0.doc Revision Date: 04/25/02 Fish and Fosh Habitat Condition Fish Water Quality Physical Habitat INDICATOR TYPE Variables Community
Biodiversity Population
Health/Productivity Water
Quality Aquatic
Production Channel Structure
Habitat Space/Quantity Habitat
Complexity/Quality Fluvial Erosion
Riparian Condition
IDEAL H H H H H H H H DIRECT
Community Indicators Sentinel Taxa or Guild indicators (i.e. bull trout)
H L L L M M M M
Richness (total for subgroups) H L L L M H M M Population Indicators Distribution of Salmonids M M L L L M M M
Distribution of red and blue listed species
H M L L L M M M
Abundance of salmonids (redds, juveniles, smolts, adults)
H H M M M M M M
Age (non-lethal methods) - H - L - - - - Growth (e.g. size-at-age) - H M H - - - -
INDIRECT
Biological water quality Benthic invertebrates M1 M2 H1 H2 H H H M Plankton/periphyton/chlorophyll a M1 M2 H1 H2 H H H M
Chemical water quality Chemical water quality index -
pH - - H L - - - - conductivity, TDS, Alkalinity - M3 H M - - M M Turbidity, TSS - M3 H M - - H H Nutrients - M3 H H - - M M Temperature - - H M - - - H Dissolved oxygen - - H - - - L
Stream flow Peak flows - - - - H - - M Low flows - - - - H - - - Instream flow M4 M4 - - H - - -
Physical habitat (streams) Width:depth M4 M4 - - H M - - Variance in thalweg depths M4 M4 - - H H - M Large woody debris M4 M4 - - H H - H Residual pool depth M4 M4 - - H H M M Pool frequency and area M4 M4 - - H H - - Substrate composition M4 M4 - - - M H L Bank stability M4 M4 M - - L H H Canopy cover M4 M4 M - - L M H
NOTES: H = High, M = Medium and Low Rrelevance/Sensitivity to fish commmunity, population, and habitat condition, * 1 = sites with existing WSC stations; 4 = sites with no stations. 1 – Measures of species composition/community structure 2 – Measures of biomass (e.g. chlorphyll a) 3 – Water quality as a predictor of fish production (e.g. , McFadden and Cooper, 1962; Ptolemy, 1993; Newcombe and Jensen, 1996) 4 – Habitat variables as a predictor of fish community/population based on habitat suitability or capability.models.
REV 0 – Issued for Report