
LKB1 and AMPK and the cancer-metabolism link - BioMed Central

Type of file: pdf Size of file: 0 KB Title of file for HTML: Supplementary Information Description: Supplementary Figures Type of file: xlsx Size of file: 0 KB Title of file for HTML: Supplementary Data 1 Description: Schematic description of transcription factor binding motifs in Foxp3, Stat4 and Il12rb2 locus. Type of file: xlsx Size of file: 0 KB Title of file for HTML: Supplementary Data 2 Description: Primers and peptide sequences. Type of file: xlsx Size of file: 0 KB Title of file for HTML: Supplementary Data 3 Description: Gene expression alterations in Lkb1-deficient Treg cells 1.5 fold change. Type of file: xlsx Size of file: 0 KB Title of file for HTML: Supplementary Data 4 Description: Gene expression alterations in TGF-βR2-deficient Treg cells 1.5 fold change. Type of file: xlsx Size of file: 0 KB Title of file for HTML: Supplementary Data 5 Description: Antibodies for flow cytometry.

1
Supplementary Figure 1. Treg cell-specific deletion of Lkb1 causes T cell autoimmunity.(a)
Relative expression of Lkb1 proteins in CD4+YFP-conventional T (Tcon) cells and CD4+YFP+Treg
cells un-treated or stimulated in plates coated with anti-CD3 and anti-CD28 in the presence of IL-2
for 24 h determined by western blot, and calculated by densitometry after normalization with
GAPDH (n=4). (b)Lkb1 protein was depleted in CD4+YFP+Treg cells from 2-week-old
Foxp3CreLkb1f/f mice, determined by western blot. (c)Tcon cell numbers in spleen and lymph nodes of
Foxp3Cre and Foxp3CreLkb1f/f mice (n=7-9).(d) Percentages of CD44highCD62Llow effector/memory

2
cells among CD4+Foxp3- and CD8+Foxp3- T cells from spleen and lymph nodes of Foxp3Cre and
Foxp3CreLkb1f/f mice (n=6-11).(e) Percentages of cells positive for Ki67, CD25 or CD69 among
CD4+Foxp3- and CD8+Foxp3- T cells in spleen and lymph nodes from Foxp3Cre and Foxp3CreLkb1f/f
mice (n=6-10).(f) Cytokine production in PMA and ionomycin-stimulated (4 h) splenic CD4+Foxp3-
and CD8+Foxp3- T cells from Foxp3Cre and Foxp3CreLkb1f/f mice (n=4). All mice analyzed were 28-
30-day-old, unless otherwise specified. (g) Absolute numbers of CD4+Foxp3+ Treg cells in the spleen
and lymph nodes from 28-30-day-old Foxp3Cre and Foxp3CreLkb1f/f mice (n=6-8). Two-way ANOVA
was used for statistical analyses in a, c, d, e, f, and g (*P<0.05, **P<0.01); error bars represent s.d.;
all data are representative of at least two independent experiments.

3
Supplementary Figure 2. Homeostasis of Lkb1-deficient Treg cells in vivo. (a)Annexin V and PI
staining of splenic CD4+YFP+ Treg cells from Foxp3Cre and Foxp3CreLkb1f/f mice (n=3). (b) Ki67 and
PI staining of splenic CD4+Foxp3+ Treg cells from Foxp3Cre and Foxp3CreLkb1f/f mice (n=3). (c)
Foxp3 expression in CD4+Rosa26-YFPhigh cells from the heterozygous female Foxp3Cre/+Rosa26YFP
and Foxp3Cre/+Lkb1f/fRosa26YFP mice.(d) The Treg cell purity after sorting was more than
99.5%.(e)Foxp3 expression in CD4+YFP+ Treg cells sorted from Foxp3Cre and Foxp3CreLkb1f/f mice.
Two-way ANOVA was used for statistical analyses in b, and unpaired two-tailed Student's t-test was
used for statistical analyses in a and e; error bars represent s.d.; all data are representative of at least
two independent experiments.
4
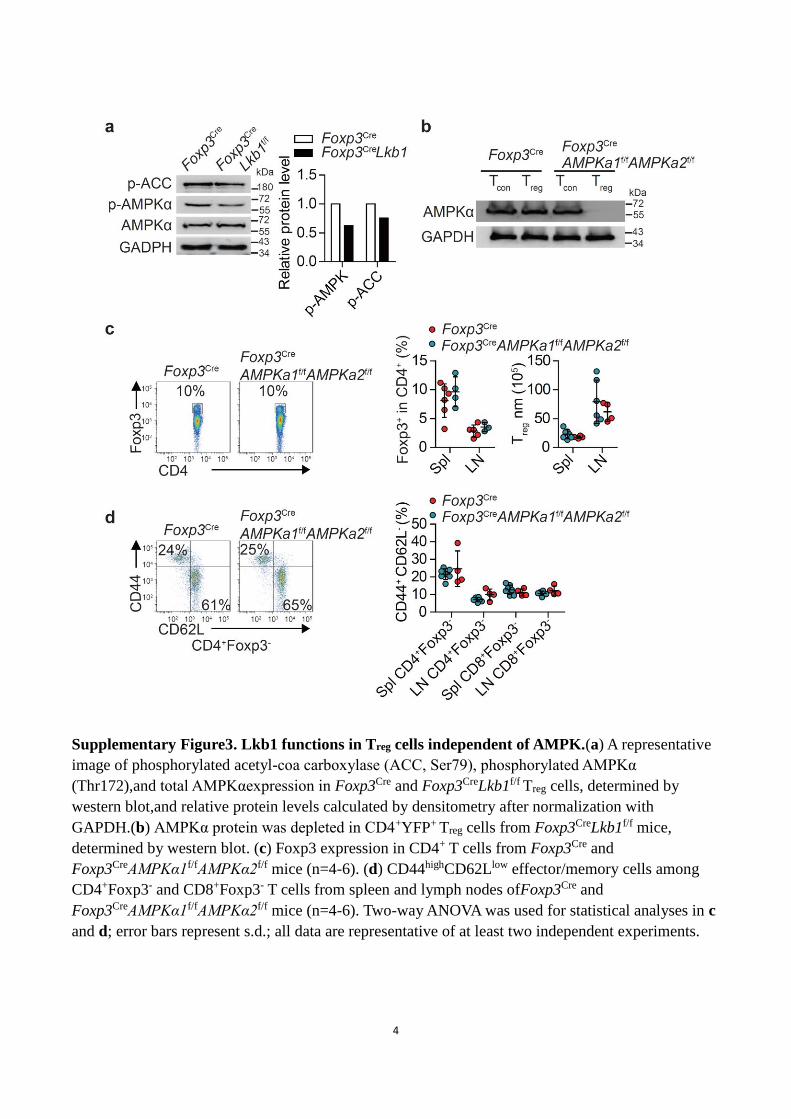
Supplementary Figure3. Lkb1 functions in Treg cells independent of AMPK.(a) A representative
image of phosphorylated acetyl-coa carboxylase (ACC, Ser79), phosphorylated AMPKα
(Thr172),and total AMPKαexpression in Foxp3Cre and Foxp3CreLkb1f/f Treg cells, determined by
western blot,and relative protein levels calculated by densitometry after normalization with
GAPDH.(b) AMPKα protein was depleted in CD4+YFP+ Treg cells from Foxp3CreLkb1f/f mice,
determined by western blot. (c) Foxp3 expression in CD4+ T cells from Foxp3Cre and
Foxp3CreAMPKα1f/fAMPKα2f/f mice (n=4-6). (d) CD44highCD62Llow effector/memory cells among
CD4+Foxp3- and CD8+Foxp3- T cells from spleen and lymph nodes ofFoxp3Cre and
Foxp3CreAMPKα1f/fAMPKα2f/f mice (n=4-6). Two-way ANOVA was used for statistical analyses in c
and d; error bars represent s.d.; all data are representative of at least two independent experiments.

5
Supplementary Figure 4. Intracellular signaling alterations in Lkb1-deficient Treg cells. (a)
Intracellular phosphorylated STAT3, STAT5 and STAT6 in Foxp3Cre and Foxp3CreLkb1f/f Treg cells,
stimulated with or without IL-6, IL-2, IL-4, respectively (n=3). (b)A representative image of
phosphorylated STAT4 (Tyr693) and total STAT4 expression in Foxp3Cre and Foxp3CreLkb1f/f Treg
cells, determined by western blot. (c) Apoptosis of Treg cells from Foxp3Cre and Foxp3CreLkb1f/f mice,
co-cultured with DCs supplemented with IL-2+IL-12.(d) Proliferation of CFSE-labeled Treg cells
from Foxp3Cre and Foxp3CreLkb1f/f mice, co-cultured with DCs supplemented with IL-2+IL-12. (e)
Lkb1 protein was depleted in ERT2CreRosa26YFP and ERT2CreLkb1f/fRosa26YFPTreg cells co-cultured
with DCs supplemented with indicated cytokines and 4-hydroxytamoxifen, determined by western
blot. Two-way ANOVA was used for statistical analyses in a (*P<0.05, **P<0.01); error bars
represent s.d.; data represent at least three independent experiments.

6
Supplementary Figure 5. Expression of Stat4, Il12rb2 andphosphorylated p65 was increased in
Lkb1-deficient Treg cells. (a) Stat4 and Il12rb2 mRNA expression in Foxp3Cre and Foxp3CreLkb1f/f
Treg cells (n=3). (b) IL-12Rβ2 expression on Foxp3Cre and Foxp3CreLkb1f/f Treg cells (n=3). (c) A
representative image of phosphorylated p65 (Ser536) and total p65 expression in Foxp3Cre and
Foxp3CreLkb1f/f Treg cells, determined by western blot. (d) Intracellular phosphorylated AKT in
Foxp3Cre and Foxp3CreLkb1f/f Treg cells with or without IL-2 stimulation (n=3). Two-way ANOVA
was used for statistical analyses in a and d, and unpaired two-tailed Student's t-test was used for
statistical analyses in b (*P<0.05); error bars represent s.d.; data represent at least three independent
experiments.

7
Supplementary Figure 6. Lkb1 controls the expression of genes critical for Treg cell function. (a)
Top enriched KEGG pathways. (b) mRNA levels of selected genes by transcriptional profiling
and real-time PCR (n=3). Foxp3Cre/+ versus Foxp3Cre/+Lkb1f/f Treg cells or Foxp3Cre versus
Foxp3CreLkb1f/f Treg cells (n=3). Two-way ANOVA was used for statistical analyses in b (*P<0.05,
**P<0.01); error bars represent s.d.; data are representative of at least two independent experiments.
8
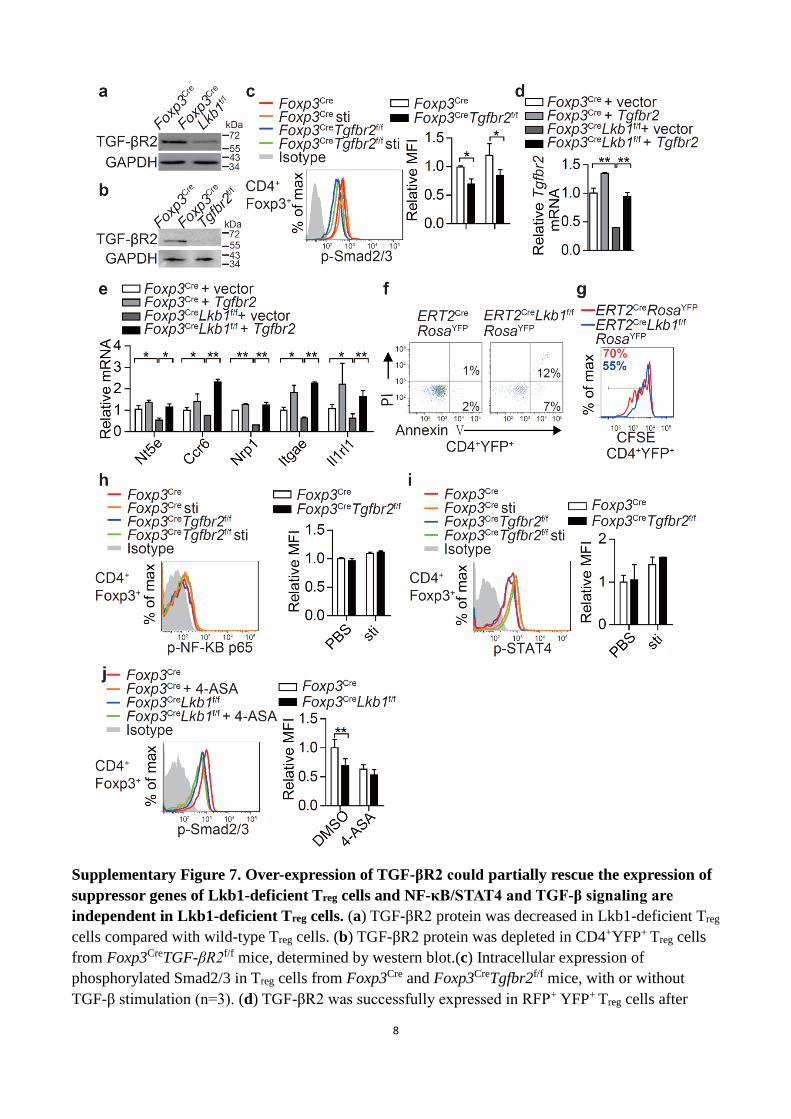
Supplementary Figure 7. Over-expression of TGF-βR2 could partially rescue the expression of
suppressor genes of Lkb1-deficient Treg cells and NF-κB/STAT4 and TGF-β signaling are
independent in Lkb1-deficient Treg cells. (a) TGF-βR2 protein was decreased in Lkb1-deficient Treg
cells compared with wild-type Treg cells. (b) TGF-βR2 protein was depleted in CD4+YFP+ Treg cells
from Foxp3CreTGF-βR2f/f mice, determined by western blot.(c) Intracellular expression of
phosphorylated Smad2/3 in Treg cells from Foxp3Cre and Foxp3CreTgfbr2f/f mice, with or without
TGF-β stimulation (n=3). (d) TGF-βR2 was successfully expressed in RFP+ YFP+ Treg cells after

9
transduced with TGF-βR2 cDNA carrying retrovirus. (e) Over-expression of TGF-βR2 could
partially rescue the expression of suppressor genes of Lkb1-deficient Treg cells. RFP+ YFP+ Treg cells
were isolated 48h after transduced with retrovirus, the expression of indicated genes was determined
by flow cytometry (n=3). pMYs-IRES-RFP vectorwas used as a control. (f,g) CD4+ T cells were
sorted from ERT2CreRosa26YFP and ERT2CreLkb1f/fRosa26YFP mice, and cultured with 4-
hydroxytamoxifen for 48 h. CD4+YFP+ T cells were sorted and analyzed for apoptosis and
proliferation after the stimulation with anti-CD3+anti-CD28 for 48 h.(h) Intracellular
phosphorylation of NF-κB p65 in Treg cells from Foxp3Cre and Foxp3CreTgfbr2f/f mice, stimulated
with or without IL-2 (n=3). (i) Intracellular phosphorylation of STAT4 in Treg cells from Foxp3Cre and
Foxp3CreTgfbr2f/f mice, stimulated with or without IL-12, respectively (n=3). (j) Intracellular
phosphorylation of Smad2/3 in Foxp3Cre and Foxp3CreLkb1f/f Treg cells supplemented with or without
4-ASA (n=3). Two-way ANOVA was used for statistical analyses in c, d, e, h, i and j (*P<0.05,
**P<0.01); error bars represent s.d.; data represent at least two independent experiments.

10
Supplementary Figure 8. Uncropped scans of the western blots. (a,b)-> Figure 1a.Lkb1 and
GAPDH proteins in CD4+YFP-Tcon cells and CD4+YFP+Treg cells un-treated or stimulated in plates
coated with anti-CD3 and anti-CD28 in the presence of IL-2 for 24 h.(c,d) ->Supplementary
figure1b.Lkb1 protein was depleted in CD4+YFP+ Treg cells from 2-week-old Foxp3CreLkb1f/f
mice.(e-h) -> Supplementary figure 3a.Representative images of phosphorylated acetyl-coa
carboxylase (ACC, Ser79), phosphorylated AMPKα (Thr172), total AMPKα, and GAPDH
expression in Foxp3Cre and Foxp3CreLkb1f/f Treg cells.(i-k) -> Supplementary figure 4b.Representative
images of phosphorylated STAT4 (Tyr693), total STAT4 and GAPDH expression in Foxp3Cre and
Foxp3CreLkb1f/f Treg cells. (l-m) -> Supplementary figure 4e.Lkb1 protein was depleted in
ERT2CreRosa26YFP and ERT2CreLkb1f/fRosa26YFPTreg cells co-cultured with DCs supplemented with
indicated cytokines and 4-hydroxytamoxifen.(n,o) ->Figure5c.STAT4 and STAT5 coprecipitation
with Dnmt1 and Dnmt3awas analyzed by using nuclear extract from in vitro expanded Treg cells.(p-r)
-> Supplementary figure 5c.Representative images of phosphorylated p65 (Ser536), total p65 and
GAPDH expression in Foxp3Cre and Foxp3CreLkb1f/f Treg cells.(s,t) ->Sup fig 7a. TGF-βR2 protein
was decreased in Lkb1-deficient Treg cells compared with wild-type Treg cells. (u,v) ->
Supplementary figure7b. TGF-βR2 protein was depleted in CD4+YFP+ Treg cells from
Foxp3Cretgfbr2f/f mice.

11
Supplementary Figure 9. Flow cytometry gating strategies. (a)-> Figure 2a-c,3a,4a,6a,6c,6f,g,7a-
c,7f,,8b,8d,e,8h, Supplementary Figure 2b,2d,e,3c,d,4a,5b,5d,7c,7h-j. (b)-> Figure 4b-e,5e,6e,
Supplementary Figure 4d,7g. (c)-> Figure 7d,8f,8j. (d)-> Figure 3c,8k.

12
Supplementary Figure 10. Flow cytometry gating strategies. (a)-> Supplementary Figure 2d.
(b)-> Figure 3b, Supplementary Figure 2c. (c)-> Supplementary Figure 2a,7f. (d)-> Supplementary
Figure 4c.

13
Supplementary Table 1. Flow cytometry gating strategies.
Tissue/cells Target Population Gating Strategy Figure number
Spleen, lymph
nodes and
isolated CD4+
cells
( Dynabeads
Untouched
Mouse CD4
Cells Kits)
CD4+Foxp3- T cells Immune
cells/Singlets/CD4+
/ Foxp3-
Supplementary Figure 9a->
Figure 2a,b,c,7a,7b,8d
Supplementary Figure 3d
CD8+Foxp3- T cells Immune
cells/Singlets/CD8+
/ Foxp3-
Supplementary Figure 9a->
Figure 2a,b,c, 7a,7b
Supplementary Figure 3d
CD4+Foxp3+ Treg cells Immune
cells/Singlets/CD4+
/ Foxp3+
Supplementary Figure 9a->
Figure 3a,4a,6a,6c,6f,6g,7c,7f,8b,8e,8h
Supplementary Figure
2b,2d,e,3c,4a,5b,5d,7c,7h-j
Co-cultured
cells
CD4+ CD45.2+Foxp3+
Treg cells
Live+CD45.2+
cells/Singles/CD4+/
CFSE/Foxp3+
Supplementary Figure 9b->
Figure 4b-e,5e,6e,
Supplementary Figure 4d
Isolated
CD4+RosaYFP+
cells
CD4+ T cells Immune
cells/Singlets/CD4+
/CFSE
Supplementary Figure 9b->
Supplementary Figure 7g
Co-cultured
cells
CD4+ CD45.1+ Tn
cells
Immune
cells/Singlets/CD4+
CD45.1+/ CFSE
Supplementary Figure 9c->
Figure 7d,8f,8j
Spleen and
lymph nodes
CD4+CD45.2+/CD45.
1+CD45.2+Foxp3+ Treg
cells
Immune
cells/Singlets/CD4+
/ CD45.1+CD45.2+
and
CD45.2+/Foxp3+
Supplementary Figure 9d->
Figure 3c,8k
Isolated CD4+
cells
CD4+ CD45.2+Foxp3+
Treg cells
Immune
cells/Singlets/CD4+
CD45.2+/ Foxp3+
Supplementary Figure 10a->
Supplementary Figure 2d
Isolated CD4+
RosaYFP +
cells
CD4+Foxp3+ Treg cells Immune
cells/Singlets/CD4+
/ Foxp3+
Supplementary Figure 10b->
Figure 3b,
Supplementary Figure 2c
Spleen, lymph
nodes
CD4+YFP+ Treg cells Immune
cells/Singlets/CD4+
/YFP+/ Annexin V-
PI
Supplementary Figure 10c->
Supplementary Figure 2a
Isolated
CD4+RosaYFP+
cells
CD4+ T cells Immune
cells/Singlets/CD4+
/Annexin V-PI
Supplementary Figure 10c->
Supplementary Figure 7f
Co-cultured
cells
CD4+ CD45.2+ Treg
cells
Immune
cells/Singlets/CD4+
CD45.2+/ Annexin
V-PI
Supplementary Figure 10d->
Supplementary Figure 4c


