Tyler Myers Patrick Scott Johnny Mckay Grant Goodwin...
19
1 Hardness Testing Experiment ME 3228: Materials and Mechanics Lab Section: 519 Tyler Myers Patrick Scott Johnny Mckay Grant Goodwin Camron Claborn Due: March 27 th , 2014 Turn in to: Cargi M, Bakirci
Transcript of Tyler Myers Patrick Scott Johnny Mckay Grant Goodwin...

1
Hardness Testing Experiment
ME 3228: Materials and Mechanics Lab
Section: 519
Tyler Myers Patrick Scott Johnny Mckay Grant Goodwin Camron Claborn
Due: March 27th, 2014
Turn in to: Cargi M, Bakirci
2
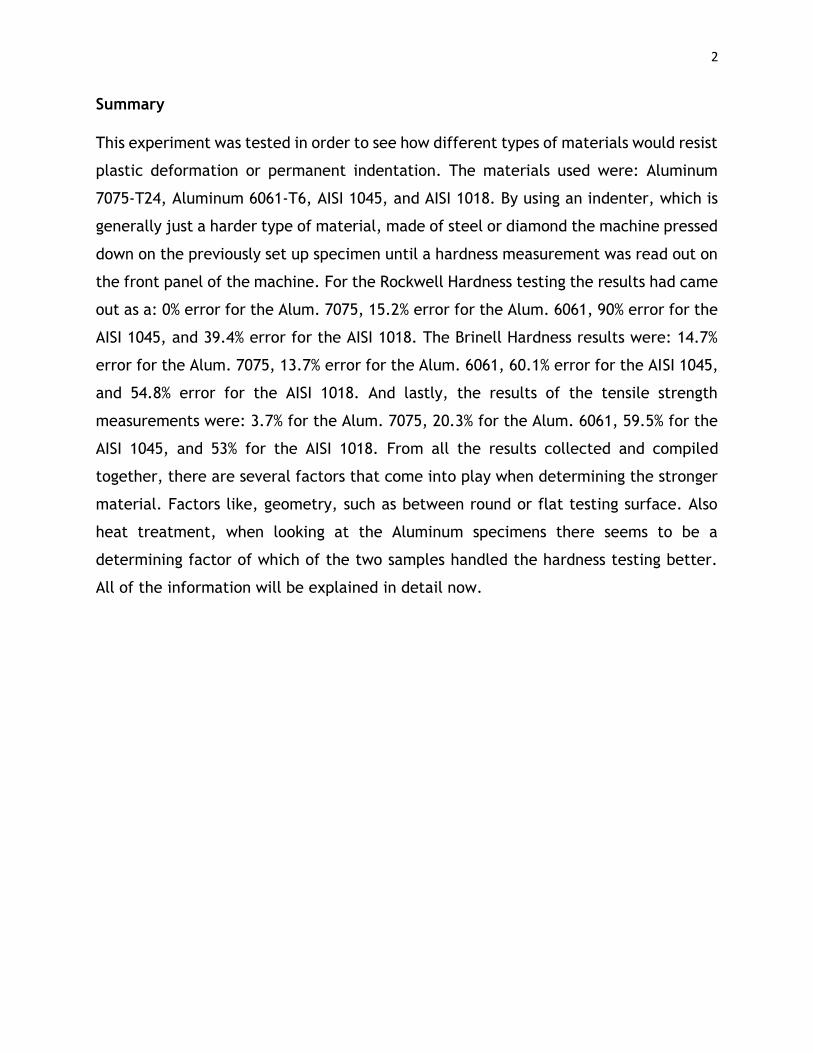
Summary
This experiment was tested in order to see how different types of materials would resist
plastic deformation or permanent indentation. The materials used were: Aluminum
7075-T24, Aluminum 6061-T6, AISI 1045, and AISI 1018. By using an indenter, which is
generally just a harder type of material, made of steel or diamond the machine pressed
down on the previously set up specimen until a hardness measurement was read out on
the front panel of the machine. For the Rockwell Hardness testing the results had came
out as a: 0% error for the Alum. 7075, 15.2% error for the Alum. 6061, 90% error for the
AISI 1045, and 39.4% error for the AISI 1018. The Brinell Hardness results were: 14.7%
error for the Alum. 7075, 13.7% error for the Alum. 6061, 60.1% error for the AISI 1045,
and 54.8% error for the AISI 1018. And lastly, the results of the tensile strength
measurements were: 3.7% for the Alum. 7075, 20.3% for the Alum. 6061, 59.5% for the
AISI 1045, and 53% for the AISI 1018. From all the results collected and compiled
together, there are several factors that come into play when determining the stronger
material. Factors like, geometry, such as between round or flat testing surface. Also
heat treatment, when looking at the Aluminum specimens there seems to be a
determining factor of which of the two samples handled the hardness testing better.
All of the information will be explained in detail now.

3
Table of Contents
List of Figures ________________________________________________________4
List of Tables ________________________________________________________5
List of Equations ________________________________________________________6
Summary ________________________________________________________2
Introduction ________________________________________________________7
Theory ________________________________________________________7
Test Description ________________________________________________________10
Results ________________________________________________________11
Discussion ________________________________________________________15
Conclusion ________________________________________________________16
References ________________________________________________________17
Appendix ________________________________________________________18

4
List of Figures Page
Figure 1: Classic Rockwell Testing Device 8
Figure 2: Various indenters 8
Figure 3: Minor-load and Major-load 8
Figure 4: Rockwell/Brinell Conversion Chart 9
Figure 5: Testing Setup with the Buehler Macromet 5100T 10
Figure 6: Aluminum and Steel Testing Specimens 11
Figure 7: Experimental vs Reference Values for Rockwell Hardness 12
Figure 8: Experimental vs Reference Values for Brinell Hardness 13
Figure 9: Experimental vs Reference Values for Tensile Strength 14

5
List of Tables Page
Table 1 - Rockwell Hardness for Four Samples 10
Table 2 - Brinell Hardness for Four Samples 11
Table 3 - Tensile Strength for Four Samples 12

6
List of Equations Page
Equation 1: Tensile Strength 13
𝑇𝑆 (𝑀𝑃𝑎) = 3.45 ∗ 𝐵𝐻𝑁
Equation 2: The Deviation Equation 11
𝑑𝑖 = 𝑥𝑖 − 𝑥𝑎𝑣𝑒
Equation 3: The Mean Deviation Equation 11
𝐷𝑚𝑒𝑎𝑛 = ∑𝑑𝑖
𝑛
𝑛
𝑖=1
Equation 4: The Standard Deviation Equation 11
𝑆 = √∑(𝑥𝑖 − 𝑥𝑎𝑣𝑒)2
(𝑛 − 1)
𝑛
𝑖=1

7
Introduction
Hardness can be defined as how resistant solid matter is to permanent shape change when a
force is applied. A material’s hardness is a useful property to know since it allows us to predict
how that material will react when a load is applied, which can save lives as well as costs when
designing machines and structures.
There are three types of hardness that can be determined for a material; scratch hardness,
indentation hardness, and rebound hardness. In this lab we will be determining the indentation
hardness of four different metals, Aluminum 7075 T-24, Aluminum 6061 T-6, AISI Steel 1045,
and AISI Steel 1018. There are various scales used to define indentation hardness, out of these
there are two that this experiment is concerned with, the Rockwell Scale and the Brinell Scale.
After determining each metal’s hardness, their tensile strength can be calculated. With these
results, comparisons can be made about how each metal’s chemical composition,
manufacturing methods, and heat treatments affect the material’s resistance to deformation.
Since the specimen’s used in this experiment have been tested numerous times before, the
results obtained in this experiment can be compared to those acquired previously. The
expectations are that the results obtained in this experiment will be fairly similar to the
standards used for each metallic alloy with some slight errors.
Theory
Hugh M Rockwell and Stanley P Rockwell patented the original Rockwell hardness-testing device
on July 15, 1914 [Fig. 1]. This testing setup uses an indenter made of material harder than the
test specimen (in this case either steel or diamond (Fig. 2)) that is pressed into the test
specimen to produce an indention, which can be measured to determine the material’s
hardness.

8
An important component of the Rockwell test is the Minor-load that is applied before the Major-
load, which causes the measurable indention. The Minor-loading of the specimen helps with the
accuracy of the test by slightly going through the material’s outer surface. This allows the test
to be conducted without the interference of surface imperfections. (Fig. 3)
Figure 1 – Classic Rockwell Testing
Device
Figure 3 – Minor-load (left) and Major-load (right)
Figure 2 – Various indenters

9
The Rockwell scale and the Brinell scale are related and can be converted to each other by
using charts (Fig. 4), which are easily accessed either online or in our lab.
Using the Brinell Hardness Number (BHN) it is possible to calculate a materials tensile strength
using the following equations…
𝑇𝑆(𝑀𝑃𝐴) = 3.45 ∗ 𝐵𝐻𝑁
or
𝑇𝑆(𝑝𝑠𝑖) = 500 ∗ 𝐵𝐻𝑁
Figure 4 – Rockwell/Brinell Conversion Chart

10
Test Description
This experiment is was up to test the hardness of four different materials: Aluminum
7075 -T24, Aluminum 6061-T6, AISI 1045 Steel, and AISI 1018 Steel. Steel specimens
used were the round gripping section of the same dog-bones that are used in tensile
tests. The Aluminum specimens were flat extrusion samples provided by Texas Tech.
The machine used in these tests was the Buehler Macromet 5100 Rockwell Type
Hardness Tester, manufactured by the Mitutoyo Corporation. To apply the load to the
samples, a 1/16 in. steel ball indenter was used in the Macromet. Below is a picture of
the testing setup.
Figure 5 - Testing Setup with the Buehler Macromet 5100T
The next figure shows the specimens used in this experiment.

11
Figure 6 - Aluminum and Steel Testing Specimens
The testing procedure is as follows:
1. Turn on the Marcromet Rockwell Tester.
2. Fix the appropriate indenter and anvil in the machine.
3. Select the appropriate indenter type on the control panel.
4. Select the appropriate load.
5. Place specimen on the anvil.
6. Raise the anvil by rotating handle to apply preload. Slowly raise it further
until the display reads at least 360.0, but do not exceed 360.8.
7. Press start on the tester, wait for it to complete, then record the hardness
value.
8. Repeat the test three times on different surfaces on the specimen.
9. Lower the anvil, replace the specimen then repeat the procedure for the
rest of the testing specimens.
Results
Equations 2, 3, and 4 are used to calculate the standard deviation for the Rockwell
hardness values obtained in the experiment. These values are shown in the following

12
table and displayed in Figure 7. All HR values are derived on the HRB scale unless noted
otherwise. Note that the steel specimens are round thus needed to be corrected for.
This is done by using the Cylindrical Correction Chart from the Wilson Instruments
Conversion Chart, found in the Appendix.
Table 1 - Rockwell Hardness for Four Samples
Specimen Composition Ave. HR EXP. Std. Dev. HR REF. Percentage of
Error
Aluminum 7075 (flat)
T24 87.0 1.83 87.0[5] 0.0%
Aluminum 6061 (flat)
T6 50.9 2.44 60.0[2] 15.2%
AISI 1045 (round) - 26.61 1.22 14.01[1] 90.0%
AISI 1018 (round) - 99.0 0.46 71.0[4] 39.4%
Note 1. HRC scale
Figure 7 -Experimental vs Reference Values for Rockwell Hardness
0.0
20.0
40.0
60.0
80.0
100.0
120.0
Aluminum7075
Aluminum6061
AISI 1045 AISI 1018
HRB HRB HRC 1 HRB
Rockwell Hardness Exp.
Rockwell Hardness Ref.

13
Brinell hardness was tabulated using the Wilson Instruments Conversion Chart. Table 2
shows the experimental and reference Brinell hardness values along with a percentage
of error. Figure 8 represents the data in the table.
Table 2 - Brinell Hardness for Four Samples
Specimen BHN EXP. BHN REF. Percentage of
Error
Aluminum 7075
172 150[5] 14.7%
Aluminum 6061
108 95[2] 13.7%
AISI 1045 261 163[1] 60.1%
AISI 1018 195 126[4] 54.8%
Figure 8 - Experimental vs Reference Values for Brinell Hardness
Equation 1 was used to calculate the tensile strength from the Brinell hardness for each
specimen. Table 3 and Figure 9 both compare the experimental values and reference
values of the tensile strengths.
0
50
100
150
200
250
300
Aluminum7075
Aluminum6061
AISI 1045 AISI 1018
Brinell Hardness Exp.
Brinell Hardness Ref.

14
Table 3 - Tensile Strength for Four Samples
Specimen Tensile
Strength EXP. (MPa)
Tensile Strength REF.
(MPa)
Percentage of Error
Aluminum 7075
593 572[5] 3.7%
Aluminum 6061
373 310[2] 20.3%
AISI 1045 901 565[1] 59.5%
AISI 1018 673 440[4] 53.0%
Figure 9 - Experimental vs Reference Values for Tensile Strength
0
100
200
300
400
500
600
700
800
900
1000
Aluminum7075
Aluminum6061
AISI 1045 AISI 1018
(MP
a)
Tensile Strength Exp.
Tensile Strength Ref.

15
Discussion
The results received from the data and graphs above shows the different material
properties of each material tested. Now from the results obtained, it is evident that
steel is a stronger material than aluminum. The strength of steel and aluminum also
depends on the heat treatment such as the difference between 1045 steel and 1018
steel or 7075-T24 aluminum and 6061-T6 aluminum, along with the geometry such as
round steel and flat aluminum. From the data above, the 1045 steel is stronger and has
more elasticity than the 1018 steel. Also when comparing the aluminum it is clear that
the 6061 treatment is stronger than the 7075. Looking at Table 1, shows the
experimental Rockwell hardness to theoretical which presents that 7075-T24 aluminum
and 1018 steel are pretty close to each other’s values and the experimental data is
incorrect compared to the theoretical data. The data shows that the 7075 aluminum is
smaller than the 1018 steel but in reality the 7075 aluminum is a bigger value than 1018
which shows that flat 7075 aluminum is harder than round 1018 steel and 1045 round
steel. Along with that, the 6061 flat aluminum is harder than the 1045 round steel. In
this part of the experiment there were a few discrepancies from the experimental data
being too low or too high compared to the theoretical values of the Rockwell hardness
test. Now when looking at the Brinell hardness results, the experimental values are too
high compared the theoretical results. In the theoretical Brinell hardness it shows that
both steels are harder than both aluminum specimens tested. Even in the experimental
data collected, the steel in harder than the aluminum, but the experimental values for
the Brinell hardness was a lot higher than it was supposed to. With this in mind, the
round steel is harder than the flat aluminum so the geometry plays a role in the Brinell
hardness of the material. Table 3 of the results shows the tensile strength of each of
the four materials tested. It is clear that the steel is harder than the aluminum but
when comparing the 1045 steel to the 7075 aluminum it shows that the flat aluminum
is slightly harder than the steel, but the 6061 is weaker than the 1018 steel. When
comparing all of these materials together from the data calculated, the heat treatment
of the material plays a vital role in the ductility and or brittleness of the material. Heat
treatment can change strength and ductility of a material along with the geometry of

16
the material such as round steel compared to flat aluminum. The heat treatment and
shape determines the strength of the material, and the strength of the material
determines the application in which that material can be used.
Conclusion
So in conclusion the Hardness testing experiment was a great way to see how the heat
treatment and the geometry of the material affect the material properties and the
hardness of the material. This experiment proved that the aluminum Rockwell hardness
is greater than steels but aluminums Brinell hardness is smaller than steel. Also that
the tensile strength of round steel is greater than flat aluminum which helps us
understand that the shape of a material can determine how much stress can affect it.
The goal of this experiment was satisfied in the fact that steel is harder than aluminum
and that rolling increases hardness compared to flat material. With experiments like
this it is easier to see what materials to use in different applications and know how
there geometry makes them harder or weaker and how it will react under stress. The
downside of this experiment is that when testing the material it can be structurally
flawed or defected in any way which will end in inaccurate results. Or the material can
be already used and the strength of it is weakened. Overall this experiment proved how
heat treatment and geometry of the material such as rolled or flat can change strength
and ductility of a material. To improve this experiment I would recommend using un-
used material to get a more accurate result and decrease the percent of error.
17
References
[1] "1045 Medium Tensile Carbon Steel Bar." Interlloy Engineering Steels + Alloys 1045
Medium Tensile Carbon Steel Bar Comments. N.p., 2011. Web. 04 Mar. 2014,
http://www.interlloy.com.au/our-products/carbon-steels/1045-medium-
tensile-carbon-steel-bar/.
[2] "6061-T6 Aluminum." - Material Properties Data. N.p., 2013. Web. 04 Mar. 2014,
http://www.makeitfrom.com/material-data/?for=6061-T6-Aluminum.
[3] Chaudhuri, Jharna, 2014. Material and Mechanics Laboratory Experiments, Texas
Tech University, Cognella, INC., United States of America.
[4] "AISI 1018 Mild/Low Carbon Steel." AISI 1018 Mild/Low Carbon Steel. N.p., n.d.
Web. 02 Mar. 2014, http://www.azom.com/article.aspx?ArticleID=6115.
[5] "ASM Material Data Sheet." ASM Material Data Sheet. N.p., n.d. Web. 02 Mar. 2014,
http://asm.matweb.com/search/SpecificMaterial.asp?bassnum=MA7075T6.
[6] Rockwell, H.M. Rockwell, S.P., (1919). Patent No.1,294,171. Washington, DC: US
Patent and Trademark Office.

18
Appendix
Hardness Test Data Sheet
Table 5.1 from pg. 47 in Material and Mechanics Laboratory Experiments [3]

19
The conversion chart used: