Tyler Myers -...
23
1 Tensile Test Experiment ME 3228: Materials and Mechanics Lab Section: 519 Tyler Myers Due: March 6 th , 2014 Turn in to: Cargi M, Bakirci
Transcript of Tyler Myers -...

1
Tensile Test Experiment
ME 3228: Materials and Mechanics Lab
Section: 519
Tyler Myers
Due: March 6th, 2014
Turn in to: Cargi M, Bakirci

2
Summary
For the Tensile Test Experiment, data was collected from using an MTS machine
and lab computer. The data collected was the position and load of what was going on
to a sample material. The materials used were two different types of aluminum and
steel. The simple tensile test was performed on each of the four samples. With the
data found in the experiment, calculations of stress and strain were done, finding the
different material properties of the four samples. With the stress and strain values,
graphs were created to illustrate the experiment, and with those graphs some of the
material properties were directly found. The material properties consisted of
elasticity, yield and ultimate strengths, resilience, toughness, percentage of
elongation, and percentage of reduction in area of the samples. As for most of the
material properties, having to have been calculated, charts were drawn up for the
comparison of the experimental data to the real world reference data provided by any
common engineering book. Details of the experiment and its results will be provided
later in the report, along with all the tables and graphs generated from the
experiment’s data.

3
Table of Contents
List of Figures ________________________________________________________4
List of Tables ________________________________________________________5
List of Equations ________________________________________________________6
Summary ________________________________________________________2
Introduction ________________________________________________________7
Theory ________________________________________________________7
Test Description ________________________________________________________9
Results ________________________________________________________11
Discussion ________________________________________________________20
Conclusion ________________________________________________________21
References ________________________________________________________22
Appendix ________________________________________________________23

4
List of Figures
Figure 1: Tensile Test in Action 7
Figure 2: The MTS Machine 10
Figure 3: Four Different Sample Materials 10
Figure 4: The Stress-Strain Graph of ASIS 1018 12
Figure 5: The Stress-Strain Graph of AISI 1045 12
Figure 6: The Stress-Strain Graph of Al 6061 13
Figure 7: The Stress-Strain Graph of Al 7075 13
Figure 8: The .2% Offset Graph of AISI 1018 14
Figure 9: The .2% Offset Graph of AISI 1045 14
Figure 10: The .2% Offset Graph of Al 6061 15
Figure 11: The .2% Offset Graph of Al 7075 15
Figure 12: The Young’s Modulus Graph of AISI 1018 16
Figure 13: The Young’s Modulus Graph of AISI 1045 17
Figure 14: The Young’s Modulus Graph of AL 6061 17
Figure 15: The Young’s Modulus Graph of Al 7075 18
Figure 16: The Elasticity Comparison Chart 19
Figure 17: The Yield Strength Comparison Chart 19
Figure 18: The Ultimate Strength Comparison Chart 20
Figure 19: The Comparison between Ductile and Brittle Fractures 21

5
List of Tables
Table 1: Initial and Final Measurements of the Sampled Material 11
Table 2: Experimental Mechanical Properties of Four Samples 23
Table 3: The Comparison Table between the Experimental and Referenced Data 23

6
List of Equations
Equation 1: The Stress Equation
𝜎 =𝐹
𝐴𝑜
Equation 2: The Strain Equation
𝜀 =𝑙−𝑙0
𝑙0
Equation 3: The Elasticity Equation
𝐸 =∆𝜎
∆𝜀
Equation 4: Ultimate Strength Equation
𝜎𝑢 = 𝐹𝑚/𝐴0
Equation 5: Resilience Equation
𝑈𝑟 =1
2 𝜎𝑦 ∗ 𝜀𝑦
Equation 6: Toughness Equation
𝑈𝑇 =1
2∗ (𝜎𝑦 + 𝜎𝑢) ∗ 𝜀𝑓
Equation 7: Percentage of Elongation
𝑃𝑒𝑟𝑐𝑒𝑛𝑡𝑎𝑔𝑒 𝑜𝑓 𝐸𝑙𝑜𝑛𝑔𝑎𝑡𝑖𝑜𝑛 =∆𝑙
𝑙0∗ 100%
Equation 8: Percentage of Reduction in Area
𝑃𝑒𝑟𝑐𝑒𝑛𝑡𝑎𝑔𝑒 𝑜𝑓 𝑟𝑒𝑑𝑢𝑐𝑡𝑖𝑜𝑛 𝑖𝑛 𝑎𝑟𝑒𝑎 =∆𝐴
𝐴0∗ 100%

7
Introduction
This experiment consisted of measuring the mechanical properties of two
different types of materials using a tensile testing machine. The purpose of this
experiment is to recreate a real world application of what these materials might be
subjected to when the materials are put to work. These experiments are done often
to construct a set of data for all engineers to be able to have quick access to correct
information and material specifications and properties. So with this type of
experiment, the elastic modulus, the ultimate strength, and the yield strength can be
calculated and compared to old references from previous experiments to see how the
material properties have changed, if any. The two materials being tested in this
experiment will be steel and aluminum. Those two types of materials have also been
split into two sub-types: Steel: 1018 and 1045, Al: 7075 and 6061.
Theory
The idea of this tensile test experiment is to calculate the specific material
properties from each material tested and see how they compare to a standard
reference of the same material’s properties already provided in the real world. Below
is a snap shot of an actual tensile test being taken on a sample material.
Figure 1: Tensile Test in Action

8
The specific properties the experiment will provide will be elasticity, yield and
ultimate strengths, resilience, toughness, percentage of elongation, and percentage
of reduction in area of the samples. Finding these will have to come from finding the
tensile stress of the experiment being performed. The tensile stress, σ, is calculated
through this equation:
𝜎 =𝐹
𝐴𝑜 (Equ. 1)
Where F is the load being applied and A0 is the original cross-sectional area at the gage
section of the sample. Then the strain, ε, is also needed for calculations purposes to
measure what is being done to the sample in terms of it being stretched out. The
engineering strain is calculated by:
𝜀 =𝑙−𝑙0
𝑙0 (Equ. 2)
Here, l is the new gage length and l0 is the original gage length. With the calculations
of both the stress and strain of the sample, a Stress vs. Strain graph can then be created
to see how the sample acts while the tensile test is being performed. After setting up
a proper stress-strain graph, the calculation of the modulus of elasticity, E, can be
found using the simple slope definition:
𝐸 =∆𝜎
∆𝜀 (Equ. 3)
With the elasticity, obtaining the yield strength is done by performing a .2% offset on
the stress-strain graph, and figuring out where the two lines intersect. The Ultimate
tensile strength, σu, is found by:
𝜎𝑢 = 𝐹𝑚/𝐴0 (Equ. 4)
With Fm being the maximum load applied to the sample. Resilience, or the energy
absorbed by the sample when it is being deformed elastically, is found by using:
𝑈𝑟 =1
2 𝜎𝑦 ∗ 𝜀𝑦 (Equ. 5)

9
Where σy is the yield strength and εy is the strain at which the yield strength is located
for the sample. Finding the toughness, UT, can be found by:
𝑈𝑇 =1
2∗ (𝜎𝑦 + 𝜎𝑢) ∗ 𝜀𝑓 (Equ. 6)
The strain level at fracture is represented by εf. Ductility, or the ability of the sample
to be deformed before complete fracture, can be measured by the percentage of
elongation:
𝑃𝑒𝑟𝑐𝑒𝑛𝑡𝑎𝑔𝑒 𝑜𝑓 𝐸𝑙𝑜𝑛𝑔𝑎𝑡𝑖𝑜𝑛 =∆𝑙
𝑙0∗ 100% (Equ. 7)
A material with a lower ductility can be classified as brittle, and a material with high
density can be classified as ductile. Also the percentage of area reduction is another
form of measuring the ductility of the material. This can be calculated by:
𝑃𝑒𝑟𝑐𝑒𝑛𝑡𝑎𝑔𝑒 𝑜𝑓 𝑟𝑒𝑑𝑢𝑐𝑡𝑖𝑜𝑛 𝑖𝑛 𝑎𝑟𝑒𝑎 =∆𝐴
𝐴0∗ 100% (Equ. 8)
Here, Ao is the original cross-sectional area of the sample. With all these properties
coming from a simple tensile test, there can be a lot said about different types of
materials when the test is completed.
Test Description
This test will consist of experimenting on four different types of materials using a
MTS tensile testing machine, shown below.

10
Figure 2: The MTS Machine
The samples being tested in this experiment are AISI 1018, AISI 1045, Aluminum 6061-
T6, Aluminum 7075-T24.
Figure 3: Four Different Sample Materials
11
During the Tensile Test experiment, the four samples were measured for their original
gage length and diameters. Each sample was then put in and clamped down by the
upper and lower hydraulic grips. Then using the lab computer, the MTS machine was
activated, calibrated, and began pulling the sample down with the lower grip while the
upper grip remained stationary. During this, the computer stores the data of the
position of the grips, and the load that is being applied to the sample at the current
time. The sample was then pulled until fracture. Once fracture was reached, the
machine was deactivated. The sample was then measured once more for its final gage
length and diameters.
Results
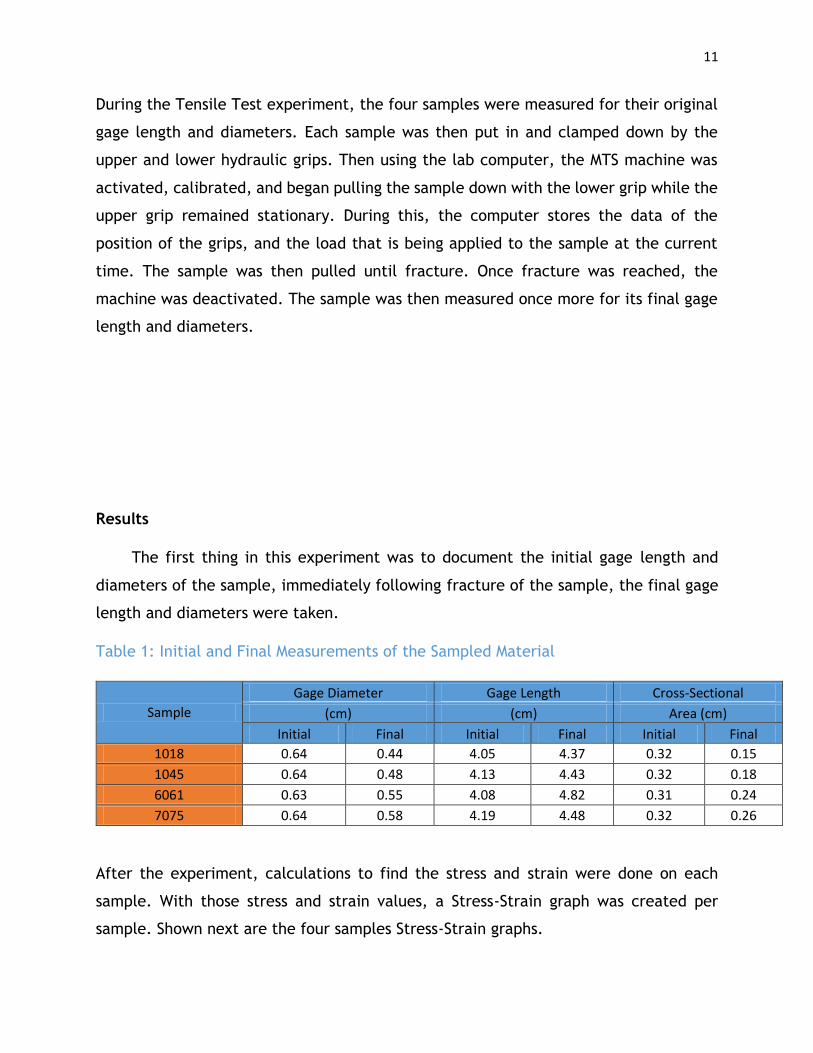
The first thing in this experiment was to document the initial gage length and
diameters of the sample, immediately following fracture of the sample, the final gage
length and diameters were taken.
Table 1: Initial and Final Measurements of the Sampled Material
Sample
Gage Diameter Gage Length Cross-Sectional
(cm) (cm) Area (cm)
Initial Final Initial Final Initial Final
1018 0.64 0.44 4.05 4.37 0.32 0.15
1045 0.64 0.48 4.13 4.43 0.32 0.18
6061 0.63 0.55 4.08 4.82 0.31 0.24
7075 0.64 0.58 4.19 4.48 0.32 0.26
After the experiment, calculations to find the stress and strain were done on each
sample. With those stress and strain values, a Stress-Strain graph was created per
sample. Shown next are the four samples Stress-Strain graphs.

12
Figure 4: The Stress-Strain Graph of ASIS 1018
Figure 5: The Stress-Strain Graph of AISI 1045
0
100
200
300
400
500
600
700
800
900
-0.02 0 0.02 0.04 0.06 0.08 0.1 0.12
Stre
ss (
Pa)
Stain
Stress vs Strain Graph, 1018
Exp. Data
0
200
400
600
800
1000
1200
-0.02 0 0.02 0.04 0.06 0.08 0.1 0.12
Stes
s (M
Pa)
Strain
Stress vs Stain Graph , 1045
Exp. Data

13
Figure 6: The Stress-Strain Graph of Al 6061
Figure 7: The Stress-Strain Graph of Al 7075
0
100
200
300
400
500
600
700
-0.05 0 0.05 0.1 0.15 0.2 0.25
Stre
ss (
MP
a)
Strain
Stress vs Strain Graph, 6061
Exp. Data
0
100
200
300
400
500
600
700
0 0.02 0.04 0.06 0.08 0.1 0.12
Stre
ss (
MP
a)
Strain
Stress vs Strain Graph, 7075
Exp. Data

14
With the Stress-Strain graphs generated per sample, a .2% Offset graph was created to
find the values of the yield strength of the samples.
Figure 8: The .2% Offset Graph of AISI 1018
Figure 9: The .2% Offset Graph of AISI 1045
-100
0
100
200
300
400
500
600
700
800
900
-0.002 0 0.002 0.004 0.006 0.008 0.01 0.012 0.014 0.016 0.018 0.02
Stre
ss (
MP
a)
Stain
.2% Offset Graph, 1018
Exp. Data
.2% offest
0
100
200
300
400
500
600
700
-0.002 0 0.002 0.004 0.006 0.008 0.01 0.012 0.014 0.016 0.018
Stre
ss (
MP
a)
Strain
.2 % Offset Graph, 1045
Exp. Data
.2% Offset

15
Figure 10: The .2% Offset Graph of Al 6061
Figure 11: The .2% Offset Graph of Al 7075
-50
0
50
100
150
200
250
300
350
400
450
500
-0.005 0 0.005 0.01 0.015 0.02 0.025 0.03 0.035
Stre
ss (
MP
a)
Strain
.2% Offset Graph, 6061
Exp. Data
.2% Offset
0
100
200
300
400
500
600
700
0 0.005 0.01 0.015 0.02 0.025 0.03 0.035 0.04 0.045
Stre
ss (
MP
a)
Strain
.2% Offset Graph, 7075
Exp. Data
.2% Offset

16
To do so, a simple calculation of Young’s Modulus had to be done in order to find, E,
the elasticity of the sample to create the .2% Offset Graph. The Young’s Modulus was
calculated by finding the slope of the original data of stress and strain using up to the
first one hundred to two hundred megapascals of stress for ease of finding the
equation of the line. The following four graphs illustrate the linear relationship of the
Young’s Modulus for the samples.
Figure 12: The Young’s Modulus Graph of AISI 1018
0
20
40
60
80
100
120
140
160
180
200
-0.0005 0 0.0005 0.001 0.0015 0.002 0.0025 0.003 0.0035
Stre
ss (
MP
a)
Strain
Young's Modulus Graph, 1018
Exp. Data
Linear (Exp. Data)

17
Figure 13: The Young’s Modulus Graph of AISI 1045
Figure 14: The Young’s Modulus Graph of AL 6061
-20
0
20
40
60
80
100
120
140
-0.0005 0 0.0005 0.001 0.0015 0.002 0.0025
Stre
ss (
MP
a)
Strain
Young's Modulus Graph, 1045
Exp. Data
Linear (Exp. Data)
0
20
40
60
80
100
120
140
160
180
-0.001 0 0.001 0.002 0.003 0.004 0.005 0.006
Stre
ss (
MP
a)
Strain
Young's Modulus Graph, 6061
Exp. Data
Linear (Exp. Data)

18
Figure 15: The Young’s Modulus Graph of Al 7075
With the all the data taken from the stress-strain graphs, a comparison of the
experimental elasticity, yield strength, and ultimate strength of the four individual
samples were taken to a reference data provided by common engineering charts used
on an everyday basis. Here is a comparison of the elasticity for each of the four
samples.
0
10
20
30
40
50
60
70
80
0 0.0005 0.001 0.0015 0.002 0.0025
Stre
ss (
MP
a)
Strain
Young's Modulus Graph, 7075
Exp. Data
Linear (Exp. Data)

19
Figure 16: The Elasticity Comparison Chart
Next is the comparison of the Yield strengths for the four samples.
Figure 17: The Yield Strength Comparison Chart
57.4 61.2
38.7 33.1
205 200
68.9 71.7
0
50
100
150
200
250
1018 1045 6061 7075
Elasticity (GPa)
Exp. Ref.
400 387
230
284
370
310276
503
0
100
200
300
400
500
600
1018 1045 6061 7075
Yield Strength (MPa)
Exp. Ref.

20
Lastly, illustrated below is the comparison of the Ultimate Strengths of the four
samples.
Figure 18: The Ultimate Strength Comparison Chart
Discussion
There appears to be a clear difference between the two steel and the two
aluminum materials upon completion of the results for the experiment. When talking
about the two steel materials, AISI 1045 shows a clear difference in its ability to hold a
greater force when compared to the AISI 1018. Its ultimate strength is greater, but its
yield strength is lower. AISI 1045 also has a greater elasticity, meaning it is less brittle.
When comparing the two aluminum materials, the Al 7075’s yield and ultimate
strengths are higher than the Al 6061. But the elasticity of the Al 6061 is greater than
the Al 7075 as far as the experimental data, but in a perfect analysis, the Al 7075 should
have a greater elasticity, meaning that the Al 6061 is less ductile than the Al 7075.
Looking at the aluminum and steel materials together, even from the tensile test
experimental data, the steel’s properties of elasticity, yield and ultimate strengths are
far beyond those of the aluminums. Which makes sense knowing that the steel should
be far more brittle and the aluminum more ductile. With being more brittle, the steel
785
1105
568618
440
565
310
572
0
200
400
600
800
1000
1200
1018 1045 6061 7075
Ultimate Strength (Mpa)
Exp. Ref.

21
should come out fractured with a more of a flat break, and the aluminum being more
ductile, should come out with a more slanted break.
Figure 19: The Comparison between Ductile and Brittle Fractures
Conclusion
The tensile test made it easy to see first-hand what would happen to different
types of material when under a tensile load. Having not been able to perform anything
like this before, the test made a connection from the conceptual schoolwork to the
physical application. The data achieved seemed a bit off, most likely due to some
physical and mechanical error while undertaking the experiment. Overall, the tensile
test was enjoyable.

22
References
1. Chaudhuri, Jharna, 2014. Material and Mechanics Laboratory Experiments,
Texas Tech University, Cognella, INC., United States of America

23
Appendix
Table 2: Experimental Mechanical Properties of Four Samples
Table 3: The Comparison Table between the Experimental and Referenced Data
Sample
Yield Yield
%Error
Ultimate Ultimate
%Error Elasticity Elasticity
%Error Strength Strength Strength Strength
Exp. Ref. Exp. Ref. Exp. Ref.
1018 400 Mpa
370 Mpa
8% 785 Mpa
440 Mpa
78% 57.4 Gpa
205 Gpa 72%
1045 387 Mpa
310 Mpa
25% 1105 Mpa
565 Mpa
96% 61.2 Gpa
200 Gpa 70%
6061 230 Mpa
276 Mpa
17% 568 Mpa
310 Mpa
83% 38.7 Gpa
68.9 Gpa
44%
7075 284 Mpa
503 Mpa
44% 618 Mpa
572 Mpa
8% 33.1 Gpa
71.7 Gpa
54%
Sample Elastic Modulus Yield Strength Ultimate Strength Modulus of Resillence Toughness Percentage of Percentage of Reduction
(Gpa) (Mpa) (Mpa) (Pa) (Mpa) Elongation In Area
1018 57.4 400 785 1.89 89.5 7.90% 53%
1045 61.2 387 1105 1.6 79.8 7.30% 44%
6061 38.7 230 568 0.92 79.8 18.10% 24%
7075 33.1 284 618 1.62 45.1 6.90% 18%