Two-Pillar Risk Management (TPRM): A Generic Project Risk...
11
Transcript of Two-Pillar Risk Management (TPRM): A Generic Project Risk...

Transaction E: Industrial EngineeringVol. 16, No. 2, pp. 138{148c Sharif University of Technology, December 2009
Research Note
Two-Pillar Risk Management (TPRM): AGeneric Project Risk Management Process
S.M. Seyedhoseini1 and M.A. Hate�1;�
Abstract. A conventional Risk Management Process (RMP) contains two main phases: (a) riskassessment that includes risk identi�cation and risk analysis, and (b) risk response that decides what, ifanything, should be done about the analyzed risks. Based on a traditional tendency, most studies in state-of-the art RMP have ample emphasis on risk assessment, but we can �nd limited studies on the subject ofrisk response. This paper aims to oppose the mentioned traditional view. The paper introduces a genericRMP, namely Two-Pillar Risk Management (TPRM) that considers an equivalent importance for both riskassessment and risk response. The paper compares the TPRM with the last version of the RMP provided inthe standard of PMBoK. Application of the proposed model in projects in the construction industry showsa tremendous total risk level improvement. We believe that applying the TPRM helps project managersin a most e�ective and e�cient manner in dealing with their risk management programs.
Keywords: Risk Management Process (RMP); Project risk management; Risk response.
INTRODUCTION
Risk is an entity that appears in all aspects of a project.Therefore, the need for project risk management hasbeen widely recognized. The purpose of project riskmanagement is to improve project performance by sys-tematically identifying and assessing risks, developingstrategies to reduce or avoid them and maximizingopportunities [1]. Regarding the subject of the RiskManagement Process (RMP), since 1990, a large num-ber of RMPs have been generated to address the needfor more e�ective risk management [2,3]. Within theresearch area of the present paper, we have studiedand compared most RMP's such as RISKIT [4] in thesoftware engineering context, PUMA [5] and MRMP [3]in the construction engineering context, RFRM [6]in the system engineering context, SHAMPU [1] andPMBoK [3] in the project management context, thestandard of the AS/NZS 4360 [7] in the public appli-cation context etc.
There is a consensus that RMP is comprised of
1. Department of Industrial Engineering, Iran University ofScience and Technology, Tehran, P.O. Box 16846-13114,Iran.
*. Corresponding author. E-mail: Hate�[email protected]
Received 8 May 2007; received in revised form 13 September2008; accepted 22 October 2008
two main phases. The �rst phase is risk assessment,including risk identi�cation and risk analysis. Thesecond phase is risk response which decides what, ifanything, should be done about the assessed risks. Inthe traditional view of risk management, the impor-tance of risk assessment overrides the importance ofrisk response. This subject has created a signi�cantshortage in risk response related research studies.Many researchers have stressed the mentioned short-age, which the following statements con�rm it:
� \Yet risk response development is perhaps theweakest part of RMP, and it is here that many orga-nizations fail to gain the full bene�ts of RMP" [8].
� \Few solutions have been proposed and there areno widely accepted processes, models or toolsto support the cost-e�ective selection of risk re-sponses" [9].
� \Risk response planning is far more likely to beinadequately dealt with, or overlooked entirely, inthe management of project risk" [10].
� \A few speci�c tools have been suggested in theliterature for determining risk responses" [11].
� \In the risk response process, less systematic andwell-developed frameworks have been provided" [3].

Two-Pillar Risk Management 139
According to the modern view of risk manage-ment, all RMP steps are equally important. This mod-ern view directs risk analysts towards a Critical SuccessFactor (CSF) of RMP, namely \Equilibrium" [12],which is expressed as follows:
\In RMP, risk assessment play a fundamental roleand risk response play a throughout role, focusingon one and ignoring the other misleads RMP".
Regarding the CSF of \Equilibrium", this pa-per proposes a new RMP, namely Two-Pillar RiskManagement (TPRM). The paper is organized in thefollowing manner. First, we describe the key conceptsand present the TPRM. Subsequently, within a typicalproject, some analytical results will be described.Then, the TPRM and the RMP provided in thestandard of PMBoK [13] will be compared. Finally,some remarks regarding the applicability of our modelwill be discussed.
KEY CONCEPTS
In a general project environment, the key concepts arede�ned as follows:
Project Measures: They are the key criteria in aproject, i.e. project time, project quality and projectcost [14].Project Scope: It is the target state of the project interms of project measures (see Table 1).Project Ultimacy: It is the ultimate state of theproject in terms of project measures (see Table 1).Risk Event: It is a discrete event that, if occuring,would have a positive (opportunity) or negative(threat) e�ect on project measures. One risk eventcan a�ect one or some project measures.Risk Measures: Risk events are phenomena that haveseveral characteristics, namely risk measures, whichcould be used to characterize risk events, as describedin Table 2.Risk Class: It implies the typology of risk events.Response Action: It is a discrete activity that, whencarried out, has a positive (ameliorator) or negative(deteriorator) e�ect on the risks measures. Oneresponse action can a�ect one or some risk measuresof one or some risk events.
Response Measures: Similar to those of risk, thereare some measures that are descriptive of responseactions. Response measures are explained in Table 3.Response Class: It implies the typology of responseactions.
Now, in the relationship between project risks, re-sponses and their measures, a complete scenario is achain consisting of �ve parts as follows:
A. Response Measures are used to characterize Re-sponse Actions;
B. Implementing Response Actions a�ects Risk Mea-sures;
C. Risk Measures are used to characterize Risk Events;D. Occurrence of Risk Events a�ects Project measures;E. Project Measures are used to characterize Project
Ultimacy.
TPRM FRAMEWORK
Figure 1 exhibits the proposed generic Two-PillarRMP (TPRM) that has been particularized for projectenvironments, and could also be adapted to the needs ofother environments. The term \two-pillar" means thatwe have designed all elements of TPRM in respect totwo main equivalent pillars, i.e. \risk" and \response".The word \generic" indicates that the risk analystsmust consider the TPRM and generate a processto match their project properties. The TPRM isstructured in several phases, stages and steps.
TPRM Start Up
The TPRM begins with the phase of \TPRM start up".In this phase, the project manager appoints the leaderof risk management. Then, the most important tasksinclude establishing the organizational chart of riskmanagement, constructing a team of risk managementand training them.
Actuation
This phase is the planning section of the TPRM. Someof the major stages in this fundamental phase aredetermining the level of the project Work Breakdown
Table 1. Project measures.
Project Measure In Project Scope In Project Ultimacy
Project time The project aim on time The project upshot on time
Project qualityThe target state of speci�cationsof the project output
The ultimate state of speci�cationsof the project output
Project cost The planned baseline cost of project The actual cost of project
140 S.M. Seyedhoseini and M.A. Hate�
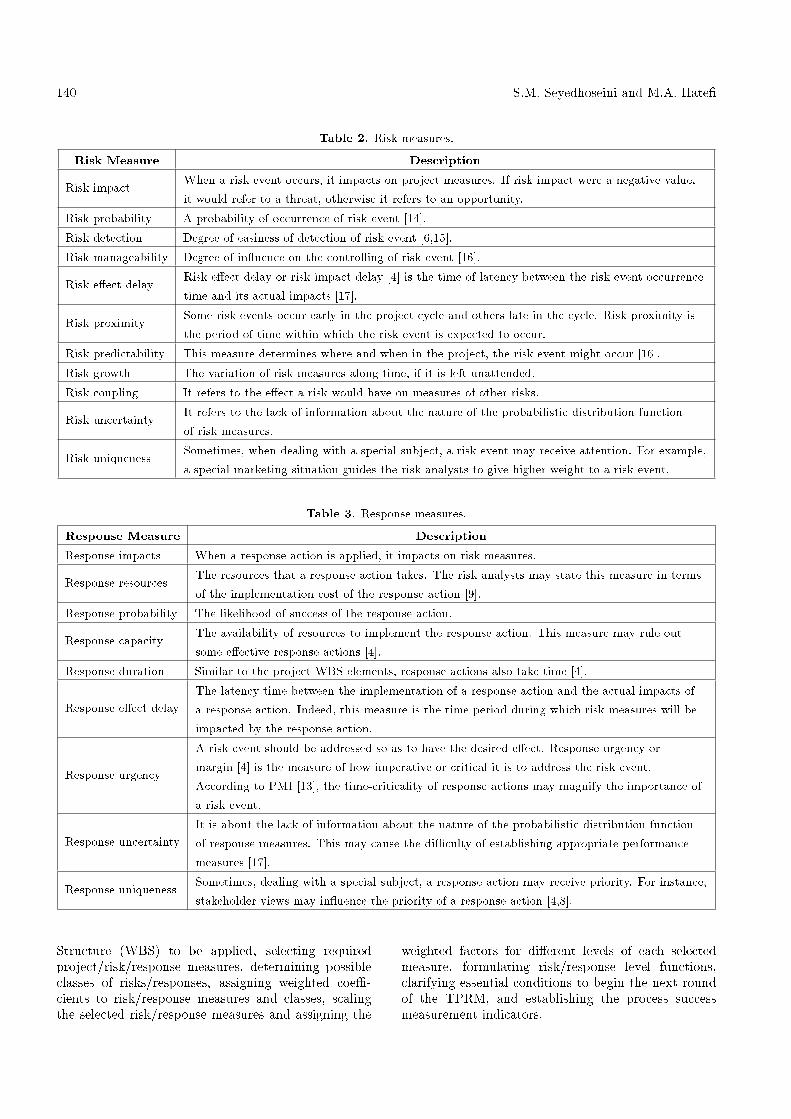
Table 2. Risk measures.
Risk Measure Description
Risk impactWhen a risk event occurs, it impacts on project measures. If risk impact were a negative value,it would refer to a threat, otherwise it refers to an opportunity.
Risk probability A probability of occurrence of risk event [14].
Risk detection Degree of easiness of detection of risk event [6,15].
Risk manageability Degree of in uence on the controlling of risk event [16].
Risk e�ect delayRisk e�ect delay or risk impact delay [4] is the time of latency between the risk event occurrencetime and its actual impacts [17].
Risk proximitySome risk events occur early in the project cycle and others late in the cycle. Risk proximity isthe period of time within which the risk event is expected to occur.
Risk predictability This measure determines where and when in the project, the risk event might occur [16].
Risk growth The variation of risk measures along time, if it is left unattended.
Risk coupling It refers to the e�ect a risk would have on measures of other risks.
Risk uncertaintyIt refers to the lack of information about the nature of the probabilistic distribution functionof risk measures.
Risk uniquenessSometimes, when dealing with a special subject, a risk event may receive attention. For example,a special marketing situation guides the risk analysts to give higher weight to a risk event.
Table 3. Response measures.
Response Measure Description
Response impacts When a response action is applied, it impacts on risk measures.
Response resourcesThe resources that a response action takes. The risk analysts may state this measure in termsof the implementation cost of the response action [9].
Response probability The likelihood of success of the response action.
Response capacityThe availability of resources to implement the response action. This measure may rule outsome e�ective response actions [4].
Response duration Similar to the project WBS elements, response actions also take time [4].
Response e�ect delayThe latency time between the implementation of a response action and the actual impacts ofa response action. Indeed, this measure is the time period during which risk measures will beimpacted by the response action.
Response urgency
A risk event should be addressed so as to have the desired e�ect. Response urgency ormargin [4] is the measure of how imperative or critical it is to address the risk event.According to PMI [13], the time-criticality of response actions may magnify the importance ofa risk event.
Response uncertaintyIt is about the lack of information about the nature of the probabilistic distribution functionof response measures. This may cause the di�culty of establishing appropriate performancemeasures [17].
Response uniquenessSometimes, dealing with a special subject, a response action may receive priority. For instance,stakeholder views may in uence the priority of a response action [4,8].
Structure (WBS) to be applied, selecting requiredproject/risk/response measures, determining possibleclasses of risks/responses, assigning weighted coe�-cients to risk/response measures and classes, scalingthe selected risk/response measures and assigning the
weighted factors for di�erent levels of each selectedmeasure, formulating risk/response level functions,clarifying essential conditions to begin the next roundof the TPRM, and establishing the process successmeasurement indicators.

Two-Pillar Risk Management 141
Figure 1. The TPRM framework.
Assessment of Project, Risks and Responses
\Assessment" is an activity that contains two stages:\Identi�cation" and \Analysis". There is a loop amongthree assessment activities in each round of the TPRM.In fact, risk assessment is the predecessor of responseassessment, response assessment is the predecessorof project assessment and project assessment is thepredecessor of risk assessment. It must be noted thatthe TPRM has encapsulated all conventional project-planning activities (creating project WBS, resourcesassignment, project scheduling etc.) into the stage ofproject assessment.
Risk and Response Identi�cation
The TPRM stresses identi�cation of all possiblerisks/responses. The TPRM de�nes the concept ofthe \risk sign", which states that a risk event maybe threat (negative or downside risk) or opportunity(positive or upside risk). Regarding the two-pillarview, it de�nes the concept of a \response sign", whichexpresses that a response action may be a deteriorator
(downside or negative response) or an ameliorator (up-side or positive response). Deteriorator/ameliorator isa response action with undesirable/desirable e�ects onrisk measures. So, not only negative risks/responses,but also positive ones should be identi�ed. Besides, riskidenti�cation is needed for secondary risks/responsesas well as primary ones. Risk events that arise asa direct result of implementing response actions aretermed secondary risks [5,13]. Response actions thatare candidates for a response to secondary risks aretermed secondary responses.
Risk and Response Analysis
The stage of risk analysis includes four steps: riskmeasurement, risk classi�cation, risk processing andrisk priorization. Responses also are required to gothrough all the above four steps.
Risk and Response Measurement
Traditionally, most RMPs consider risk probabilityand risk impact to characterize risks. This is a two-

142 S.M. Seyedhoseini and M.A. Hate�
dimensional notion [18]. This means that other riskmeasures are not addressed at all. We believe that inorder to have a complete simulation of risks/responses,risk analysts are required to consider not only these twomeasures, but also all pivotal risk/response measures,as shown in Tables 2 and 3. Risk/response mea-sures should be termed as qualitative or quantitativevalues. So, the selected measures are scaled in therisk/response scaling.
Risk and Response Classi�cation
Hillson [19] states that risk identi�cation often pro-duces nothing more than a long list of risks, whichcan be hard to understand or manage. The best wayto deal with a large amount of data is to classify theinformation. This could be accessed through the classi-�cation of data into dimensional structures. We believethat this structuring activity should be considered forboth risks and responses. For one-dimensional classi-�cation, the TPRM recommends the Event TaxonomyStructure (ETS) and the Action Taxonomy Structure(ATS), respectively, for risks and responses. Fortwo-dimensional classi�cation, the TPRM introducesthe Event Structuring Matrix (ESM) and the ActionStructuring Matrix (ASM), respectively, for risks andresponses.
Risk and Response Processing
During risk measurement and risk classi�cation, therisk analysts may do some processes on risks. Theaim of risk processing is better risk analysis throughdecreasing complexity and size or increasing accuracyand precision. Risk analysts may do one or someprocesses, such as risk screening (removing risks), riskbundling (combining some risks to one), risk adding(adding new risks) and risk refracting (decomposingone risk to some risks) etc. Risk analysts can alsoconsider processes similar to the above mentionedfor responses, including response screening, responsebundling, response adding, and response refracting.
Risk and Response Priorization
Risk level is an index that is used to determine the pri-ority of risks. A requirement for using most measuresis to map them on a one-dimensional scale. Therefore,in the phase of actuation, risk analysts may establisha function for determining risk level. Traditionally,to determine risk level, risk analysts use two riskmeasures including risk probability and risk impact, asin Equation 1 (see Figure 2a). Regarding the two-pillarperspective, the response level is an index presentinga response magnitude (or its e�ciency) that could beapplied to determine the priority of responses. Withina simple view, following Equation 1, we can determineresponse level as Equation 2 (see Figure 2b). It shouldbe noted that a negative risk/response level refers toa threat/deteriorator, while a risk/response level of apositive value refers to an opportunity/ameliorator.
Risk level = Risk probability� Risk impact; (1)
Response level = (Response probability
� Response impact)
= Response Resources: (2)
In a comprehensive view, risk analysts can considermore risk measures to establish a function for determin-ing risk level. Based on the two-pillar idea, a functionthat includes more response measures could be usedto specify the response level. Besides, the mentionedfunctions could be in uenced by weighted factors as-sociated with risk/response classes. Equations 3 and 4show these functions, respectively.
Risk level =f(Risk measures;
Risk classes weighted factors); (3)
Response level = f(Response measures;
Response classes weighted factors): (4)
Figure 2. (a) Risk level and (b) Response level.

Two-Pillar Risk Management 143
Risk and Response Spectrum
Risk analysts can assume that the concepts of threatand opportunity could be integrated in a risk spectrum.By mapping the risk level in a risk spectrum asFigure 3a, risk analysts can determine whether or nota risk is downside or upside. By mapping the responselevel in the response spectrum, as in Figure 3b, theycan also determine whether or not the response is dete-riorator or ameliorator. Naturally, downside responsesare not favorable and must be crossed o� the responseslist.
Total Risk/Response Level
It is often desirable to combine the various identi�edand characterized risk elements into a single quan-titative project risk estimate. Indeed, risk analystsmay also be interested in knowing the \total risklevel" of their projects in order to compare di�erentprojects [20]. This estimate of overall project risk [21],which may be used as input for a decision aboutwhether or not to execute a project, is de�ned by [21] asEquation 5. Regarding the two-pillar view, an estimatecould be also de�ned to determine the overall projectresponse or \total response level". This estimate maybe used for determining the response power. FollowingEquation 5, the total response level could be de�ned asEquation 6.
Total risk level =X
Risk level= Risks number; (5)
Total response level =X
Response level
=Responses number: (6)
Implementation and Control
For an assumed round of the TPRM, the plannedresponses should be executed. To implement and con-trol risks, each risk/response must have an ownership.Risk/response control includes tracking and monitoringthe risk/response statement. There have been severalindexes and techniques to control risks/responses, suchas Risk Reduction Leverage (RRL) [4], Net Valueof Treatment option (NVT) [7] etc. Before starting
the next round, we are required to calculate successmeasurement indicators for the previous round.
TPRM Shut Down
This phase guarantees that the TPRM completes itsmission. In the phase of TPRM shut down, �rstly, itshould be clear whether or not TPRM has been suc-cessful. Secondly, it requires recording all knowledge,experience and \lessons learned", which are earnedduring the TPRM periods [2]. This is a very usefulinput to the next projects and can be a channelto integrate knowledge management programs of theorganization. Lastly, regarding the models of theRisk Maturity Model (RMM) [22], risk analysts candistinguish the level of RMM of the organization andcan use it as a useful guideline for the next projects.
ANALYTICAL RESULTS
Now, we consider a project that is a real case takenfrom the construction industry. This project in-cludes the Engineering, Procurement and Construction(EPC) of the radial gates from a hydro-mechanicalpower plant. To clarify the procedure of the TPRM, wetrace the results of the �rst round of the process. Inthe actuation phase, risk analysts consider three riskmeasures, including risk probability, risk cost impactand risk e�ect delay. They also select two responsemeasures, i.e. response implementation cost and re-sponse urgency. In the next step, the entire selectedrisk/response measures were qualitatively scaled in 5-level scaling tables. For instance, Tables 4 and 5 are thescaling tables of risk e�ect-delay and response urgency,respectively.
In the risk identi�cation stage, as in Table 6, seven
Table 4. Scaling table of risk e�ect delay.
Qualitative Scale Description
Very Low (VL) Near term (< 1 months)
Low (L) Short term (1-2 months)
Moderate (M) Medium term (2-4 months)
High (H) Long term (4-6 months)
Very High (VH) Far term (> 6 months)
Figure 3. (a) Risk spectrum and (b) Response spectrum.

144 S.M. Seyedhoseini and M.A. Hate�
Table 5. Scaling table of response urgency.
Qualitative Scale Description
Very Low (VL) Can be addressed at a later stage
Low (L) Must be addressed in the near future
Moderate (M) Must be addressed immediately to avoid adjustments to the project plan
High (H) Must be addressed immediately but will require minor adjustment to the project plan
Very High (VH) Must be addressed immediately but will require major adjustmentto the project plan
Table 6. The identi�ed risk events (risk sign appears in the cost impact column).
Code Risk Event Probability Cost Impact E�ect Delay
E1 Weak designing of product components M -H L
E2 Opportunity of employing the autochthon labors H +M M
E3 Environmental problems in �tting the gates VH -M VH
E4 Improvement of inspection activities L +L M
E5 Welding distortions L -M VH
E6 Delay in delivery of elevator equipment M -VH L
E7 Failure in supplying control equipment L -H L
risk events were identi�ed. The risk measurement stageof the risk analysis phase includes determining the levelof each selected risk measure for each identi�ed riskevent. The results have been presented in Table 6. Forexample, for the �rst risk event, the \Weak designingof product components", probability is moderate, costimpact is high threat and e�ect delay is low. In thenext stage of risk analysis, risk analysts classi�ed riskevents in a prede�ned ESM, as in Table 7.
To prioritize risks, risk analysts de�ned the risk
Table 7. Event Structuring Matrix (ESM) for classifyingrisk events.
ESM TypeTechnical Human Plan
Weigh Factor 0.3 0.3 0.4
Project 0.6 E5 E4, E6
Category Consortium 0.2 E1 E7
External 0.2 E3 E2
level as 10,000 per product of risk probability, risk costimpact, risk e�ect delay, risk type and risk category.For the purpose of quantifying the qualitative values,the numbers 0.9, 0.7, 0.5, 0.2 and 0.02 replaced VH,H, M, L and VL, respectively. Consequently, the risklevels for E1 to E7 were calculated, respectively, as�42, 105, �243, 48, �162, �216 and �22:4. Using theabsolute value of these numbers, the ranking of risksbecame E3 > E6 > E5 > E2 > E4 > E1 > E7. In thestage of risk processing, risk analysts decided to removerisks E1, E4 and E7 (risk screening). Similar to thoseof risks, the entire preceding activities were consideredfor responses. In fact, response actions were identi�ed,measured and classi�ed. Table 8 shows six identi�edresponse actions that are measured using two selectedmeasures. Table 9 also exhibits a prede�ned ASM inwhich the identi�ed response actions are classi�ed.
Risk analysts de�ned the response level as theproduct of response type and response category dividedby implementation of the cost of response and response
Table 8. The identi�ed response actions.
Code Response Action Implementation Cost Urgency
A1 Using simulation [14] for the gates erection L M
A2 Employing an old hand erection expert as contractor M H
A3 Considering the safety budget for erection problems H H
A4 Hiring the extra vehicles M VH
A5 Providing the demonstration events [14] for deliveries VL M
A6 Applying a new technology for welding process VH L
Two-Pillar Risk Management 145
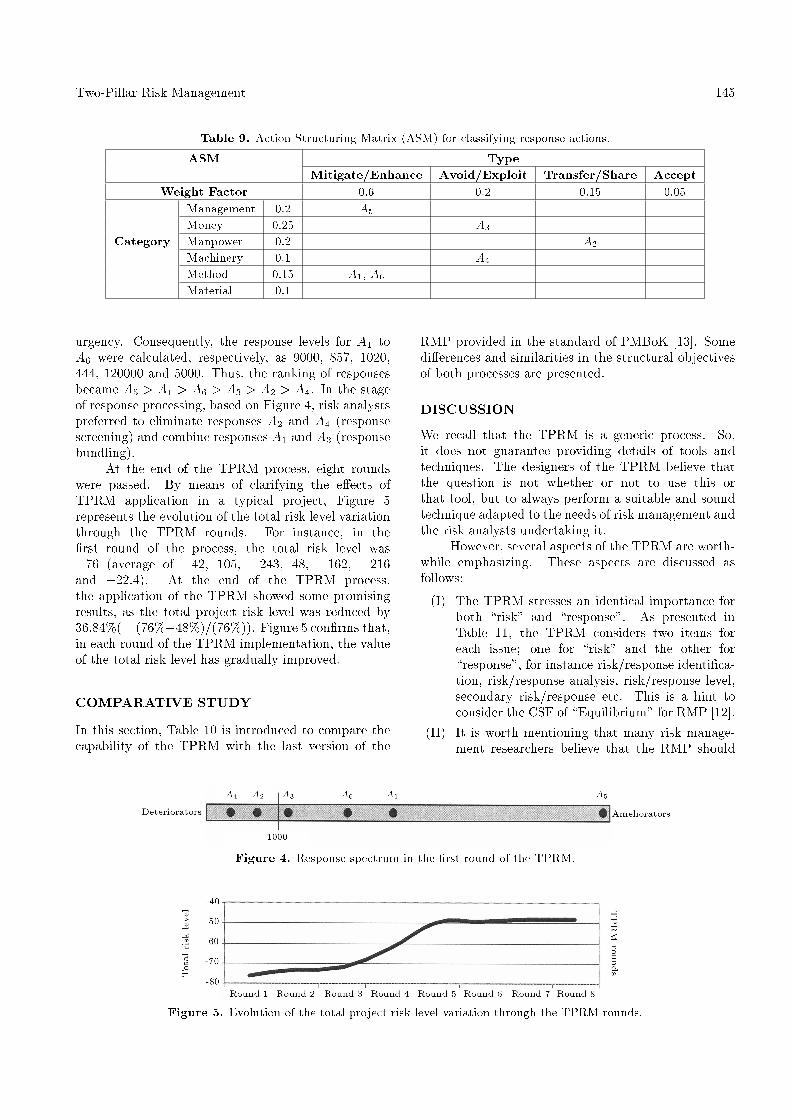
Table 9. Action Structuring Matrix (ASM) for classifying response actions.
ASM TypeMitigate/Enhance Avoid/Exploit Transfer/Share Accept
Weight Factor 0.6 0.2 0.15 0.05Management 0.2 A5
Money 0.25 A3
Category Manpower 0.2 A2
Machinery 0.1 A4
Method 0.15 A1, A6
Material 0.1
urgency. Consequently, the response levels for A1 toA6 were calculated, respectively, as 9000, 857, 1020,444, 120000 and 5000. Thus, the ranking of responsesbecame A5 > A1 > A6 > A3 > A2 > A4. In the stageof response processing, based on Figure 4, risk analystspreferred to eliminate responses A2 and A4 (responsescreening) and combine responses A1 and A3 (responsebundling).
At the end of the TPRM process, eight roundswere passed. By means of clarifying the e�ects ofTPRM application in a typical project, Figure 5represents the evolution of the total risk level variationthrough the TPRM rounds. For instance, in the�rst round of the process, the total risk level was�76 (average of �42, 105, �243, 48, �162, �216and �22:4). At the end of the TPRM process,the application of the TPRM showed some promisingresults, as the total project risk level was reduced by36:84%(= (76%�48%)=(76%)). Figure 5 con�rms that,in each round of the TPRM implementation, the valueof the total risk level has gradually improved.
COMPARATIVE STUDY
In this section, Table 10 is introduced to compare thecapability of the TPRM with the last version of the
RMP provided in the standard of PMBoK [13]. Somedi�erences and similarities in the structural objectivesof both processes are presented.
DISCUSSION
We recall that the TPRM is a generic process. So,it does not guarantee providing details of tools andtechniques. The designers of the TPRM believe thatthe question is not whether or not to use this orthat tool, but to always perform a suitable and soundtechnique adapted to the needs of risk management andthe risk analysts undertaking it.
However, several aspects of the TPRM are worth-while emphasizing. These aspects are discussed asfollows:
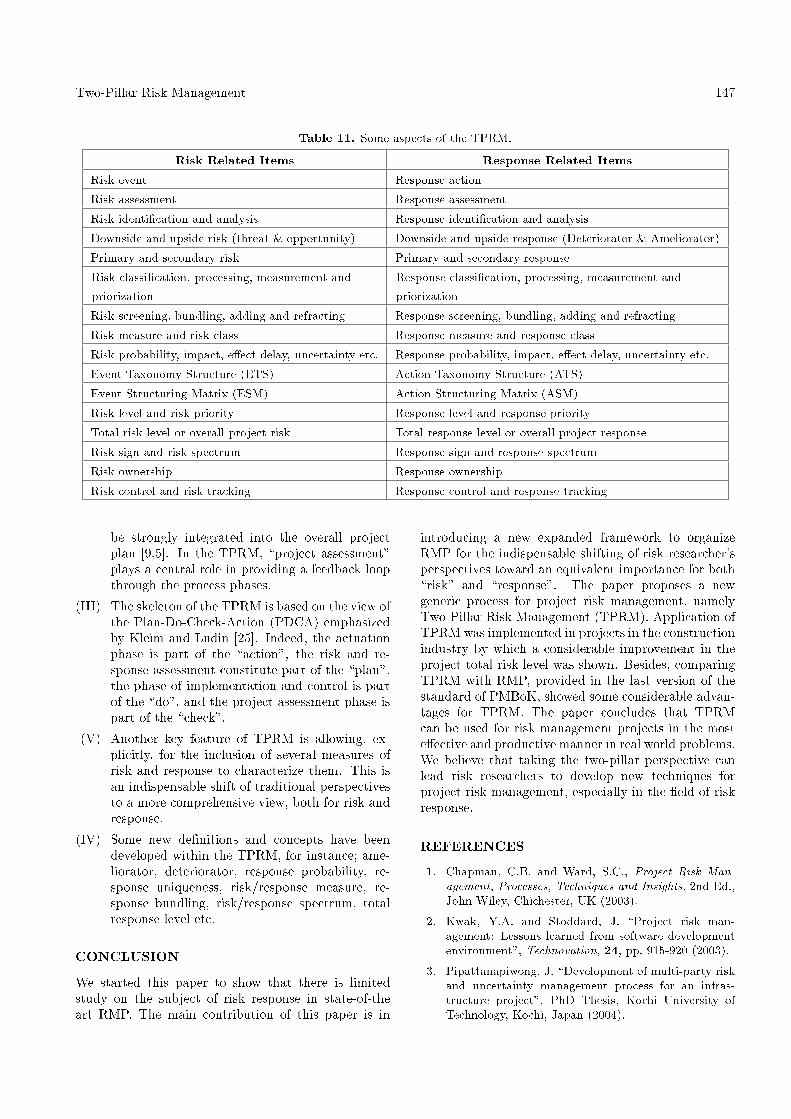
(I) The TPRM stresses an identical importance forboth \risk" and \response". As presented inTable 11, the TPRM considers two items foreach issue; one for \risk" and the other for\response", for instance risk/response identi�ca-tion, risk/response analysis, risk/response level,secondary risk/response etc. This is a hint toconsider the CSF of \Equilibrium" for RMP [12].
(II) It is worth mentioning that many risk manage-ment researchers believe that the RMP should
Figure 4. Response spectrum in the �rst round of the TPRM.
Figure 5. Evolution of the total project risk level variation through the TPRM rounds.

146 S.M. Seyedhoseini and M.A. Hate�
Table 10. Comparison of the TPRM and the RMP provided in the standard of PMBoK [13].
Item The PMBoK [13] The TPRM
Essence of Designing
The PMBoK has been formed based ona traditional view explained by Grey [23],in which risk management is a part ofproject management.
The TPRM has been designed based ona new notion explained by Grey [23], inwhich risk management should encompassall project management activities.
Risk De�nition
The PMBoK de�nes project risk as \anuncertain event or condition that ifoccurring, has a positive or a negativee�ect on at least one of the projectobjectives, such as cost, time, scope orquality". Some risk practitioners likeHillson [8] disagree with the PMBoKde�nition of risk [24].
As indicated by many researchers likeKerzner [14], project scope encompassescost, quality, and time. Thus, the TPRMde�nes risk event as \a discrete eventthat if occurring, would have a positiveor negative e�ect on project measures".
Risk Typology Risk Breakdown Structure (RBS) [19,13] Event Taxonomy Structure (ETS)
Response Typology Not provided Action Taxonomy Structure (ATS)
Risk/ResponseMeasures
The PMBoK considers risk probabilityand risk impact. Indeed, it is constructedbased on a two-dimensional view [18]. Italso considers the implementation cost ofresponse actions.
All risk/response measures could beconsidered in the TPRM. Indeed, inthis regard, it is constructed basedon a multi-dimensional view.
Upside andDownside Issues
The PMBoK includes both opportunityand threat within its de�nition ofrisk. However, the RMP described inthe PMBoK still tends to focus onmanagement of threats [12]. Besides,this standard has not any systematicprocedure to screen the responses.
The TPRM considers both upside anddownside risk/response within a unitedperspective. It introduces the conceptsof \ameliorator" and \deteriorator". It alsointroduces the concepts of \risk spectrum"and \response spectrum" to determine signof risks and responses.
Secondary IssuesThe PMBoK considers secondaryrisk/response.
The TPRM considers secondaryrisk/response.
Kind of ProcessAccording to [2], the RMP provided inthe PMBoK is often too generic.
The TPRM is a generic process.
Process Phases
(1) Risk management planning,(2) Risk identi�cation,(3) Qualitative risk analysis,(4) Quantitative risk analysis,(5) Risk response planning and(6) Risk monitoring and control.\Integrated change control" providesa feedback loop through the above phases.
(1) Start up, (2) Actuation,(3) Risk assessment,(4) Response assessment,(5) Implementation and control and(6) Shut down.\Project assessment" provides a feedbackloop through the above phases.
Special Advantage
The PMBoK is a document of greatrelevance because it has been adopted asa standard by ANSI (American NationalStandards Institute) and IEEE (USAInstitute of Electrical and ElectronicEngineers) [13].
The TPRM is unique, in respect toexisting in state-of-the art processes. TheTPRM is the �rst approach, which hasbeen considered of equivalent importancefor both \risk" and \response".
Two-Pillar Risk Management 147
Table 11. Some aspects of the TPRM.
Risk Related Items Response Related Items
Risk event Response action
Risk assessment Response assessment
Risk identi�cation and analysis Response identi�cation and analysis
Downside and upside risk (threat & opportunity) Downside and upside response (Deteriorator & Ameliorator)
Primary and secondary risk Primary and secondary response
Risk classi�cation, processing, measurement andpriorization
Response classi�cation, processing, measurement andpriorization
Risk screening, bundling, adding and refracting Response screening, bundling, adding and refracting
Risk measure and risk class Response measure and response class
Risk probability, impact, e�ect delay, uncertainty etc. Response probability, impact, e�ect delay, uncertainty etc.
Event Taxonomy Structure (ETS) Action Taxonomy Structure (ATS)
Event Structuring Matrix (ESM) Action Structuring Matrix (ASM)
Risk level and risk priority Response level and response priority
Total risk level or overall project risk Total response level or overall project response
Risk sign and risk spectrum Response sign and response spectrum
Risk ownership Response ownership
Risk control and risk tracking Response control and response tracking
be strongly integrated into the overall projectplan [9,5]. In the TPRM, \project assessment"plays a central role in providing a feedback loopthrough the process phases.
(III) The skeleton of the TPRM is based on the view ofthe Plan-Do-Check-Action (PDCA) emphasizedby Kleim and Ludin [25]. Indeed, the actuationphase is part of the \action", the risk and re-sponse assessment constitute part of the \plan",the phase of implementation and control is partof the \do", and the project assessment phase ispart of the \check".
(V) Another key feature of TPRM is allowing, ex-plicitly, for the inclusion of several measures ofrisk and response to characterize them. This isan indispensable shift of traditional perspectivesto a more comprehensive view, both for risk andresponse.
(IV) Some new de�nitions and concepts have beendeveloped within the TPRM, for instance; ame-liorator, deteriorator, response probability, re-sponse uniqueness, risk/response measure, re-sponse bundling, risk/response spectrum, totalresponse level etc.
CONCLUSION
We started this paper to show that there is limitedstudy on the subject of risk response in state-of-theart RMP. The main contribution of this paper is in
introducing a new expanded framework to organizeRMP for the indispensable shifting of risk researcher'sperspectives toward an equivalent importance for both\risk" and \response". The paper proposes a newgeneric process for project risk management, namelyTwo-Pillar Risk Management (TPRM). Application ofTPRM was implemented in projects in the constructionindustry by which a considerable improvement in theproject total risk level was shown. Besides, comparingTPRM with RMP, provided in the last version of thestandard of PMBoK, showed some considerable advan-tages for TPRM. The paper concludes that TPRMcan be used for risk management projects in the moste�ective and productive manner in real world problems.We believe that taking the two-pillar perspective canlead risk researchers to develop new techniques forproject risk management, especially in the �eld of riskresponse.
REFERENCES
1. Chapman, C.B. and Ward, S.C., Project Risk Man-agement, Processes, Techniques and Insights, 2nd Ed.,John Wiley, Chichester, UK (2003).
2. Kwak, Y.A. and Stoddard, J. \Project risk man-agement: Lessons learned from software developmentenvironment", Technovation, 24, pp. 915-920 (2003).
3. Pipattanapiwong, J. \Development of multi-party riskand uncertainty management process for an infras-tructure project", PhD Thesis, Kochi University ofTechnology, Kochi, Japan (2004).

148 S.M. Seyedhoseini and M.A. Hate�
4. Kontio, J. \Software engineering risk management: Amethod, improvement framework, and empirical eval-uation", Nokia Research Center, PhD Thesis, HelsinkiUniversity of Technology, Helsinki, Finland (2001).
5. Del Cano, A. and De La Cruz, M.P. \Integratedmethodology for project risk management", Journal ofConstruction Engineering and Management, 128(6),pp. 473-485 (2002).
6. Haimes, Y.Y., Kaplan, S. and Lambert, J.H. \Risk�ltering, ranking and management framework usinghierarchical holographic modeling", Risk Analysis,22(2), pp. 381-395 (2002).
7. Cooper, D., Tutorial Notes: The Australian andNew Zealand Standard on Risk Management(AS/NZS 460), Retrieved May 2004 fromhttp://www.broadleaf.com.
8. Hillson, D. \Developing e�ective risk response", 30thAnnual PMI Seminars and Symposium, Philadelphia,PA, USA (1999).
9. Ben, D. and Raz, T. \An integrated approach forrisk response development in project planning", Op-erational Research. Society, 52, pp. 14-25 (2001).
10. Gillanders, C. \When risk management turns into cri-sis management", AIPM National Conference, Sydney,Australia (2003).
11. Saari, H.L., Risk Management in Drug DevelopmentProjects, A Report by Helsinki University of Technol-ogy, Laboratory of Industrial Management, Helsinki,Finland (2004).
12. Seyedhosseini, S.M., Noori, S. and Hate�, M.A. \A gapanalysis on the project risk management processes",Kuwait Journal of Science and Engineering, 35(1B),pp. 217-234 (2008).
13. PMI (Project Management Institute), A Guide to theProject Management Body of Knowledge (PMBoK),Newtown Square, Pennsylvania, USA (2004).
14. Kerzner, H., Project Management: A Systems Ap-proach to Planning, Scheduling, and Controlling, 8thEd., Wiley, USA (2003).
15. Santos, S.D.F.R. and Cabral, S. \FMEA and PMBoKapplied to project risk management", InternationalConference on Management of Technology, Vienna,Austria (2005).
16. Charette, R., Software Engineering Risk Analysis andManagement, McGraw Hill, NY, USA (1989).
17. Sandy, M., Aven, T. and Ford, D. \On integrating riskperspectives in project management", Risk Manage-ment: An International Journal, 7(4), pp. 7-21 (2005).
18. Williams, T.M. \The two-dimensionality of projectrisk", International Journal of Project Management,14(3), pp. 185-186 (1996).
19. Hillson, D. \The risk breakdown structure (RBS) asan aid to e�ective risk management", Fifth Euro-pean Project Management Conference, PMI Europe.Cannes, France (2002).
20. U.S. DOE (Department of Energy), The Owner's Rolein Project Risk Management, National Academy ofSciences, NY, USA (2005).
21. Fiona, D.P. and Kevin N. \A risk-register databasesystem to aid the management of project risk", In-ternational Journal of Project Management, 20, pp.365-374 (2002).
22. Hillson, D. \Towards a risk maturity model", Interna-tional Journal of Project and Business Risk, Spring,pp. 35-46 (1997).
23. Grey, S., Practical Risk Assessment for Project Man-agement, John Wiley & Sons, Chichester, USA (1995).
24. Jacobs, D. \It is not about bankruptcy", Risk Man-agement Newsletter, Chapter 11, 4(4), pp. 6-9 (2002).
25. Kleim, R.L. and Ludin, S., Reducing Project Risk.,Gower, USA (1997).