Two Microburst Event on 18 May 2017 2: Storm Prediction Center Day 1 Severe Weather Outlook issued...
25
Two Microburst Event on 18 May 2017 1.) Introduction: On 18 May 2017 scattered strong to locally severe thunderstorms erupted across portions of the Champlain Valley, as well as parts of central and northern Vermont. A warm, moist, and unstable air mass was in place from the Eastern Adirondack Mountains into Vermont with surface temperatures in the mid-80s to lower 90s. The temperature reached 93 degrees in Burlington, VT, which tied the all-time record for warmest maximum temperature for the month of May, along with breaking the daily maximum temperature for the date. This impressive heat helped to fuel the afternoon and evening showers and thunderstorms. This severe weather event had three areas of concentrated that included Western Addison County on Potash Bay Road, South Burlington/Williston area, and across the Northeast Kingdom near Barton, VT. The NWS Burlington Office determined from a storm survey the damage which destroyed a camp and knocked down trees and powerlines on Potash Bay Road in the town of Addison, VT was caused by a microburst with estimated wind speeds of 80 to 100 mph. Another microburst occurred in South Burlington causing trees and power lines to come down, along with a measured 58 mph wind gust at Burlington International Airport, before we lost power to the observing equipment. Additional damaging thunderstorm wind gusts blew over a tractor trailer in Barton, VT with areas of trees and powerlines down in parts of the Northeast Kingdom. Figure 1 below shows a plot of storm reports across the North Country on 18 May 2017. See Appendix A for entire listing of severe weather reports received by NWS BTV. Figure 1: Plot of storm reports across the North Country on 18 May 2017.
Transcript of Two Microburst Event on 18 May 2017 2: Storm Prediction Center Day 1 Severe Weather Outlook issued...

Two Microburst Event on 18 May 2017
1.) Introduction: On 18 May 2017 scattered strong to locally severe thunderstorms erupted across portions
of the Champlain Valley, as well as parts of central and northern Vermont. A warm, moist, and unstable air mass was in place from the Eastern Adirondack Mountains into Vermont with surface temperatures in the mid-80s to lower 90s. The temperature reached 93 degrees in Burlington, VT, which tied the all-time record for warmest maximum temperature for the month of May, along with breaking the daily maximum temperature for the date. This impressive heat helped to fuel the afternoon and evening showers and thunderstorms.
This severe weather event had three areas of concentrated that included Western Addison County on Potash Bay Road, South Burlington/Williston area, and across the Northeast Kingdom near Barton, VT. The NWS Burlington Office determined from a storm survey the damage which destroyed a camp and knocked down trees and powerlines on Potash Bay Road in the town of Addison, VT was caused by a microburst with estimated wind speeds of 80 to 100 mph. Another microburst occurred in South Burlington causing trees and power lines to come down, along with a measured 58 mph wind gust at Burlington International Airport, before we lost power to the observing equipment. Additional damaging thunderstorm wind gusts blew over a tractor trailer in Barton, VT with areas of trees and powerlines down in parts of the Northeast Kingdom. Figure 1 below shows a plot of storm reports across the North Country on 18 May 2017. See Appendix A for entire listing of severe weather reports received by NWS BTV.
Figure 1: Plot of storm reports across the North Country on 18 May 2017.
2.) Storm Prediction Center: The NOAA/NWS Storm Prediction Center (SPC)'s Day 1 Convective Outlook on May
18th indicated a "Slight Risk" of severe thunderstorms from northern New York eastward across most of Vermont. As the morning unfolded, it became increasingly clear that severe weather event was likely to impact parts of the region. Figure 2 below shows the 8:00 a.m. Day 1 Convective Outlook and the associated probabilities of damaging wind and severe hail. The severe hail and wind probabilities were up to 15% across most of the North Country (i.e., there was a 15% probability of at least 1 severe hail or wind report occurring within 25 miles of any point shaded in yellow).
Figure 2: Storm Prediction Center Day 1 Severe Weather Outlook issued at 8 a.m., valid for 18 May 2017.
At 2:04 p.m., the SPC issued a Mesoscale Discussion addressing the potential for a severe thunderstorm watch as conditions were becoming favorable for thunderstorm development. The combination of strong deep layer shear of 30 to 45 knots, modest instability of 1000 to 1500 J kg-1, and increasing ascent from approaching upper trough would help expand the areal coverage and intensity of thunderstorm activity. At 335 p.m. on 18 May 2017, SPC issued Severe Thunderstorm Watch #237 for all of Vermont back into portions of northern and western New York, effective through 11 p.m.. Figure 3 below shows the SPC Mesoscale Discussion map (left) and associated Severe Thunderstorm Watch box (right) area.

Figure 3: The Storm Prediction Center Mesoscale Discussion Map (left) and Severe Thunderstorm Watch #237 outline (right).
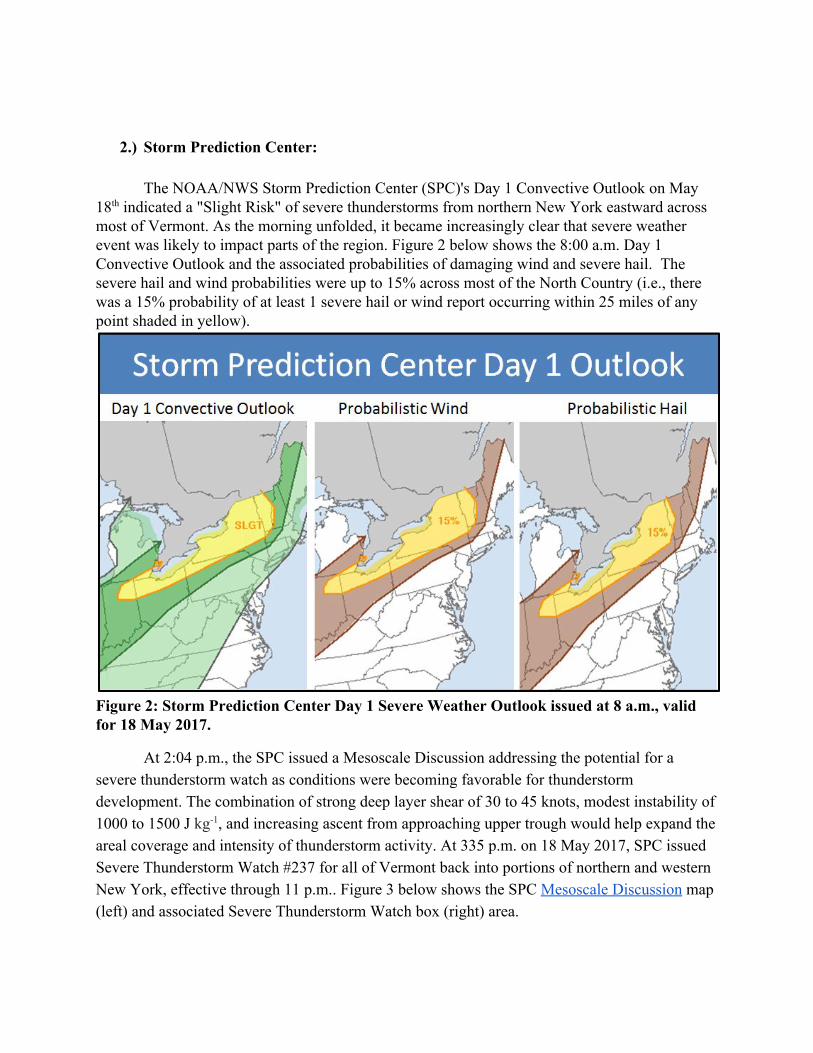
3.) What is a Microburst: A microburst is a rain-cooled downdraft of air from a thunderstorm with an affected
outflow area of less than 2 miles wide and peak winds lasting less than 5 minutes. Severe thunderstorms have very strong updrafts of air and lift liquid rain drops in the upper parts of the thunderstorm where it is cold enough to form hailstones. The cooling of the air due to many factors influence how strong the downdraft or microburst will be but can gather wind speeds over 100 mph and cause extensive damage as they impact the ground. You can read more about them at the Jet Stream University web site. Figure 4 below (from Figure 10 from the FAA Pilot Windshear Guide) shows a schematic showing the evolution of a microburst where the downburst descends from a thunderstorm, hits the ground at high speeds causing damage and wind shear near the point of impact.
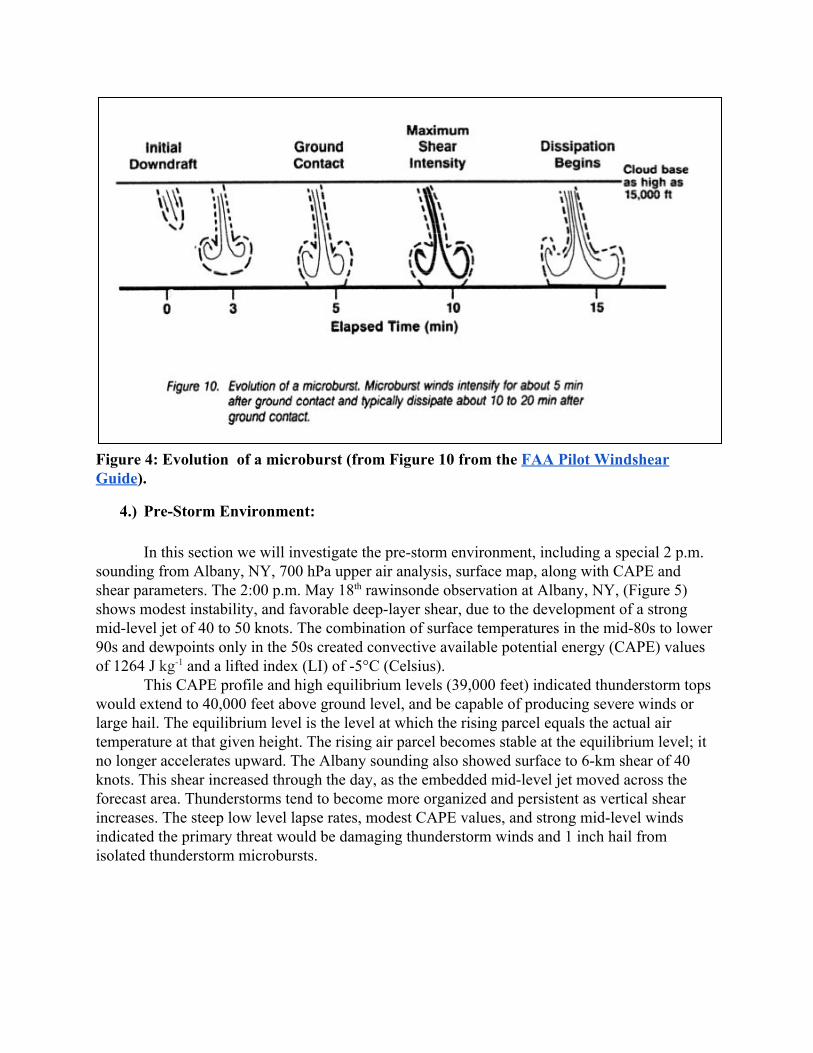
Figure 4: Evolution of a microburst (from Figure 10 from the FAA Pilot Windshear Guide).
4.) Pre-Storm Environment: In this section we will investigate the pre-storm environment, including a special 2 p.m.
sounding from Albany, NY, 700 hPa upper air analysis, surface map, along with CAPE and shear parameters. The 2:00 p.m. May 18th rawinsonde observation at Albany, NY, (Figure 5) shows modest instability, and favorable deep-layer shear, due to the development of a strong mid-level jet of 40 to 50 knots. The combination of surface temperatures in the mid-80s to lower 90s and dewpoints only in the 50s created convective available potential energy (CAPE) values of 1264 J kg-1 and a lifted index (LI) of -5°C (Celsius).
This CAPE profile and high equilibrium levels (39,000 feet) indicated thunderstorm tops would extend to 40,000 feet above ground level, and be capable of producing severe winds or large hail. The equilibrium level is the level at which the rising parcel equals the actual air temperature at that given height. The rising air parcel becomes stable at the equilibrium level; it no longer accelerates upward. The Albany sounding also showed surface to 6-km shear of 40 knots. This shear increased through the day, as the embedded mid-level jet moved across the forecast area. Thunderstorms tend to become more organized and persistent as vertical shear increases. The steep low level lapse rates, modest CAPE values, and strong mid-level winds indicated the primary threat would be damaging thunderstorm winds and 1 inch hail from isolated thunderstorm microbursts.

Figure 5: Albany, New York observed sounding on 18 May 2017 at 2:00 p.m..
Figure 6 below shows the 700 hPa (~10,000 feet above the ground level) upper air analysis on 18 May 2017 at 8 p.m.. A potent short wave trough was moving across the Ohio Valley and central Great Lakes, along with a ribbon of enhanced wind speeds. Meanwhile, a initial short wave trough and leading edge of 50 to 60 knots wind maximum was entering the North Country, creating deep layer shear profiles favorable for severe thunderstorms. This short wave helped to produce large scale lift for thunderstorm development, while the stronger winds aloft helped in the organization of storms and provided the severe weather wind threat across the forecast area.

Figure 6: The 700 hPa (~10,000 feet above the ground level) upper air analysis on 18 May 2017 at 8 p.m.. Winds barbs, (plotted in blue, 1 arrow=50 knots, 1 barb=10 knots, ½ barb=5 knots, 700 hPa heights (black lines), temperatures (dotted red<0⁰ and dotted blue>0⁰) and dewpoint (green lines).
The 2 p.m. surface analysis in Figure 7 below shows temperatures well into the 80s with surface dewpoints in the upper 50s to lower 60s. Low pressure was located north of Montreal with a trailing terrain induced prefrontal trough draped across the Eastern Adirondack Mountains, while a secondary surface trough was approaching the Saint Lawrence Valley. These two features produced enough convergence and lift to help in the development of thunderstorms during the late afternoon hours on May 18th. Meanwhile, a sharp cold front was approaching the Ottawa Valley and Northern Great Lakes with additional showers and thunderstorms. This activity weaken from the loss of surface heating/instability as the line approached the Saint Lawrence Valley between 8p.m. and 10p.m..

Figure 7: Surface map at 2 p.m. on 18 May 2017 with surface plots, cold front (light blue line with triangles) and surface trough (dotted light brown).
An interesting pre-storm environment parameter was the very high Downward Convective Potential Energy (DCAPE) values from the Eastern Adirondack Mountains into most of Vermont, highlighting the possibility for damaging downburst winds. Figure 8 below shows DCAPE values between 1200 and 1300 across most of our region at 5 p.m. on May 18th. DCAPE values greater than 1000 J kg-1 suggest steep low level lapse rates which are conducive to downward transport of higher momentum air to the surface, resulting in gusty winds and possibly severe thunderstorm wind damage. The higher the DCAPE value the stronger the rain-cooled downdraft potential within a thunderstorm. It was observed surface to 3 km lapse rates were 9.8C⁰/km, which is very steep, indicating instability is present and thunderstorm

development is possible, given sufficient moisture.
Figure 8: Storm Prediction Center Rapid Refresh (RAP) mesoanalysis of Downward Convective Available Potential Energy (DCAPE) at 5 p.m. on 18 May 2017.
5.) GOES-16 Satellite Data:
This storm event was one of the first events in the North Country that was viewed by our
new geostationary satellite known as GOES-R or GOES-16 (Geostationary Operational Environmental Satellite). It’s higher definition view of clouds and thunderstorms allowed meteorologists get a much better, more frequent view of the storms on this day.
Figure 9 below shows channel 9 - 6.95 μm mid-level water vapor imagery from preliminary, non-operational GOES-16 at 5:02 p.m. on 18 May 2017. The brown areas show the presence of dry air in the mid levels of the atmosphere, which is conducive for the formation of hail and
damaging microbursts wind in severe thunderstorms. The circular light gray and green areas show the location of clouds and tops of thunderstorms respectively. Thunderstorms come in many sizes and you can notice the small circular areas in Vermont representing our small but intense storms compared to the large circular areas in the large Oklahoma thunderstorms.
Figure 9: Preliminary, non-operational GOES-16 channel 9 - 6.95 μm mid-level water vapor imagery 18 May 2017 at 5:02 p.m. .
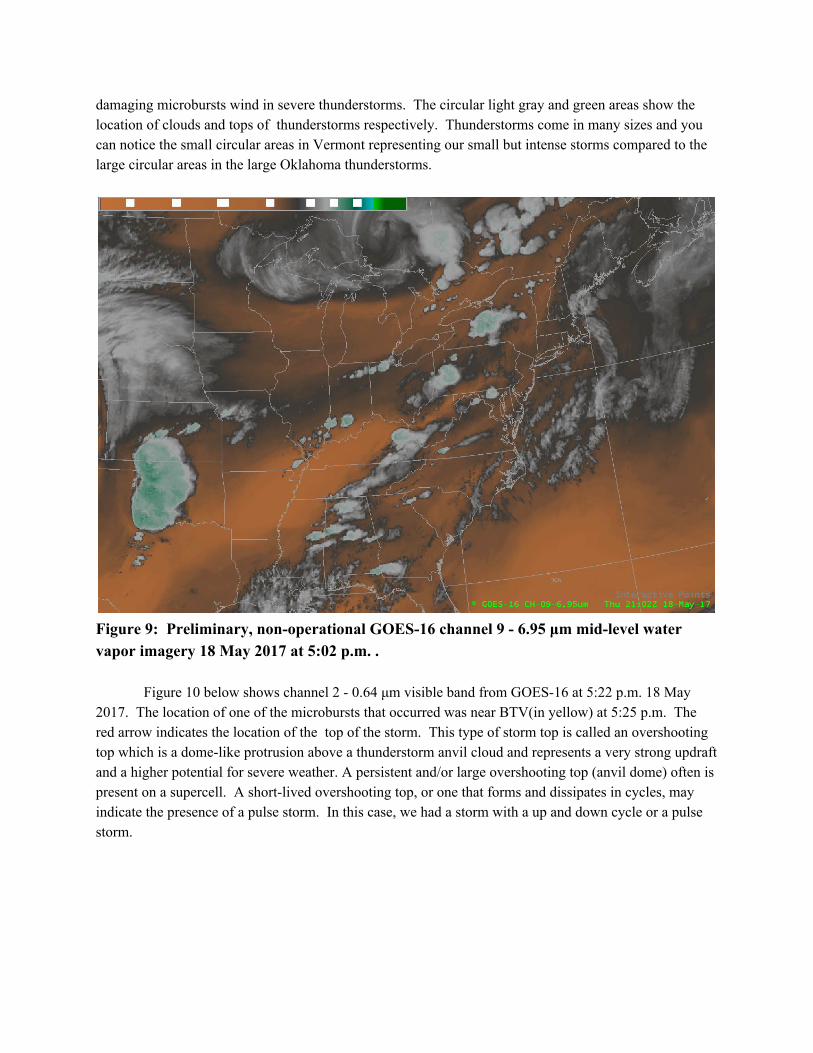
Figure 10 below shows channel 2 - 0.64 μm visible band from GOES-16 at 5:22 p.m. 18 May 2017. The location of one of the microbursts that occurred was near BTV(in yellow) at 5:25 p.m. The red arrow indicates the location of the top of the storm. This type of storm top is called an overshooting top which is a dome-like protrusion above a thunderstorm anvil cloud and represents a very strong updraft and a higher potential for severe weather. A persistent and/or large overshooting top (anvil dome) often is present on a supercell. A short-lived overshooting top, or one that forms and dissipates in cycles, may indicate the presence of a pulse storm. In this case, we had a storm with a up and down cycle or a pulse storm.

Figure 10: Preliminary, non-operational GOES-16 channel 2 - 0.64 μm visible imagery 18 May 2017 at 5:22 p.m.
Figure 11 below shows channel 2 - 0.64 μm visible band GOES-16 at 5:17 p.m.18 May 2017. The location of the microbursts that occurred was near Addison (in yellow) at 5:18 p.m. The red arrow indicates the location of the overshooting top of that storm. A short animation of the visible imagery from 3:02 to 6:57 p.m. on 18 May 2017 showing the evolution of the thunderstorm and the formation of the overshooting tops can be seen here. https://youtu.be/FGXGVq0gfcM

Figure 11: Preliminary, non-operational GOES-16 channel 2 - 0.64 μm visible imagery 18 May 2017 at 5:17 p.m. 18 May 2017.
6.) Radar Analysis: Figure 12 below shows the 0.5° KCXX velocity data (left) and KTYX vertical
reflectivity cross section (right) at 5:20 p.m. on 18 May 2017. Given the closeness to the KCXX radar in Colchester, VT this storm was very poorly sampled aloft, but captured the low level velocity downburst signature very well. Meanwhile, the KTYX radar in Montague NY was too many miles away for good data sampling in the low levels, but displayed the reflectivity structure aloft well. The 0.5° velocity data clearly showed a divergence signature with 60 knots (green) moving toward the radar and 40 to 45 knots (red) moving away from the KCXX radar associated with a downburst of wind within a severe microburst thunderstorm. The reflectivity cross section from the KTYX radar indicated a storm top of 40,000 feet or over 7 miles tall, and 50 dBZ reflectivity core to 25,000 feet. This strong reflectivity core aloft and favorable mid-level wind fields with good mixing in the low levels created an environment conducive for damaging microburst winds.
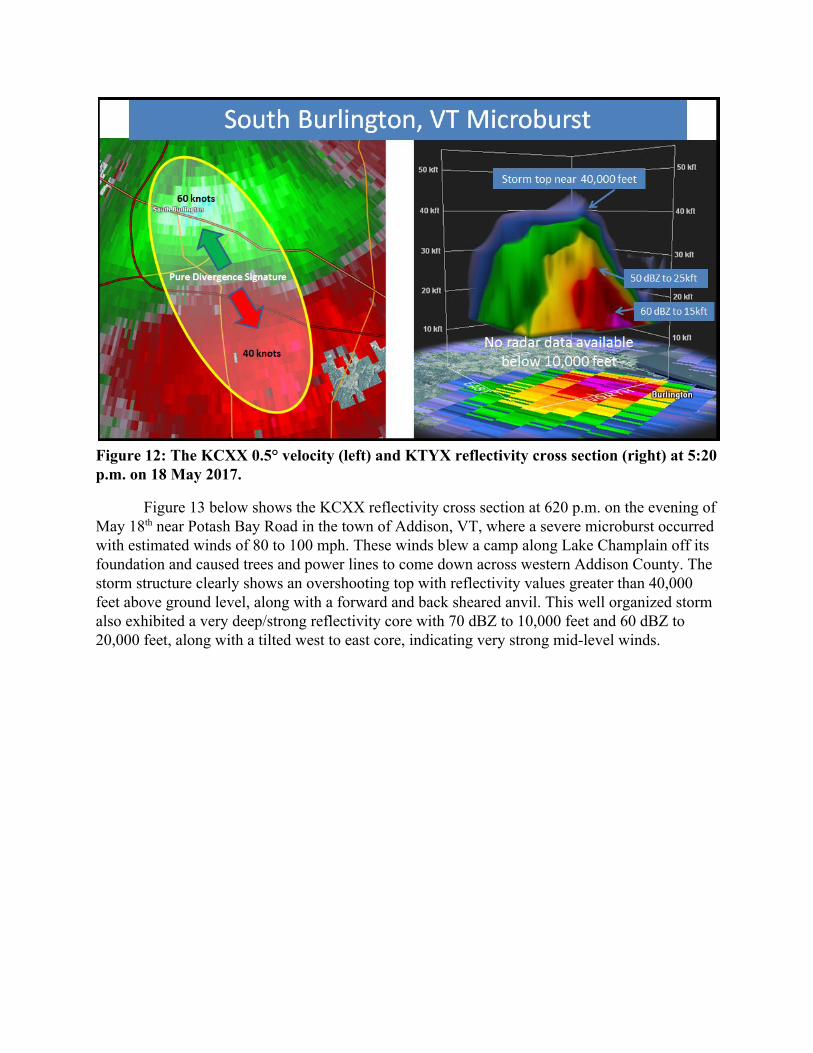
Figure 12: The KCXX 0.5° velocity (left) and KTYX reflectivity cross section (right) at 5:20 p.m. on 18 May 2017.
Figure 13 below shows the KCXX reflectivity cross section at 620 p.m. on the evening of May 18th near Potash Bay Road in the town of Addison, VT, where a severe microburst occurred with estimated winds of 80 to 100 mph. These winds blew a camp along Lake Champlain off its foundation and caused trees and power lines to come down across western Addison County. The storm structure clearly shows an overshooting top with reflectivity values greater than 40,000 feet above ground level, along with a forward and back sheared anvil. This well organized storm also exhibited a very deep/strong reflectivity core with 70 dBZ to 10,000 feet and 60 dBZ to 20,000 feet, along with a tilted west to east core, indicating very strong mid-level winds.

Figure 13: KCXX reflectivity cross section at 6:20 p.m. on 18 May 2017.
Figure 14 below shows the evolution of the Addison County microburst from 6:10 p.m. to 6:20 p.m. on 18 May 2017. At 6:10 p.m. you can see a very strong core of reflectivity aloft with a tilted west to east column associated with brisk winds of 35 to 45 knots between 4000 and 7000 feet above the ground. As the storm continue to approach Western Addison County the reflectivity core at 6:15 p.m. started to descend toward the surface with damaging winds and large hail. Note in the middle image of Figure 14 below, the increased higher reflectivities of 60 to 70 dBZ (pink/white colors) at the surface, indicating the core aloft was collapsing with strong winds and large hail. By 6:20 p.m. the areal coverage of the 60 to 70 dBZ continued to expand at the surface, with a solid core of strong reflectivity persisting up to 30,000 feet above the ground. Also, note the strongly tilted reflectivity core at this time period and the sharp decrease in echoes on the back side, associated with the descending rear inflow jet. This very strong thunderstorm produced plenty of lightning and a pocket of significant damage on Potash Road in the town of Addison.
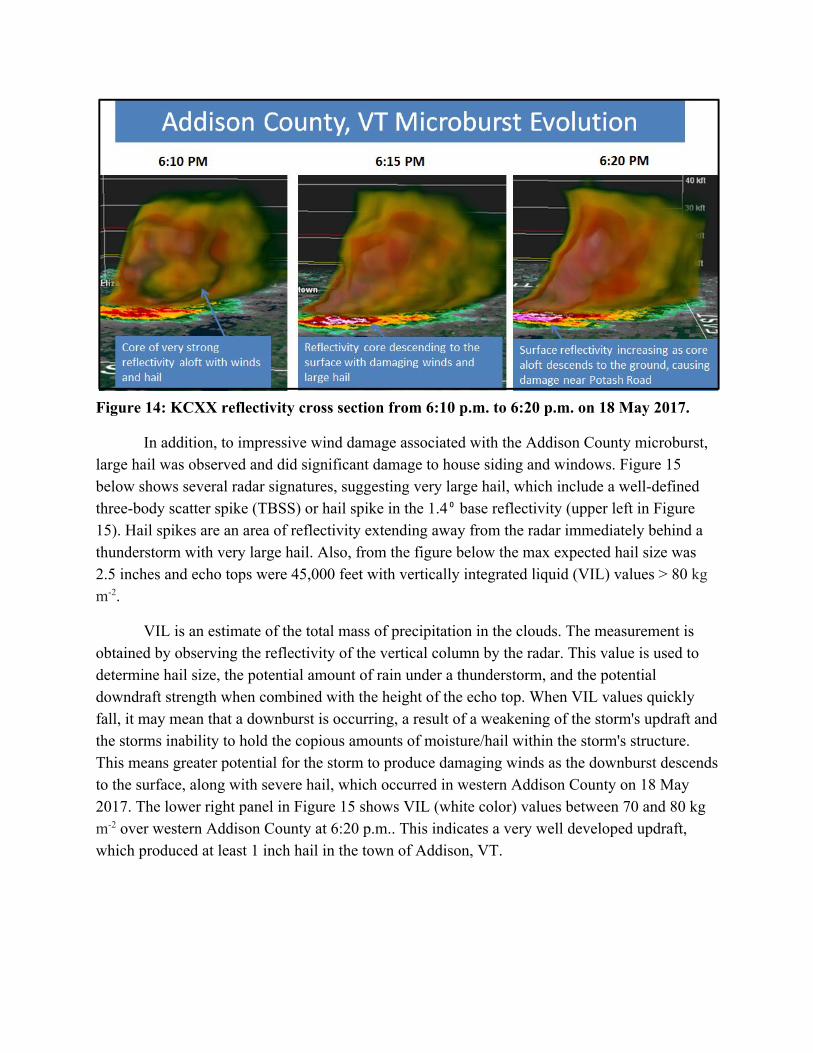
Figure 14: KCXX reflectivity cross section from 6:10 p.m. to 6:20 p.m. on 18 May 2017.
In addition, to impressive wind damage associated with the Addison County microburst, large hail was observed and did significant damage to house siding and windows. Figure 15 below shows several radar signatures, suggesting very large hail, which include a well-defined three-body scatter spike (TBSS) or hail spike in the 1.4⁰ base reflectivity (upper left in Figure 15). Hail spikes are an area of reflectivity extending away from the radar immediately behind a thunderstorm with very large hail. Also, from the figure below the max expected hail size was 2.5 inches and echo tops were 45,000 feet with vertically integrated liquid (VIL) values > 80 kg m-2.
VIL is an estimate of the total mass of precipitation in the clouds. The measurement is obtained by observing the reflectivity of the vertical column by the radar. This value is used to determine hail size, the potential amount of rain under a thunderstorm, and the potential downdraft strength when combined with the height of the echo top. When VIL values quickly fall, it may mean that a downburst is occurring, a result of a weakening of the storm's updraft and the storms inability to hold the copious amounts of moisture/hail within the storm's structure. This means greater potential for the storm to produce damaging winds as the downburst descends to the surface, along with severe hail, which occurred in western Addison County on 18 May 2017. The lower right panel in Figure 15 shows VIL (white color) values between 70 and 80 kg m-2 over western Addison County at 6:20 p.m.. This indicates a very well developed updraft, which produced at least 1 inch hail in the town of Addison, VT.

Figure 15: KCXX 1.4⁰ base reflectivity (upper left), echo top (upper right), max expected hail size (lower left), and vertically integrate liquid (lower right).
The final storm we will investigate is the Northeast Kingdom of Vermont severe thunderstorm, which blew over a tractor trailer in Barton and caused scattered tree damage and power outages. Figure 16 below shows a KCXX reflectivity cross section from 5:25 p.m. to 5:50 p.m. on 18 May 2017 and the associated life cycle of a severe thunderstorm. Notice at 5:25 p.m. the core of 55 to 60 dBZ (pink color in image below) extended up to 10,000 feet, but as the updraft strengthen this core at 5:30 p.m. climbed to over 20,000 feet and remind at this height at 5:35 p.m.. In addition this strong reflectivity core had a significant west to east tilt, with a sharp decrease of reflectivity on the backside, suggesting a descending rear inflow jet between 10,000 and 20,000 feet. This jet accelerated toward the surface when the core of higher reflectivity aloft collapsed, transferring damaging winds to the ground near Barton, Vermont. The thunderstorm encountered better instability across the upper Connecticut River Valley and produced additional damage in Northern New Hampshire.

Figure 16: KCXX base reflectivity cross section near Barton, VT from 525 p.m. to 550 p.m. on 18 May 2017.
7.) Damage Survey: The NWS BTV conducted a storm survey in the town of Addison, VT along Potash Bay
Road and determined a microburst produced 80 to 100 mph winds, which caused softwood tree damage at the intersection of Potash Bay Rd and Lake St and a small summer camp to get blown off its foundation at the corner near the western end of Potash Bay Rd. For the full Public Information Statement issued on the event see Appendix B. During this survey the NWS worked with the University of Vermont's (UVM) Unmanned Aircraft Systems (UAS) Team to gather aerial imagery of the survey area. UVM UAS team created a web mapping app (http://arcg.is/2rJVZ65) that allows you to swipe between the UAS imagery and historical basemap imagery. The UAS video can been seen here: https://youtu.be/n575fp4sgcI

Figure 17 below shows the University of Vermont UAS Team imagery around the intersection of Potash Bay Rd and Lake St. The yellow arrows show where trees have been blown down by the microburst all in a straight line from west to east. The UAS aerial imagery can be key data set to help meteorologists see things from the air that cannot readily be seen from the ground and confirm whether storm damage was due to a microburst or a tornado.

Figure 17: University of Vermont UAS Team imagery around the intersection of Potash Bay Rd and Lake St The yellow arrows show where trees have been blown down by the microburst all in a straight line from west to east.
Figure 18 below shows pictures taken by the NWS BTV survey team during their investigation of damage in western Addison County which included holes in the vinyl siding of several homes, the summer camp damage on Potash Bay Rd, and pine tree damage in that same area. Additional damage occurred associated with another microburst in South Burlington/Williston areas, where we received multiple reports of trees down and 1 inch

diameter hail. The final area of concentrated damage occurred in the Northeast Kingdom of Vermont, with a tractor trailer getting blown over in Barton and reports of trees and power lines down in Brighton, Maidstone, and East Burke.
Figure 18: Storm survey photos taken by NWS BTV.

8.) Conclusion:
This event featured the necessary ingredients to produce scattered strong to locally severe thunderstorms, which caused isolated areas of significant damage. The NWS BTV conducted a storm survey in the town of Addison along Potash Road and determined a microburst produced 80 to 100 mph winds, which caused tree damage and a camp to get blown off its foundation. Additional damage occurred with another microburst in South Burlington/Williston areas, where we received multiple reports of trees down and 1 inch diameter hail. The final area of concentrated damage occurred in the Northeast Kingdom of Vermont, with a tractor trailer getting blown over in Barton and reports of trees and power lines down in Brighton, Maidstone, and East Burke. These fast moving thunderstorms were fueled by very warm temperatures and strong mid level winds to produce an environment favorable for damaging winds as the main severe weather threat.
Appendix A
PRELIMINARY LOCAL STORM REPORT...SUMMARY NATIONAL WEATHER SERVICE BURLINGTON VT 959 PM EDT THU MAY 18 2017 ..TIME... ...EVENT... ...CITY LOCATION... ...LAT.LON... ..DATE... ....MAG.... ..COUNTY LOCATION..ST.. ...SOURCE.... ..REMARKS.. 0440 PM HAIL MORRISVILLE 44.56N 72.60W 05/18/2017 M0.25 INCH LAMOILLE VT PUBLIC 0454 PM HAIL 2 NNE AU SABLE FORKS 44.47N 73.66W 05/18/2017 E0.25 INCH CLINTON NY BROADCAST MEDIA 0500 PM HAIL 1 E NASHVILLE 44.45N 72.93W 05/18/2017 M0.25 INCH CHITTENDEN VT NWS EMPLOYEE 0525 PM TSTM WND GST 1 NE SOUTH BURLINGTON 44.48N 73.15W 05/18/2017 M58 MPH CHITTENDEN VT NWS OFFICE 0525 PM TSTM WND DMG SOUTH BURLINGTON 44.47N 73.17W 05/18/2017 CHITTENDEN VT PUBLIC MULTIPLE REPORTS OF SMALL TREES DOWN AND MINOR PROPERTY DAAMAGE. 0525 PM HAIL SOUTH BURLINGTON 44.47N 73.17W 05/18/2017 M0.50 INCH CHITTENDEN VT PUBLIC

MULTIPLE REPORTS OF SMALL TREES DOWN AND MINOR PROPERTY DAAMAGE. 0528 PM HAIL 2 NNW WILLISTON 44.45N 73.09W 05/18/2017 E1.00 INCH CHITTENDEN VT NWS EMPLOYEE 0533 PM TSTM WND DMG 1 W WILLISTON 44.44N 73.09W 05/18/2017 CHITTENDEN VT NWS EMPLOYEE TREE DOWN BLOCKING HIGHWAY 2A. 0540 PM TSTM WND DMG BLOOMFIELD 44.75N 71.63W 05/18/2017 ESSEX VT UTILITY COMPANY TREES AND POWERLINES DOWN 0541 PM HAIL UNDERHILL 44.53N 72.95W 05/18/2017 M0.25 INCH CHITTENDEN VT PUBLIC ESTIMATE WINDS BETWEEN 32 AND 38 MPH. 0548 PM TSTM WND DMG BARTON 44.75N 72.18W 05/18/2017 ORLEANS VT BROADCAST MEDIA TRACTOR TRAILER BLOWN OVER. 0549 PM TSTM WND DMG BARTON 44.75N 72.18W 05/18/2017 ORLEANS VT BROADCAST MEDIA TREES DOWN BLOCKING TRAIN TRACKS 0550 PM TSTM WND DMG EAST BRIGHTON 44.79N 71.81W 05/18/2017 ESSEX VT UTILITY COMPANY TREES AND POWERLINES DOWN 0555 PM TSTM WND DMG EAST BURKE 44.59N 71.94W 05/18/2017 CALEDONIA VT PUBLIC TREES DOWN 0610 PM TSTM WND DMG MAIDSTONE 44.65N 71.57W 05/18/2017 ESSEX VT UTILITY COMPANY TREES AND POWERLINES DOWN 0618 PM TSTM WND DMG WEST ADDISON 44.08N 73.39W

05/18/2017 ADDISON VT LAW ENFORCEMENT HOUSE KNOCKED OFF OF FOUNDATION ON POTASH BAY RD. 0627 PM HAIL ADDISON 44.09N 73.30W 05/18/2017 M1.00 INCH ADDISON VT PUBLIC 0627 PM HAIL ADDISON 44.09N 73.30W 05/18/2017 E1.00 INCH ADDISON VT BROADCAST MEDIA 0630 PM HAIL WEST ADDISON 44.08N 73.39W 05/18/2017 M0.75 INCH ADDISON VT TRAINED SPOTTER 0632 PM HAIL 2 E ADDISON 44.09N 73.26W 05/18/2017 M0.75 INCH ADDISON VT TRAINED SPOTTER 0654 PM HAIL 1 E WARREN 44.12N 72.83W 05/18/2017 E0.75 INCH WASHINGTON VT PUBLIC 0705 PM HAIL UNDERWOOD 44.09N 73.68W 05/18/2017 M1.00 INCH ESSEX NY PUBLIC 0705 PM TSTM WND DMG SE UNDERWOOD 44.09N 73.68W 05/18/2017 ESSEX NY EMERGENCY MNGR TREES DOWN BLOCKING ROUTE 9 NEAR UNDERWOOD 0745 PM HAIL FAIR HAVEN 43.60N 73.27W 05/18/2017 M0.75 INCH RUTLAND VT PUBLIC 0745 PM TSTM WND DMG EAST CORINTH 44.06N 72.22W 05/18/2017 ORANGE VT TRAINED SPOTTER HUGE TREES DOWN IN BACKYARD 0745 PM HAIL EAST CORINTH 44.06N 72.22W 05/18/2017 E0.75 INCH ORANGE VT TRAINED SPOTTER 0752 PM HAIL CASTLETON 43.61N 73.18W 05/18/2017 M0.25 INCH RUTLAND VT TRAINED SPOTTER 0803 PM TSTM WND GST WELLS 43.42N 73.20W 05/18/2017 M68 MPH RUTLAND VT MESONET


Appendix B Public Information Statement National Weather Service Burlington VT 404 PM EDT Fri May 19 2017
...Strong Microburst in Addison, Vermont on Thursday... A Severe Thunderstorm moved across Lake Champlain at approximately 615 pm on Thursday and moved ashore on Potash Bay Road in the town of Addison, Vermont.
The NWS Burlington office conducted a storm survey earlier this afternoon and has preliminary assessed that the damage was a result of a Microburst with estimated wind speeds of 80 to 100 mph. It appears the microburst initiated over Lake Champlain and then climbed the 50 foot embankment from the lake to the lakeshore on Potash Bay road.
There was substantial tree damage of softwood trees such as willow and pine trees that were snapped and uprooted along with broken branches on Potash Bay and Lake Roads.
One residence at 296 Potash Bay Road was destroyed as it appears the roof partially lifted off from the structure, as a result of a very strong west wind that was lifted from the lakeshore to the residence, and then the winds caused the structure to collapse upon itself with one occupant inside that suffered minor injuries.
There was sporadic soft wood tree damage within a few miles of the above locations, including Route 22A.
Also, there was substantial hail damage to siding of several residences on Potash Bay Road. Based on size of the holes on siding and eye witness accounts, it was likely hail size was 1 to 1.5 inch in diameter accelerated by 80 mph winds.
Remember, severe thunderstorm can do as much damage as an EF-0 or EF-1 tornado and generally have a larger areal extent. If you have any further questions, please contact NWS Burlington

&&