TVS Motor Company -...
15
COMPANY August 5, 2016 TVS Motor Company Modest fundamentals; Luxurious valuations Source: Capitaline SELL Nifty: 8,683; Sensex: 28,078 COMPANY OUTLOOK Table: Financial snapshot (Rsmn) Year Revenue EBITDA EBITDA (%) Adj. PAT EPS (Rs) P/E EV/EBITDA (x) RoE (%) RoCE (%) FY15 100,423 6,066 6.0 3,478 7.3 39.5 23.6 22.7 18.9 FY16 112,439 7,507 6.7 4,321 9.1 31.8 18.6 24.1 20.1 FY17E 126,905 9,130 7.2 4,884 10.3 26.2 14.2 23.2 21.3 FY18E 144,379 11,212 7.8 6,175 13.0 20.7 11.3 24.8 24.6 Source: Company; IDBI Capital Research*This marks the transfer of coverage from Ashish Poddar to Pranoy Kurian Summary Q1FY17 Results: Revenues grew 12% YoY to Rs28.8bn (vol. growth of 12.5%, with domestic growth of 18% and exports falling by 13%. Motorcycles and scooters rose 11% and 19%, respectively, while mopeds increased by 18%. Turmoil in key export markets continued impacting demand, with 3W exports down 46%). As a result, realizations were subpar, falling 0.5% YoY and 6% QoQ as the lower share of exports and 3W hurt ASP’s. Margins rose 24bps YoY to 7%, but this was partly due to certain raw material costs being classified under depreciation under IND-AS. PAT rose 21% to Rs1bn. Near Term Outlook: TVS should continue reporting strong domestic volume growth over FY16-18E on the back of aggressive pricing, robust demand for scooters & mopeds and near term favourable tailwinds such as GST/7PC/normal monsoons. The TVS Victor, 200cc Apache and a new moped model are now available nationwide and are likely to maintain domestic sales momentum for F17. Volumes from the TVS-BMW tie-up are likely to contribute to topline in H2FY17. We estimate revenue growth of 13% over FY16-18E, primarily driven by volumes (10% est.), with realizations likely to remain muted due to export pressure. Management’s aim to raise margins to ~10% seems unrealistic however, and we expect margins to stay capped at the 8% mark given the price sensitivity of TVS’ moped/scooter segments and rising gross margins. Thus, we estimate EPS growth of 20% over FY16-18E. Valuation: TVS remains a stable company with decent fundamentals – presence in high growth segments, RoEs of ~25% despite OPM margins of just ~7%, a well-established brand and improving cash flow. However, TVS is likely to continue facing heightened competition in the slowing 2W segment. At CMP, TVS trades at a premium valuation of 15x on an EV/EBIT basis and 21x on an FY18 P/E basis, expensive when compared to better placed peers such as MSIL (22x) and at a substantial premium to BJAUT/HMCL. We assign the stock a 12X multiple on FY18E/EV/EBIT (16x standalone FY18 P/E) and add Rs34/a share for investments/JVs. We value the stock at Rs244 and recommend a SELL. Outlook and View 2W long term growth holds lower potential than PV’s: India’s 2W penetration has increased enormously over the past decade (~13% now vs. ~8% in 2010). However, while comparing penetration rates of 2W and PV’s in India vs other economies, we believe that the growth potential for 2Ws remains substantially below PVs (~2.5% penetration). Given the large existing base, the scope for doubling or even tripling 2W penetration rates within a decade remains far more of a challenge than it is for PV penetration rates (from ~3% to ~5% or ~8%). While scooterization will boost TVS’ short term revenue growth, industry growth is likely to moderate on the back of potential uptrending and saturation among the female workforce. Thus, for the overall 2W industry, we expect a lower growth trajectory ~7-8%+ volume growth over the next decade as compared to PVs (~10-12%+). The Ever Elusive Margin Expansion:One of the oft-cited investment rationales for TVS has been the possibility of a structural improvement in margins. Given the low base of current margins (7%), a shift towards 10% would yield a sharp rise in profitability (a 100bps margin increase boosts EPS by ~20-25%). However, TVS’ long term track record doesn’t offer much comfort, as margins have stubbornly stuck to 6-7% over the past decade. Key challenges to margin expansion include 1) High Ad/promotion spend relative to peers 2) Core segments of TVS’ revenue (mopeds, scooters) are inherently price sensitive and lower margin 3) Recent margin expansion was driven by declining commodity costs rather than structural changes, and this trend is reversing 4) Exports (higher margin) are seeing deep declines in volumes on macro-economic issues and 5) Rising competitive intensity in the scooter segment is likely to leave TVS little room for price increases. CMP Rs303 Target Price Rs244 Potential Upside/Downside (19)% Sector Automobiles Bloomberg / Reuters TVSL IN/TVSM.BO Shares o/s (mn) 475 Market cap. (Rsmn) 143,949 Market cap. (US$ mn) 2,147 3-m daily average vol. 161,240 Key Stock Data 52-week high/low Rs341/201 -1m -3m -12m Absolute (%) (1) 3 29 Rel to Sensex (%) (4) (9) 30 Price Performance Promoters 57.4 FIIs/NRIs/OCBs/GDR 15.5 MFs/Banks/FIs 14.5 Non Promoter Corporate 1.5 Public & Others 11.1 Shareholding Pattern (%) Relative to Sensex 70 80 90 100 110 120 130 140 150 May-15 Jun-15 Jul-15 Aug-15 Sep-15 Oct-15 Nov-15 Dec-15 Dec-15 Jan-16 Feb-16 Mar-16 Apr-16 May-16 Jun-16 Jul-16 TVSL Sensex
Transcript of TVS Motor Company -...
COMPANY
REPORT
August 5, 2016
TVS Motor Company Modest fundamentals; Luxurious valuations
Source: Capitaline
SELL Nifty: 8,683; Sensex: 28,078
COMPANY
OUTLOOK
Table: Financial snapshot (Rsmn)
Year Revenue EBITDA EBITDA (%) Adj. PAT EPS (Rs) P/E
(x)
EV/EBITDA (x) RoE (%) RoCE (%)
FY15 100,423 6,066 6.0 3,478 7.3 39.5 23.6 22.7 18.9
FY16 112,439 7,507 6.7 4,321 9.1 31.8 18.6 24.1 20.1
FY17E 126,905 9,130 7.2 4,884 10.3 26.2 14.2 23.2 21.3
FY18E 144,379 11,212 7.8 6,175 13.0 20.7 11.3 24.8 24.6 Source: Company; IDBI Capital Research*This marks the transfer of coverage from Ashish Poddar to Pranoy Kurian
Summary
Q1FY17 Results: Revenues grew 12% YoY to Rs28.8bn (vol. growth of 12.5%, with domestic growth of 18% and exports falling by 13%. Motorcycles and scooters rose 11% and 19%, respectively, while mopeds increased by 18%. Turmoil in key export markets continued impacting demand, with 3W exports down 46%). As a result, realizations were subpar, falling 0.5% YoY and 6% QoQ as the lower share of exports and 3W hurt ASP’s. Margins rose 24bps YoY to 7%, but this was partly due to certain raw material costs being classified under depreciation under IND-AS. PAT rose 21% to Rs1bn.
Near Term Outlook: TVS should continue reporting strong domestic volume growth over FY16-18E on the back of aggressive pricing, robust demand for scooters & mopeds and near term favourable tailwinds such as GST/7PC/normal monsoons. The TVS Victor, 200cc Apache and a new moped model are now available nationwide and are likely to maintain domestic sales momentum for F17. Volumes from the TVS-BMW tie-up are likely to contribute to topline in H2FY17. We estimate revenue growth of 13% over FY16-18E, primarily driven by volumes (10% est.), with realizations likely to remain muted due to export pressure. Management’s aim to raise margins to ~10% seems unrealistic however, and we expect margins to stay capped at the 8% mark given the price sensitivity of TVS’ moped/scooter segments and rising gross margins. Thus, we estimate EPS growth of 20% over FY16-18E.
Valuation: TVS remains a stable company with decent fundamentals – presence in high growth segments, RoEs of ~25% despite OPM margins of just ~7%, a well-established brand and improving cash flow. However, TVS is likely to continue facing heightened competition in the slowing 2W segment. At CMP, TVS trades at a premium valuation of 15x on an EV/EBIT basis and 21x on an FY18 P/E basis, expensive when compared to better placed peers such as MSIL (22x) and at a substantial premium to BJAUT/HMCL. We assign the stock a 12X multiple on FY18E/EV/EBIT (16x standalone FY18 P/E) and add Rs34/a share for investments/JVs. We value the stock at Rs244 and recommend a SELL.
Outlook and View 2W long term growth holds lower potential than PV’s: India’s 2W penetration has increased
enormously over the past decade (~13% now vs. ~8% in 2010). However, while comparing penetration rates of 2W and PV’s in India vs other economies, we believe that the growth potential for 2Ws remains substantially below PVs (~2.5% penetration). Given the large existing base, the scope for doubling or even tripling 2W penetration rates within a decade remains far more of a challenge than it is for PV penetration rates (from ~3% to ~5% or ~8%). While scooterization will boost TVS’ short term revenue growth, industry growth is likely to moderate on the back of potential uptrending and saturation among the female workforce. Thus, for the overall 2W industry, we expect a lower growth trajectory ~7-8%+ volume growth over the next decade as compared to PVs (~10-12%+).
The Ever Elusive Margin Expansion:One of the oft-cited investment rationales for TVS has been the possibility of a structural improvement in margins. Given the low base of current margins (7%), a shift towards 10% would yield a sharp rise in profitability (a 100bps margin increase boosts EPS by ~20-25%). However, TVS’ long term track record doesn’t offer much comfort, as margins have stubbornly stuck to 6-7% over the past decade. Key challenges to margin expansion include 1) High Ad/promotion spend relative to peers 2) Core segments of TVS’ revenue (mopeds, scooters) are inherently price sensitive and lower margin 3) Recent margin expansion was driven by declining commodity costs rather than structural changes, and this trend is reversing 4) Exports (higher margin) are seeing deep declines in volumes on macro-economic issues and 5) Rising competitive intensity in the scooter segment is likely to leave TVS little room for price increases.
CMP Rs303
Target Price Rs244
Potential Upside/Downside (19)%
Sector Automobiles
Bloomberg / Reuters TVSL IN/TVSM.BO
Shares o/s (mn) 475
Market cap. (Rsmn) 143,949
Market cap. (US$ mn) 2,147
3-m daily average vol. 161,240
Key Stock Data
52-week high/low Rs341/201
-1m -3m -12m
Absolute (%) (1) 3 29
Rel to Sensex (%) (4) (9) 30
Price Performance
Promoters 57.4
FIIs/NRIs/OCBs/GDR 15.5
MFs/Banks/FIs 14.5
Non Promoter Corporate 1.5
Public & Others 11.1
Shareholding Pattern (%)
Relative to Sensex
708090
100110120130140150
May
-15
Jun
-15
Jul-
15
Au
g-15
Sep
-15
Oct
-15
No
v-15
Dec
-15
Dec
-15
Jan
-16
Feb
-16
Mar
-16
Ap
r-16
May
-16
Jun
-16
Jul-
16
TVSL Sensex
2
Company Outlook – TVS Motor Company
Near term growth brisk
GST/7th Pay Commission/Above normal monsoon: Implementation of GST would result in TVS’ products
seeing a 5-7% lower price, while also ensuring an offset of safety/emission norms related costs for BS-IV.
Higher consumer spending due to other macro-economic factors should see domestic growth continuing to
outpace exports for FY17. A boost to consumer spending would add buoyancy to FY18 revenues for TVS.
Scooters could see a boost in first time buyers in rural geographies (45% of volumes), as spending recovers on
the back of normal/above average monsoon.
New launches successful: The TVS Victor is now available nation-wide which should help the company gain
marketshare in the Executive Segment. The Executive segment has always been a weak spot for TVS (low
marketshare), thus incremental growth from the Victor would contribute meaningfully to the topline.
Increasing traction for recent models such as the Jupiter and Starcity models are continuing to help TVS’s see
robust growth. The upgrade to the Apache has been flourishing in the premium segment.
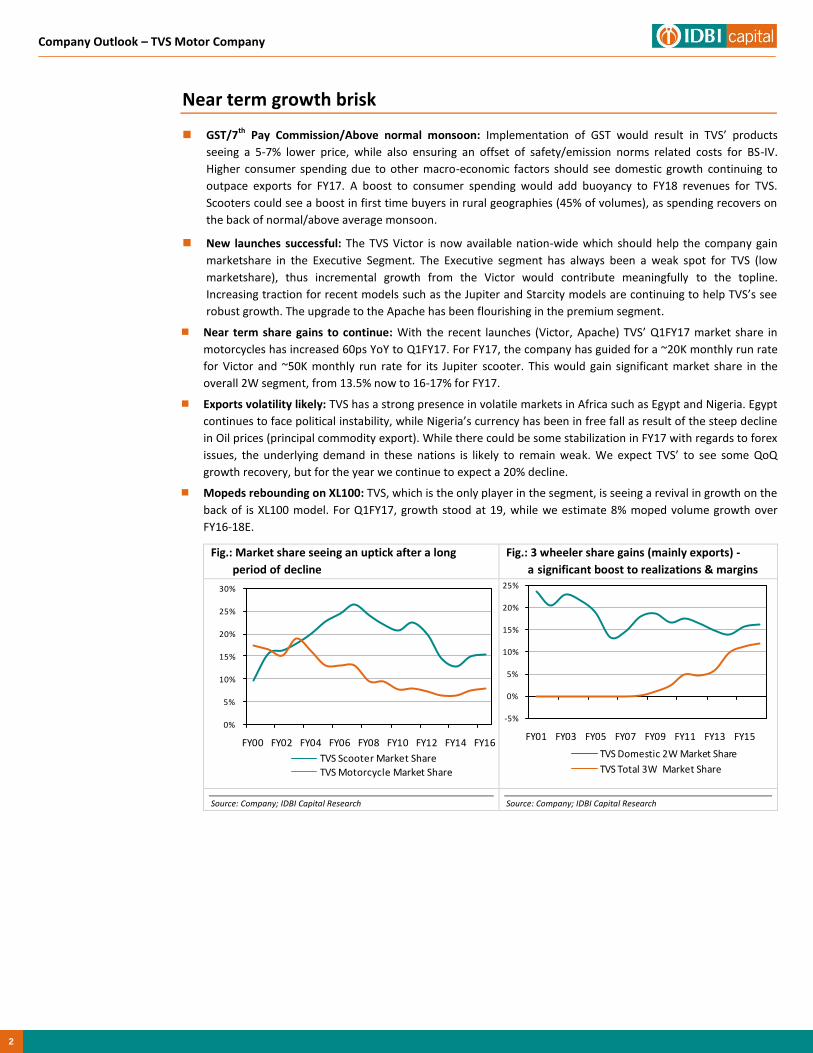
Near term share gains to continue: With the recent launches (Victor, Apache) TVS’ Q1FY17 market share in
motorcycles has increased 60ps YoY to Q1FY17. For FY17, the company has guided for a ~20K monthly run rate
for Victor and ~50K monthly run rate for its Jupiter scooter. This would gain significant market share in the
overall 2W segment, from 13.5% now to 16-17% for FY17.
Exports volatility likely: TVS has a strong presence in volatile markets in Africa such as Egypt and Nigeria. Egypt
continues to face political instability, while Nigeria’s currency has been in free fall as result of the steep decline
in Oil prices (principal commodity export). While there could be some stabilization in FY17 with regards to forex
issues, the underlying demand in these nations is likely to remain weak. We expect TVS’ to see some QoQ
growth recovery, but for the year we continue to expect a 20% decline.
Mopeds rebounding on XL100: TVS, which is the only player in the segment, is seeing a revival in growth on the
back of is XL100 model. For Q1FY17, growth stood at 19, while we estimate 8% moped volume growth over
FY16-18E.
Fig.: Market share seeing an uptick after a long
Fig.:period of:decline
Fig.: 3 wheeler share gains (mainly exports) -
Fig.:a:significant boost to realizations & margins
Source: Company; IDBI Capital Research Source: Company; IDBI Capital Research
0%
5%
10%
15%
20%
25%
30%
FY00 FY02 FY04 FY06 FY08 FY10 FY12 FY14 FY16
TVS Scooter Market Share
TVS Motorcycle Market Share
-5%
0%
5%
10%
15%
20%
25%
FY01 FY03 FY05 FY07 FY09 FY11 FY13 FY15
TVS Domestic 2W Market Share
TVS Total 3W Market Share
Company Outlook – TVS Motor Company
3
Fig.: TVS Product mix: Scooterization benefiting TVS Fig.: Quarterly growth- Domestic growth
Fig.:powering up, offsetting weakness in exports
Source: SIAM; IDBI Capital Research Source: Company; IDBI Capital Research
Longer term growth picture less rosy
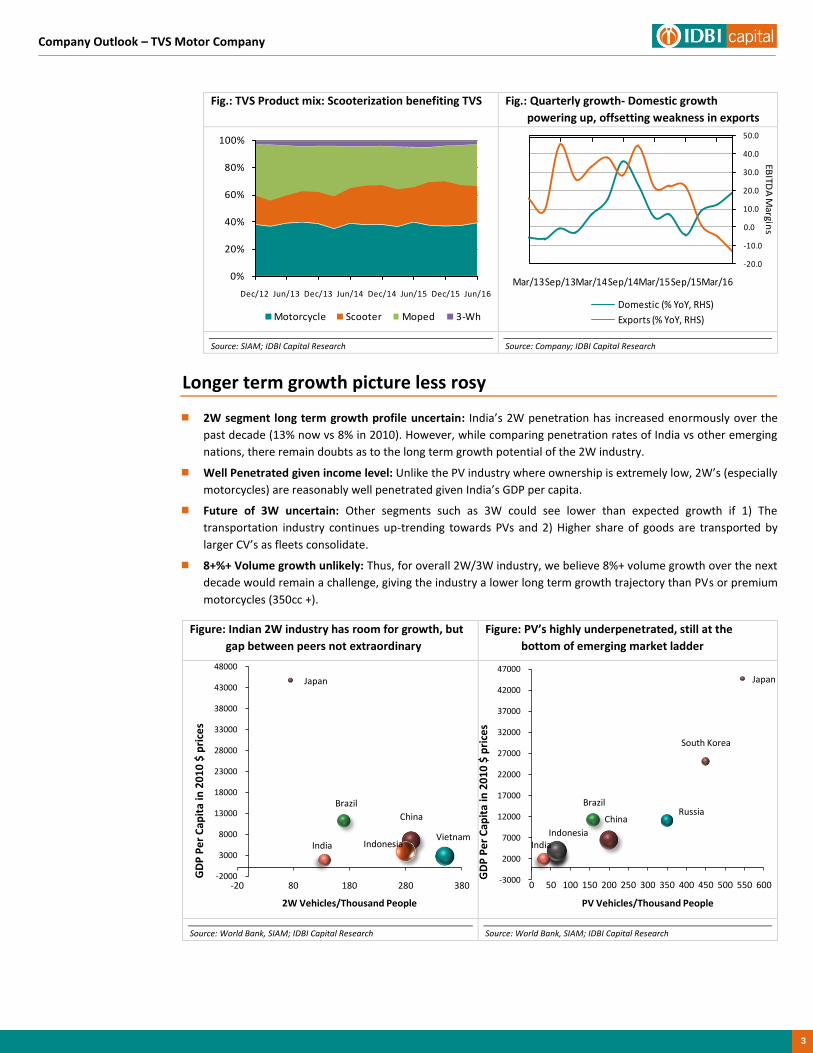
2W segment long term growth profile uncertain: India’s 2W penetration has increased enormously over the
past decade (13% now vs 8% in 2010). However, while comparing penetration rates of India vs other emerging
nations, there remain doubts as to the long term growth potential of the 2W industry.
Well Penetrated given income level: Unlike the PV industry where ownership is extremely low, 2W’s (especially
motorcycles) are reasonably well penetrated given India’s GDP per capita.
Future of 3W uncertain: Other segments such as 3W could see lower than expected growth if 1) The
transportation industry continues up-trending towards PVs and 2) Higher share of goods are transported by
larger CV’s as fleets consolidate.
8+%+ Volume growth unlikely: Thus, for overall 2W/3W industry, we believe 8%+ volume growth over the next
decade would remain a challenge, giving the industry a lower long term growth trajectory than PVs or premium
motorcycles (350cc +).
Figure: Indian 2W industry has room for growth, but
Figure:gap between peers not extraordinary
Figure: PV’s highly underpenetrated, still at the
Figure:bottom of emerging market ladder
Source: World Bank, SIAM; IDBI Capital Research Source: World Bank, SIAM; IDBI Capital Research
0%
20%
40%
60%
80%
100%
Dec/12 Jun/13 Dec/13 Jun/14 Dec/14 Jun/15 Dec/15 Jun/16
Motorcycle Scooter Moped 3-Wh
-20.0
-10.0
0.0
10.0
20.0
30.0
40.0
50.0
Mar/13Sep/13Mar/14Sep/14Mar/15Sep/15Mar/16
EBITD
A M
argins
Domestic (% YoY, RHS)
Exports (% YoY, RHS)
China
Brazil
IndonesiaIndiaVietnam
Japan
-2000
3000
8000
13000
18000
23000
28000
33000
38000
43000
48000
-20 80 180 280 380
GD
P P
er
Cap
ita
in 2
01
0 $
pri
ces
2W Vehicles/Thousand People
China
Brazil
India
Russia
South Korea
Japan
Indonesia
-3000
2000
7000
12000
17000
22000
27000
32000
37000
42000
47000
0 50 100 150 200 250 300 350 400 450 500 550 600
GD
P P
er
Cap
ita
in 2
01
0 $
pri
ces
PV Vehicles/Thousand People
4
Company Outlook – TVS Motor Company
Figure: Total Registered Motor vehicles – 2W have
Figure:seen robust growth in past decade
Figure: Growth for 2W now on a higher base
Figure:compared to PVs
Source: World Bank, SIAM; IDBI Capital Research Source: World Bank, SIAM; IDBI Capital Research
The Ever Elusive Margin Expansion
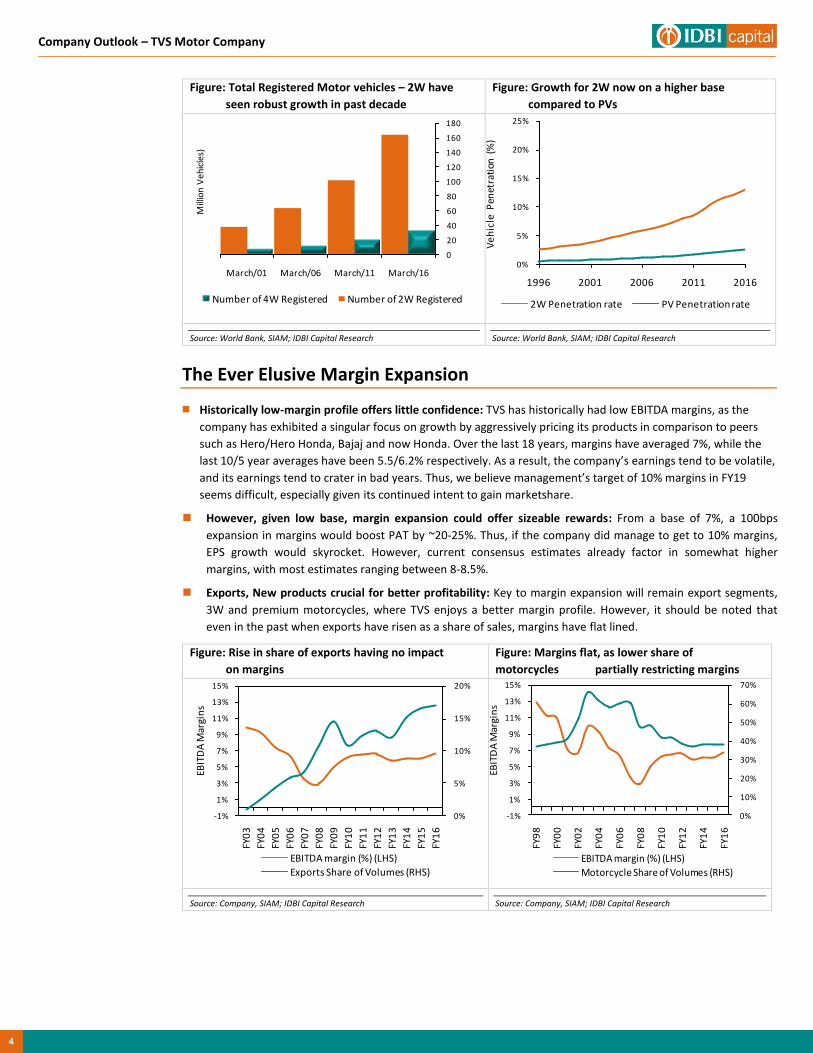
Historically low-margin profile offers little confidence: TVS has historically had low EBITDA margins, as the
company has exhibited a singular focus on growth by aggressively pricing its products in comparison to peers
such as Hero/Hero Honda, Bajaj and now Honda. Over the last 18 years, margins have averaged 7%, while the
last 10/5 year averages have been 5.5/6.2% respectively. As a result, the company’s earnings tend to be volatile,
and its earnings tend to crater in bad years. Thus, we believe management’s target of 10% margins in FY19
seems difficult, especially given its continued intent to gain marketshare.
However, given low base, margin expansion could offer sizeable rewards: From a base of 7%, a 100bps
expansion in margins would boost PAT by ~20-25%. Thus, if the company did manage to get to 10% margins,
EPS growth would skyrocket. However, current consensus estimates already factor in somewhat higher
margins, with most estimates ranging between 8-8.5%.
Exports, New products crucial for better profitability: Key to margin expansion will remain export segments,
3W and premium motorcycles, where TVS enjoys a better margin profile. However, it should be noted that
even in the past when exports have risen as a share of sales, margins have flat lined.
Figure: Rise in share of exports having no impact
Figure:on margins
Figure: Margins flat, as lower share of
motorcyclesFigure:partially restricting margins
Source: Company, SIAM; IDBI Capital Research Source: Company, SIAM; IDBI Capital Research
0
20
40
60
80
100
120
140
160
180
March/16March/11March/06March/01
Mill
ion
Veh
icle
s)
Number of 4W Registered Number of 2W Registered
0%
5%
10%
15%
20%
25%
1996 2001 2006 2011 2016
Ve
hic
le P
enet
rati
on (
%)
2W Penetration rate PV Penetration rate
0%
5%
10%
15%
20%
-1%
1%
3%
5%
7%
9%
11%
13%
15%
FY0
3
FY0
4
FY0
5
FY0
6
FY0
7
FY0
8
FY0
9
FY1
0
FY1
1
FY1
2
FY1
3
FY1
4
FY1
5
FY1
6
EBIT
DA
Mar
gin
s
EBITDA margin (%) (LHS)
Exports Share of Volumes (RHS)
0%
10%
20%
30%
40%
50%
60%
70%
-1%
1%
3%
5%
7%
9%
11%
13%
15%
FY9
8
FY0
0
FY0
2
FY0
4
FY0
6
FY0
8
FY1
0
FY1
2
FY1
4
FY1
6
EBIT
DA
Mar
gin
s
EBITDA margin (%) (LHS)
Motorcycle Share of Volumes (RHS)
Company Outlook – TVS Motor Company
5
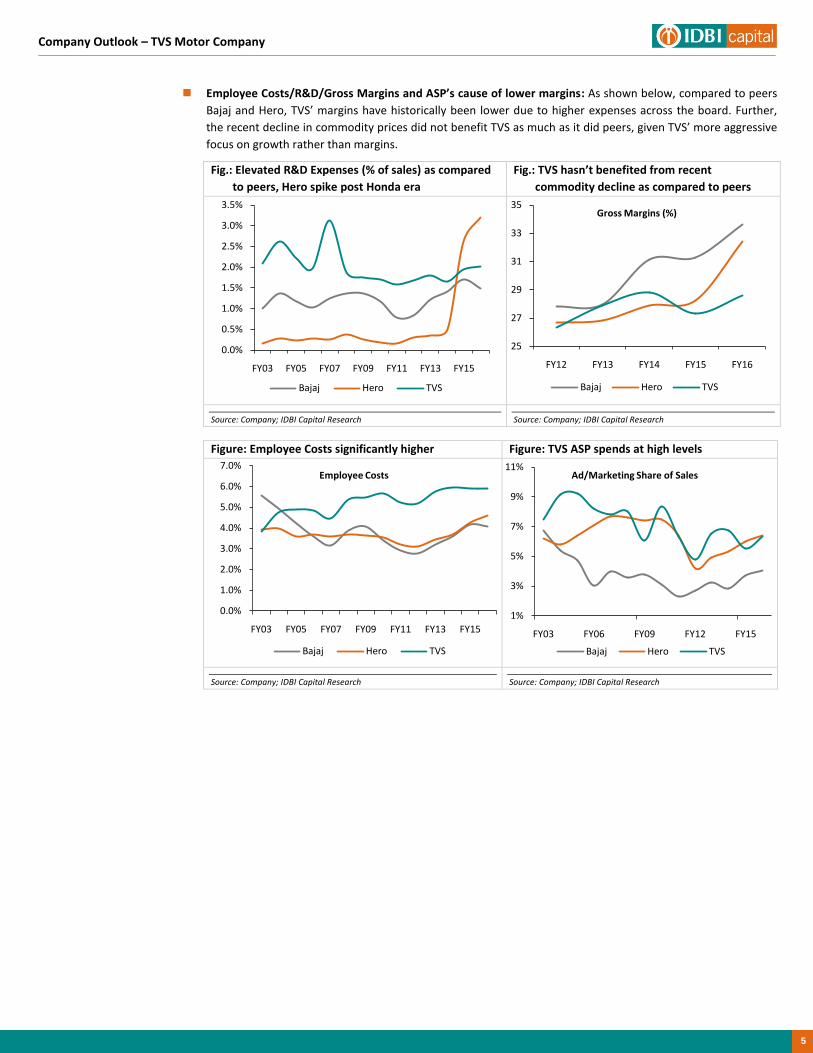
Employee Costs/R&D/Gross Margins and ASP’s cause of lower margins: As shown below, compared to peers
Bajaj and Hero, TVS’ margins have historically been lower due to higher expenses across the board. Further,
the recent decline in commodity prices did not benefit TVS as much as it did peers, given TVS’ more aggressive
focus on growth rather than margins.
Fig.: Elevated R&D Expenses (% of sales) as compared
Fig.:to peers, Hero spike post Honda era
Fig.: TVS hasn’t benefited from recent
Figucommodity decline as compared to peers
Source: Company; IDBI Capital Research Source: Company; IDBI Capital Research
Figure: Employee Costs significantly higher Figure: TVS ASP spends at high levels
Source: Company; IDBI Capital Research Source: Company; IDBI Capital Research
0.0%
0.5%
1.0%
1.5%
2.0%
2.5%
3.0%
3.5%
FY03 FY05 FY07 FY09 FY11 FY13 FY15
Bajaj Hero TVS
25
27
29
31
33
35
FY12 FY13 FY14 FY15 FY16
Gross Margins (%)
Bajaj Hero TVS
0.0%
1.0%
2.0%
3.0%
4.0%
5.0%
6.0%
7.0%
FY03 FY05 FY07 FY09 FY11 FY13 FY15
Employee Costs
Bajaj Hero TVS
1%
3%
5%
7%
9%
11%
FY03 FY06 FY09 FY12 FY15
Ad/Marketing Share of Sales
Bajaj Hero TVS
6
Company Outlook – TVS Motor Company
Other Challenges
Competitive profile of industry high; Additional growth levers limited
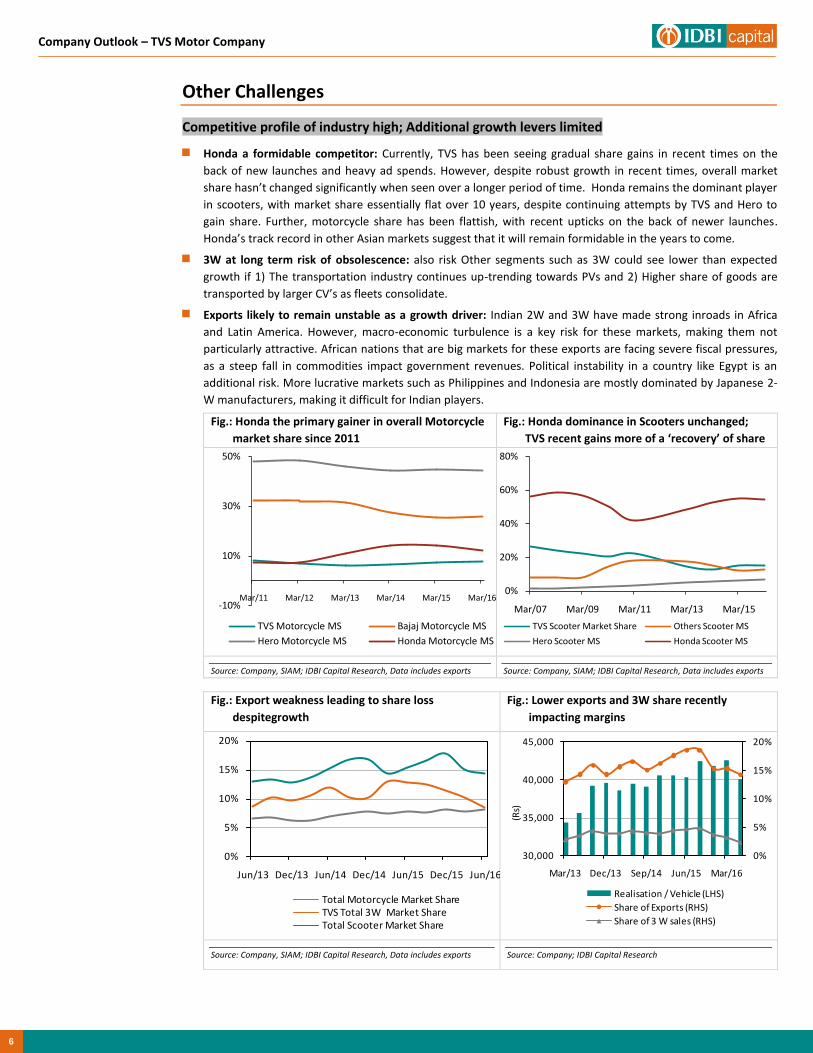
Honda a formidable competitor: Currently, TVS has been seeing gradual share gains in recent times on the
back of new launches and heavy ad spends. However, despite robust growth in recent times, overall market
share hasn’t changed significantly when seen over a longer period of time. Honda remains the dominant player
in scooters, with market share essentially flat over 10 years, despite continuing attempts by TVS and Hero to
gain share. Further, motorcycle share has been flattish, with recent upticks on the back of newer launches.
Honda’s track record in other Asian markets suggest that it will remain formidable in the years to come.
3W at long term risk of obsolescence: also risk Other segments such as 3W could see lower than expected
growth if 1) The transportation industry continues up-trending towards PVs and 2) Higher share of goods are
transported by larger CV’s as fleets consolidate.
Exports likely to remain unstable as a growth driver: Indian 2W and 3W have made strong inroads in Africa
and Latin America. However, macro-economic turbulence is a key risk for these markets, making them not
particularly attractive. African nations that are big markets for these exports are facing severe fiscal pressures,
as a steep fall in commodities impact government revenues. Political instability in a country like Egypt is an
additional risk. More lucrative markets such as Philippines and Indonesia are mostly dominated by Japanese 2-
W manufacturers, making it difficult for Indian players.
Fig.: Honda the primary gainer in overall Motorcycle
Fig.:market share since 2011
Fig.: Honda dominance in Scooters unchanged;
Fig.:TVS recent gains more of a ‘recovery’ of share
Source: Company, SIAM; IDBI Capital Research, Data includes exports Source: Company, SIAM; IDBI Capital Research, Data includes exports
Fig.: Export weakness leading to share loss
Fig.:despitegrowth
Fig.: Lower exports and 3W share recently
Fig.:impacting margins
Source: Company, SIAM; IDBI Capital Research, Data includes exports Source: Company; IDBI Capital Research
-10%
10%
30%
50%
Mar/11 Mar/12 Mar/13 Mar/14 Mar/15 Mar/16
TVS Motorcycle MS Bajaj Motorcycle MS
Hero Motorcycle MS Honda Motorcycle MS
0%
20%
40%
60%
80%
Mar/07 Mar/09 Mar/11 Mar/13 Mar/15
TVS Scooter Market Share Others Scooter MS
Hero Scooter MS Honda Scooter MS
0%
5%
10%
15%
20%
Jun/13 Dec/13 Jun/14 Dec/14 Jun/15 Dec/15 Jun/16
Total Motorcycle Market ShareTVS Total 3W Market ShareTotal Scooter Market Share
0%
5%
10%
15%
20%
30,000
35,000
40,000
45,000
Mar/13 Dec/13 Sep/14 Jun/15 Mar/16
(Rs)
Realisation / Vehicle (LHS)
Share of Exports (RHS)
Share of 3 W sales (RHS)
Company Outlook – TVS Motor Company
7
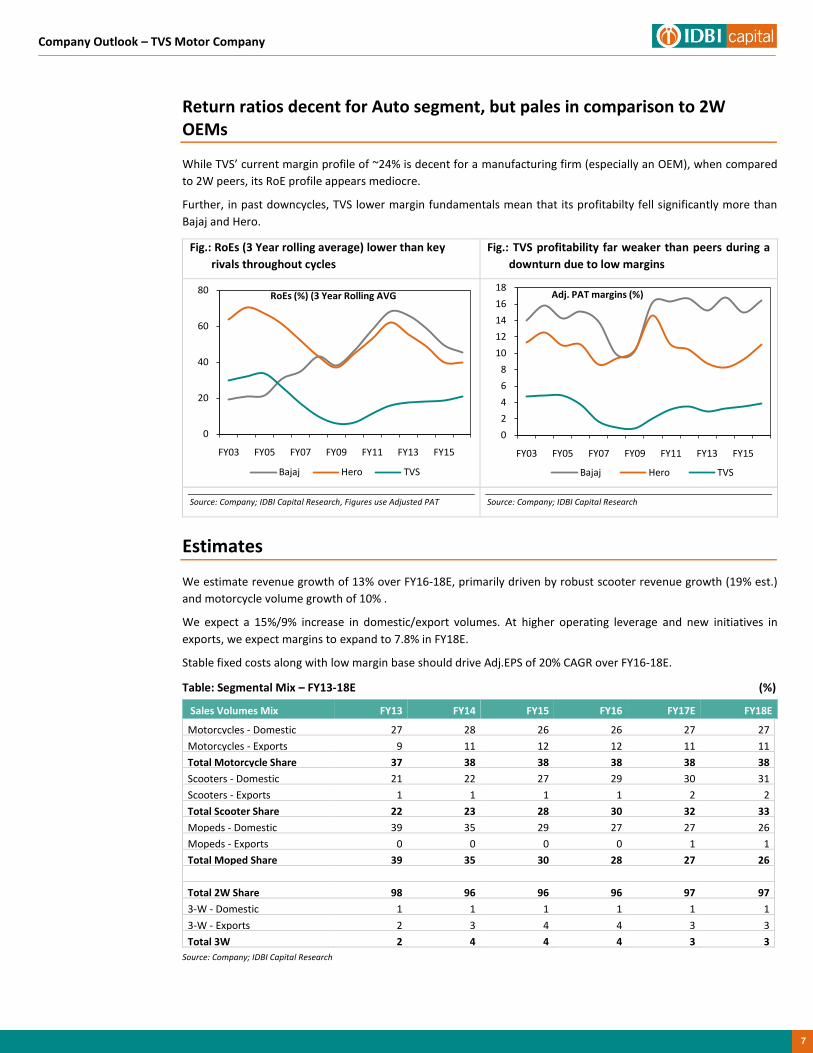
Return ratios decent for Auto segment, but pales in comparison to 2W OEMs
While TVS’ current margin profile of ~24% is decent for a manufacturing firm (especially an OEM), when compared
to 2W peers, its RoE profile appears mediocre.
Further, in past downcycles, TVS lower margin fundamentals mean that its profitabilty fell significantly more than
Bajaj and Hero.
Fig.: RoEs (3 Year rolling average) lower than key
Fig.:rivals throughout cycles
Fig.: TVS profitability far weaker than peers during a
Fig.:downturn due to low margins
Source: Company; IDBI Capital Research, Figures use Adjusted PAT Source: Company; IDBI Capital Research
Estimates
We estimate revenue growth of 13% over FY16-18E, primarily driven by robust scooter revenue growth (19% est.)
and motorcycle volume growth of 10% .
We expect a 15%/9% increase in domestic/export volumes. At higher operating leverage and new initiatives in
exports, we expect margins to expand to 7.8% in FY18E.
Stable fixed costs along with low margin base should drive Adj.EPS of 20% CAGR over FY16-18E.
Table: Segmental Mix – FY13-18E (%)
Sales Volumes Mix FY13 FY14 FY15 FY16 FY17E FY18E
Motorcycles - Domestic 27 28 26 26 27 27
Motorcycles - Exports 9 11 12 12 11 11
Total Motorcycle Share 37 38 38 38 38 38
Scooters - Domestic 21 22 27 29 30 31
Scooters - Exports 1 1 1 1 2 2
Total Scooter Share 22 23 28 30 32 33
Mopeds - Domestic 39 35 29 27 27 26
Mopeds - Exports 0 0 0 0 1 1
Total Moped Share 39 35 30 28 27 26
Total 2W Share 98 96 96 96 97 97
3-W - Domestic 1 1 1 1 1 1
3-W - Exports 2 3 4 4 3 3
Total 3W 2 4 4 4 3 3
Source: Company; IDBI Capital Research
0
20
40
60
80
FY03 FY05 FY07 FY09 FY11 FY13 FY15
RoEs (%) (3 Year Rolling AVG
Bajaj Hero TVS
0
2
4
6
8
10
12
14
16
18
FY03 FY05 FY07 FY09 FY11 FY13 FY15
Adj. PAT margins (%)
Bajaj Hero TVS
8
Company Outlook – TVS Motor Company
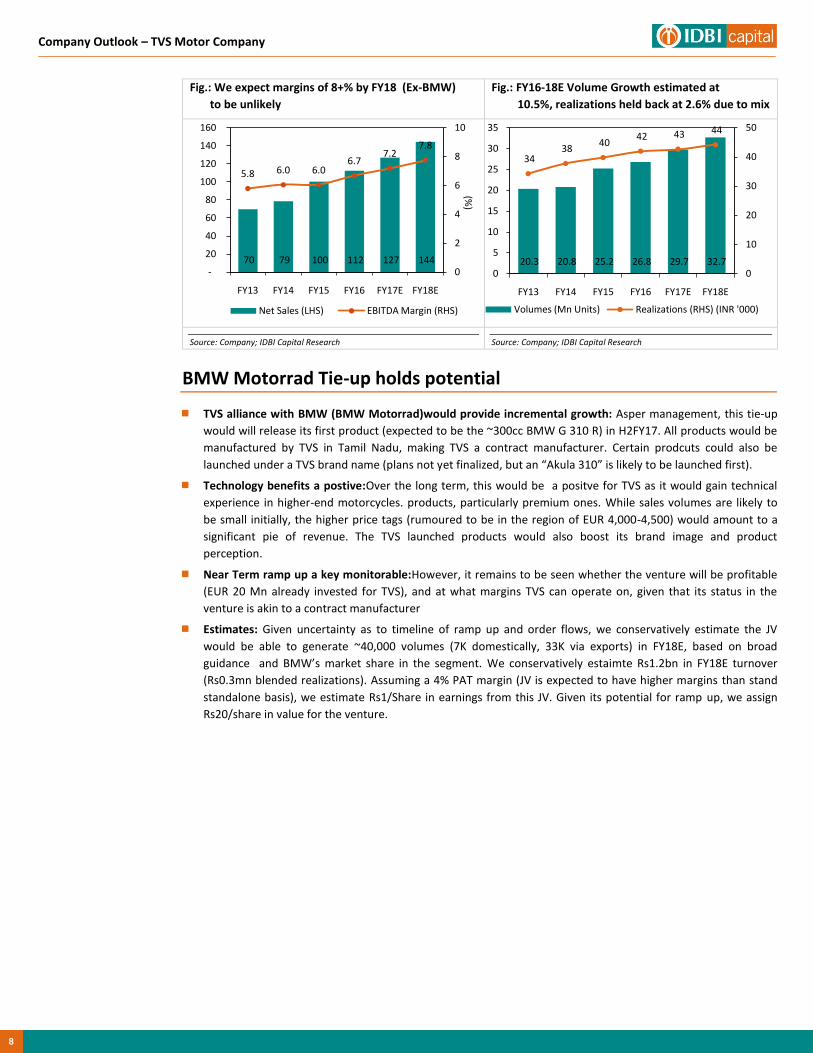
Fig.: We expect margins of 8+% by FY18 (Ex-BMW)
Fre:to be unlikely
Fig.: FY16-18E Volume Growth estimated at
Figur10.5%, realizations held back at 2.6% due to mix
Source: Company; IDBI Capital Research Source: Company; IDBI Capital Research
BMW Motorrad Tie-up holds potential
TVS alliance with BMW (BMW Motorrad)would provide incremental growth: Asper management, this tie-up
would will release its first product (expected to be the ~300cc BMW G 310 R) in H2FY17. All products would be
manufactured by TVS in Tamil Nadu, making TVS a contract manufacturer. Certain prodcuts could also be
launched under a TVS brand name (plans not yet finalized, but an “Akula 310” is likely to be launched first).
Technology benefits a postive:Over the long term, this would be a positve for TVS as it would gain technical
experience in higher-end motorcycles. products, particularly premium ones. While sales volumes are likely to
be small initially, the higher price tags (rumoured to be in the region of EUR 4,000-4,500) would amount to a
significant pie of revenue. The TVS launched products would also boost its brand image and product
perception.
Near Term ramp up a key monitorable:However, it remains to be seen whether the venture will be profitable
(EUR 20 Mn already invested for TVS), and at what margins TVS can operate on, given that its status in the
venture is akin to a contract manufacturer
Estimates: Given uncertainty as to timeline of ramp up and order flows, we conservatively estimate the JV
would be able to generate ~40,000 volumes (7K domestically, 33K via exports) in FY18E, based on broad
guidance and BMW’s market share in the segment. We conservatively estaimte Rs1.2bn in FY18E turnover
(Rs0.3mn blended realizations). Assuming a 4% PAT margin (JV is expected to have higher margins than stand
standalone basis), we estimate Rs1/Share in earnings from this JV. Given its potential for ramp up, we assign
Rs20/share in value for the venture.
70 79 100 112 127 144
5.8 6.0 6.06.7
7.27.8
-
20
40
60
80
100
120
140
160
0
2
4
6
8
10
FY13 FY14 FY15 FY16 FY17E FY18E
(%)
Net Sales (LHS) EBITDA Margin (RHS)
20.3 20.8 25.2 26.8 29.7 32.7
34 38
40 42 43 44
0
5
10
15
20
25
30
35
0
10
20
30
40
50
FY13 FY14 FY15 FY16 FY17E FY18E
Volumes (Mn Units) Realizations (RHS) (INR '000)
Company Outlook – TVS Motor Company
9
Valuation
Overall, TVS possesses decent fundamentals within the auto segment – RoEs of 24-26%, good growth potential on
the back of rising scooterization and the possibility of strong growth via the BMW alliance. However, there exist
certain key risks that could impact the stock. Continued weakness in the high realization exports market could
lower margins and reduce longer term growth visibility.
The 2W market (especially motorcycles) is also unlikely to grow at rates seen in the previous decade, given the
much higher penetration rate and the possibility of uptrending on the parts of consumers. TVS’ razor thin margins,
that have historically been at the ~6-7% mark, increase the volatility of earnings and uncertainty. Given market
expectations of significant margin expansion (FY18 consensus margins is at 8.3%), there remains little room for
error.
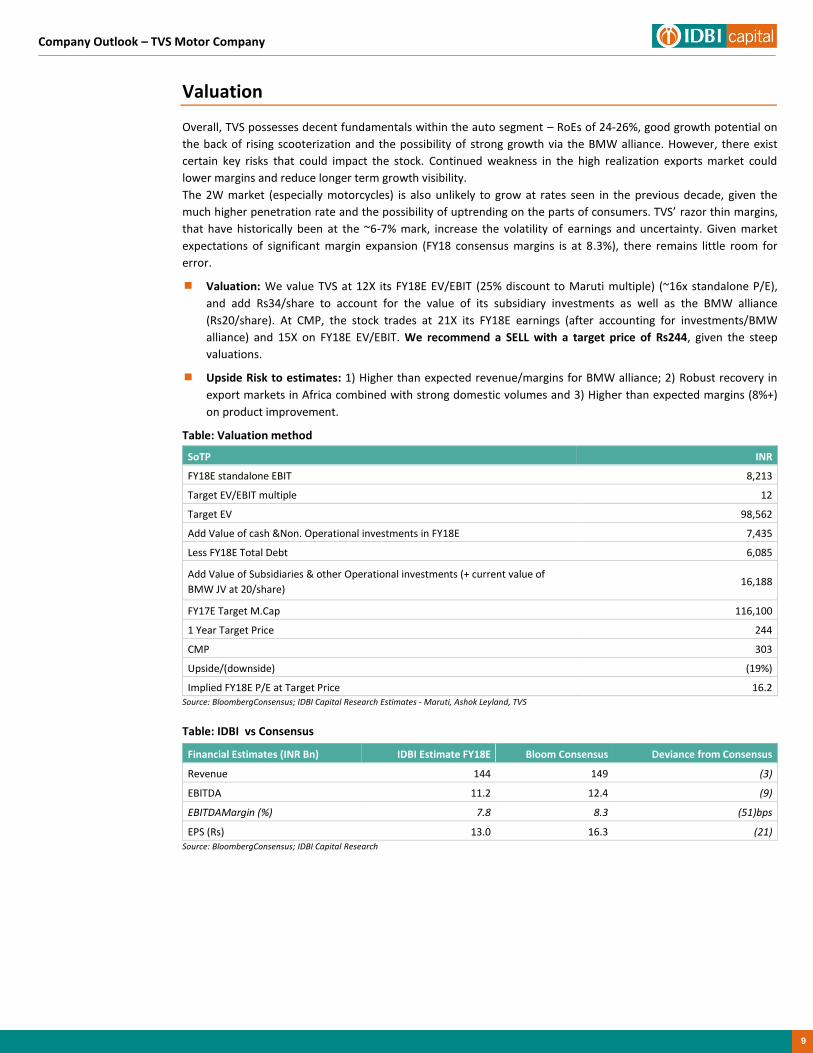
Valuation: We value TVS at 12X its FY18E EV/EBIT (25% discount to Maruti multiple) (~16x standalone P/E),
and add Rs34/share to account for the value of its subsidiary investments as well as the BMW alliance
(Rs20/share). At CMP, the stock trades at 21X its FY18E earnings (after accounting for investments/BMW
alliance) and 15X on FY18E EV/EBIT. We recommend a SELL with a target price of Rs244, given the steep
valuations.
Upside Risk to estimates: 1) Higher than expected revenue/margins for BMW alliance; 2) Robust recovery in
export markets in Africa combined with strong domestic volumes and 3) Higher than expected margins (8%+)
on product improvement.
Table: Valuation method
SoTP INR
FY18E standalone EBIT 8,213
Target EV/EBIT multiple 12
Target EV 98,562
Add Value of cash &Non. Operational investments in FY18E 7,435
Less FY18E Total Debt 6,085
Add Value of Subsidiaries & other Operational investments (+ current value of
BMW JV at 20/share) 16,188
FY17E Target M.Cap 116,100
1 Year Target Price 244
CMP 303
Upside/(downside) (19%)
Implied FY18E P/E at Target Price 16.2 Source: BloombergConsensus; IDBI Capital Research Estimates - Maruti, Ashok Leyland, TVS
Table: IDBI vs Consensus
Financial Estimates (INR Bn) IDBI Estimate FY18E Bloom Consensus Deviance from Consensus
Revenue 144 149 (3)
EBITDA 11.2 12.4 (9)
EBITDAMargin (%) 7.8 8.3 (51)bps
EPS (Rs) 13.0 16.3 (21) Source: BloombergConsensus; IDBI Capital Research
10
Company Outlook – TVS Motor Company
Relative Valuation
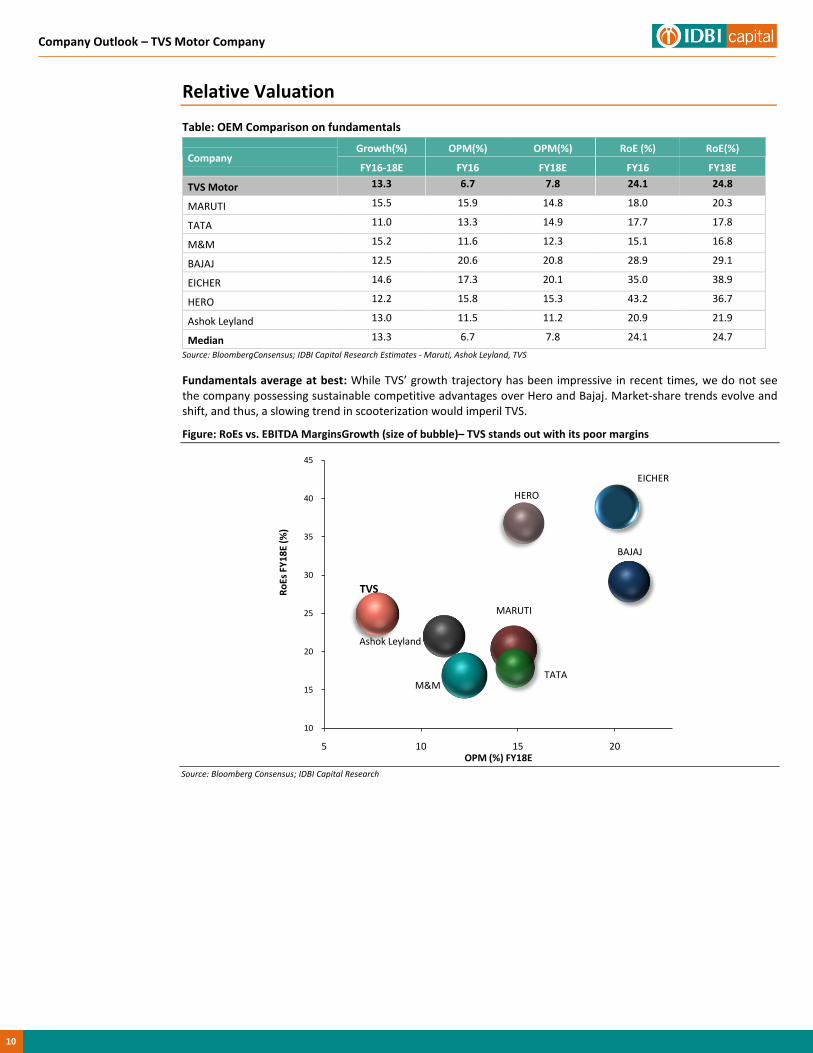
Table: OEM Comparison on fundamentals
Company Growth(%) OPM(%) OPM(%) RoE (%) RoE(%)
FY16-18E FY16 FY18E FY16 FY18E
TVS Motor 13.3 6.7 7.8 24.1 24.8
MARUTI 15.5 15.9 14.8 18.0 20.3
TATA 11.0 13.3 14.9 17.7 17.8
M&M 15.2 11.6 12.3 15.1 16.8
BAJAJ 12.5 20.6 20.8 28.9 29.1
EICHER 14.6 17.3 20.1 35.0 38.9
HERO 12.2 15.8 15.3 43.2 36.7
Ashok Leyland 13.0 11.5 11.2 20.9 21.9
Median 13.3 6.7 7.8 24.1 24.7
Source: BloombergConsensus; IDBI Capital Research Estimates - Maruti, Ashok Leyland, TVS
Fundamentals average at best: While TVS’ growth trajectory has been impressive in recent times, we do not see the company possessing sustainable competitive advantages over Hero and Bajaj. Market-share trends evolve and shift, and thus, a slowing trend in scooterization would imperil TVS.
Figure: RoEs vs. EBITDA MarginsGrowth (size of bubble)– TVS stands out with its poor margins
Source: Bloomberg Consensus; IDBI Capital Research
MARUTI
TATA
BAJAJ
EICHER
HERO
Ashok Leyland
TVS
M&M
10
15
20
25
30
35
40
45
5 10 15 20
Ro
Es F
Y1
8E
(%)
OPM (%) FY18E
Company Outlook – TVS Motor Company
11
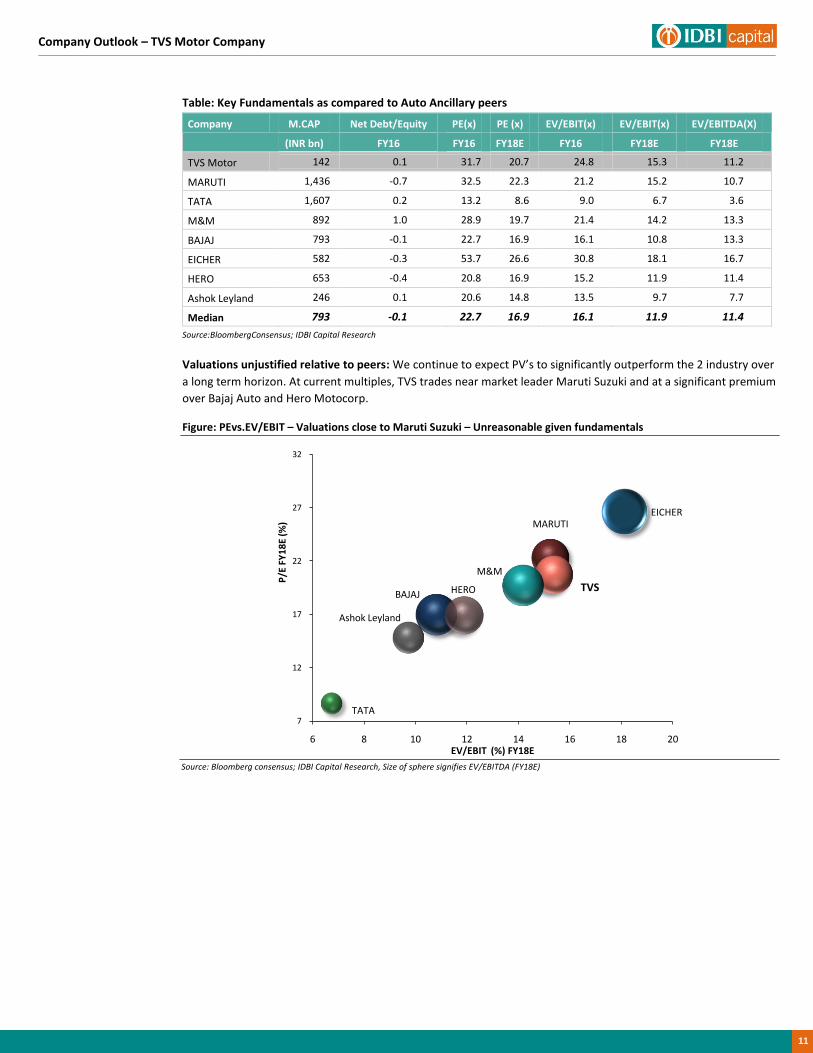
Table: Key Fundamentals as compared to Auto Ancillary peers
Company M.CAP Net Debt/Equity PE(x) PE (x) EV/EBIT(x) EV/EBIT(x) EV/EBITDA(X)
(INR bn) FY16 FY16 FY18E FY16 FY18E FY18E
TVS Motor 142 0.1 31.7 20.7 24.8 15.3 11.2
MARUTI 1,436 -0.7 32.5 22.3 21.2 15.2 10.7
TATA 1,607 0.2 13.2 8.6 9.0 6.7 3.6
M&M 892 1.0 28.9 19.7 21.4 14.2 13.3
BAJAJ 793 -0.1 22.7 16.9 16.1 10.8 13.3
EICHER 582 -0.3 53.7 26.6 30.8 18.1 16.7
HERO 653 -0.4 20.8 16.9 15.2 11.9 11.4
Ashok Leyland 246 0.1 20.6 14.8 13.5 9.7 7.7
Median 793 -0.1 22.7 16.9 16.1 11.9 11.4
Source:BloombergConsensus; IDBI Capital Research
Valuations unjustified relative to peers: We continue to expect PV’s to significantly outperform the 2 industry over
a long term horizon. At current multiples, TVS trades near market leader Maruti Suzuki and at a significant premium
over Bajaj Auto and Hero Motocorp.
Figure: PEvs.EV/EBIT – Valuations close to Maruti Suzuki – Unreasonable given fundamentals
Source: Bloomberg consensus; IDBI Capital Research, Size of sphere signifies EV/EBITDA (FY18E)
MARUTI
TATA
BAJAJ
EICHER
HERO
Ashok Leyland
TVS
M&M
7
12
17
22
27
32
6 8 10 12 14 16 18 20
P/E
FY
18
E (%
)
EV/EBIT (%) FY18E
12
Company Outlook – TVS Motor Company
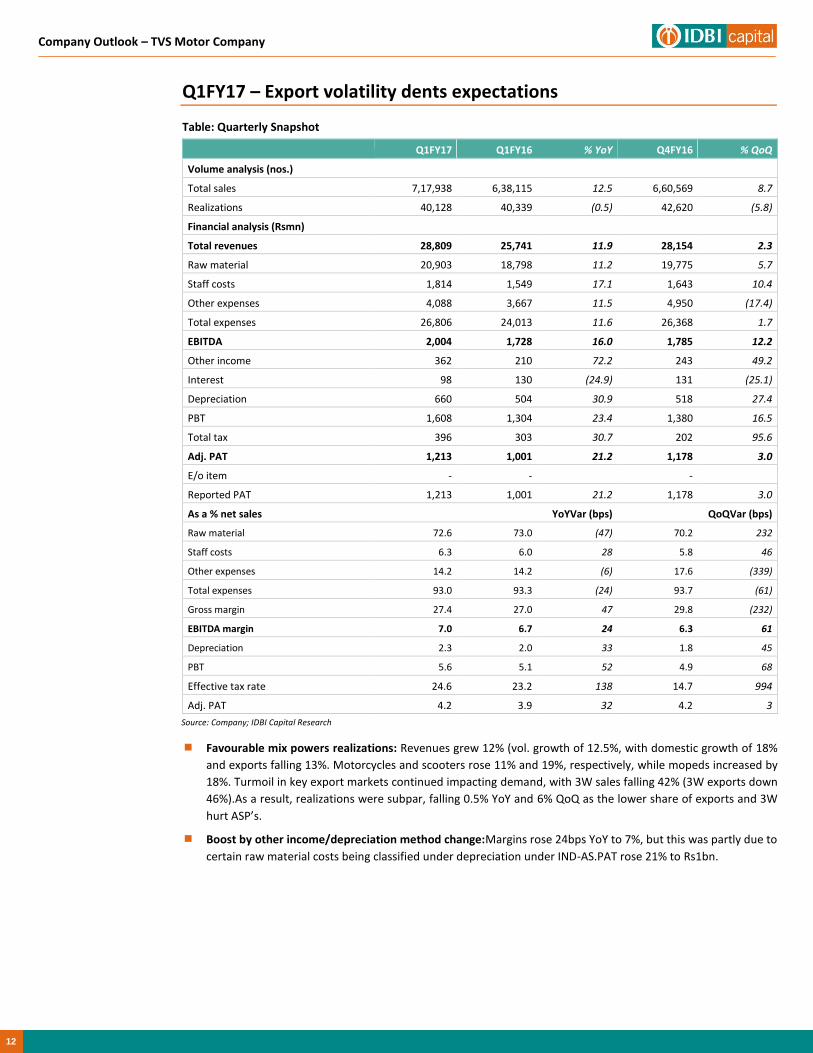
Q1FY17 – Export volatility dents expectations
Table: Quarterly Snapshot
Q1FY17 Q1FY16 % YoY Q4FY16 % QoQ
Volume analysis (nos.)
Total sales 7,17,938 6,38,115 12.5 6,60,569 8.7
Realizations 40,128 40,339 (0.5) 42,620 (5.8)
Financial analysis (Rsmn)
Total revenues 28,809 25,741 11.9 28,154 2.3
Raw material 20,903 18,798 11.2 19,775 5.7
Staff costs 1,814 1,549 17.1 1,643 10.4
Other expenses 4,088 3,667 11.5 4,950 (17.4)
Total expenses 26,806 24,013 11.6 26,368 1.7
EBITDA 2,004 1,728 16.0 1,785 12.2
Other income 362 210 72.2 243 49.2
Interest 98 130 (24.9) 131 (25.1)
Depreciation 660 504 30.9 518 27.4
PBT 1,608 1,304 23.4 1,380 16.5
Total tax 396 303 30.7 202 95.6
Adj. PAT 1,213 1,001 21.2 1,178 3.0
E/o item - -
-
Reported PAT 1,213 1,001 21.2 1,178 3.0
As a % net sales
YoYVar (bps)
QoQVar (bps)
Raw material 72.6 73.0 (47) 70.2 232
Staff costs 6.3 6.0 28 5.8 46
Other expenses 14.2 14.2 (6) 17.6 (339)
Total expenses 93.0 93.3 (24) 93.7 (61)
Gross margin 27.4 27.0 47 29.8 (232)
EBITDA margin 7.0 6.7 24 6.3 61
Depreciation 2.3 2.0 33 1.8 45
PBT 5.6 5.1 52 4.9 68
Effective tax rate 24.6 23.2 138 14.7 994
Adj. PAT 4.2 3.9 32 4.2 3
Source: Company; IDBI Capital Research
Favourable mix powers realizations: Revenues grew 12% (vol. growth of 12.5%, with domestic growth of 18%
and exports falling 13%. Motorcycles and scooters rose 11% and 19%, respectively, while mopeds increased by
18%. Turmoil in key export markets continued impacting demand, with 3W sales falling 42% (3W exports down
46%).As a result, realizations were subpar, falling 0.5% YoY and 6% QoQ as the lower share of exports and 3W
hurt ASP’s.
Boost by other income/depreciation method change:Margins rose 24bps YoY to 7%, but this was partly due to
certain raw material costs being classified under depreciation under IND-AS.PAT rose 21% to Rs1bn.
Company Outlook – TVS Motor Company
13
Financial summary
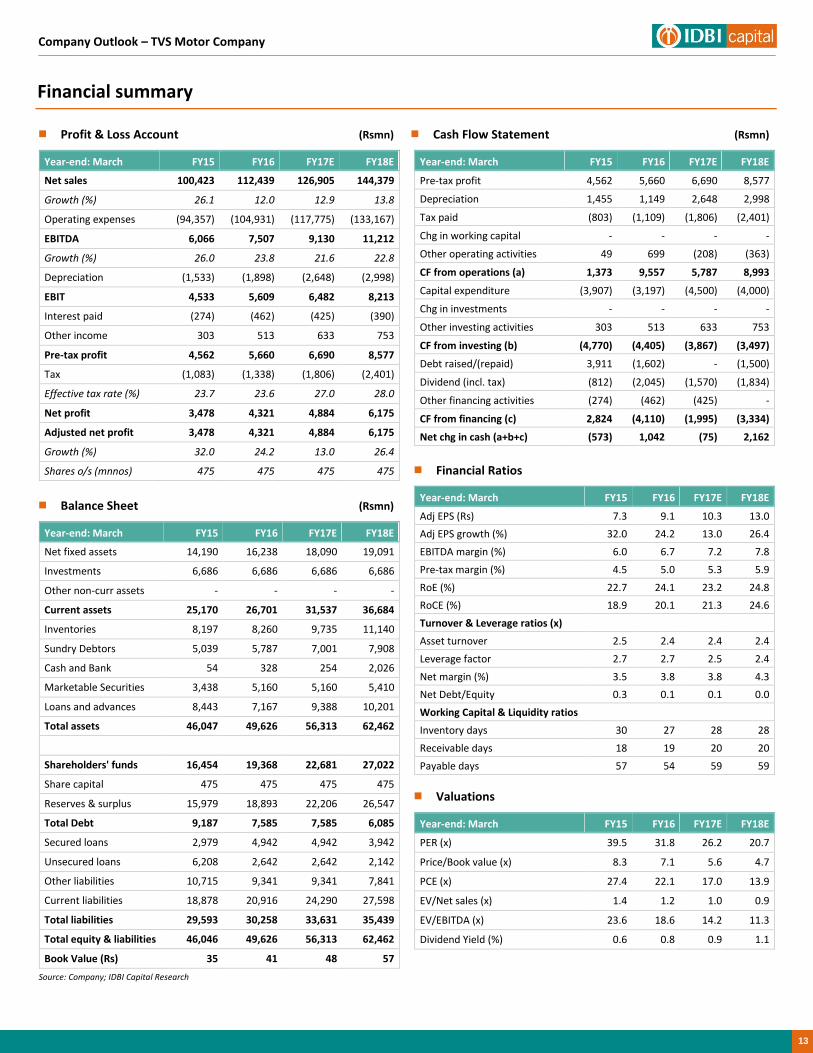
Profit & Loss Account (Rsmn)
Year-end: March FY15 FY16 FY17E FY18E
Net sales 100,423 112,439 126,905 144,379
Growth (%) 26.1 12.0 12.9 13.8
Operating expenses (94,357) (104,931) (117,775) (133,167)
EBITDA 6,066 7,507 9,130 11,212
Growth (%) 26.0 23.8 21.6 22.8
Depreciation (1,533) (1,898) (2,648) (2,998)
EBIT 4,533 5,609 6,482 8,213
Interest paid (274) (462) (425) (390)
Other income 303 513 633 753
Pre-tax profit 4,562 5,660 6,690 8,577
Tax (1,083) (1,338) (1,806) (2,401)
Effective tax rate (%) 23.7 23.6 27.0 28.0
Net profit 3,478 4,321 4,884 6,175
Adjusted net profit 3,478 4,321 4,884 6,175
Growth (%) 32.0 24.2 13.0 26.4
Shares o/s (mnnos) 475 475 475 475
Balance Sheet (Rsmn)
Year-end: March FY15 FY16 FY17E FY18E
Net fixed assets 14,190 16,238 18,090 19,091
Investments 6,686 6,686 6,686 6,686
Other non-curr assets - - - -
Current assets 25,170 26,701 31,537 36,684
Inventories 8,197 8,260 9,735 11,140
Sundry Debtors 5,039 5,787 7,001 7,908
Cash and Bank 54 328 254 2,026
Marketable Securities 3,438 5,160 5,160 5,410
Loans and advances 8,443 7,167 9,388 10,201
Total assets 46,047 49,626 56,313 62,462
Shareholders' funds 16,454 19,368 22,681 27,022
Share capital 475 475 475 475
Reserves & surplus 15,979 18,893 22,206 26,547
Total Debt 9,187 7,585 7,585 6,085
Secured loans 2,979 4,942 4,942 3,942
Unsecured loans 6,208 2,642 2,642 2,142
Other liabilities 10,715 9,341 9,341 7,841
Current liabilities 18,878 20,916 24,290 27,598
Total liabilities 29,593 30,258 33,631 35,439
Total equity & liabilities 46,046 49,626 56,313 62,462
Book Value (Rs) 35 41 48 57
Source: Company; IDBI Capital Research
Cash Flow Statement (Rsmn)
Year-end: March FY15 FY16 FY17E FY18E
Pre-tax profit 4,562 5,660 6,690 8,577
Depreciation 1,455 1,149 2,648 2,998
Tax paid (803) (1,109) (1,806) (2,401)
Chg in working capital - - - -
Other operating activities 49 699 (208) (363)
CF from operations (a) 1,373 9,557 5,787 8,993
Capital expenditure (3,907) (3,197) (4,500) (4,000)
Chg in investments - - - -
Other investing activities 303 513 633 753
CF from investing (b) (4,770) (4,405) (3,867) (3,497)
Debt raised/(repaid) 3,911 (1,602) - (1,500)
Dividend (incl. tax) (812) (2,045) (1,570) (1,834)
Other financing activities (274) (462) (425) -
CF from financing (c) 2,824 (4,110) (1,995) (3,334)
Net chg in cash (a+b+c) (573) 1,042 (75) 2,162
Financial Ratios
Year-end: March FY15 FY16 FY17E FY18E
Adj EPS (Rs) 7.3 9.1 10.3 13.0
Adj EPS growth (%) 32.0 24.2 13.0 26.4
EBITDA margin (%) 6.0 6.7 7.2 7.8
Pre-tax margin (%) 4.5 5.0 5.3 5.9
RoE (%) 22.7 24.1 23.2 24.8
RoCE (%) 18.9 20.1 21.3 24.6
Turnover & Leverage ratios (x)
Asset turnover 2.5 2.4 2.4 2.4
Leverage factor 2.7 2.7 2.5 2.4
Net margin (%) 3.5 3.8 3.8 4.3
Net Debt/Equity 0.3 0.1 0.1 0.0
Working Capital & Liquidity ratios
Inventory days 30 27 28 28
Receivable days 18 19 20 20
Payable days 57 54 59 59
Valuations
Year-end: March FY15 FY16 FY17E FY18E
PER (x) 39.5 31.8 26.2 20.7
Price/Book value (x) 8.3 7.1 5.6 4.7
PCE (x) 27.4 22.1 17.0 13.9
EV/Net sales (x) 1.4 1.2 1.0 0.9
EV/EBITDA (x) 23.6 18.6 14.2 11.3
Dividend Yield (%) 0.6 0.8 0.9 1.1
14
Company Outlook – TVS Motor Company
Notes
Dealing (91-22) 6637 1150 [email protected]
Key to Ratings
Stocks:
BUY: Absolute return of 15% and above; ACCUMULATE: 5% to 15%; HOLD: Upto ±5%; REDUCE: -5% to -15%; SELL: -15% and below.
IDBI Capital Markets&Securities Ltd. (Formerly known as “IDBI Capital Market Services Ltd.”) Equity Research Desk
3rd Floor, Mafatlal Centre, Nariman Point, Mumbai – 400 021. Phones: (91-22) 4322 1212; Fax: (91-22) 2285 0785; Email: [email protected]
SEBI Registration: BSE & NSE (Cash & FO) – INZ000007237, NSDL – IN-DP-NSDL-12-96, Research – INH000002459, CIN – U65990MH1993GOI075578
Compliance Officer: Christina D’souza; Email: [email protected]; Telephone: (91-22) 4322 1212 Disclaimer This document has been prepared by IDBI Capital Markets & Securities Ltd. (IDBI Capital) and is meant for the recipient only for use as intended and not for circulation. This document should not
be reproduced or copied or made available to others. No person associated with IDBI Capital is obligated to call or initiate contact with you for the purposes of elaborating or following up on the
information contained in this document.
Recipients may not receive this report at the same time as other recipients. IDBI Capital will not treat recipients as customers by virtue of their receiving this report.
The information contained herein is from the public domain or sources believed to be reliable. While reasonable care has been taken to ensure that information given is at the time believed to be
fair and correct and opinions based thereupon are reasonable, due to the very nature of research it cannot be warranted or represented that it is accurate or complete a nd it should not be relied
upon as such. In so far as this report includes current or historical information, it is believed to be reliable, although its accuracy and completeness cannot be guaranteed.
Opinions expressed are current opinions as of the date appearing on this material only. While we endeavor to update on a reasonable basis, the information discussed in this material, IDBI Capital,
its directors, employees are under no obligation to update or keep the information current. Further there may be regulatory, compliance, or other reasons that prevent us from doing so.
Prospective investors and others are cautioned that any forward-looking statements are not predictions and may be subject to change without notice.
IDBI Capital, its directors and employees and any person connected with it, will not in any way be responsible for the contents of this report or for any losses, costs, expenses, charges, including
notional losses/lost opportunities incurred by a recipient as a result of acting or non acting on any information/material contained in the report.
This is not an offer to sell or a solicitation to buy any securities or an attempt to influence the opinion or behaviour of investors or recipients or provide any investment/tax advice.
This report is for information only and has not been prepared based on specific investment objectives. The securities discussed in this report may not be suitable for all investors. Investors must
make their own investment decision based on their own investment objectives, goals and financial position and based on their own analysis.
Trading in stocks, stock derivatives, and other securities is inherently risky and the recipient agrees to assume complete and full responsibility for the outcomes of all trading decisions that the
recipient makes, including but not limited to loss of capital.
Opinions, projections and estimates in this report solely constitute the current judgment of the author of this report as of the date of this report and do not in any way reflect the views of IDBI
Capital, its directors, officers, or employees.
This report is not directed or intended for distribution to, or use by, any person or entity who is a citizen or resident of or located in any locality, state, country or other jurisdiction, where such
distribution, publication, availability or use would be contrary to law, regulation or which would subject IDBI Capital and affiliates to any registration or licensing requirement within such
jurisdiction. The securities described herein may or may not be eligible for sale in all jurisdictions or to certain category of investors. Persons in whose possession this document may come are
required to inform themselves of and to observe such restriction.
IDBI Capital, its directors or employees or affiliates, may from time to time, have positions in, or options on, and buy and sell securities referred to herein. IDBI Capital or its affiliates, during the
normal course of business, from time to time, may solicit from or perform investment banking or other services for any company mentioned in this document or their connected persons or be
engaged in any other transaction involving such securities and earn brokerage or other compensation or act as a market maker in the financial instruments of the company(ies) discussed herein or
their affiliate companies or act as advisor or lender / borrower to such company(ies)/affiliate companies or have other potential conflict of interest.
This report may provide hyperlinks to other websites. Except to the extent to which the report refers to the website of IDBI Capital, IDBI Capital states that it has not reviewed the linked site and
takes no responsibility for the content contained in such other websites. Accessing such websites shall be at recipient's own risk.
E-mail is not a secure method of communication. IDBI Capital Markets & Securities Ltd. cannot accept responsibility for the accuracy or completeness of any e-mail message or any attachment(s).
This transmission could contain viruses, be corrupted, destroyed, incomplete, intercepted, lost or arrive late. IDBI Capital, its directors or employees or affiliates accept no liability for any damage
caused, directly or indirectly, by this email.
Company Outlook – TVS Motor Company
15
Disclosures
I, Pranoy Kurian, certify that (1) the views expressed in this report accurately reflect my personal views about all of the subject companies and securities and (2) no part of my compensation was, is
or will be directly or indirectly related to the specific recommendations or views expressed in this report.
IDBI Capital Markets & Securities Ltd. (“IDBI Capital”) and its associates (IDBI Capital is a wholly owned subsidiary of IDBI Bank Ltd. IDBI Asset Management Ltd., IDBI MF Trustee Company Ltd. and
IDBI Intech Ltd.) are a full-service, banking, integrated investment banking, investment management, brokerage and financing group. We along with our affiliates are leading underwriter of
securities and participants in virtually all securities trading markets in India. We and our affiliates have investment banking and other business relationships with a significant percentage of the
companies covered by our Research Department. Investors should assume that IDBI Capital and/or its affiliates are seeking or will seek investment banking or other business from the company or
companies that are the subject of this material. IDBI Capital generally prohibits its analysts, persons reporting to analysts, and their dependant family members having a financial conflict of
interest in the securities or derivatives of any companies that the analysts cover. Additionally, IDBI Capital Markets & Securities Ltd. generally prohibits its analysts and persons reporting to
analysts from serving as an officer, director, or advisory board member of any companies that the analysts cover. Our salespeople, t raders, and other professionals may provide oral or written
market commentary or trading strategies to our clients that reflect opinions that are contrary to the opinions expressed herein, and our proprietary trading and investing businesses may make
investment decisions that are inconsistent with the recommendations expressed herein. In reviewing these materials, you should be aware that any or all of the foregoing, among other things,
may give rise to real or potential conflicts of interest. Additionally, other important information regarding our relationships with the company or companies that are the subject of this material is
provided herein.
This material should not be construed as an offer to sell or the solicitation of an offer to buy any security in any jurisdiction where such an offer or solicitation would be illegal. We are not soliciting
any action based on this material. It is for the general information of clients of IDBI Capital. It does not constitute a personal recommendation or take into account the particular investment
objectives, financial situations, or needs of individual clients. Before acting on any advice or recommendation in this material, clients should consider whether it is suitable for their particular
circumstances and, if necessary, seek professional advice. The price and value of the investments referred to in this materia l and the income from them may go down as well as up, and investors
may realize losses on any investments. Past performance is not a guide for future performance, future returns are not guaranteed and a loss of original capital may occur.
We and our affiliates, officers, directors, and employees, including persons involved in the preparation or issuance of this material, may from time to time have “long” or “short” positions in, act as
principal in, and buy or sell the securities or derivatives thereof of companies mentioned herein. For the purpose of calculating whether IDBI Capital Markets & Securities Ltd. and its affiliates
holds beneficially owns or controls, including the right to vote for directors, 1% of more of the equity shares of the subjec t issuer of a research report, the holdings does not include accounts
managed by IDBI Asset Management Company/ IDBI Mutual Fund.
IDBI Capital Markets & Securities Ltd. established in 1993, is a wholly owned subsidiary of IDBI Bank Limited. IDBI Capital Markets & Securities Ltd. is one of India’s leading brokerage and
distribution house.
IDBI Capital Markets & Securities Ltd. is a corporate trading and clearing member of Bombay Stock Exchange Limited (BSE), National Stock Exchange of India Limited (NSE), and a dealer of the OTC
Exchange of India (OTCEI) and is also a SEBI registered Merchant Banker and Portfolio Manager. Our businesses include stock broking, services rendered in connection with distribution of primary
market issues and financial products like merchant banking, depository services and Portfolio Management.
IDBI Capital Markets & Securities Ltd. is also a depository participant with National Securities Depository Limited (NSDL) and is also a Mutual Fund Advisor registered with Association of Mutual
Funds in India (AMFI)
We hereby declare that our activities were neither suspended nor we have materially defaulted with any stock exchange authority with whom we are registered in last five years. However SEBI,
Exchanges and Depositories have conducted the routine inspection and based on their observations have issued advise letters or levied minor penalty on IDBI Capital for certain operational
deviations. We have not been debarred from doing business by any Stock Exchange / SEBI or any other authorities; nor has our certificate of registration been cancelled by SEBI at any point of
time.
We offer our research services to primarily institutional investors and their employees, directors , fund managers, advisors who are registered with us.
The Research Analyst has not served as an officer, director or employee of Subject Company.
We or our associates may have received compensation from the subject company in the past 12 months. We or our associates may have managed or co-managed public offering of securities for
the subject company in the past 12 months. We or our associates may have received compensation for investment banking or merchant banking or brokerage services from the subject company
in the past 12 months. We or our associates may have received any compensation for products or services other than investment banking or merchant banking or brokerage services from the
subject company in the past 12 months. We or our associates may have received any compensation or other benefits from the Subject Company or third party in connection with the research
report.
Research Analyst or his/her relative’s may have financial interest in the subject company. IDBI Capital Markets & Securities Ltd. or its associates may have financial interest in the subject company.
Research Analyst or his/her relatives does not have actual/beneficial ownership of 1% or more securities of the subject company at the end of the month immediately preceding the date of
publication of Research Report.IDBI Capital Markets & Securities Ltd. or its associates may have actual/beneficial ownership of 1% or more securities of the subject company at the end of the
month immediately preceding the date of publication of Research Report. The Subject Company may have been a client during twelve months preceding the date of distribution of the research
report.
Price history of the daily closing price of the securities covered in this note is available at nseindia.com and economictimes.indiatimes.com/markets/stocks/stock-quotes.