TVN Webinar Series - Geriatric Research · TVN Webinar Series . Future TVN webinars ... NHANES NPHS...
57
TVN Webinar Series
Transcript of TVN Webinar Series - Geriatric Research · TVN Webinar Series . Future TVN webinars ... NHANES NPHS...

TVN Webinar Series

Future TVN webinars
Webinars occur on the first Wednesday of every month at 12 noon ET
December 3 at 12 noon ET: Moving evidence into practice and policy – Dr. Jayna Holroyd-Leduc
Topics and speakers to be announced soon for the following webinar dates:
January 7 March 4 February 4 April 1 May 6
Follow us on Twitter for registration details: @TVN_NCE View completed webinar slides at: www.tvn-nce.ca/news-and-events/webinars/

Housekeeping
To minimize noise during the Webinar, all microphones will be muted.
Questions/Answers:
Submit your questions online during the webinar.
We’ll answer as many as possible after the presentation.

Melissa K. Andrew, MD, PhD, MSc (PH), FRCPC
Frailty in the elderly
TVN November 2014 Webinar

Frailty in the elderly
Melissa K. Andrew, MD, PhD, MSc (PH), FRCPC Associate Professor, Medicine, Dalhousie University, and Consultant in Geriatric Medicine, QEII Health Sciences Centre •Masters of Public Health at London School of Hygiene & Tropical Medicine on a Commonwealth Scholarship •PhD in Interdisciplinary Studies at Dalhousie University on frailty and social vulnerability among older adults •Principal Investigator of team studying frailty and multi-morbidity in relation to dementia as part of the Canadian Consortium on Neurodegeneration in Aging •Co-Principal Investigator of the Public Health Agency of Canada/CIHR Serious Outcomes Surveillance (SOS) Network, where she studies how frailty impacts vaccine effectiveness, burden of disease and clinical outcomes of infectious diseases in older adults. •Also engaged in research collaborations studying models of care for frail older adults in Long Term Care

1
Frailty in older adults
Melissa Andrew, MD, PhD, MSc(PH), FRCPC Geriatric Medicine
Dalhousie University [email protected]

2
Overview
• What is frailty? • What does it mean to be frail (vs. old)? • Why is frailty important? • How are social circumstances relevant? • Implications: clinical care, health systems,
research

3
http://www.parl.gc.ca/
Canada’s population is ageing

4
Geriatric Medicine and Frailty
• The role of geriatric medicine services is to care for older people who are frail.
• “The complexity of frailty animates and motivates geriatric medicine. It is our burden and our glory.” K Rockwood, 2007
• What is frailty, and who is frail? • What does it mean to be old?

5
The building blocks of life do not age
http://www.cerritos.edu/earth-science/images/radioa1.gif

6
Age vs. ageing
• Ageing = accelerated risk of failure over time (implies deterioration with time)
• Age = passing of chronological time • A system which has a constant rate of
failure with time does age (marks the passage of time) but is not ageing

7
How a system’s components are arranged may affect the rate of failure
A string of Christmas tree lights
Electricity supplied to many rooms in a house simultaneously
Organs
Tissues
8
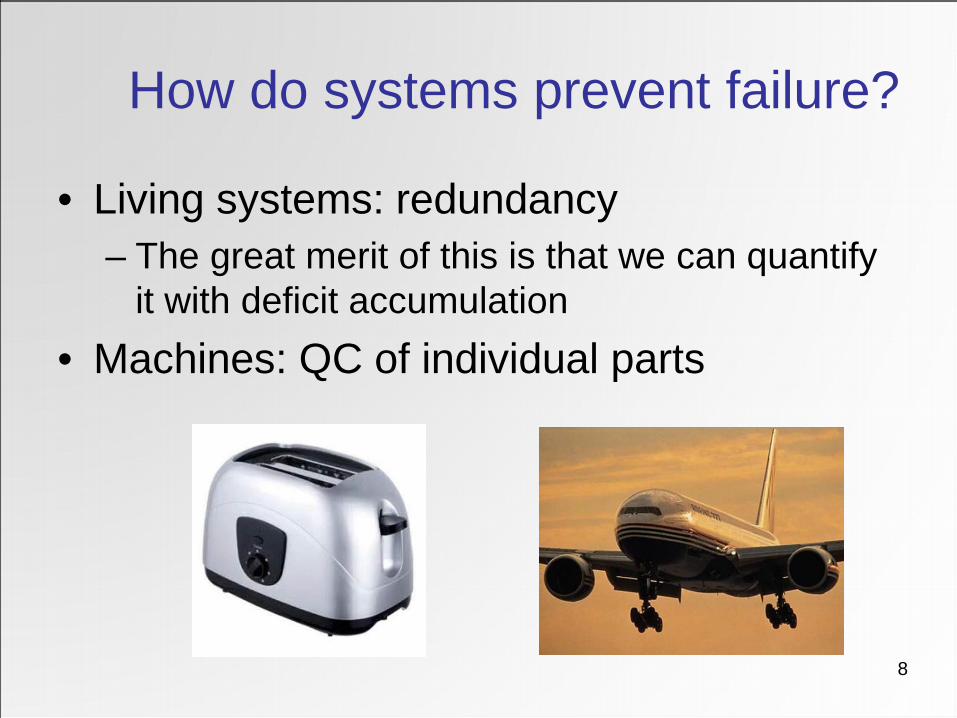
How do systems prevent failure?
• Living systems: redundancy – The great merit of this is that we can quantify
it with deficit accumulation • Machines: QC of individual parts

9
Illness presentation in older adults
• How do we know when a patient is sick? – e.g.: Pneumonia
• Do older and younger patients present the
same way?
• What about frail vs. fit patients?

• Upright bipedal
ambulation • Cognition and divided
attention • Opposable thumbs
(function) • Social graces
• Falls, “taking to bed” • Delirium • Functional decline
• Incontinence
10
Atypical illness presentation: The concept of reserve
Humans have 4 key higher order functions:

12
What is frailty?

13
How do we define frailty? • Numerous possibilities:
– Use in lay literature – Descriptive definitions e.g. Frailty Scale – Rules-based definitions e.g. Frailty Phenotype – Deficit accumulation: e.g. Frailty index – Based on atypical presentation (too late once the
“stress test” has been proven?) – The multidimensional view: “balance beam” – Functional definitions – “Frailty defining conditions”

14
Frailty: it comes down to
Vulnerability
Insults Reserve

15
A multidimensional view of frailty: The Balance Principle (reserve!)
Rockwood et al. Can Med Association 1994; 150:499-507Rockwood et al. J Am Geriatric Society 1996; 44:578-82
Health
Attitudes toward Health and
health practices
Resources
Caregiver
Illness
Disability
Dependence on Others
Burden on the
caregiver

16
Is frailty a purely physical phenomenon?

17
A more narrow view of frailty is gaining momentum
A phenotypic definition of physical frailty: Fried et al., 2001; 5 items weakness weight loss slowness inactivity exhaustion
What’s not in the definition: cognitive disorders, psychiatric illness, social factors,
dependence due to single disease states

18
Table 1. List of deficits used in the frailty index. Deficits Levels 1 Eyesight 5 2 Hearing 5 3 Help to eat 3 4 Help to dress 3 5 Ability to take care of appearance 3 6 Help to walk 3 7 Help to get in and out of bed 3 8 Help to go to the bathroom 3 9 Help to take a bath or shower 3 10 Help to use the telephone 3 11 Help to travel beyond walking distance 3 12 Help with shopping 3 13 Help to prepare own meals 3 14 Help to do housework 3 15 Ability to take medications 3 16 Ability to handle own money 3 17 Self-rated health 5 18 Troubles prevent normal activities 3 19 Lives alone 2 20 Having a cough 2 21 Feeling tired 2 22 Nose stuffed up or sneezing 2 23 High blood pressure 2 24 Heart and circulation problems 2 25 Stroke or effects of stroke 2 26 Arthritis or rheumatism 2 27 Parkinson’s disease 2 28 Eye trouble 2 29 Ear trouble 2 30 Dental problems 2 31 Chest problems 2 32 Trouble with stomach 2 33 Kidney trouble 2 34 Losing control of bladder 2 35 Losing control of bowels 2 36 Diabetes 2 37 Trouble with feet or ankles 2 38 Skin problems 2 39 Fractures 2
Frailty index distribution
02
46
810
Per
cent
0 .2 .4 .6 .8Frailty Index
• Range = 0 to 0.66, mean 0.16
Measuring frailty as an “index of deficits”

The frailty index
Number of deficits in an individual Frailty Index = ___________________________ Total number of deficits measured e.g. in a dataset with 50 health deficits measured, a
person with 10 things wrong (10 deficits) has a frailty index of 10/50 = 0.20.
19
20
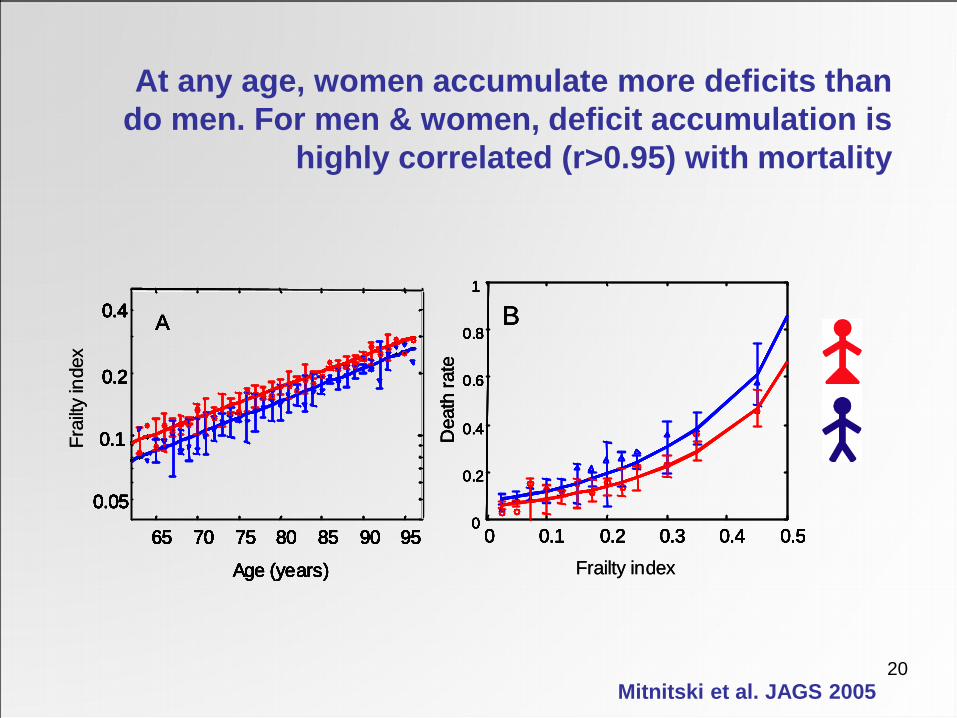
At any age, women accumulate more deficits than do men. For men & women, deficit accumulation is
highly correlated (r>0.95) with mortality
0 0.1 0.2 0.3 0.4 0.50
0.2
0.4
0.6
0.8
1
0 0.1 0.2 0.3 0.4 0.50
0.2
0.4
0.6
0.8
1
B
65 70 75 80 85 90 95
0.1
0.2
0.4
0.05
Age (years)
65 70 75 80 85 90 95
0.1
0.2
0.4
0.05
A
65 70 75 80 85 90 95
0.1
0.2
0.4
0.05
Age (years)
65 70 75 80 85 90 95
0.1
0.2
0.4
0.05
A
Dea
th ra
te
0 0.1 0.2 0.3 0.4 0.50
0.2
0.4
0.6
0.8
1
0 0.1 0.2 0.3 0.4 0.50
0.2
0.4
0.6
0.8
1
Frailty index
B
65 70 75 80 85 90 95
0.1
0.2
0.4
0.05
Age (years)
Frai
lty in
dex
65 70 75 80 85 90 95
0.1
0.2
0.4
0.05
A
65 70 75 80 85 90 95
0.1
0.2
0.4
0.05
Age (years)
65 70 75 80 85 90 95
0.1
0.2
0.4
0.05
A
Dea
th ra
te
0 0.1 0.2 0.3 0.4 0.50
0.2
0.4
0.6
0.8
1
0 0.1 0.2 0.3 0.4 0.50
0.2
0.4
0.6
0.8
1
B
65 70 75 80 85 90 95
0.1
0.2
0.4
0.05
Age (years)
65 70 75 80 85 90 95
0.1
0.2
0.4
0.05
A
65 70 75 80 85 90 95
0.1
0.2
0.4
0.05
Age (years)
65 70 75 80 85 90 95
0.1
0.2
0.4
0.05
A
Dea
th ra
te
0 0.1 0.2 0.3 0.4 0.50
0.2
0.4
0.6
0.8
1
0 0.1 0.2 0.3 0.4 0.50
0.2
0.4
0.6
0.8
1
Frailty index
B
65 70 75 80 85 90 95
0.1
0.2
0.4
0.05
Age (years)
Frai
lty in
dex
65 70 75 80 85 90 95
0.1
0.2
0.4
0.05
A
65 70 75 80 85 90 95
0.1
0.2
0.4
0.05
Age (years)
65 70 75 80 85 90 95
0.1
0.2
0.4
0.05
A
Dea
th ra
te
Mitnitski et al. JAGS 2005

Mitnitski, Song, Skoog, Broe, Cox, Grunfeld, Rockwood. J Am Geriatr Soc, 2005;53:2184-9
Mea
n ac
cum
ulat
ion
of d
efic
its
Legend
65 70 75 80 85 90 95
ALSA CSHA-screen CSHA-exam NHANES NPHS SOPS Breast cancer CSHA-inst Myoc Infarct US-LTHS H70-75
0.1
0.2
0.3
0.5
1.0
0.05
Age (years)
Clinical and institutional samples, n=2,573
The slope is ~0.03 Community samples n=33,559
Log scale
Deficits accumulate differently between groups (community vs. institution/ clinical samples) but similarly
within groups

0 10 20 30 40 50 60 70 0
0.2
0.4
0.6
0.8
1
A frailty index based on a Comprehensive Geriatric Assessment (FI-CGA) better
stratifies 70-month survival than does age
Age FI-CGA
70
80
90
100
0.1
0.2
0.3
0.4 0.5
Survival time (months)
Surv
ival
pro
babi
lity
0 10 20 30 40 50 60 70 0
0.2
0.4
0.6
0.8
1
Rockwood, Rockwood, Mitnitski., J Am Geriatrics Soc, 2010;58:318-323.

Frailty predicts outcomes very strongly! Here, a Frailty Index based on Comprehensive Geriatric Assessment identifies a group at the highest risk of dying
(some of whom live 18 months).
0 10 20 30 40 50 60 70 0
0.2
0.4
0.6
0.8
1
FI-CGA
0.1
0.2
0.3
0.4 0.5
Survival time (months)
Surv
ival
pro
babi
lity
Rockwood, Rockwood, Mitnitski, J Am Geriatric Soc 2010;58:318-323

24
The high correlation with mortality allows us to estimate Personal Biological Age, from which
relative fitness and frailty can be defined
Mitnitski et al. BMC Geriatrics 2002;27;2(1)
Mean proportion of deficits as a function of age
Chronological age, t (years)
Pro
porti
on o
f def
icits
0
0.1
0.2
0.3
0.4
0.5
60 65 70 75 80 85 90 95 100 105
A
B PBA(A) PBA(B)

25
What causes frailty?
Many theories: • Poor nutrition • Reduced exercise tolerance • Ageing? Biological vs. chronological age • Inflammation • Immune senescence

26
Inflammaging Inflammaging is an inflammatory state which is: • Low grade • Controlled • Asymptomatic • Chronic • Systemic
McElhaney JE Vaccine. 2012; 30(12): 2060–2067.

27
Immune theories • Immune system function declines with age • Host defenses:
– Decreased mucociliary clearance – Decline in delayed-type hypersensitivity
• Cell-mediated immunity: – Decreased IL2 expression and receptor function – Loss of functional T cells
• Humoral immunity: – Decreased antibody avidity – Decline in antibody titers
28
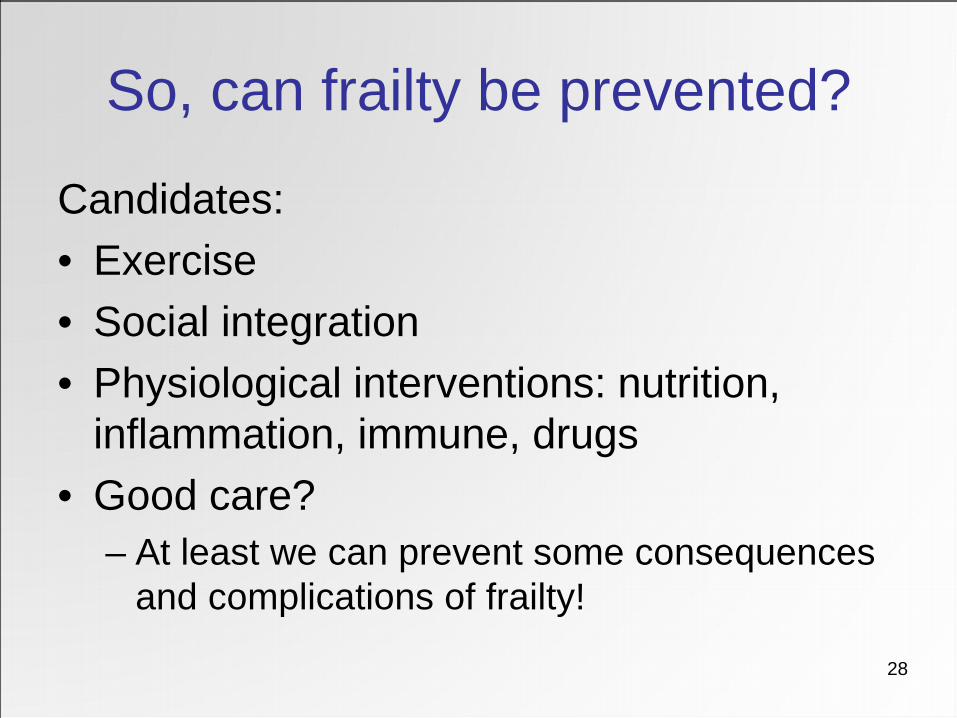
So, can frailty be prevented?
Candidates: • Exercise • Social integration • Physiological interventions: nutrition,
inflammation, immune, drugs • Good care?
– At least we can prevent some consequences and complications of frailty!

29
What does all of this mean for clinical care?
• Holistic approach • Focus on function, mobility and cognition • Be alert to iatrogenic risks • Prenvention? E.g. pre-op assessment,
sick stratification, defining goals of care • Should hospital care be provided
differently?

30

Frail older adults can tell us a lot about the quality of our health care systems
31

32
Frailty and complexity
• Frailty means having many things wrong at once
• How best to treat people who are frail? – One-thing-wrong-at-once approach? – Integrated services focusing on the big
picture, function, comfort, and self-actualization

33
One thing at a time – it is built in to our health care system and facilities
Emergency
Cardiology
Nephrology and dialysis
Geriatrics
Mental Health
Obs/Gyne
Physical Medicine/Rehab
Stroke, Neurology
General surgery
Infectious Diseases
Neurosurgery CV surgery
General Medicine
Cancer care

34
How can frailty be measured in clinical settings?
• Assessment tools – Consider your goals:
• To identify? • To plan interventions?
– Comprehensive Geriatric Assessment – Frailty Scale – State variables which capture complexity and
can be tracked

35
Cognition Mood
Communication Mobility and balance
Bowel and bladder
Weight & nutr Function
Social circumstances and supports
Medical conditions
Medications
Comprehensive Assessment: The Top Ten!

36
Time (month)0 2 4 6 8 10 12
0.55
0.6
0.65
0.7
0.75
0.8
0.85
0.9
0.95
1
Com
bine
d pr
obab
ility
mild
moderate
severe
Time (month)0 2 4 6 8 10 12
0.55
0.6
0.65
0.7
0.75
0.8
0.85
0.9
0.95
1
Com
bine
d pr
obab
ility
mild
moderate
severe
Jones et al, J Am Geriatr Soc, 2004;52:1929-33.
Frailty as measured by the CGA is predictive of outcomes

Rockwood et al CMAJ. 2005; 173(5): 489–495.
Clinical Frailty Scale: A descriptive definition of frailty

Rockwood et al CMAJ. 2005; 173(5): 489–495.

39
• The CSHA clinical frailty scale predicts survival and institutionalization
Rockwood et al CMAJ. 2005; 173(5): 489–495.

40
Hierarchical Assessment of
Balance and Mobility: embracing complexity
through pattern recognition in a state
variable
Rockwood et al., J Am Geriatr Soc, 2008;56:1213-1217,

41
Health
Intrinsic factors: frailty, comorbidity, genetics
Extrinsic factors: social and physical environment

42
How important is the social history?
Risk factor Management, DC planning

43
Social factors and health • Numerous social factors individually associated
with health – Socioeconomic status – Social inequalities
• income, social status, control over life situation – Social support – Social networks – Social engagement – Social capital (individual vs. group) – Social cohesion
• Can these be conceptually unified?

44
Individual
Family & friends
Peer groups
Institutions
Neighbourhoods & community
Society at large
Ecological model of social vulnerability
Andrew and Keefe. BMC Geriatrics 2014

45
Social factors and older adults’ health: the evidence
Survival: rich social networks, social supports, group engagement, occupational status (gradient), social capital, trust
Self-assessed health: social capital, trust, social supports, volunteerism, group participation, SES (individual and neighbourhood)
Cognitive decline and dementia: social supports, social connectedness, loneliness, social engagement, social vulnerability, SES (individual and neighbourhood-level)
Mental health: neighbourhood social capital, social ties, social networks, social supports, SES
Functional decline/dependence: low social engagement, social networks, social engagement, social support, trust
Mobility and falls: SES, living alone, social engagement, neighbourhood deprivation/SES
Institutionalization: lack of social supports, social capital
Frailty: social vulnerability, SES, isolation, social supports
Andrew MK (2010) Social vulnerability in old age. Brocklehurst’s Textbook of Geriatrics and Clinical Gerontology

46
Social factors and older adults’ health: Mechanisms?
Biological & physiological:
• chronic stress • hormones
• immune function
Behavioural: health behaviours - opportunities and norms
Material: access to goods & services • financial resources (what you have) • social status (who you are) • social contacts (who you know)
Psychological: • self-efficacy
• coping strategies • confidence
Andrew MK (2010) Social vulnerability in old age. Brocklehurst’s Textbook of Geriatrics and Clinical Gerontology

47
Social vulnerability index Leisure activities 19 How often visit friend or relatives 20 How often work in garden 21 How often golf of play other sports 22 How often go for a walk 23 How often go to clubs, church, community centre 24 How often play cards or other games Ryff scales 25 Feel empowered, in control of life situation 26 Maintaining close relationships is difficult and
frustrating 27 Experience of warm and trusting relationships 28 People would describe me as a giving person How do you feel about your life in terms of … 29 Family relationships 30 Friendships 31 Housing 32 Finances 33 Neighbourhood 34 Activities 35 Religion 36 Transportation 37 Life generally Socio-economic status 38 Does income currently satisfy needs 39 Home ownership 40 Education
Communication to engage in wider community 1 Read English or French 2 Write English or French Living situation 3 Marital status 4 Lives alone Social support 5 Someone to count on for help or support 6 Feel need more help or support 7 Someone to count on for transportation 8 Feel need more help with transportation 9 Someone to count on for help around the house 10 Feel need more help around the house 11 Someone to count on to listen 12 Feel need more people to talk with 13 Number of people spend time with regularly 14 Feel need to spend more time with friends/family 15 Someone to turn to for advice 16 Feel need more advice about important matters Socially oriented Activities of Daily Living 17 Telephone use 18 Get to places out of walking distance
Andrew et al. PLoS One 2008

48
Similarities between frailty and social vulnerability?
010
020
030
040
0fre
quen
cy
0 .2 .4 .6 .8social vulnerability index
Social vulnerability index Frailty index 0
200
400
600
800
Freq
uenc
y
0 .2 .4 .6 .8Frailty Index
• Social vulnerability is correlated with the frailty index (r=0.44) • This correlation differs for men and women (0.31 vs. 0.46)
49
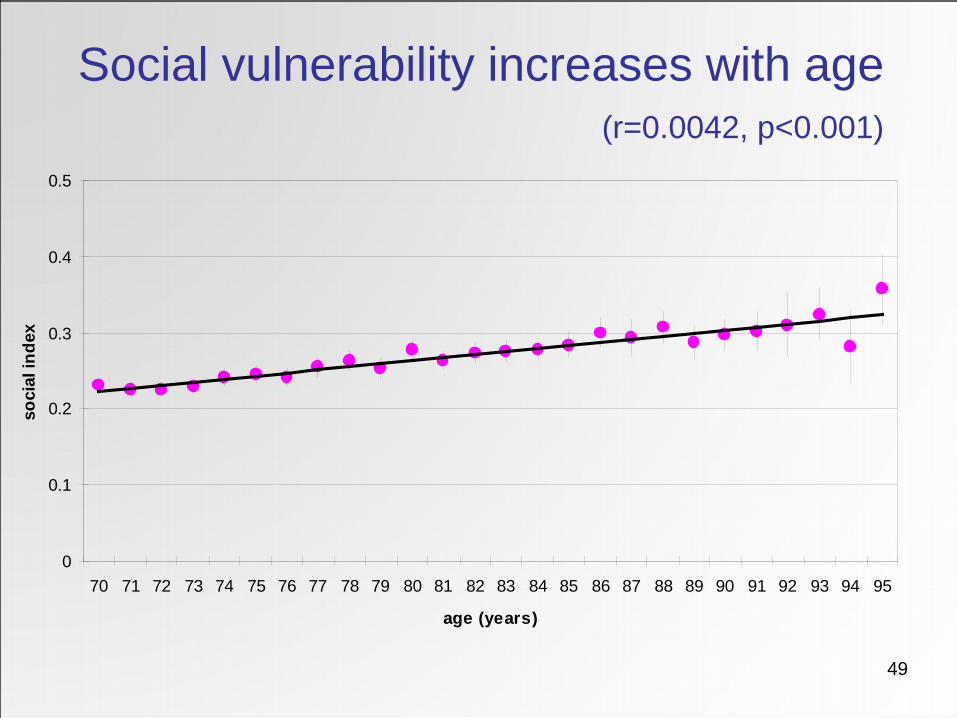
Social vulnerability increases with age (r=0.0042, p<0.001)
0
0.1
0.2
0.3
0.4
0.5
70 71 72 73 74 75 76 77 78 79 80 81 82 83 84 85 86 87 88 89 90 91 92 93 94 95
age (years)
soci
al in
dex

50 There is a meaningful survival gradient with increasing quartiles of social vulnerability
0.00
0.25
0.50
0.75
1.00
prop
ortio
n su
rviv
ing
0 1 2 3 4 5survival time (years)
sindex4 = lowest quartile sindex4 = 25-50th percentilesindex4 = 50-75th percentile sindex4 = highest quartile
Survival by social vulnerability quartile
Andrew et al. PLoS One 2008
51
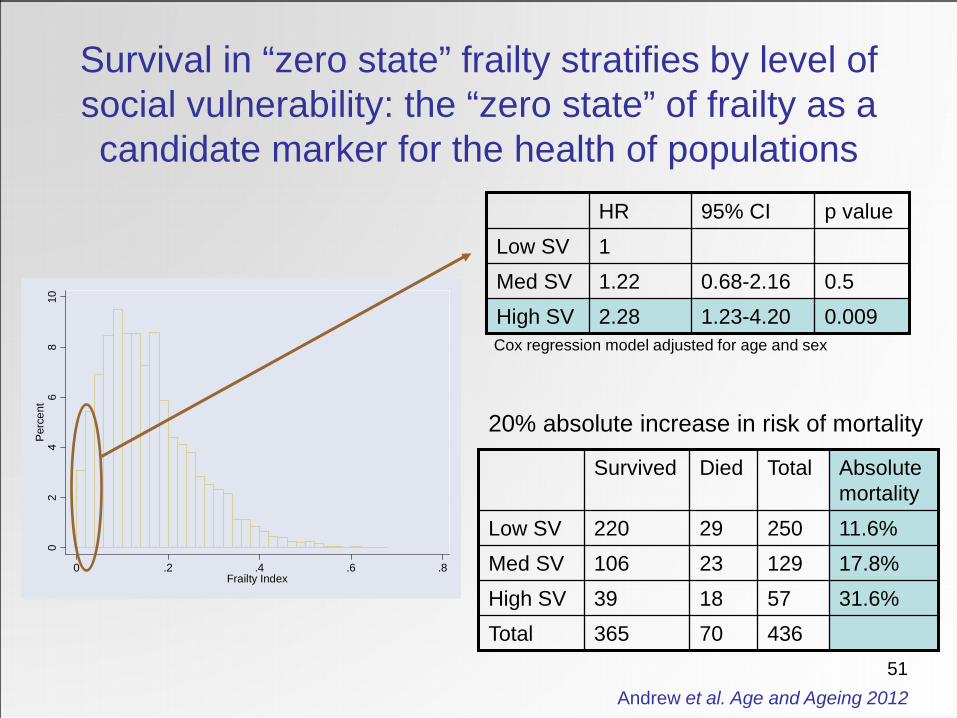
Survival in “zero state” frailty stratifies by level of social vulnerability: the “zero state” of frailty as a candidate marker for the health of populations
02
46
810
Per
cent
0 .2 .4 .6 .8Frailty Index
436 57 129 250
Total
31.6% 18 39 High SV 70 365 Total
17.8% 23 106 Med SV 11.6% 29 220 Low SV
Absolute mortality
Died Survived
20% absolute increase in risk of mortality
p value 95% CI HR
0.009 1.23-4.20 2.28 High SV 0.5 0.68-2.16 1.22 Med SV
1 Low SV
Cox regression model adjusted for age and sex
Andrew et al. Age and Ageing 2012

52
• Frailty and social vulnerability have important implications for the health of older people
• Implications for clinical care – Comprehensive Geriatric Assessment and
frailty assessment are useful ways forward • Implications for our health systems
– We must plan for people with many things wrong
• Future directions for research
Implications