Tutorial26 Vegetation Hyperspectral - · PDF fileIt will guide you through performing data...
10
ENVI Tutorial: Vegetation Hyperspectral Analysis Table of Contents OVERVIEW OF THIS TUTORIAL ............................................................................................................................................................... 1 HyMap Processing Flow.................................................................................................................................................................... 4 VEGETATION HYPERSPECTRAL ANALYSIS.............................................................................................................................................. 4 Examine the Jasper Ridge HyMap Radiance Data ............................................................................................................................ 4 Extract Reflectance Signatures. ......................................................................................................................................................... 5 Reduce Data Dimensionality Using Minimum Noise Fraction (MNF) Transform ............................................................................ 6 Select Spectral Endmember Candidates Using Pixel Purity Index (PPI) .......................................................................................... 6 Evaluate Linearity and Select Endmembers Using n-D Visualizer .................................................................................................... 7 Map Endmember Distribution and Abundance Using ENVI mapping methods ................................................................................ 8 Reconcile Image and Field Spectra/Ground Information .................................................................................................................. 9
Transcript of Tutorial26 Vegetation Hyperspectral - · PDF fileIt will guide you through performing data...
ENVI Tutorial: Vegetation Hyperspectral Analysis
Table of Contents OVERVIEW OF THIS TUTORIAL ...............................................................................................................................................................1
HyMap Processing Flow....................................................................................................................................................................4 VEGETATION HYPERSPECTRAL ANALYSIS..............................................................................................................................................4
Examine the Jasper Ridge HyMap Radiance Data............................................................................................................................4 Extract Reflectance Signatures. .........................................................................................................................................................5 Reduce Data Dimensionality Using Minimum Noise Fraction (MNF) Transform ............................................................................6 Select Spectral Endmember Candidates Using Pixel Purity Index (PPI) ..........................................................................................6 Evaluate Linearity and Select Endmembers Using n-D Visualizer....................................................................................................7 Map Endmember Distribution and Abundance Using ENVI mapping methods ................................................................................8 Reconcile Image and Field Spectra/Ground Information..................................................................................................................9

Tutorial: Vegetation Hyperspectral Analysis
1 ENVI Tutorial: Vegetation Hyperspectral Analysis
Overview of This Tutorial This tutorial presents a case history for use of hyperspectral techniques for vegetation analysis using 1999 HyMap data of Jasper Ridge, California, USA. It is designed to be a self-directed example using ENVI’s complete end-to-end hyperspectral tools to produce image-derived endmember spectra and image maps. For more detail and step-by-step procedures on performing such a hyperspectral analysis, please execute the detailed hyperspectral ENVI tutorials prior to attempting this tutorial.
This tutorial examines ENVI’s end-to-end hyperspectral processing methodology applied to a vegetation case study. It is designed to give you hands-on experience in running the procedures rather than reviewing pre-calculated results (preprocessed results are provided for comparison). It will guide you through performing data exploration in a loosely structured framework and allow you to compare analysis results with known ground information.
In this tutorial, you will: • Examine HyMap radiance data and evaluate data characteristics and quality. • Evaluate atmospherically corrected (ATREM), EFFORT-corrected HyMap data and compare to radiance data. • Conduct spatial/spectral browsing to evaluate data, determine presence and nature of spectral variability, and to
select wavelength range (s) for further analysis. • Reduce data dimensionality using MNF transform. • Select spectral endmember candidates using PPI. • Evaluate linearity and select endmembers using n-D Visualizer. • Map endmember distribution and abundance using ENVI mapping methods. Compare and contrast results. • Reconcile image and field spectra/ground information.
Selected data files have been converted to integer format by multiplying the reflectance values by 10,000 because of disk space considerations. Values of 10,000 in the files represent reflectance values of 1.0.
Files Used in This Tutorial CD-ROM: Tutorial Data CD #1 Path: envidata/spec_lib/veg_lib envidata/spec_lib/usgs_min envidata/jsp99hym 1999 HyMap data of Jasper Ridge, California, used for the tutorial are copyright 1999 Analytical Imaging and Geophysics (AIG) and HyVista Corporation (All Rights Reserved), and may not be redistributed without explicit permission from AIG ([email protected]).
File Description Required files from envidata/spec_lib/veg_lib usgs_veg.sli USGS vegetation spectral library usgs_veg.hdr ENVI header for above veg_2grn.sli Jasper Ridge, spectral library veg_2grn.hdr ENVI header for above Required files from envidata/spec_lib/usgs_min usgs_min.sli USGS mineral spectral library usgs_min.hdr ENVI header for above Required files from envidata/jsp99hym jsp99hym_rad.bil HyMap Radiance, VNIR (60 bands) jsp99hym_rad.hdr ENVI header for above jsp99hym.eff HyMap ATREM with EFFORT correction applied jsp99hym.hdr ENVI header for above jsp99hym_mnf.bil VNIR MNF transformed data (60 bands)
Tutorial: Vegetation Hyperspectral Analysis
2 ENVI Tutorial: Vegetation Hyperspectral Analysis
jsp99hym_mnf.hdr ENVI header for above jsp99hym_mnf_ns.sta VNIR MNF noise statistics jsp99hym_mnf.txt ASCII file of MNF Eigenvalues jsp99hym_ppi.img VNIR PPI image jsp99hym_ppi.hdr ENVI header for above jsp99hym_ppi.cnt PPI count file jsp99hym_ppi.roi ENVI PPI ROI file for use with n-D Visualizer jsp99hym_ppi.ndv n-D Visualizer save state from PPI jsp99hym_ndv_em.roi VNIR ROI file of n-D Visualizer endmember locations jsp99hym_ndv_em.txt VNIR ASCII file of endmember spectra jsp99hym_sam.img VNIR SAM classes jsp99hym_sam.hdr ENVI header for above jsp99hym_rul.img VNIR SAM rules jsp99hym_rul.hdr ENVI header for above jsp99hym_glt.img Geometry lookup file for HyMap geocorrection jsp99hym_glt.hdr ENVI header for above copyright.txt HyMap copyright statement
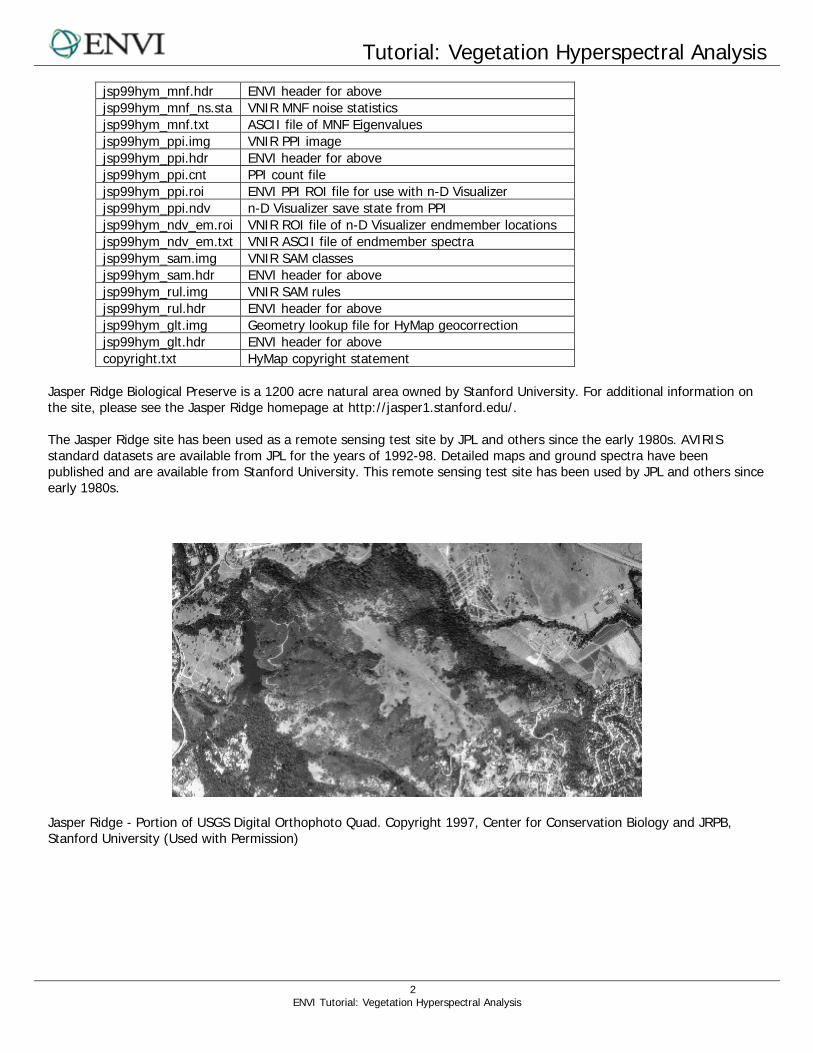
Jasper Ridge Biological Preserve is a 1200 acre natural area owned by Stanford University. For additional information on the site, please see the Jasper Ridge homepage at http://jasper1.stanford.edu/. The Jasper Ridge site has been used as a remote sensing test site by JPL and others since the early 1980s. AVIRIS standard datasets are available from JPL for the years of 1992-98. Detailed maps and ground spectra have been published and are available from Stanford University. This remote sensing test site has been used by JPL and others since early 1980s.
Jasper Ridge - Portion of USGS Digital Orthophoto Quad. Copyright 1997, Center for Conservation Biology and JRPB, Stanford University (Used with Permission)
Tutorial: Vegetation Hyperspectral Analysis
3 ENVI Tutorial: Vegetation Hyperspectral Analysis
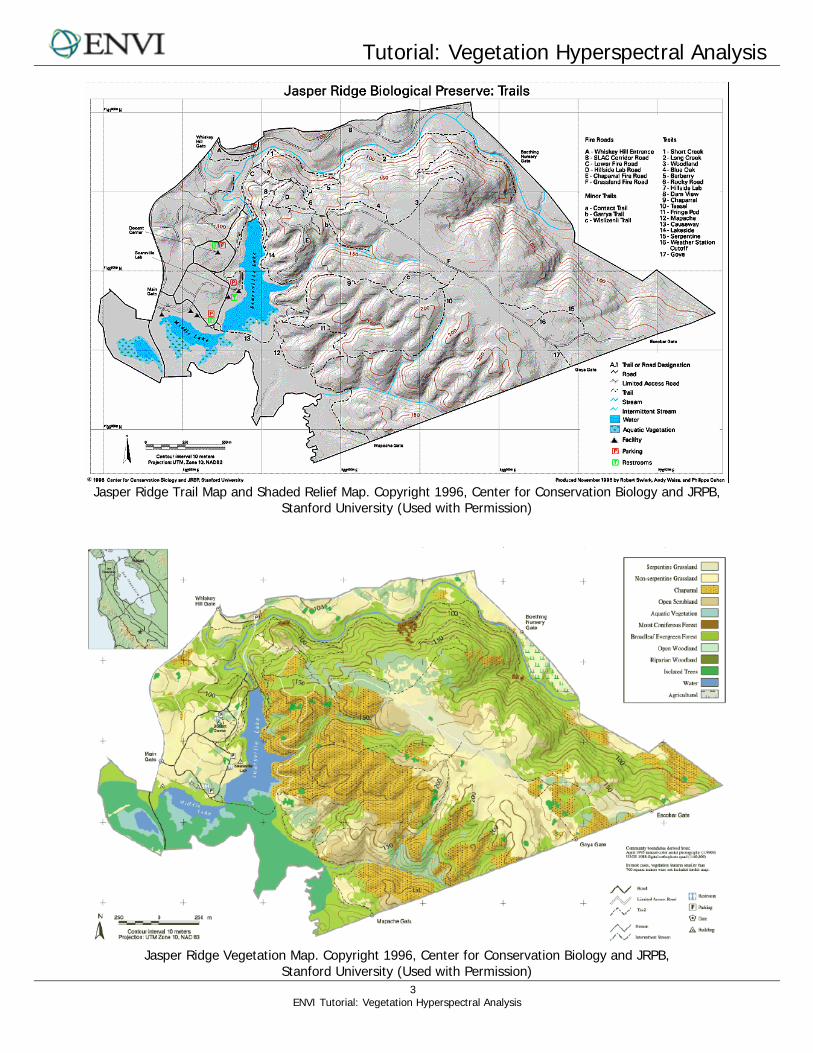
Jasper Ridge Trail Map and Shaded Relief Map. Copyright 1996, Center for Conservation Biology and JRPB,
Stanford University (Used with Permission)
Jasper Ridge Vegetation Map. Copyright 1996, Center for Conservation Biology and JRPB,
Stanford University (Used with Permission)
Tutorial: Vegetation Hyperspectral Analysis
4 ENVI Tutorial: Vegetation Hyperspectral Analysis
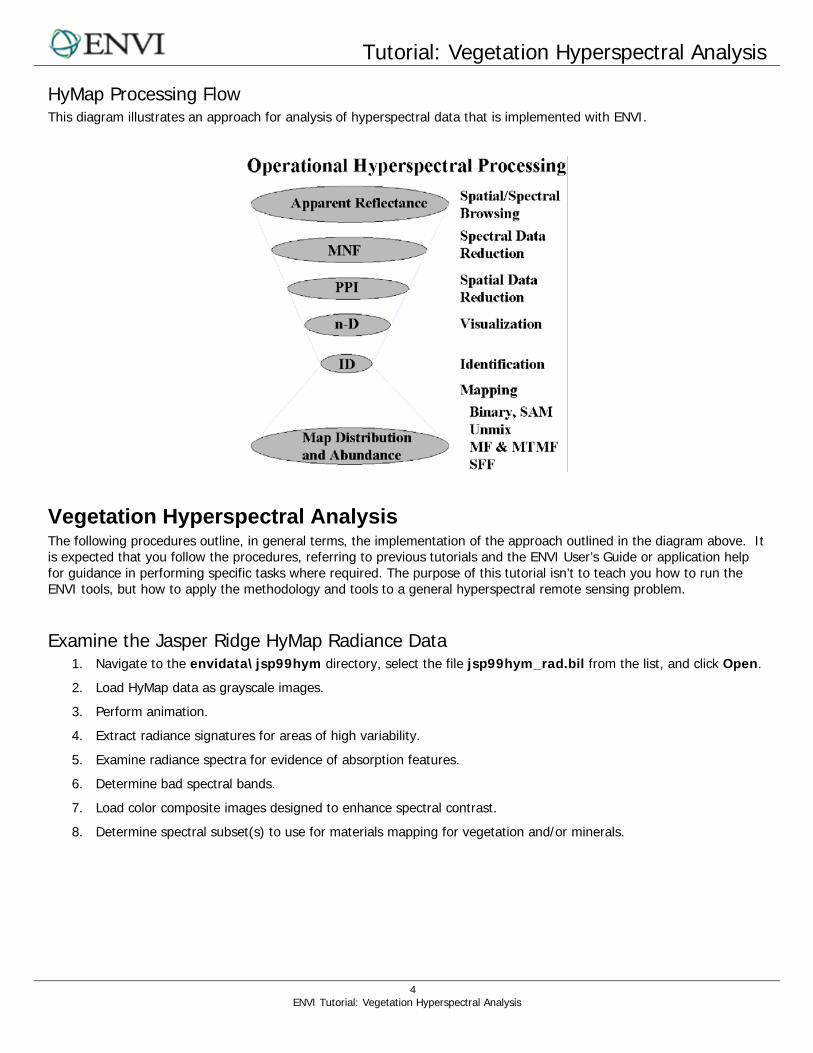
HyMap Processing Flow This diagram illustrates an approach for analysis of hyperspectral data that is implemented with ENVI.
Vegetation Hyperspectral Analysis The following procedures outline, in general terms, the implementation of the approach outlined in the diagram above. It is expected that you follow the procedures, referring to previous tutorials and the ENVI User’s Guide or application help for guidance in performing specific tasks where required. The purpose of this tutorial isn’t to teach you how to run the ENVI tools, but how to apply the methodology and tools to a general hyperspectral remote sensing problem.
Examine the Jasper Ridge HyMap Radiance Data 1. Navigate to the envidata\jsp99hym directory, select the file jsp99hym_rad.bil from the list, and click Open.
2. Load HyMap data as grayscale images.
3. Perform animation.
4. Extract radiance signatures for areas of high variability.
5. Examine radiance spectra for evidence of absorption features.
6. Determine bad spectral bands.
7. Load color composite images designed to enhance spectral contrast.
8. Determine spectral subset(s) to use for materials mapping for vegetation and/or minerals.
Tutorial: Vegetation Hyperspectral Analysis
5 ENVI Tutorial: Vegetation Hyperspectral Analysis
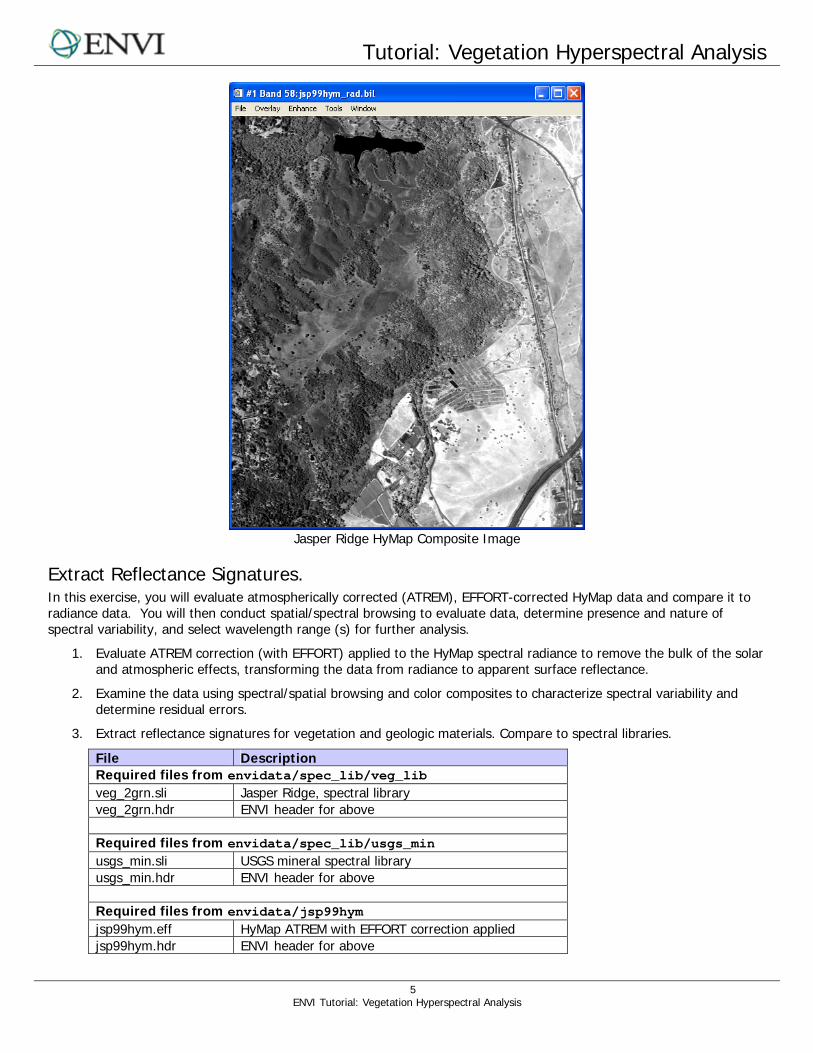
Jasper Ridge HyMap Composite Image
Extract Reflectance Signatures. In this exercise, you will evaluate atmospherically corrected (ATREM), EFFORT-corrected HyMap data and compare it to radiance data. You will then conduct spatial/spectral browsing to evaluate data, determine presence and nature of spectral variability, and select wavelength range (s) for further analysis.
1. Evaluate ATREM correction (with EFFORT) applied to the HyMap spectral radiance to remove the bulk of the solar and atmospheric effects, transforming the data from radiance to apparent surface reflectance.
2. Examine the data using spectral/spatial browsing and color composites to characterize spectral variability and determine residual errors.
3. Extract reflectance signatures for vegetation and geologic materials. Compare to spectral libraries.
File Description Required files from envidata/spec_lib/veg_lib veg_2grn.sli Jasper Ridge, spectral library veg_2grn.hdr ENVI header for above Required files from envidata/spec_lib/usgs_min usgs_min.sli USGS mineral spectral library usgs_min.hdr ENVI header for above Required files from envidata/jsp99hym jsp99hym.eff HyMap ATREM with EFFORT correction applied jsp99hym.hdr ENVI header for above
Tutorial: Vegetation Hyperspectral Analysis
6 ENVI Tutorial: Vegetation Hyperspectral Analysis
Reduce Data Dimensionality Using Minimum Noise Fraction (MNF) Transform In this exercise, you will perform tasks related to minimum noise fraction.
1. Apply MNF transform to the EFFORT data to find the data’s inherent dimensionality.
2. Review MNF Eigenvalue images to determine break-in-slope and relate to spatial coherency in MNF Eigenimages.
3. Determine MNF cut-off between “signal” and “noise” for further analysis.
4. Make your own MNF-transformed dataset or review the results in the files below:
File Description Required files from envidata/jsp99hym jsp99hym_mnf.bil VNIR MNF transformed data (60 Bands) jsp99hym_mnf.hdr ENVI header for above jsp99hym_mnf_ns.sta VNIR MNF noise statistics jsp99hym_mnf.txt ASCII file of MNF Eigenvalues
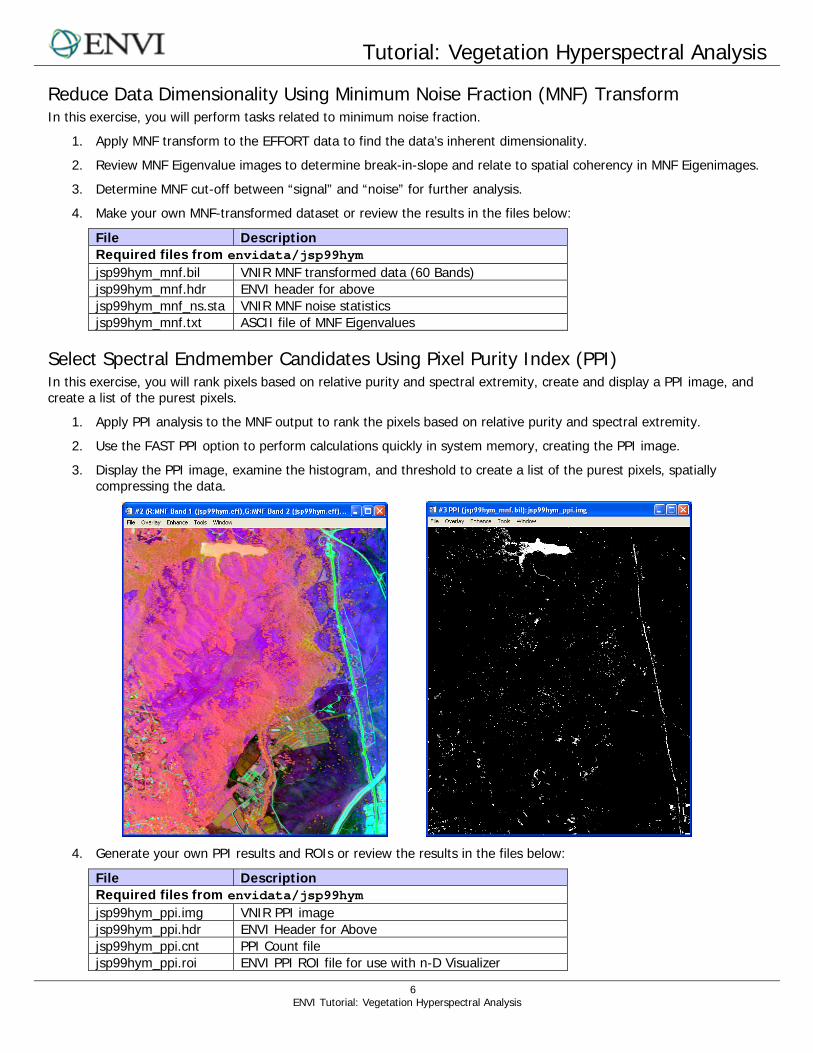
Select Spectral Endmember Candidates Using Pixel Purity Index (PPI) In this exercise, you will rank pixels based on relative purity and spectral extremity, create and display a PPI image, and create a list of the purest pixels.
1. Apply PPI analysis to the MNF output to rank the pixels based on relative purity and spectral extremity.
2. Use the FAST PPI option to perform calculations quickly in system memory, creating the PPI image.
3. Display the PPI image, examine the histogram, and threshold to create a list of the purest pixels, spatially compressing the data.
4. Generate your own PPI results and ROIs or review the results in the files below:
File Description Required files from envidata/jsp99hym jsp99hym_ppi.img VNIR PPI image jsp99hym_ppi.hdr ENVI Header for Above jsp99hym_ppi.cnt PPI Count file jsp99hym_ppi.roi ENVI PPI ROI file for use with n-D Visualizer
Tutorial: Vegetation Hyperspectral Analysis
7 ENVI Tutorial: Vegetation Hyperspectral Analysis
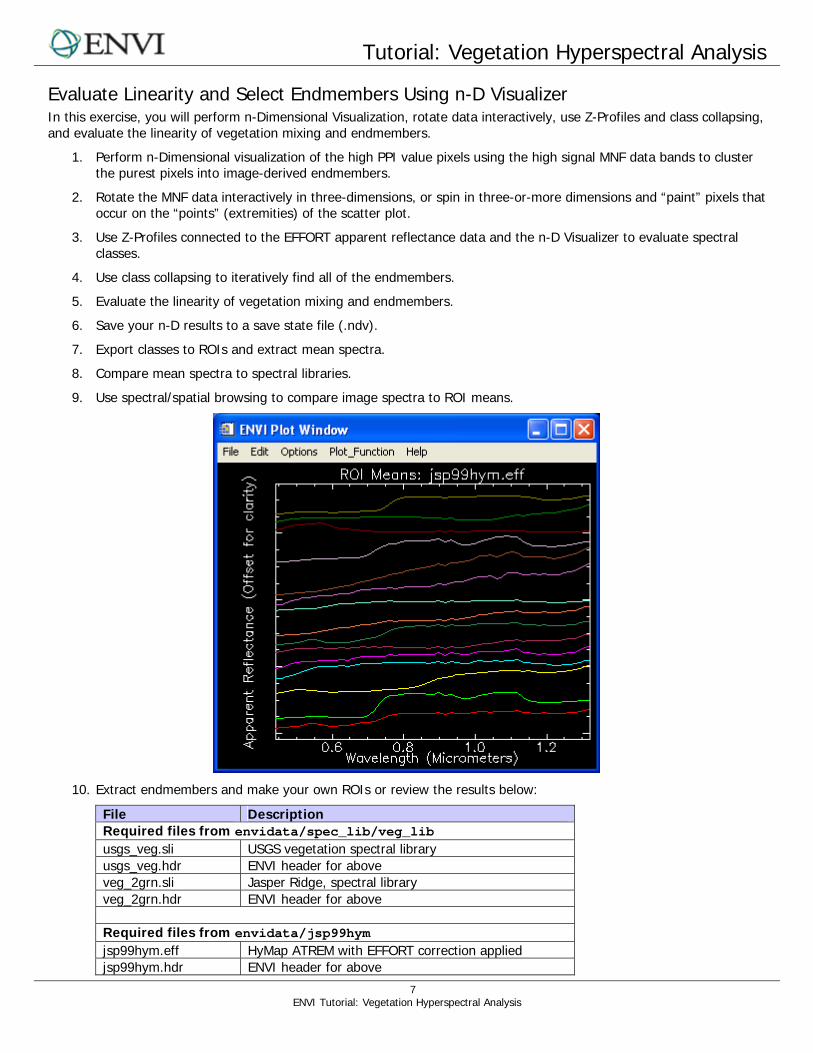
Evaluate Linearity and Select Endmembers Using n-D Visualizer In this exercise, you will perform n-Dimensional Visualization, rotate data interactively, use Z-Profiles and class collapsing, and evaluate the linearity of vegetation mixing and endmembers.
1. Perform n-Dimensional visualization of the high PPI value pixels using the high signal MNF data bands to cluster the purest pixels into image-derived endmembers.
2. Rotate the MNF data interactively in three-dimensions, or spin in three-or-more dimensions and “paint” pixels that occur on the “points” (extremities) of the scatter plot.
3. Use Z-Profiles connected to the EFFORT apparent reflectance data and the n-D Visualizer to evaluate spectral classes.
4. Use class collapsing to iteratively find all of the endmembers.
5. Evaluate the linearity of vegetation mixing and endmembers.
6. Save your n-D results to a save state file (.ndv).
7. Export classes to ROIs and extract mean spectra.
8. Compare mean spectra to spectral libraries.
9. Use spectral/spatial browsing to compare image spectra to ROI means.
10. Extract endmembers and make your own ROIs or review the results below:
File Description Required files from envidata/spec_lib/veg_lib usgs_veg.sli USGS vegetation spectral library usgs_veg.hdr ENVI header for above veg_2grn.sli Jasper Ridge, spectral library veg_2grn.hdr ENVI header for above Required files from envidata/jsp99hym jsp99hym.eff HyMap ATREM with EFFORT correction applied jsp99hym.hdr ENVI header for above
Tutorial: Vegetation Hyperspectral Analysis
8 ENVI Tutorial: Vegetation Hyperspectral Analysis
jsp99hym_mnf.bil VNIR MNF transformed data (60 Bands) jsp99hym_mnf.hdr ENVI header for above jsp99hym_ppi.ndv n-D Visualizer save state from PPI jsp99hym_ndv_em.roi VNIR ROI file of n-D Visualizer endmember locations jsp99hym_ndv_em.txt VNIR ASCII file of endmember spectra
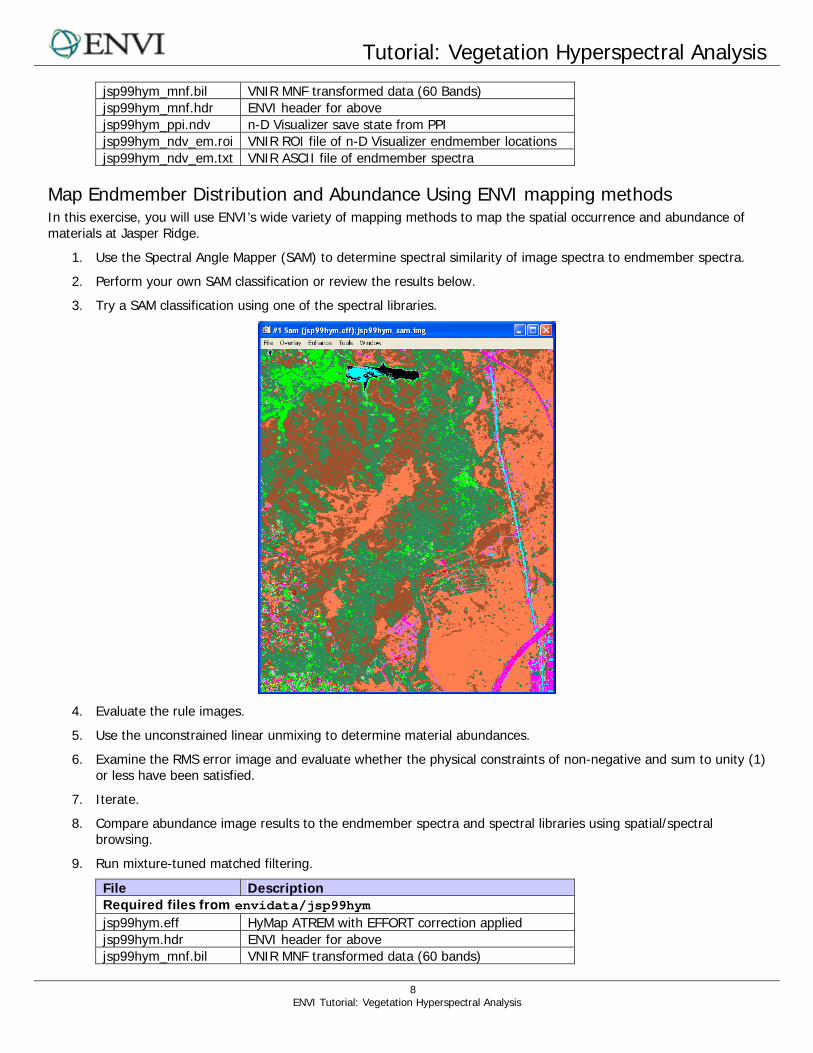
Map Endmember Distribution and Abundance Using ENVI mapping methods In this exercise, you will use ENVI’s wide variety of mapping methods to map the spatial occurrence and abundance of materials at Jasper Ridge.
1. Use the Spectral Angle Mapper (SAM) to determine spectral similarity of image spectra to endmember spectra.
2. Perform your own SAM classification or review the results below.
3. Try a SAM classification using one of the spectral libraries.
4. Evaluate the rule images.
5. Use the unconstrained linear unmixing to determine material abundances.
6. Examine the RMS error image and evaluate whether the physical constraints of non-negative and sum to unity (1) or less have been satisfied.
7. Iterate.
8. Compare abundance image results to the endmember spectra and spectral libraries using spatial/spectral browsing.
9. Run mixture-tuned matched filtering.
File Description Required files from envidata/jsp99hym jsp99hym.eff HyMap ATREM with EFFORT correction applied jsp99hym.hdr ENVI header for above jsp99hym_mnf.bil VNIR MNF transformed data (60 bands)

Tutorial: Vegetation Hyperspectral Analysis
9 ENVI Tutorial: Vegetation Hyperspectral Analysis
jsp99hym_mnf.hdr ENVI header for above jsp99hym_ndv_em.roi VNIR ROI file of n-D Visualizer endmember locations jsp99hym_ndv_em.txt VNIR ASCII file of endmember spectra jsp99hym_sam.img VNIR SAM classes jsp99hym_sam.hdr ENVI header for above jsp99hym_rul.img VNIR SAM rules jsp99hym_rul.hdr ENVI header for above
Reconcile Image and Field Spectra/Ground Information In this exercise, you will geocorrect the processed images of the Jasper Ridge to map coordinates.
1. Use ENVI’s georeference from the input geometry function to geocorrect the processed images of the Jasper Ridge to map coordinates.
2. Compare geocorrected images to image maps of conventional vegetation mapping at Jasper Ridge.
File Description Required files from envidata/jsp99hym jsp99hym.eff HyMap ATREM with EFFORT correction applied jsp99hym.hdr ENVI header for above jsp99hym_glt.img Geometry lookup file for HyMap geocorrection jsp99hym_glt.hdr ENVI header for above