Tutorial 3: VennDiagramedkb.fda.gov/webstart/arraytrack/Tutorials/Tutorial 3-VennDiagram.pdf ·...
17
1 Tutorial 3: VennDiagram
Transcript of Tutorial 3: VennDiagramedkb.fda.gov/webstart/arraytrack/Tutorials/Tutorial 3-VennDiagram.pdf ·...

1
Tutorial 3:VennDiagram

2
• Why use VennDiagram:VennDiagram is a tool that visually displays the number of common
characteristics among 2~3 gene lists.
• How to get Input to VennDiagram:<1> Gene List saved in ArrayTrack (the most popular usage); <2> List saved on your local machine (can be gene/protein/metabolite list);
• Functions associated with VennDiagram:<1> Common Genes: based on different gene IDs (GenBank accession #,
RefSeq, and etc)<2> Common Pathways: based on KEGG and PathArt
Advanced: across different omics data, such as a gene list from microarrayexperiment, a protein list from proteomics study, and a metabolite list from metabolomics study
<3> Common Gene Ontology terms: <4> Compare two array types:

3
Common Genes
Right-click the selected gene lists.
- Two ways to input to VennDiagram :<1> when gene lists have been saved in ArrayTrack:
When genelists come from the same chip, Manufactory ID and Spot ID are preferred, otherwise use LocusID or other listed gene IDs

4
1) Launch from Tool panel or Tool pull-down menu
<2> when gene lists are saved in local machine:
2) Either open a gene list file or paste a list of genes
3) Highlight gene column from loaded tables and click “Draw Venn” button.

5
By clicking any sections from VennDiagram, the regions will be highlighted. Then right click to choose the options. One option allows display the selected genes in the original data sheet.
Fold change direction optionOnly applies to genelists saved in ArrayTrackand fold info available. If gene id is same, but with different fold change direction, then it will be considered as different genes.
- Display original data for the selected sections

6
Common Pathways
Using VennDiagram, the common pathways shared by two or three lists can be identified. The lists could be genes from microarray study, proteins from the proteomics study or metabolites from metabolomics. Please see Topic 6 for uploading the protein and metabolite list.
At this point, ArrayTrack provides KEGG and ParthArtpathways. Thus, the common pathways are separately identified for KEGG and PathArt.

7
Highlight common LOCUS ID then click Draw Venn button
<1> Input: Right-click the selected gene lists, choose VennDiagram by Pathway/Kegg

8
GeneList1 GeneList2 GeneList3
<2> Display Pathway: Show common Pathway by right-click of the highlighted green area of the VennDiagram.
Different colors representdifferent gene lists.
Double click record on tableto display pathway map (genes are highlighted)
9
GeneList1 GeneList2 GeneList3
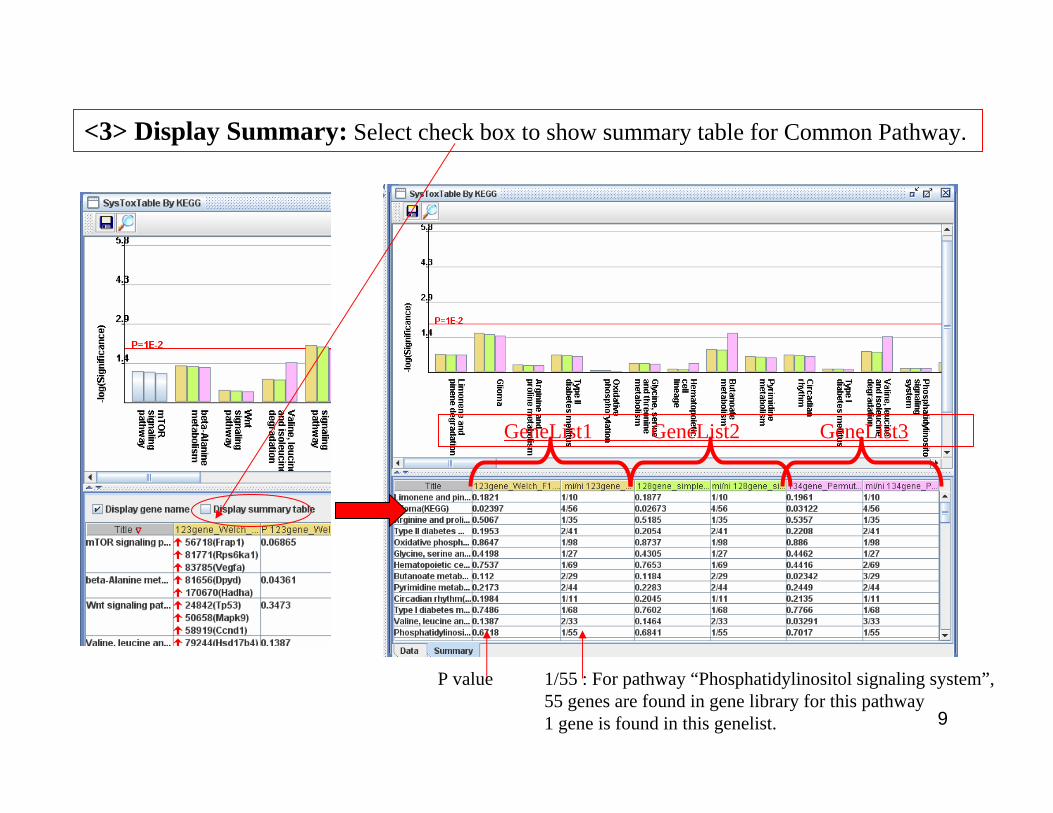
<3> Display Summary: Select check box to show summary table for Common Pathway.
P value 1/55 : For pathway “Phosphatidylinositol signaling system”,55 genes are found in gene library for this pathway1 gene is found in this genelist.

10
<4> P value cut: calculate p by Fisher Exact Test.
(1)After apply p < 0.05 (2)Display pathway table & chart
(3)Click table header to sort
(4)Double click record to show pathway map

11
Common pathways:Advanced: shared by the genes, proteins and metabolites
VennDiagram can also be used to find common pathway based on gene list, protein list and metabolite list. Rank of significant of P is displayed in summary table. Click individual KEGG pathway which links to KEGG website.
Genes(i.e. locusid)
Proteins(i.e. locusid or SwissProt ID)
Metabolites (i.e.Compound Cas #)

12
Common pathways:Advanced: shared by the genes, proteins and metabolites
GeneList ProteinList MetaboliteList

13
Common pathwaysAdvanced: shared by the genes, proteins and metabolites
Double click a record from table, or highlight a record from table, right click and select “Show Pathway Map” - > “For All Columns”

14
Common Gene Ontology terms
GOFFA (Gene Ontology For Functional Analysis) is a specific GO-based tool implemented in ArrayTrack. The common GeneOntology function identifies the common Gene Ontology terms shared by two or three gene lists. Identification of the common Gene Ontology terms is similar to the procedure used for determine the common pathways. The common biological process, molecular function and Cellular component terms are presented in results tables.

15
Highlight common LOCUS ID then click Draw Venn
16
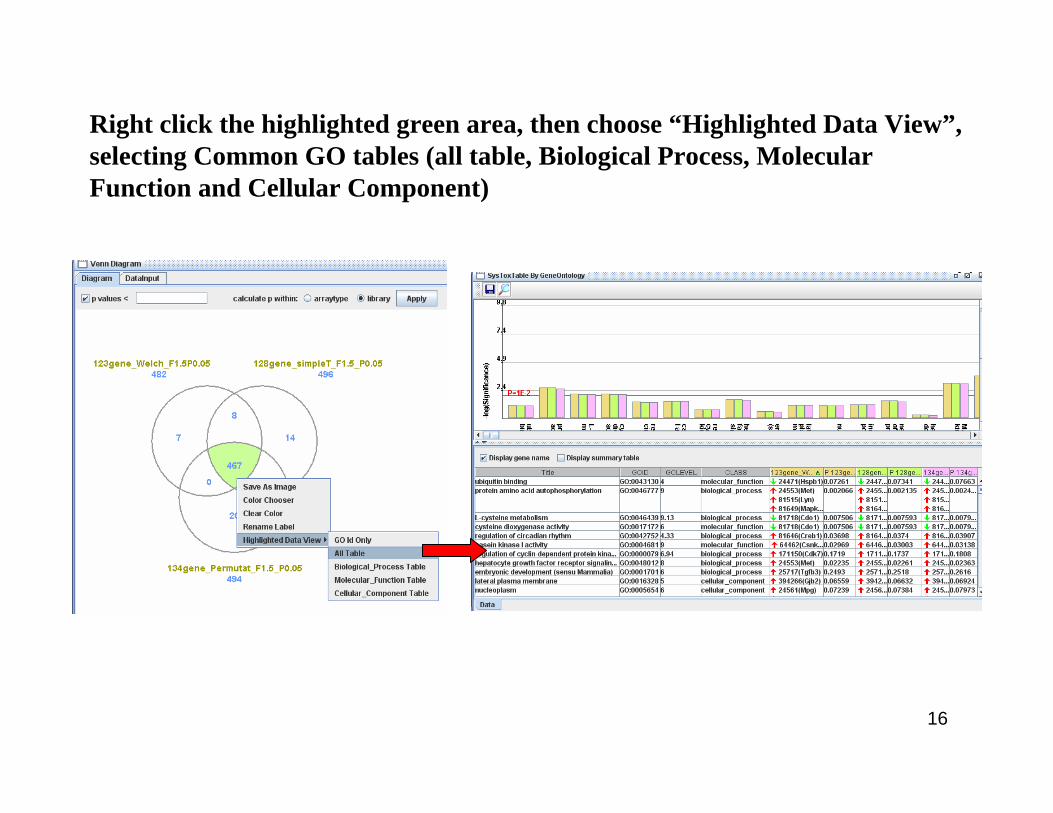
Right click the highlighted green area, then choose “Highlighted Data View”, selecting Common GO tables (all table, Biological Process, Molecular Function and Cellular Component)

17
Compare two array types
(3)Original data is displayed back into chip library table.
(1)Select the array types to be compared
(2)Click “VennDiagram” button and choose the ID type thatthe comparison is based on


![Size proportional Venn and Euler diagrams in 2 and …sas.uwaterloo.ca/~rwoldfor/students/ZehaoXu/venn.pdfarea, like package vennDiagram(...) [6] and venn(...) in R. The other approach](https://static.fdocuments.net/doc/165x107/5e86c08cd87de31a0648b7d2/size-proportional-venn-and-euler-diagrams-in-2-and-sas-rwoldforstudentszehaoxuvennpdf.jpg)