TUSCOLA COUNTY, MICHIGAN - connectednation.org
129
TUSCOLA COUNTY, MICHIGAN Connected Survey Results
Transcript of TUSCOLA COUNTY, MICHIGAN - connectednation.org

TUSCOLA COUNTY, MICHIGANConnected Survey Results

1
Table of Contents
02 Household Survey Results
20 Agriculture Sector Survey Results
32 Business Sector Survey Results
53 Government Sector Survey Results
64 Health Care Sector Survey Results
73 Higher Education Sector Survey Results
85 K-12 School Sector Survey Results
100 Library and Community Organization Sector Survey Results
114 Public Safety Sector Survey Results

TUSCOLA COUNTY, MICHIGANHousehold Survey Results

3
Households, and the residents within, are the lifeblood of a community. Over the last 20 years, technology has transformed how residents interact with their communities, access critical services, and earn a living. A connection to the internet at home is the single-most critical step that families take to participate in the digital economy. Understanding how residents are connected, the barriers to subscribing to internet service if it is available, and the use of that connection is critical to ensuring all homes in the community are connected and that those connections are leveraged to improve quality of life. The data below show the connectivity and use of technology among households and residents in the community compared to those in other communities participating in Connected Nation’s Connected program. These data should be used to make informed decisions and implement solutions for improving connectivity in the community. This information was gathered through surveys distributed in the community.
Household Survey Results
Data from Tuscola County represent survey responses collected between February 2021 and April 2021. During this time, 663 Tuscola County households responded to the survey, with some households responding more than one time. Data from all Connected communities represent survey responses collected between January 1, 2017, and April 30, 2021. As more households and communities participate in the Connected program, these figures are likely to change.

Broadband Adoption
This chart shows the percent of households that subscribe to various types of broadband services. Fixed connections are those provided by cable, DSL, fiber, or fixed wireless technology, while non-fixed connections include dial-up, satellite, and mobile-only services. These non-fixed types of internet services, while providing basic access, can often be plagued by connection latency, have costly monthly data plans, or can be impacted by weather, terrain, large expanses of open water, and other environmental factors. This chart shows responses from those who know the type of internet service to which they subscribe.
0% 20% 40% 60% 80% 100%
Tuscola County, Michigan
All Communities
Fixed Non-Fixed No Connection
4

Average Monthly Cost ofInternet Service
The cost of service can prevent some from being able to access the internet. This chart shows the average reported monthly cost of service among households in the community compared to those in other Connected communities. Two percent of household income is the benchmark generally used when determining the affordability of home internet service. However, it is important to remember that this benchmark is applied to the median income of a community. Half of the households in the community earn less than the median income and thus may find broadband service unaffordable at this price.
$0 $20 $40 $60 $80 $100
Tuscola County2% Median Household Income
Tuscola County, Michigan
All Communities
5

Barriers to Broadband Adoption
Households without an internet connection face many barriers to obtaining connectivity. In some cases, the cost of service may be out of reach. In others, the physical infrastructure may not be available. This chart shows the primary reason households without a connection in the community do not or cannot subscribe to broadband service. This chart compares households in the community to those across other participating communities.
0% 20% 40% 60% 80% 100%
Tuscola County, Michigan
All Communities
We don't own a computerWe don't need the internetWe do not know enough about the internet to feel comfortable using itInternet service is not available at my addressInternet service is too expensiveWe have access to the internet elsewhere (e.g., work, school, library, etc.)Other
6

Connection speeds can have a major impact on how the internet is used. This chart shows the average reported download speed among households in the community compared to those in other Connected communities.
0 5 10 15 20 25 30 35 40
Tuscola County, Michigan
All Communities
Download Speeds
Speed (Mbps)
7

Mobile Usage
Mobile broadband is different from fixed internet service in that it is designed for continuous use on the go. Having both fixed and mobile broadband connections is critical for households to ensure voice and data options are available to users as needed or desired. This chart shows the percent of households in the community that have a mobile broadband plan and device compared to other communities.
0% 20% 40% 60% 80% 100%
Tuscola County, Michigan
All Communities
Yes No
8

How Mobile Internet is Used
Some households use their mobile internet service as a backup or supplemental way to go online. For others, mobile internet service is the primary (or only) way to access the internet at home. This chart shows how households that subscribe to mobile service use those mobile internet subscriptions.
0% 20% 40% 60% 80% 100%
Tuscola County, Michigan
Mobile internet service is our primary home internet source - we exclusively use our smartphones to go online
We use our mobile service to connect other household devices to the internet
Mobile internet service is a secondary connection; we mostly use a fixed internet connection to go online from home
We subscribe to mobile internet service but we don't use it at home
Unsure
Other
9

In the early days of the internet, a desktop computer was the primary, and virtually the only, way of connecting to the internet. However, with the rise of Wi-Fi, mobile broadband, Bluetooth, and many other revolutionary technologies, residents have multiple ways through which they can access the internet. While a wide variety of devices are available to connect to the internet, sometimes the lack of an internet-enabled device is cited as a barrier to home broadband adoption. The chart shows the average number of internet-enabled devices in households in the community compared to homes in other Connected communities.
0 1 2 3 4
Other
Internet TV devices
Smart home devices
Gaming consoles
Smartphones
Tablets
Laptops
Desktops
Average Number of Internet-Connected Devices
All Communities Tuscola County, Michigan
Devices in the Home
10

Digital Interactions
The internet has moved from an occasional tool to one of the principal ways we communicate, perform research, work, or participate in leisure activities. Measuring the digital interaction among residents and different community sectors allows a glimpse into the importance of the internet in their lives. More importantly, this analysis can identify the common traits among those who use the internet less frequently and develop solutions for including them in the digital ecosystem.
This digital interaction information explores how residents are (or are not) digitally interacting with various community institutions. This information is helpful for guiding and developing the digital strategy and online presence of these entities in the community. The chart on the following page shows the average frequency with which residents digitally interact with different community sectors.
While digital interaction is a personal choice, for those completely without or with restricted access to the internet, those who cannot afford a connection, those without the skills to use the internet, and those with limited awareness of the opportunities afforded by the internet, their opportunity to make such a personal choice is severely limited.
11

Digital Interactions Continued
0% 10% 20% 30% 40% 50% 60% 70% 80% 90% 100%
Local Government
County Government
State Government
Federal Government
Local Businesses
Non-Local Businesses
Agriculture
Community Organizations
Health Care
Higher Education
K-12 Schools
Library
Public Safety
Travel and Tourism
How Frequently Residents Interact with Community Sectors
At least once a day At least once a week At least once a month Less than once a month Never
12

Digital Literacy: Communications
Digital literacy is the ability to use information and communication technologies to find, evaluate, create, and communicate information, requiring both cognitive and technical skills. Technology skills are critical for competing in the global, digital economy, and for fully leveraging internet connectivity for improving quality of life.
This chart compares the average self-reported digital literacy of residents in the community and those in other Connected communities when it comes to using various communications platforms.
VoIP applications
Text messaging
Snapchat
Other social media
All Communities Tuscola County, Michigan
I’m ComfortableWith This
13
NotInterested
I Needto Learn
I Knowa Little
I CanTeach This

Digital Literacy: Online Activities
This chart compares the average self-reported digital literacy of residents in the community to households in other communities in terms of conducting online activities.
Online research
Online learning
Online job searches
Online bill payment or e-banking
Mobile applications
Cybersecurity
Buying and selling online
All Communities Tuscola County, Michigan
14
NotInterested
I Needto Learn
I Knowa Little
I CanTeach This
I’m ComfortableWith This

Digital Literacy: Hardware
This chart compares the average self-reported digital literacy of residents in the community to households in other communities when using various types of hardware.
Wearable technology
Tablet computers
Smartphones
Smart home devices
Printers
Mouse and keyboard
Laptop computers
Internet TV devices
External storage devices
Desktop computers
All Communities Tuscola County, Michigan
15
NotInterested
I Needto Learn
I Knowa Little
I CanTeach This
I’m ComfortableWith This

Digital Literacy: Software
This chart compares the average self-reported digital literacy of residents in the community to households in other communities in terms of using various software applications.
16
NotInterested
I Needto Learn
I Knowa Little
I CanTeach This
I’m ComfortableWith This
Word processing
Spreadsheets
Presentation software
Operating systems
Multimedia recording/editing tools
Internet browsers
3D modeling
All Communities Tuscola County, Michigan

Service Satisfaction
Competition provides residents with choices for service, allowing them the ability to switch providers if their current service does not meet their needs. This chart shows the percent of households who state that their internet service meets or does not meet their needs.
0% 20% 40% 60% 80% 100%
Tuscola County, Michigan
All Communities
Yes No
17

Reasons for Dissatisfaction
This chart shows the various reasons why local households report being dissatisfied with their current internet service.
0% 20% 40% 60% 80% 100%
Limited data caps
Customer service is poor
My connection is unreliable
The price is too high
Speeds are too slow
All Communities Tuscola County, Michigan
18

Interest in Additional Internet Options
This chart shows the percent of households who would like to have improved or additional options for home internet service.
0% 20% 40% 60% 80% 100%
Tuscola County, Michigan
All Communities
Yes No
19

TUSCOLA COUNTY, MICHIGANAgriculture Survey Results

21
Agriculture, in its many forms, is a critical industry and economic driver for many communities and regions. Internet-connected technology allows agricultural producers to increase yields, reduce expenditures, and access best practices and information impacting the production of America’s food. However, producers and value-added agricultural industries are generally located in the most rural areas — areas that are most often disconnected from the global economy. For operations fortunate enough to have an internet connection, their use of technology has transformed their operations and allows them to contribute to the economic activity of their communities.
The data below show the connectivity and use of technology among agricultural producers in your community compared to those in other communities participating in Connected Nation’s Connected program. These data should be used to make informed decisions and implement solutions for improving connectivity in the community.
Agriculture Sector Survey Results
Data from Tuscola County represent survey responses collected between February 2021 and April 2021. During this time, five Tuscola County facilities in the Agricultural Sector responded to these surveys. Data from all Connected communities represent survey responses collected between January 1, 2017, and April 30, 2021. As more communities participate in the Connected program, these figures are likely to change.

Broadband Adoptionin the Agriculture Sector
This chart shows the percent of agricultural producers that subscribe to various types of broadband services or that are without a connection. Fixed connections are those provided by cable, DSL, fiber, or fixed wireless technology, while non-fixed connections include dial-up, satellite, and mobile-only services. These types of internet services, while providing basic access, can often be plagued by connection latency, have costly monthly data plans, or can be impacted by weather, terrain, large expanses of open water, and other environmental factors.
0% 20% 40% 60% 80% 100%
Tuscola County, Michigan
All Communities
Fixed Non-Fixed No Connection
22

Average Monthly Cost of Internet Service in the Agriculture Sector
The cost of service can prevent some agricultural facilities from being able to access the internet. This chart shows the average reported monthly cost of service among farms in the community compared to those in other Connected communities.
$0 $20 $40 $60 $80
Tuscola County, Michigan
All Communities
23

Digital Communications
Technology, coupled with an internet connection, provides a myriad of ways to digitally interact with the world or even those in one’s own community. This chart shows the average frequency with which agricultural producers use digital communications tools.
24
0% 10% 20% 30% 40% 50% 60% 70% 80% 90% 100%
Text
Video Social Media
Videoconferencing
Website Updates
YouTube
At least once a day At least once a week At least once a month Less than once a month Never
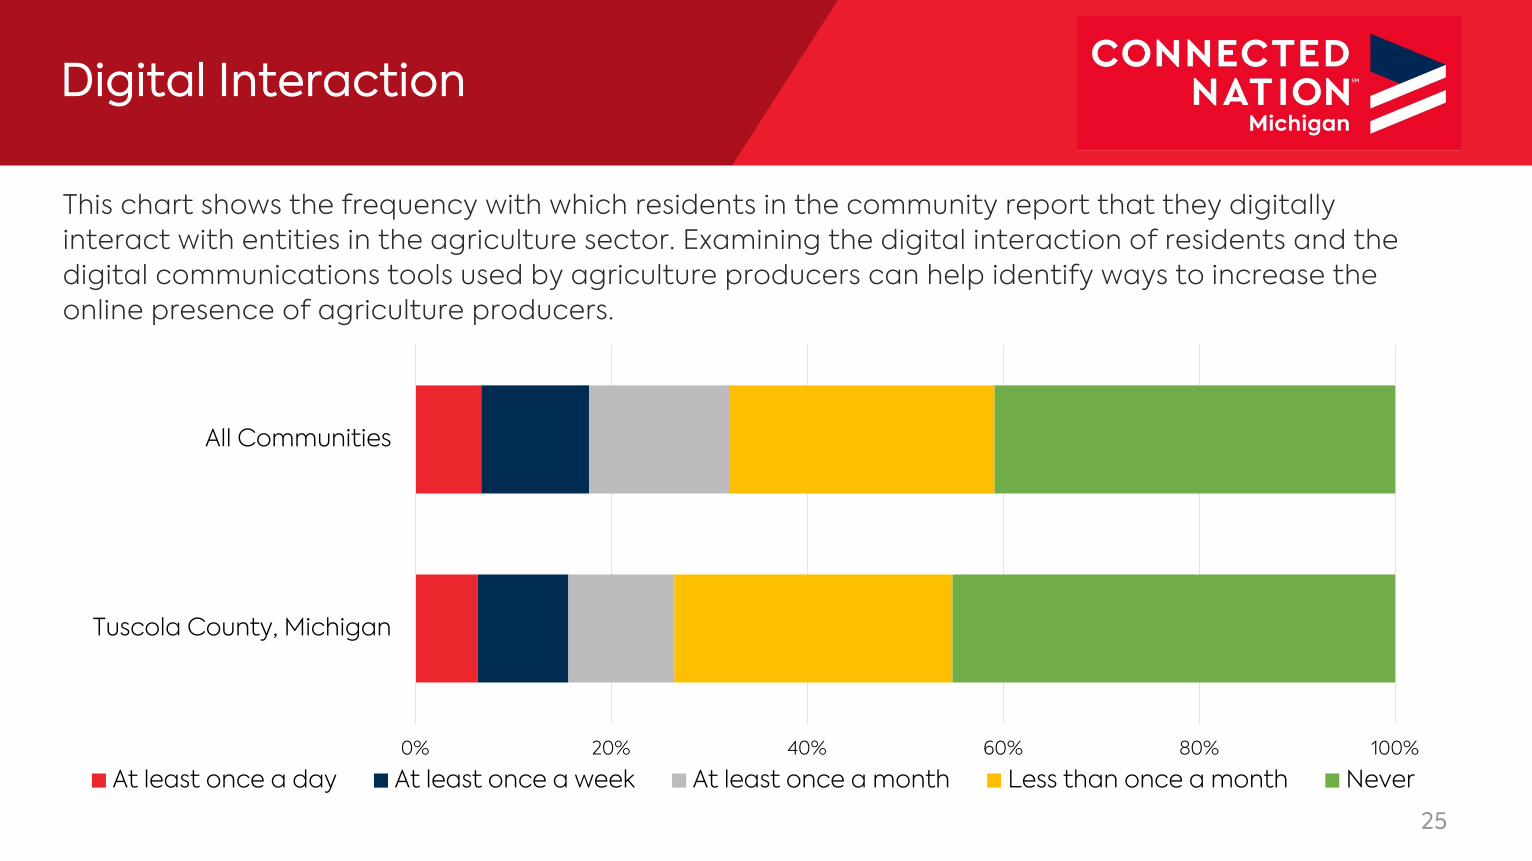
Digital Interaction
This chart shows the frequency with which residents in the community report that they digitally interact with entities in the agriculture sector. Examining the digital interaction of residents and the digital communications tools used by agriculture producers can help identify ways to increase the online presence of agriculture producers.
25
0% 20% 40% 60% 80% 100%
Tuscola County, Michigan
All Communities
At least once a day At least once a week At least once a month Less than once a month Never

Connection speeds can have a major impact on how the internet is used. This chart shows the average reported download speed among internet-connected facilities in the community’s agriculture sector compared to those in other Connected communities.
0 5 10 15 20 25 30
Tuscola County, Michigan
All Communities
Agriculture Sector Download Speeds
Speed (Mbps)
26

Online Activity in the Agriculture Sector
An internet connection provides unparalleled access to a host of resources and information. This chart shows how frequently agricultural producers use these agriculture-related online activities.
27
0% 10% 20% 30% 40% 50% 60% 70% 80% 90% 100%
Agriculture-Related Websites
Check the weather
Banking
Non-Agriculture Websites
Marketing
Networking
Virtual Product Markets
Buy Supplies
Research Markets
Seek Out USDA Information
Tech Assistance
Mobile Apps for Agriculture
At least once a day At least once a week At least once a month Less than once a month Never

Operation-Wide Service
Many applications and connected equipment require access to a wireless or Wi-Fi network, often in remote areas. This chart shows the percentage of agricultural producers who subscribe to internet service and say they can access the internet from any place in their operation.
0% 20% 40% 60% 80% 100%
Tuscola County, Michigan
All Communities
Wi-Fi is accessible across the entire operation including fields, pastures, and similar remote areas
Wi-Fi is accessible throughout the main operation buildings and immediate surrounding area
I can access the internet via a cellular/mobile network only
Other
28

Satisfaction in the Agriculture Sector
Competition provides communities with choices for service, allowing them the ability to switch providers if their current service does not meet their needs. This chart shows the percent of agricultural producers who state that their internet service meets or does not meet their needs.
0% 20% 40% 60% 80% 100%
Tuscola County, Michigan
All Communities
Yes No
29

Reasons for Dissatisfaction
This chart shows the various reasons why local agricultural producers report being dissatisfied with their current internet service.
0% 20% 40% 60% 80% 100%
Other
Customer service is poor
Data cap limitations
The price is too high
My connection is unreliable
Speeds are too slow
All Communities Tuscola County, Michigan
30
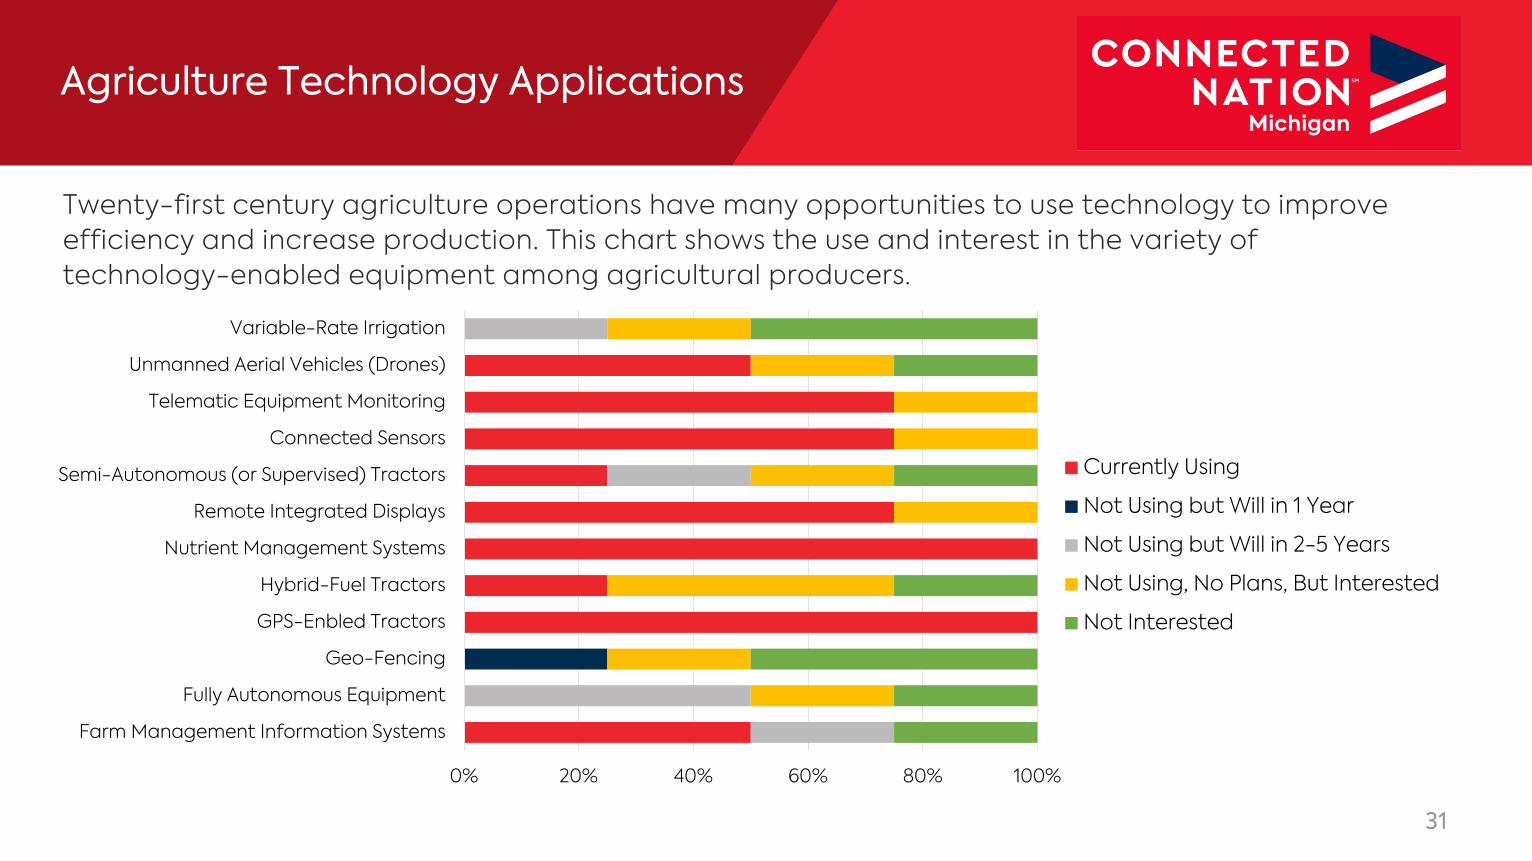
Agriculture Technology Applications
Twenty-first century agriculture operations have many opportunities to use technology to improve efficiency and increase production. This chart shows the use and interest in the variety of technology-enabled equipment among agricultural producers.
31
0% 20% 40% 60% 80% 100%
Farm Management Information Systems
Fully Autonomous Equipment
Geo-Fencing
GPS-Enbled Tractors
Hybrid-Fuel Tractors
Nutrient Management Systems
Remote Integrated Displays
Semi-Autonomous (or Supervised) Tractors
Connected Sensors
Telematic Equipment Monitoring
Unmanned Aerial Vehicles (Drones)
Variable-Rate Irrigation
Currently Using
Not Using but Will in 1 Year
Not Using but Will in 2-5 Years
Not Using, No Plans, But Interested
Not Interested

TUSCOLA COUNTY, MICHIGANBusiness Survey Results

33
Positive economic activity in a community depends on the success of its private-sector business establishments to develop new and innovative products, provide services, attract investment, and create jobs. Small business establishment, growth, entrepreneurship, and innovation are hallmarks of the American economic system, and internet connectivity — coupled with new technology, devices, and applications — is perpetuating these ideals in new and exciting ways. The data below show the connectivity and use of technology among businesses in the community compared to those in other communities participating in Connected Nation’s Connected program. These data should be used to make informed decisions and implement solutions for improving connectivity in the community. This information was gathered through surveys distributed in the community.
Business Survey Results
Data from Tuscola County represent survey responses collected between February 2021 and April 2021. During this time, 24 Tuscola County businesses responded to the survey. Data from all Connected communities represent survey responses collected between January 1, 2017, and April 30, 2021. As more communities participate in the Connected program, these figures are likely to change.
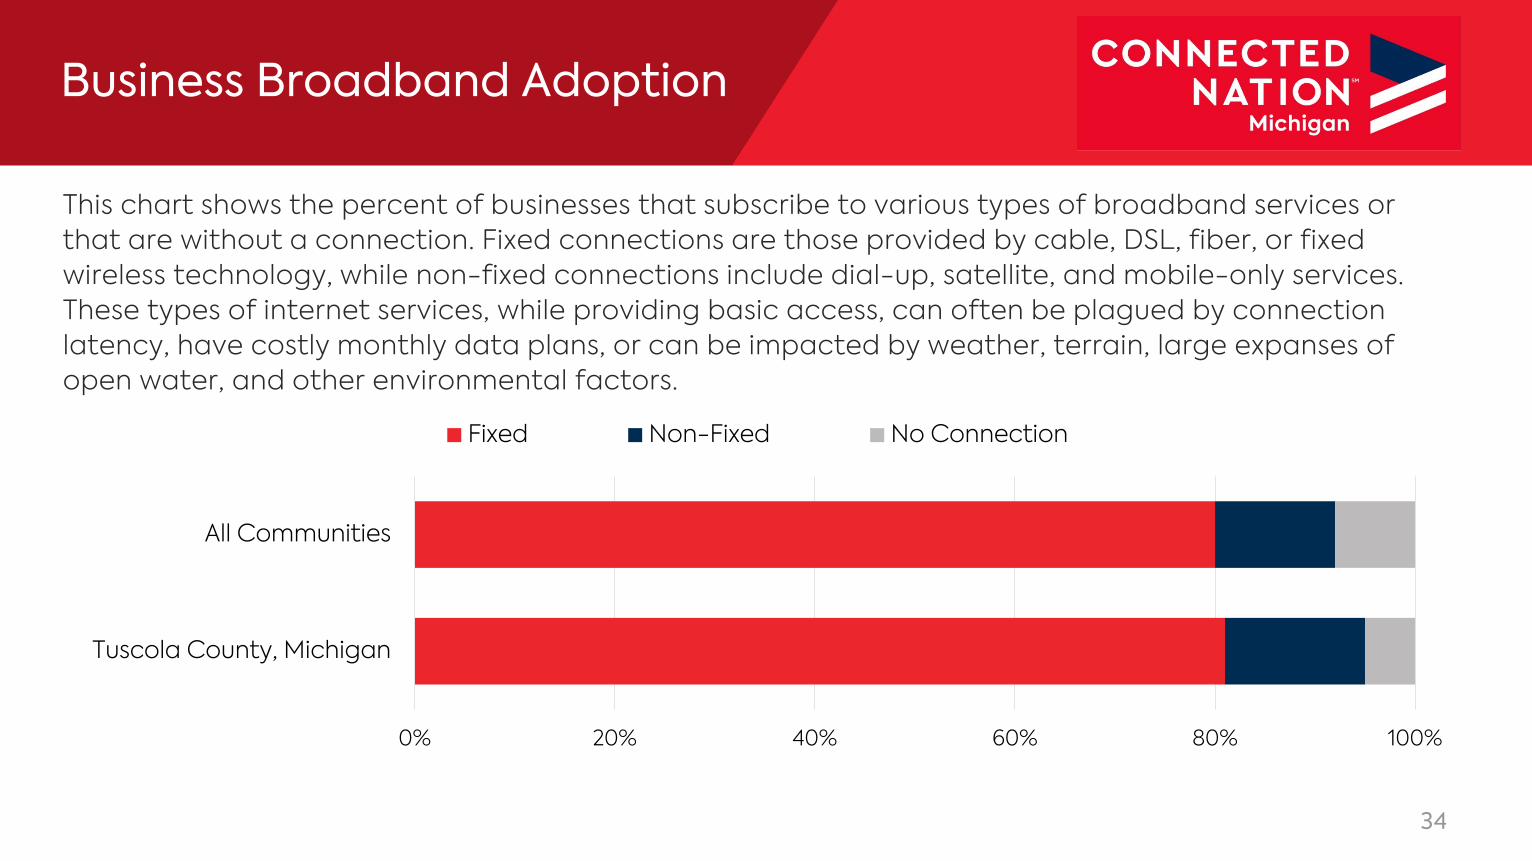
Business Broadband Adoption
This chart shows the percent of businesses that subscribe to various types of broadband services or that are without a connection. Fixed connections are those provided by cable, DSL, fiber, or fixed wireless technology, while non-fixed connections include dial-up, satellite, and mobile-only services. These types of internet services, while providing basic access, can often be plagued by connection latency, have costly monthly data plans, or can be impacted by weather, terrain, large expanses of open water, and other environmental factors.
0% 20% 40% 60% 80% 100%
Tuscola County, Michigan
All Communities
Fixed Non-Fixed No Connection
34

Barriers to Business Broadband Adoption
This chart shows the primary reason businesses do not or cannot subscribe to broadband. The chart compares businesses in the community to those across other participating communities.
0% 20% 40% 60% 80% 100%
Tuscola County, Michigan
All Communities
Don't need it No computers Too expensive
Not available Too complicated Security risks
The internet is a distraction to staff Employees are not trained Other
35

Connection speeds can have a major impact on how the internet is used. This chart shows the average reported download speed among businesses with a connection in the community compared to those in other Connected communities.
0 10 20 30 40 50
Tuscola County, Michigan
All Communities
Business Download Speeds
Speed (Mbps)
36
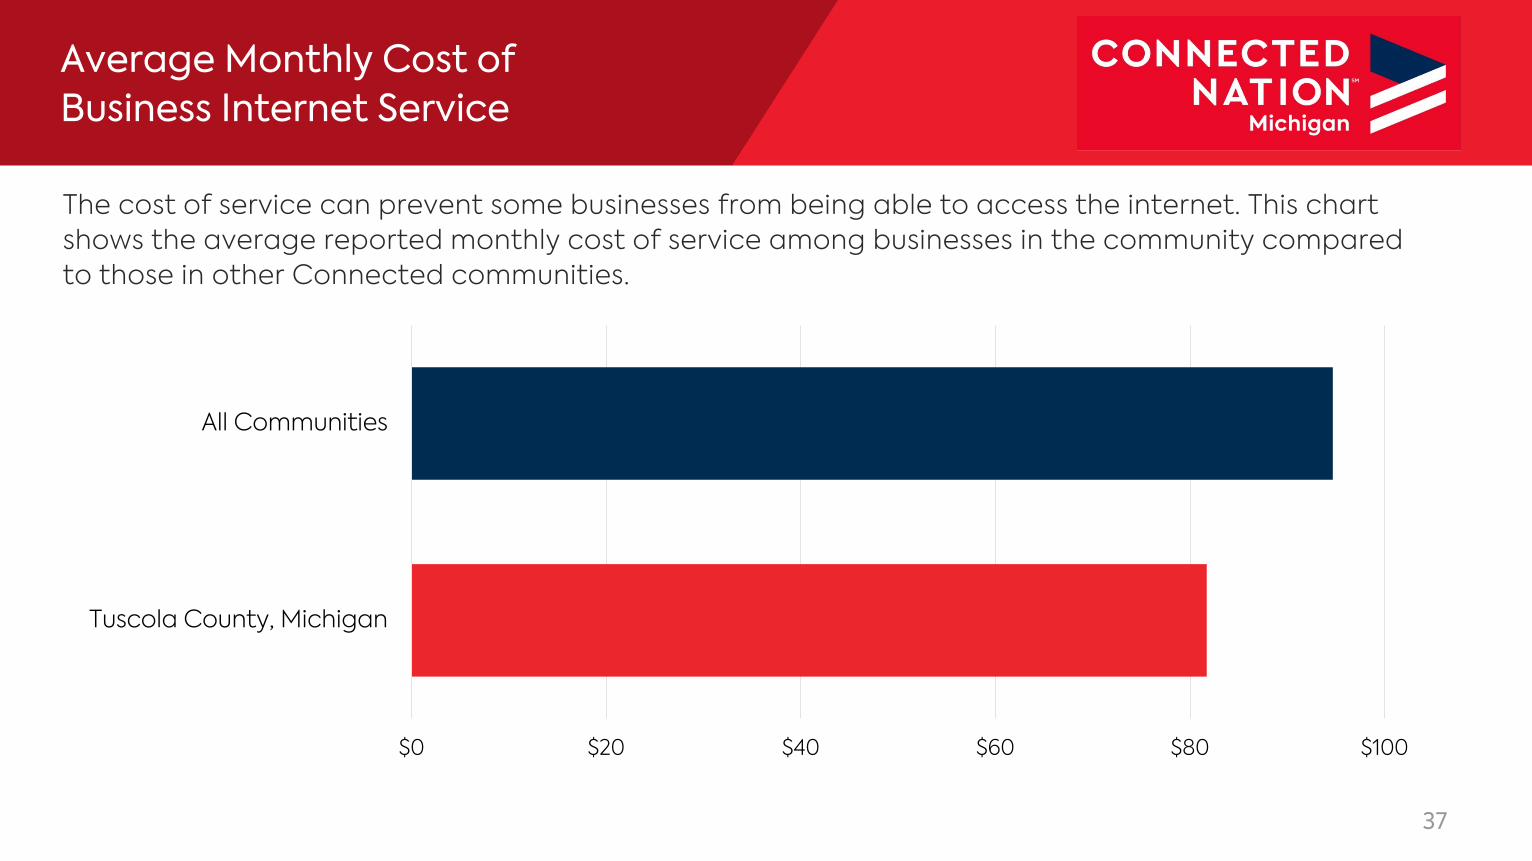
Average Monthly Cost ofBusiness Internet Service
The cost of service can prevent some businesses from being able to access the internet. This chart shows the average reported monthly cost of service among businesses in the community compared to those in other Connected communities.
$0 $20 $40 $60 $80 $100
Tuscola County, Michigan
All Communities
37

Satisfaction Among Businesses
Competition provides businesses with choices for service, allowing them the ability to switch providers if their current service does not meet their needs. This chart shows the percent of businesses who state that their internet service meets or does not meet their needs.
0% 20% 40% 60% 80% 100%
Tuscola County, Michigan
All Communities
Yes No
38

Reasons for Dissatisfaction
This chart shows the various reasons why local businesses report being dissatisfied with their current internet service.
0% 20% 40% 60% 80% 100%
Data cap limitations
Customer service is poor
The price is too high
The connection is unreliable
Speeds are too slow
All Communities Tuscola County, Michigan
39

Businesses Offering Public Wi-Fi
Public Wi-Fi can help create a better-connected community by providing additional access points for those with devices limited by mobile data plans or those without mobile broadband capability.
0% 20% 40% 60% 80% 100%
Tuscola County, Michigan
All Communities
Yes No
40

Businesses with Websites
A website is one of the most basic ways through which a business establishes an online presence. A website provides a “virtual face” for a business. This chart shows the percent of businesses in the community with a website.
0% 20% 40% 60% 80% 100%
Tuscola County, Michigan
All Communities
Yes No
41

Digital Communications
Technology, coupled with an internet connection, provides a myriad of ways to digitally interact with the world or even those in one’s own community. This chart shows the average frequency with which businesses use various digital communications tools.
42
0% 10% 20% 30% 40% 50% 60% 70% 80% 90% 100%
Text
Video Social Media
Videoconferencing
Website Updates
YouTube
At least once a day At least once a week At least once a month Less than once a month Never

Digital Communications Continued
0% 20% 40% 60% 80% 100%
Tuscola County, Michigan (Local Businesses)
All Communities (Local Businesses)
Tuscola County, Michigan (Non-Local Businesses)
All Communities (Non-Local Businesses)
How Frequently Residents Interact with Businesses via the Internet
At least once a day At least once a week At least once a month Less than once a month Never
43
The chart below shows the frequency with which residents in the community report that they digitally interact with local and non-local businesses (i.e., those within 50 miles of the community and those farther than 50 miles, respectively). Examining the digital interaction of residents and the digital communications tools used by local businesses can help identify ways to increase the online presence of businesses in the community.

Employer Technology Needs
0% 20% 40% 60% 80% 100%
Tuscola County, Michigan
All Communities
Non-Users Basic Users Moderate Users Advanced Users
44
The technology-related skills necessary to be successful on the job are changing to keep pace with new innovations, tools, and applications that make production and services more efficient. The skills of the workforce should match the needed skills of the employer for establishments to take advantage of new technologies. This chart shows the mix of employee technology skills (as indicated by employers).

Employee Technology Skills
0% 20% 40% 60% 80% 100%
Tuscola County, Michigan
All Communities
Poorly/Fairly Well Well Very Well/Excellently
45
This chart shows how well employers believe that the current technology skills of their workers match the technology needs faced by their organization.
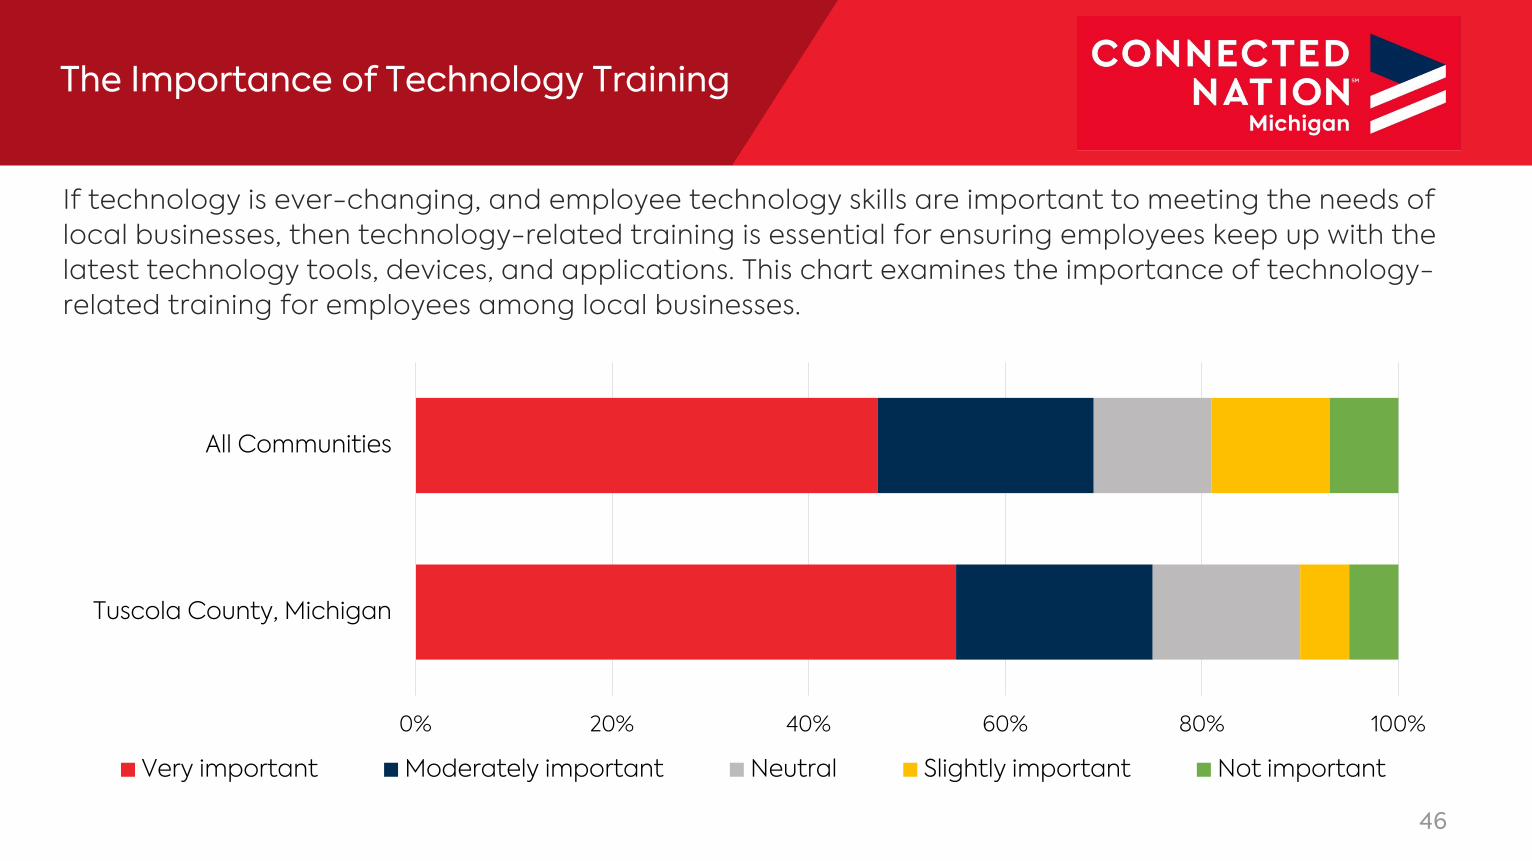
The Importance of Technology Training
0% 20% 40% 60% 80% 100%
Tuscola County, Michigan
All Communities
Very important Moderately important Neutral Slightly important Not important
46
If technology is ever-changing, and employee technology skills are important to meeting the needs of local businesses, then technology-related training is essential for ensuring employees keep up with the latest technology tools, devices, and applications. This chart examines the importance of technology-related training for employees among local businesses.

Continuing Education Policy
0% 20% 40% 60% 80% 100%
Tuscola County, Michigan
All Communities
Required to pursue
Encouraged but not required to pursue
Neither encouraged nor required to pursue
47
Growing the technology skills of the workforce is critical to ensure employers have the talent they need to expand and sustain their operations. This chart shows the overall technology-related continuing education policies of local businesses. Businesses were asked to indicate if they require, encourage but don't require, or neither encourage nor require employees to participate in continuing education or training activities.

Employers were asked about the policies they have in place to support continuing education among their employees, including time off work, financial support, on-site training by outside experts, and on-the-job training. Employers could also indicate if they did not support employee continuing education in any way. This chart shows the percent of employers in the community that indicate they have each of the four policies in place. 0% 20% 40% 60% 80% 100%
Provides financial support foreducation/training
Provides time off work for employeeeducation/training
Regularly offers training on-site
Offers on-the-job training
The business does not supportcontinuing education
All Communities Tuscola County, Michigan
Continuing Education Support
48

Computer and Internet Use at Work
Technology on the job is ever-changing as more internet-enabled devices and applications are developed to improve production and efficiency. The charts show the percent of residents in the community that use 1) a computer at work, and 2) use the internet for work, compared to residents of other Connected communities.
0% 20% 40% 60% 80% 100%
Use a Computer for Work
Use the Internet for Work
All Communities Tuscola County, Michigan
49

Teleworking
50
Teleworking, or telecommuting, refers to working outside of the conventional workplace by way of telecommunications or computer-based technology. Further, telework is a form of organizing and/or performing work, where work, which could be performed at the employer’s premises, is carried out away from those premises. Teleworking is a spatially flexible work style that typically also involves greater flexibility in one’s daily routine. Teleworkers typically have higher incomes and higher rates of advanced degree attainment. While traditional teleworkers are often thought of as those in management occupations or professional service industries, recently, technology has enabled new opportunities for teleworkers across the occupational and industry sector spectrum. Teleworkers often do not register on typical measures of economic or workforce activity. Economic development strategies traditionally involve the attraction or retention of employers. While this is a critical part of growing a local economy, telework represents an opportunity to attract or retain employees even though their employer may not be located within the community, but only if those employees have access to advanced broadband infrastructure.
The following charts show the percent of residents in the community who telework and from where they typically work, compared to residents of other Connected communities. The charts also show how frequently residents of the community telework.

Teleworking Rates
0% 20% 40% 60% 80% 100%
Tuscola County, Michigan
All Communities
Yes No I own or operate a business from home Other
51
This chart shows how many employed survey respondents telework, compared to other Connected communities.

Teleworking Frequency
This chart shows how often teleworkers or telecommuters work from home instead of traveling to a central location for work. More teleworking days translates into fewer hours on the road, more time saved, and fewer greenhouse gasses released into the atmosphere.
0% 20% 40% 60% 80% 100%
Tuscola County, Michigan
All Communities
How Frequently Teleworkers Typically Work From Home
Every day Several days per week
Once per week Several days per month, but less than once per week
Once per month Less than once per month
52

TUSCOLA COUNTY, MICHIGANGovernment Survey Results

54
Communities, residents and businesses are served by several political subdivisions. These overlapping jurisdictions, all with varying responsibilities, include municipalities such as cities, villages, and townships, boroughs, counties, regional development groups, utility districts, local expressions of state and federal agencies, and many others. Internet connectivity and related broadband-enabled applications allow these political subdivisions to take advantage of new and innovative ways to deliver existing or additional services to the public.
E-government services allow citizens to conduct business and communicate with their local units of government and political subdivisions more efficiently and conveniently, allowing for greater civic participation and efficient use of public resources. These data show the connectivity and use of technology among political subdivisions in the community compared to those in other communities participating in Connected Nation’s Connected program. These data should be used to make informed decisions and implement solutions for improving connectivity in the community.
Government Sector Survey Results
Data from Tuscola County represent survey responses collected between February 2021 and April 2021. During this time, six Tuscola County government agencies responded to the survey. Data from all Connected communities represent survey responses collected between January 1, 2017, and April 30, 2021. As more communities participate in the Connected program, these figures are likely to change.

Broadband Adoptionin the Government Sector
This chart shows the percent of political subdivisions that subscribe to various types of broadband services or that are without a connection. Fixed connections are those provided by cable, DSL, fiber, or fixed wireless technology, while non-fixed connections include dial-up, satellite, and mobile-only services. These types of internet services, while providing basic access, can often be plagued by connection latency, have costly monthly data plans, or can be impacted by weather, terrain, large expanses of open water, and other environmental factors.
0% 20% 40% 60% 80% 100%
Tuscola County, Michigan
All Communities
Fixed Non-Fixed No Connection
55

Connection speeds can have a major impact on how the internet is used. This chart shows the average reported download speed among political subdivisions in the community compared to those in other Connected communities.
0 10 20 30 40 50 60 70
Tuscola County, Michigan
All Communities
Government Sector Download Speeds
Speed (Mbps)
56

Digital Communications
Digital communications tools are critical for political subdivisions to communicate with the public and encourage public participation in all matters of community development. This chart shows the average frequency with which political subdivisions use various digital communications tools.
57
0% 20% 40% 60% 80% 100%
Text
Video Social Media
Videoconferencing
Website Updates
YouTube
At least once a day At least once a week At least once a month Less than once a month Never

Digital Interaction
This chart shows the frequency with which residents in the community report that they digitally interact with their local government offices. Examining the digital interaction of residents and the digital communications tools used by government agencies can help identify ways to increase the online presence of the government sector.
58
0% 20% 40% 60% 80% 100%
Tuscola County, Michigan
All Communities
At least once a day At least once a week At least once a month Less than once a month Never

Public Wi-Fi
Public Wi-Fi can help create a better-connected community by providing additional access points for those with devices limited by mobile data plans or those without mobile broadband capability. This chart shows the percent of political subdivisions that offer free Wi-Fi to the public.
0% 20% 40% 60% 80% 100%
Tuscola County, Michigan
All Communities
Yes No
59

Presence of a Website
The website of a political subdivision may be the first point of contact a resident or business may have with local government when an issue arises or information is required. This chart shows the percent of political subdivisions with a website in the community compared to those in other Connected communities.
0% 20% 40% 60% 80% 100%
Tuscola County, Michigan
All Communities
Yes No
60
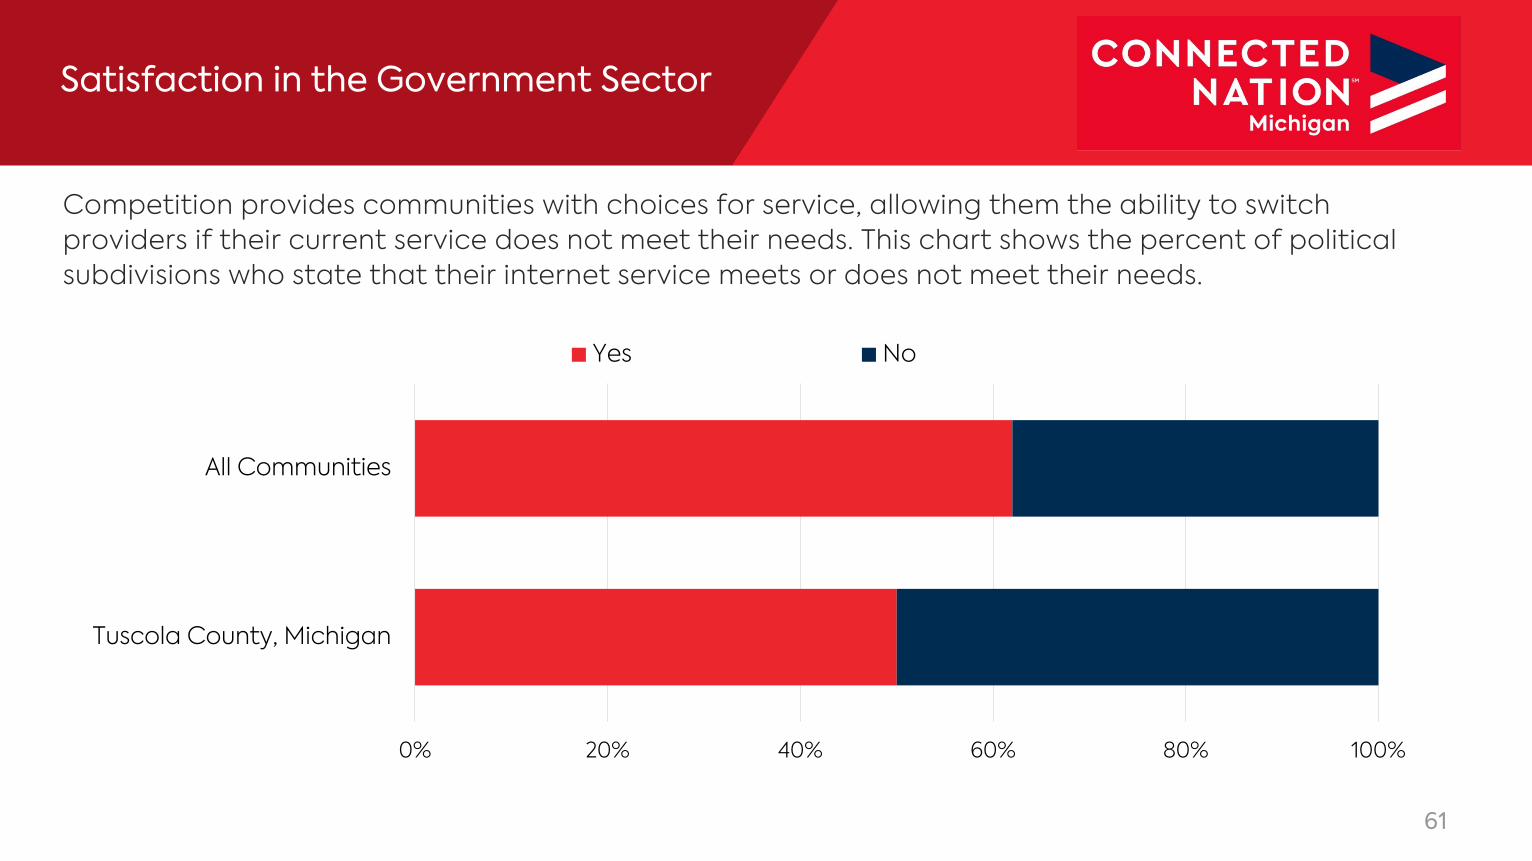
Satisfaction in the Government Sector
Competition provides communities with choices for service, allowing them the ability to switch providers if their current service does not meet their needs. This chart shows the percent of political subdivisions who state that their internet service meets or does not meet their needs.
0% 20% 40% 60% 80% 100%
Tuscola County, Michigan
All Communities
Yes No
61

Reasons for Dissatisfaction
This chart shows the various reasons why government subdivisions report being dissatisfied with their current internet service.
0% 20% 40% 60% 80% 100%
Data cap limitations
Customer service is poor
The price is too high
The connection is unreliable
Speeds are too slow
All Communities Tuscola County, Michigan
62

Government SectorTechnology Applications
Beyond a website and the many forms of digital communications, there are more advanced ways in which a political subdivision can leverage technology to improve civic participation. This chart shows the use and interest in various technologies among local political subdivisions.
63
0% 20% 40% 60% 80% 100%
Government-Issued Mobile Devices for 50+% of Staff
Email Service for 100% of Staff
VoIP Phone Service
Cloud-Based Services
3-1-1 Systems
Streaming Public Meetings
GIS or Interactive Maps
Digital Tools for Community Engagement
Currently Using
Not Using but Will in 1 Year
Not Using but Will in 2-5 Years
Not Using, No Plans, But Interested
Not Interested

TUSCOLA COUNTY, MICHIGANHealth Care Survey Results

65
Access to quality health care is essential for quality of life in any community. From access to emergency services and family practitioners, to specialists, laboratories, and mental health services, access to health care provides opportunities for all to live healthy, fulfilling lives. New health care technology developments offer not only new treatments and methods of diagnosis, but also greater access to health care providers via the internet. This is especially critical for two primary groups: 1) those living in rural communities that may not have a local presence for various specialty health care providers, and 2) those unable to physically visit a doctor’s office due to medical conditions or other issues.
The data in the following charts show the connectivity and use of technology among health care facilities in the community compared to those in other communities participating in Connected Nation’s Connected program. These data should be used to make informed decisions and implement solutions for improving connectivity in the community.
Health Care Sector Survey Results
Data from Tuscola County represent survey responses collected between February 2021 and April 2021. During this time, two Tuscola Tuscola County health care facilities answered this survey. Data from all Connected communities represent survey responses collected between January 1, 2017, and April 30, 2021. As more communities participate in the Connected program, these figures are likely to change.

Digital Communications
Digital communications tools are critical for health care facilities to communicate with the public. This chart shows the average frequency with which local health care facilities use these digital communications tools.
66
0% 20% 40% 60% 80% 100%
Text
Video Social Media
Videoconferencing
Website Updates
YouTube
At least once a day At least once a week At least once a month Less than once a month Never

Digital Interaction
This chart shows the frequency with which residents in the community report that they digitally interact with facilities in the health care sector. Examining the digital interaction of residents and the digital communications tools used by health care facilities can help identify ways to increase the online presence of the health care sector.
67
0% 20% 40% 60% 80% 100%
Tuscola County, Michigan
All Communities
At least once a day At least once a week At least once a month Less than once a month Never

Connection speeds can have a major impact on how the internet is used. This chart shows the average reported download speed among health care facilities with a connection in the community compared to those in other Connected communities.
0 20 40 60 80 100
Tuscola County, Michigan
All Communities
Health Care Sector Download Speeds
Speed (Mbps)
68

Public Wi-Fi
Public Wi-Fi can help create a better-connected community by providing additional access points for those with devices limited by mobile data plans or those without mobile broadband capability. This chart shows the percent of health care facilities in the community that offer free public Wi-Fi access at their location compared to those in other participating communities.
0% 20% 40% 60% 80% 100%
Tuscola County, Michigan
All Communities
Yes No
69

Presence of a Website
The website of a health care facility may be the first point of contact a patient has when an issue arises or information is required. The websites of these facilities, therefore, should provide relevant information in an easily accessible and flexible digital environment. This chart shows the percent of health care facilities in the community with a website.
0% 20% 40% 60% 80% 100%
Tuscola County, Michigan
All Communities
Yes No
70

Service Satisfaction
Competition provides communities with choices for service, allowing them the ability to switch providers if their current service does not meet their needs. This chart shows the percent of health care facilities who state that their internet service meets or does not meet their needs.
0% 20% 40% 60% 80% 100%
Tuscola County, Michigan
All Communities
Yes No
71

Reasons for Dissatisfaction
This chart shows the various reasons why health care facilities report being dissatisfied with their current internet service.
0% 20% 40% 60% 80% 100%
Data cap limitations
Customer service is poor
The price is too high
The connection is unreliable
Speeds are too slow
All Communities Tuscola County, Michigan
72

TUSCOLA COUNTY, MICHIGANHigher Education Survey Results

74
Post-secondary education contributes significantly to the talent and workforce development of a community. While the structure of K-12 education is relatively similar from one community to the next, higher education can take many forms. From community colleges and traditional universities to trade schools, higher education offers a variety of educational programs and content to meet the needs of the community. Higher education can also be an attractor for the community, drawing students and faculty from abroad. Similar to K-12 institutions, higher education has many opportunities to leverage internet-enabled technologies to facilitate a more robust learning environment.
These data show the connectivity and use of technology among higher education institutions in the community compared to those in other communities participating in Connected Nation’s Connected program. These data should be used to make informed decisions and implement solutions for improving connectivity in the community. This information was gathered through surveys distributed in the community.
Higher Education Survey Results
Data from Tuscola County represent survey responses collected between February 2021 and April 2021. During this time, one Tuscola County institute of higher education responded to this survey. Data from all Connected communities represent survey responses collected between January 1, 2017, and April 30, 2021. As more communities participate in the Connected program, these figures are likely to change.

Wireless connectivity allows for a wide range of devices to be connected to the institution’s network. While Wi-Fi is important in public and common areas, it is also important for Wi-Fi signals to penetrate into classrooms throughout campus. This chart shows the average percent of higher education classrooms in the community with Wi-Fi connectivity available compared to average percent of classrooms connected among institutions in other Connected communities.
Classrooms with Wi-Fi Service
75
0% 20% 40% 60% 80% 100%
Tuscola County, Michigan
All Communities

Digital Communications
This chart shows the frequency with which higher education institutions in the community use various digital tools to communicate with the public.
76
0% 10% 20% 30% 40% 50% 60% 70% 80% 90% 100%
Text
Video Social Media
Videoconferencing
Website Updates
YouTube
At least once a day At least once a week At least once a month Less than once a month Never

Digital Interactions
77
This chart shows the frequency with which residents in the community report that they digitally interact with higher education institutions. Examining the digital interaction of residents and the digital communications tools used by higher education institutions can help identify ways to increase the online presence of these institutions.
0% 20% 40% 60% 80% 100%
Tuscola County, Michigan
All Communities
At least once a day At least once a week At least once a month Less than once a month Never
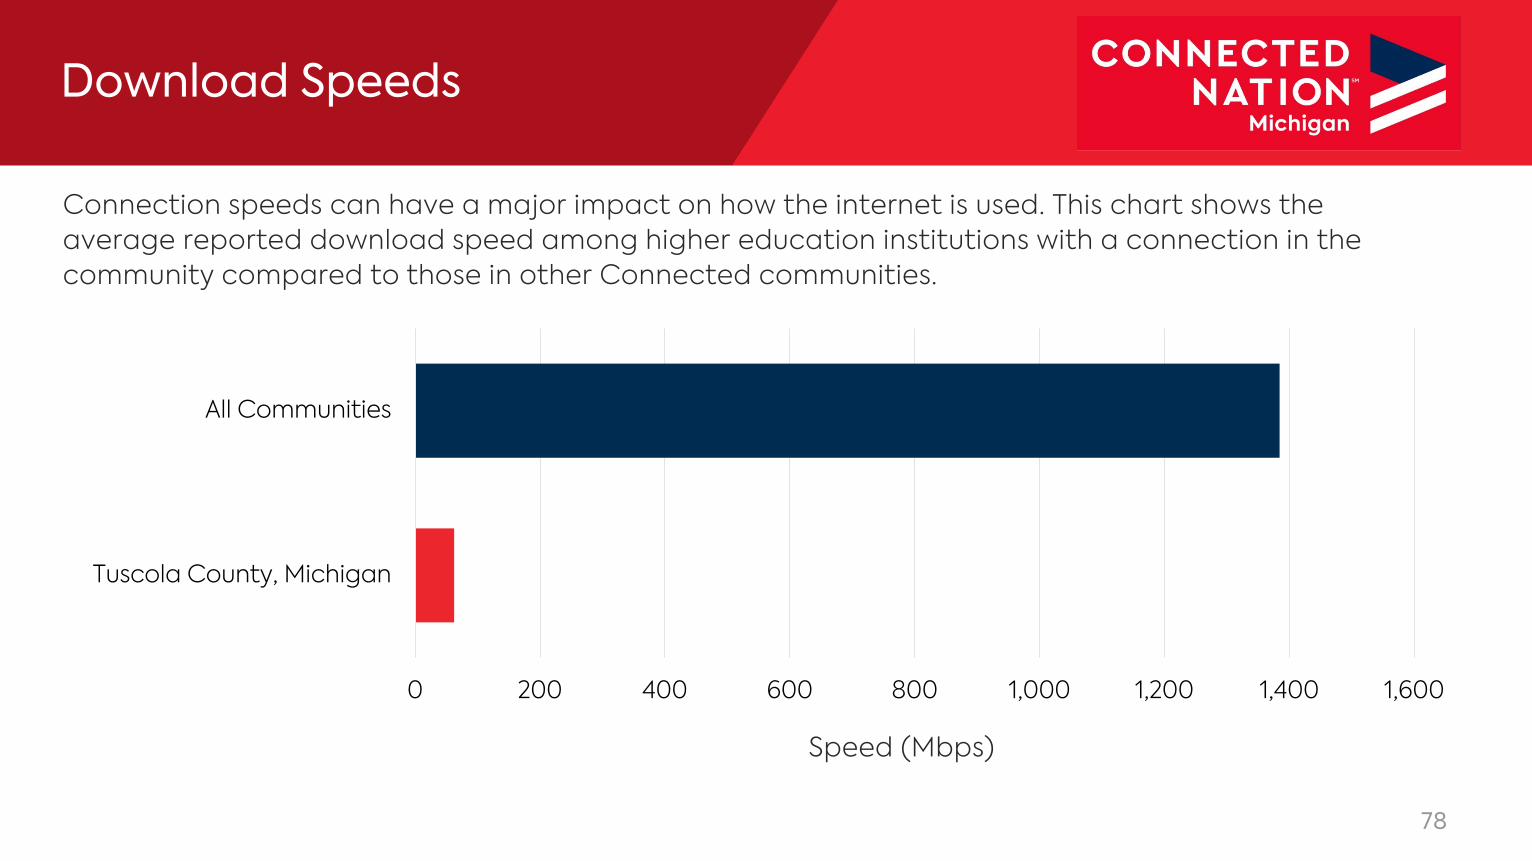
Connection speeds can have a major impact on how the internet is used. This chart shows the average reported download speed among higher education institutions with a connection in the community compared to those in other Connected communities.
0 200 400 600 800 1,000 1,200 1,400 1,600
Tuscola County, Michigan
All Communities
Download Speeds
Speed (Mbps)
78

Online Courses and Degrees
79
While the traditional higher education environment has stood the test of time as a format conducive to improving the knowledge, talent, and skills of students, a fluctuating global economy rooted in the production and transmission of information built on the backbone of the internet requires more and flexible options for students to expand their skillsets. Occupations in the technology field, including even those outside the field that rely heavily on the use of technology, often require new and updated skills. To gain these skills, the workforce needs access to educational opportunities and credentialing that may not be available in their community. Online degrees and online educational programs offer this flexibility to local students and those from around the globe.
Another method of delivering curriculum in an online environment is through the development of massive open online courses (MOOCs). A MOOC is a course of study made available over the internet without charge to a very large number of people. MOOCs have gained popularity in higher education to provide educational content to a global audience.

Online Degrees
0% 20% 40% 60% 80% 100%
Tuscola County, Michigan
All Communities
Yes No Unsure
80
This chart shows the percent of higher education institutions offering degrees that students can complete entirely online.

Massive Open Online Courses (MOOCs)
0% 20% 40% 60% 80% 100%
Tuscola County, Michigan
All Communities
Yes No Unsure
81
This chart shows the percent of higher education institutions offering massive open online courses (MOOCs). A MOOC is a course of study made available over the internet without charge to a very large number of people.

Public Wi-Fi
Public Wi-Fi can help create a better-connected community by providing additional access points for those with devices limited by mobile data plans or those without mobile broadband capability. This chart shows the percent of higher education institutions in the community that offer free public Wi-Fi access at their location compared to those in other participating communities.
0% 20% 40% 60% 80% 100%
Tuscola County, Michigan
All Communities
Yes No Unsure
82

Satisfaction AmongHigher Education Institutions
Competition provides communities with choices for service, allowing them the ability to switch providers if their current service does not meet their needs. This chart shows the percent of higher education institutions who state that their internet service meets or does not meet their needs.
0% 20% 40% 60% 80% 100%
Tuscola County, Michigan
All Communities
Yes No
83

Reasons for Dissatisfaction
This chart shows the various reasons why local institutions of higher education report being dissatisfied with their current internet service.
0% 20% 40% 60% 80% 100%
Other
Data cap limitations
Customer service is poor
The price is too high
The connection is unreliable
Speeds are too slow
All Communities Tuscola County, Michigan
84

TUSCOLA COUNTY, MICHIGANK-12 Survey Results

86
K-12 institutions are the cornerstone of a community’s educational system. K-12 education provides students with the knowledge and opportunity to become productive members of the next generation workforce. Schools, along with libraries, have traditionally been early technology adopters, focused on the ways in which internet-enabled devices and applications can enhance the learning environment and provide students with opportunities beyond the classroom.
The following data show the connectivity and use of technology among K-12 schools in the community compared to those in other communities participating in Connected Nation’s Connected program. These data should be used to make informed decisions and implement solutions for improving connectivity in the community.
K-12 School Survey Results
Data from Tuscola County represent survey responses collected between February 2021 and April 2021. During this time, 23 Tuscola County K-12 facilities responded to the survey. Data from all Connected communities represent survey responses collected between January 1, 2017, and April 30, 2021. As more communities participate in the Connected program, these figures are likely to change.

Wireless connectivity allows for a wide range of devices to be connected to the institution’s network. While Wi-Fi is important in public and common areas, it is also important for Wi-Fi signals to penetrate classrooms throughout the school. This chart shows the average percent of K-12 classrooms in the community with Wi-Fi available compared to the average percent of classrooms connected among schools in other Connected communities.
Classrooms with Wi-Fi Service
87
0% 20% 40% 60% 80% 100%
Tuscola County, Michigan
All Communities

Digital Communications
This chart shows the frequency with which K-12 schools in the community use various digital tools to communicate with the public.
88
0% 10% 20% 30% 40% 50% 60% 70% 80% 90% 100%
Text
Video Social Media
Videoconferencing
Website Updates
YouTube
At least once a day At least once a week At least once a month Less than once a month Never

Digital Interactions
89
This chart shows the frequency with which residents in the community report that they digitally interact with K-12 institutions. Examining the digital interaction of residents and the digital communications tools used by higher education institutions can help identify ways to increase the online presence of these institutions.
0% 20% 40% 60% 80% 100%
Tuscola County, Michigan
All Communities
At least once a day At least once a week At least once a month Less than once a month Never

Connection speeds can have a major impact on how the internet is used. This chart shows the average reported download speed among K-12 institutions with a connection in the community compared to those in other Connected communities.
0 500 1,000 1,500 2,000 2,500
Tuscola County, Michigan
All Communities
Download Speeds
Speed (Mbps)
90

E-Rate Participation
0% 20% 40% 60% 80% 100%
Tuscola County, Michigan
All Communities
Yes No Unsure
91
The Schools and Libraries Program, also known as E-Rate, makes telecommunications and information services more affordable for schools and libraries by providing discounts on service and funding for equipment and construction of internet connections. This chart shows the status of E-Rate participation for schools in the community compared to schools in other Connected communities. Federal funding is left on the table if schools do not participate in the program.

One way to digitally engage parents and students is through an online portal where participants can access individualized information regarding school performance, homework, activities, financial accounts, and much more. The K-12 survey asked community schools if they had 1) an online portal for students to access homework, content, etc., and 2) an online portal for parents to access grades, pay bills, register for activities, etc. This chart shows the percentage of schools that report having these two types of portals.
Online Portals
92
0% 20% 40% 60% 80% 100%
Parent Dashboard
Student Dashboard
Tuscola County, Michigan All Communities

Public Wi-Fi
Public Wi-Fi can help create a better-connected community by providing additional access points for those with devices limited by mobile data plans or those without mobile broadband capability. This chart shows the percent of K-12 facilities in the community that offer free public Wi-Fi access compared to those in other participating communities.
0% 20% 40% 60% 80% 100%
Tuscola County, Michigan
All Communities
Yes No Unsure
93

Satisfaction AmongK-12 Schools
Competition provides communities with choices for service, allowing them the ability to switch providers if their current service does not meet their needs. This chart shows the percent of K-12 institutions who state that their internet service meets or does not meet their needs.
0% 20% 40% 60% 80% 100%
Tuscola County, Michigan
All Communities
Yes No
94

Reasons for Dissatisfaction
This chart shows the various reasons why local K-12 schools report being dissatisfied with their current internet service.
0% 20% 40% 60% 80% 100%
Other
Data cap limitations
Customer service is poor
The price is too high
The connection is unreliable
Speeds are too slow
All Communities Tuscola County, Michigan
95

Student Devices
96
Many schools across the country are putting advanced computing power into the hands of every student. From tablets to laptops, Android to Apple, schools are examining opportunities for leveraging technology to expand opportunities for learning within and outside the classroom. One-to-one device programs allow all students to have equal and individual access to technology, content, and resources; however, in communities without one-to-one device initiatives, technology is often shared in labs or individual classrooms among all students.

1:1 Device Programs
This chart shows the current state of one-to-one device programs across schools in the community compared to schools in other Connected communities.
0% 20% 40% 60% 80% 100%
Tuscola County, Michigan
All Communities
Yes, the school has successfully implemented a 1:1 device program with devices supplied by the school
The school has a bring-your-own-device program; devices are supplied by the students and content is provided by the school
The school is currently piloting a device program with a sample of students and staff
The school has a plan to implement a device initiative
The school is in the exploratory phase of implementing a device initiative
No, we currently have no such program or plans to implement such initiatives
97

This chart examines the overall ratio of devices to students (including those as part of a 1:1 program and those in labs, classrooms, and elsewhere). The device-to-student ratio is calculated by collecting the total number of devices (e.g., laptops, desktops, or tablets) and students from schools responding to the K-12 survey. Data are only representative of institutions that provided a count of both students and devices.
0.0 0.2 0.4 0.6 0.8 1.0 1.2 1.4 1.6
Tuscola County, Michigan
All Communities
Devices per Student
98

Technology and Curriculum Delivery
0% 20% 40% 60% 80% 100%
Tuscola County, Michigan
All Communities
Traditional Web-Facilitated Blended Online
99
Technology enables new forms of educational content delivery. Between traditional classroom instruction and online-only classes lies a spectrum of web- and technology-enabled methods of learning. This chart shows the mix of curricula delivered by K-12 schools in the community.
Traditional courses are those where no online technology is used and content is delivered in writing or orally. Web-facilitated courses use web-based technology to facilitate what is essentially a face-to-face course and may use a course management system or web pages to post the syllabus and assignments. Blended courses combine online and face-to-face delivery with a substantial portion of the content delivered online, using online discussions, and having few face-to-face meetings. Onlinecourses are those where most or all of the content is delivered online and typically have no face-to-face meetings.

TUSCOLA COUNTY, MICHIGANLibrary and Community Organization Survey Results

101
Libraries and other community organizations serve a vital role in providing access to information and technology for the entire community. Libraries often host public computers with internet access for those without a device or connection at home and provide technology training to develop a more digitally literate community.
The following data show the connectivity and use of technology among libraries and community organizations compared to those in other communities participating in Connected Nation’s Connected program. These data should be used to make informed decisions and implement solutions for improving connectivity in the community.
Library and Community Organization Survey Results
The Library Sector includes public and private libraries, as well as other non-governmental organizations that serve the community. Data from Tuscola County represent survey responses collected between February 2021 and April 2021. During this time, seven Tuscola County libraries and community organizations completed the survey. Data from all Connected communities represent survey responses collected between January 1, 2017, and April 30, 2021. As more communities participate in the Connected program, these figures are likely to change.
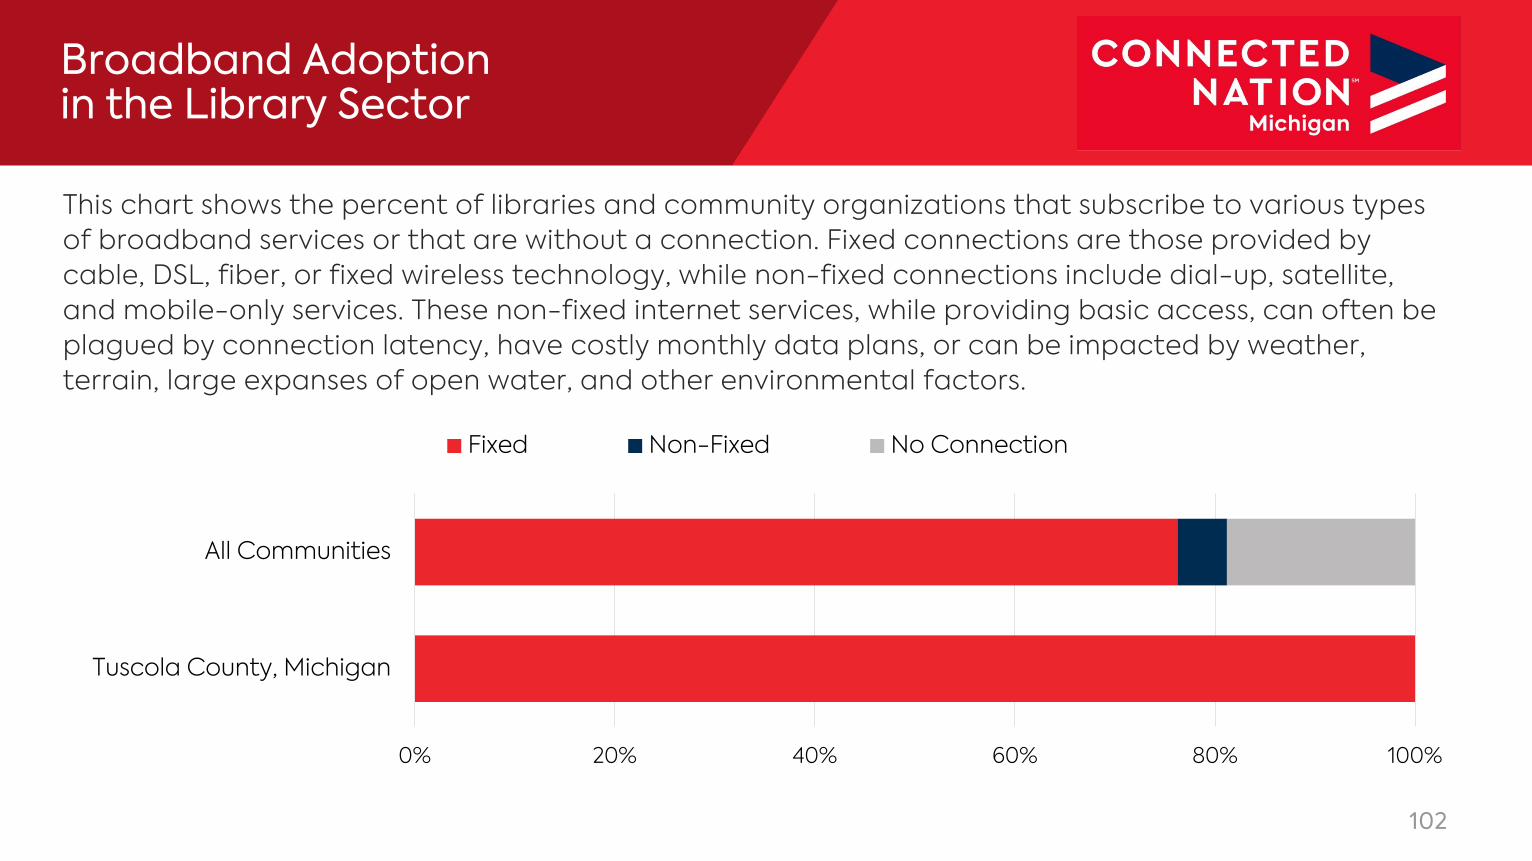
Broadband Adoptionin the Library Sector
This chart shows the percent of libraries and community organizations that subscribe to various types of broadband services or that are without a connection. Fixed connections are those provided by cable, DSL, fiber, or fixed wireless technology, while non-fixed connections include dial-up, satellite, and mobile-only services. These non-fixed internet services, while providing basic access, can often be plagued by connection latency, have costly monthly data plans, or can be impacted by weather, terrain, large expanses of open water, and other environmental factors.
0% 20% 40% 60% 80% 100%
Tuscola County, Michigan
All Communities
Fixed Non-Fixed No Connection
102

Digital Communications
Examining the digital interaction of residents and the digital communications tools used by libraries and organizations can help identify ways to increase the online presence of these critical institutions. This chart provides the frequency with which libraries and organizations in the community use various digital tools to communicate with the public.
103
0% 10% 20% 30% 40% 50% 60% 70% 80% 90% 100%
EmailFacebookInstagram
LinkedInPinterest
TextTwitter
Video Social MediaVideoconferencing
Website UpdatesYouTube
At least once a day At least once a week At least once a month Less than once a month Never

Digital Interaction
This chart shows the frequency with which residents in the community report that they digitally interact with organizations and libraries. Examining the digital interaction of residents and the digital communications tools used by local institutions can help identify ways to increase the online presence of the sector.
104
0% 20% 40% 60% 80% 100%
Tuscola County, Michigan
All Communities
At least once a day At least once a week At least once a month Less than once a month Never

Connection speeds can have a major impact on how the internet is used. This chart shows the average reported download speed among libraries and organizations in the community compared to those in other Connected communities.
0 5 10 15 20 25 30 35 40
Tuscola County, Michigan
All Communities
Library Sector Download Speeds
Speed (Mbps)
105

Presence of a Website
The website of a library or organization may be the first point of contact a resident or business may have when an issue arises or information is required. This chart shows the percent of libraries and organizations with a website in the community compared to those in other Connected communities.
0% 20% 40% 60% 80% 100%
Tuscola County, Michigan
All Communities
Yes No
106
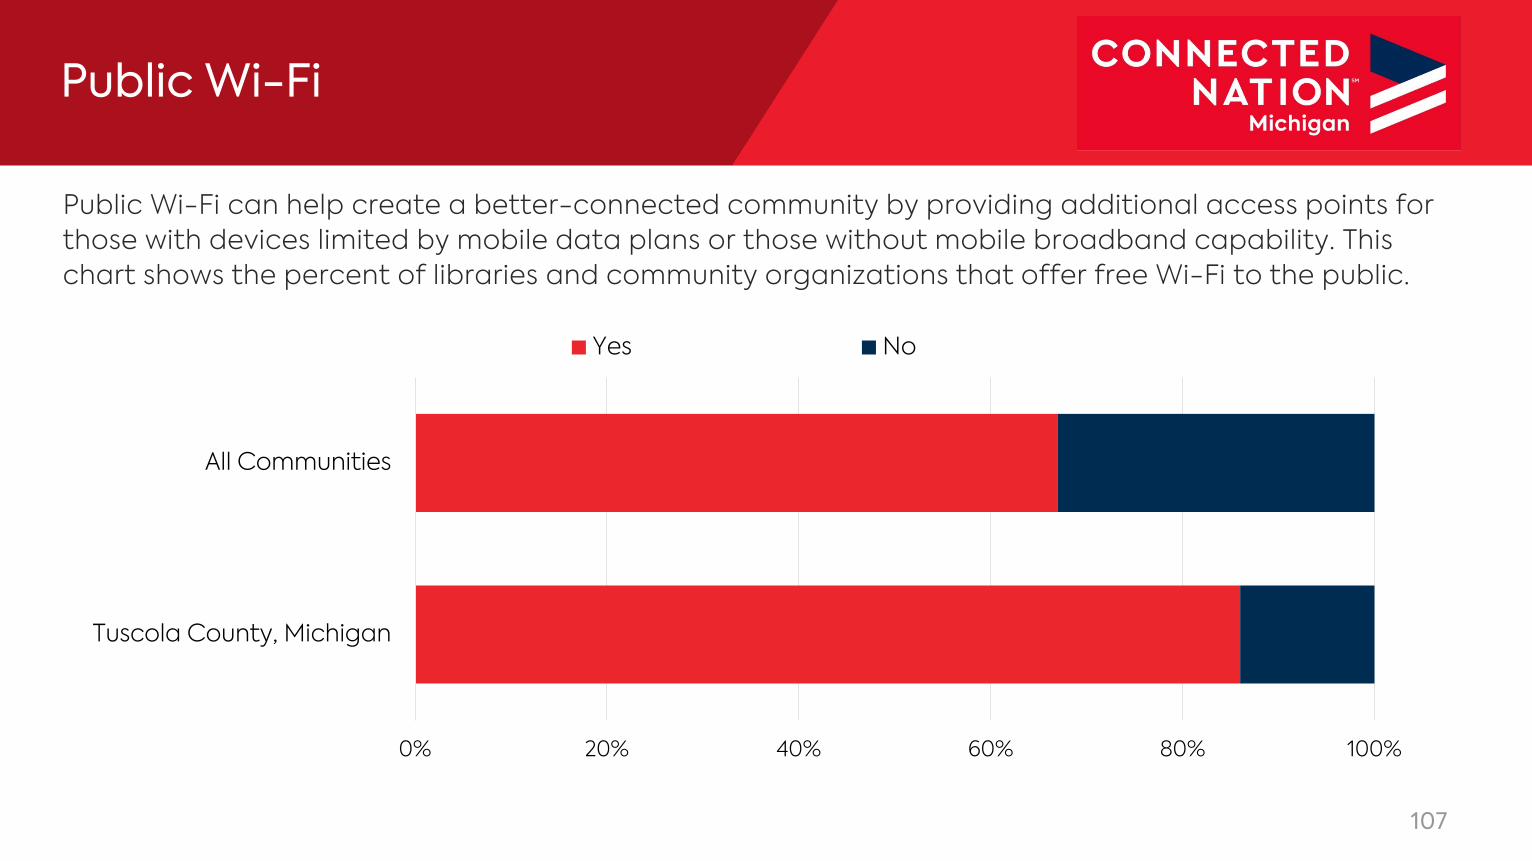
Public Wi-Fi
Public Wi-Fi can help create a better-connected community by providing additional access points for those with devices limited by mobile data plans or those without mobile broadband capability. This chart shows the percent of libraries and community organizations that offer free Wi-Fi to the public.
0% 20% 40% 60% 80% 100%
Tuscola County, Michigan
All Communities
Yes No
107

Satisfaction in the Library Sector
Competition provides communities with choices for service, allowing them the ability to switch providers if their current service does not meet their needs. This chart shows the percent of libraries and community organizations who state that their internet service meets or does not meet their needs.
0% 20% 40% 60% 80% 100%
Tuscola County, Michigan
All Communities
Yes No
108
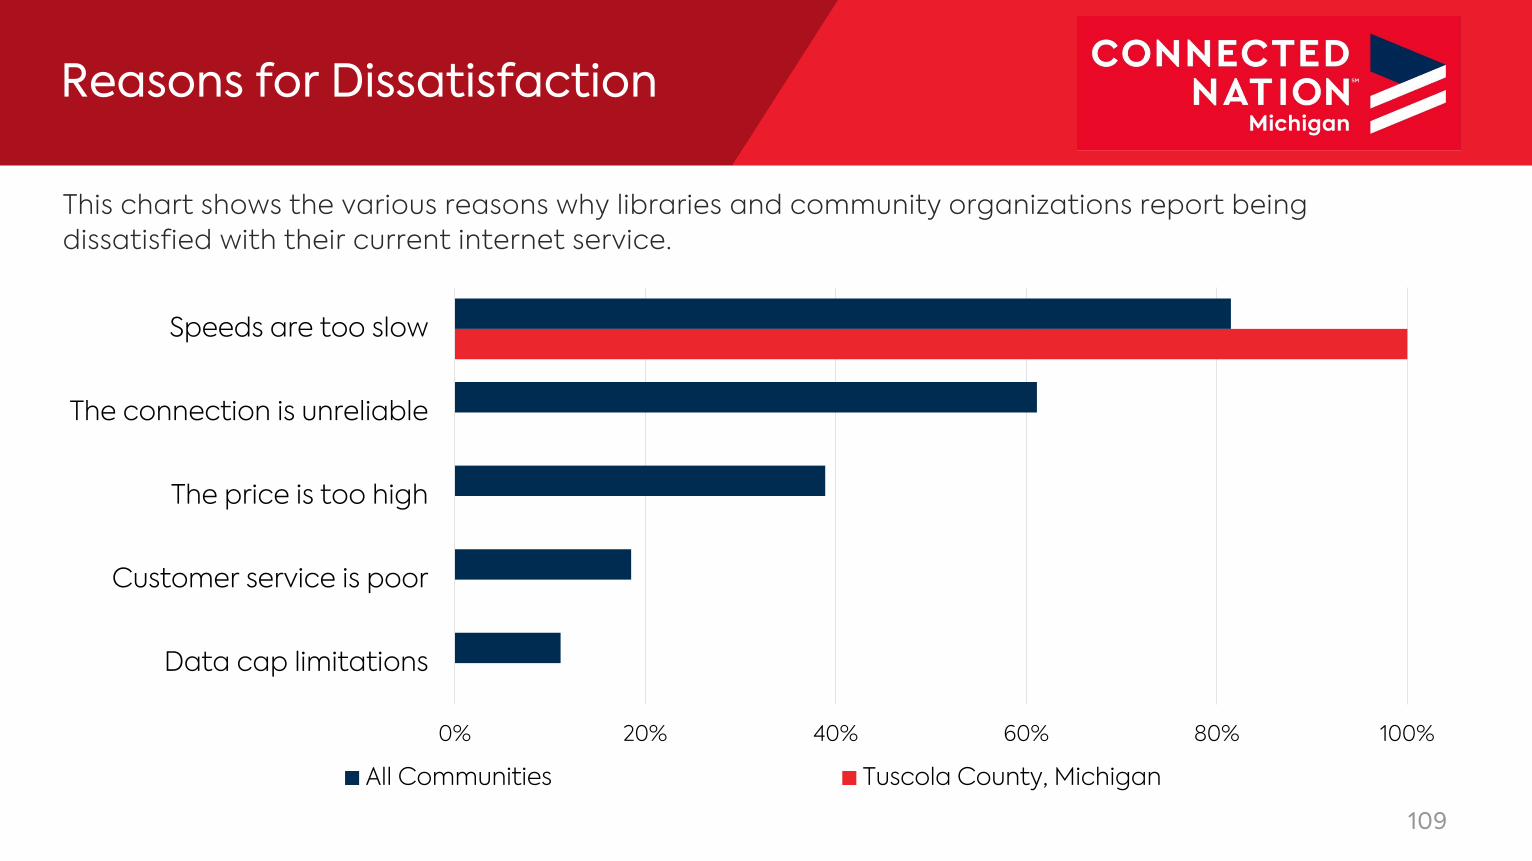
Reasons for Dissatisfaction
This chart shows the various reasons why libraries and community organizations report being dissatisfied with their current internet service.
0% 20% 40% 60% 80% 100%
Data cap limitations
Customer service is poor
The price is too high
The connection is unreliable
Speeds are too slow
All Communities Tuscola County, Michigan
109

Library SectorTechnology Applications
Beyond a website and the many forms of digital communications, there are more advanced ways in which a library and other organization can leverage technology to improve the services they offer to the public and the ways in which patrons access information. This chart shows the use and interest in a variety of technologies among libraries and other organizations in the community.
110
0% 20% 40% 60% 80% 100%
All Staff Have Email Accounts
Meeting Facilities with Technology Available to the Public
Shares Community Information Digitally
Electronic System to Manage Resources, Information, etc.
Local Listserv or Email List for Distributing Information
Mobile-Compatible Websites/Portals
Adaptive Technology for Patrons with Disabilities
Voice over Internet Protocol (VoIP) Phone Service
Currently Using Not Using but Will in 1 Year Not Using but Will in 2-5 Years Not Using, No Plans, But Interested Not Interested

Technology Training
Libraries provide opportunities for digital literacy training outside of a traditional classroom setting within a facility dedicated to accessing information. This chart shows the percent of libraries and organizations in the community that report offering each of the various types of technology training compared to libraries and organizations in other Connected communities.
111
0% 20% 40% 60%
Website Development
Technology for Businesses
Social Media Use
Office Productivity Software
Multimedia Editing
Mobile Device Applications
Internet Browsing and Searching
Device Orientation or Training
Cybersafety
Coding/App Development
Basic Computer Skills
Advanced Online Research
All Communities Tuscola County, Michigan

Public Computing Centers
The expense associated with home computer ownership represents a significant barrier to broadband adoption. For low-income residents without the ability to purchase a home computer (or other device), a public computing center may be their only opportunity to access the internet. Further, public access to technology is necessary for community members who have little or no communication technology available in the home, need assistance to effectively use technology, or need to supplement connectivity at home or in schools. A community should have sufficient, free access to computers, internet service, wireless networks, and other communication technologies to support the needs of residents. In addition, public computer centers should be located in safe facilities, with adequate levels of privacy, security, and accessibility for people with disabilities. Information regarding the availability and location of public computer centers should be widely disseminated.
112

Public Computing Centers
This shows the number of locations offering public access to computers and the internet, the number of public computers available at libraries and organizations who answered these questions in the survey, and the average number of computers per site at these responding libraries and organizations.
113
0
5
10
Tuscola County,Michigan
AllCommunities
Locations With Public Computer Access
Computers Availableto the Public
Average Number of Computersper Computing Site
4 17

TUSCOLA COUNTY, MICHIGANPublic Safety Survey Results

115
Police, fire, and emergency medical services, along with other supporting staff and organizations, are critical to the health, safety, and well-being of a community. As with the other critical sectors of a community, broadband-enabled technology has changed and improved the ways in which public safety entities serve and protect. Additionally, the internet has also brought about a new wave of criminal activity known as cybercrime. Cybersecurity and prevention, and the swift investigation and response to cybercrime from local, state, and federal law enforcement, can help keep a community safe from virtual threats such as fraud, identity theft, hacking, spam and ransomware.
These data show the connectivity and use of technology among public safety agencies in the community compared to those in other communities participating in Connected Nation’s Connected program. These data should be used to make informed decisions and implement solutions for improving connectivity in the community.
Public Safety Survey Results
Data from Tuscola County represent survey responses collected between February 2021 and April 2021. During this time, one Tuscola County public safety agency completed this survey. Data from all Connected communities represent survey responses collected between January 1, 2017, and April 30, 2021. As more communities participate in the Connected program, these figures are likely to change.

Digital Communications
Technology, coupled with an internet connection, provides a myriad of ways to digitally interact with the world or even those in one’s own community. This chart shows the average frequency with which public safety agencies use various digital communications tools.
116
0% 20% 40% 60% 80% 100%
Text
Video Social Media
Videoconferencing
Website Updates
YouTube
At least once a day At least once a week At least once a month Less than once a month Never

Digital Interaction
This chart shows the frequency with which residents in the community report that they digitally interact with public safety agencies. Examining the digital interaction of residents and the digital communications tools used by local institutions can help identify ways to increase the online presence of the sector.
117
0% 20% 40% 60% 80% 100%
Tuscola County, Michigan
All Communities
At least once a day At least once a week At least once a month Less than once a month Never

Interoperable Networks
Police, fire, emergency medical services, and 9-1-1 should all be able to communicate via a single interoperable voice and data communications network. This chart shows the percent of agencies in the community that participate in various types of interoperable networks compared to those in other Connected communities.
118
0% 20% 40% 60% 80% 100%
Tuscola County, Michigan
All Communities
Participates in both an interoperable data and voice radio system to serve multiple agencies
Participates in an interoperable voice radio system to serve multiple agencies
Participates in an interoperable data system to serve multiple agencies
The communications system is only used by one agency.
Unsure

Public Safety Agencieswith Websites
The website of a public safety agency may be the first point of contact a community member may have when an issue arises or information is required. The websites of these agencies, therefore, should provide relevant information in an easily accessible and flexible digital environment. This chart shows the percent of public safety agencies with a website in the community compared to the website use of agencies in other Connected communities.
0% 20% 40% 60% 80% 100%
Tuscola County, Michigan
All Communities
Yes No
119

Agencies Offering Public Wi-Fi
Public Wi-Fi can assist in creating a better-connected community by providing additional access points for those with devices limited by mobile data plans or those without mobile broadband capability. This chart shows the percent of public safety agencies in the community that offer free public Wi-Fi access compared to those in other participating communities.
0% 20% 40% 60% 80% 100%
Tuscola County, Michigan
All Communities
Yes No
120

Satisfaction AmongPublic Safety Agencies
Competition provides communities with choices for service, allowing them the ability to switch providers if their current service does not meet their needs. This chart shows the percent of public safety agencies who state that their internet service meets or does not meet their needs.
0% 20% 40% 60% 80% 100%
Tuscola County, Michigan
All Communities
Yes No
121

Reasons for Dissatisfaction
This chart shows the various reasons why local public safety agencies report being dissatisfied with their current internet service.
0% 20% 40% 60% 80% 100%
Data cap limitations
Customer service is poor
The price is too high
The connection is unreliable
Speeds are too slow
All Communities Tuscola County, Michigan
122

Communication Networks
Many public safety agencies use a mixture of communications technologies. This chart shows the percent of agencies in the community and the types of communications systems they use, compared to agencies in other Connected communities.
123
0% 20% 40% 60% 80% 100%
Tuscola County, Michigan
All Communities
Dedicated community-wide mobile broadband network
Commercial broadband network
Traditional land mobile radio communication system
Traditional land mobile radio system AND mobile broadband network (operated by local government)
Traditional land mobile radio system AND mobile broadband network (operated by private sector)

Cybercrime
While the proliferation of the internet has brought about improvements in the lives of many, it has also precipitated new forms of criminal activity. Fraud, identity theft, and hacking are just a few ways in which criminals can use the internet to take advantage of residents, businesses, and institutions. Strong proactive and reactive strategies to address cybercrime and stay safe online are best to keep communities safe.
The chart on the following page examines the ways in which law enforcement entities in the community use common practices to address cybercrime. The chart shows the percentage of agencies in the community implementing each activity, compared to agencies in other Connected communities.
124

Next Generation 911
Next Generation 9-1-1 (NG911) provides public safety agencies with new tools and techniques for protecting the health, safety, and welfare of a community. Emergency texting, streaming two-way video to the field, transmission of data-intensive files, biometric data monitoring, advanced communication with neighboring public safety agencies, and information sharing are only a few examples of how NG911 can positively impact a community. The transition to NG911 may be challenging for a community, but the benefits are great.
125
0% 20% 40% 60% 80% 100%
Tuscola County, Michigan
All Communities
Implementation of Next Generation 9-1-1 is completeCurrently implementing Next Generation 9-1-1Planning for Next Generation 9-1-1Legacy 9-1-1 still in placeUnsure

Mobile Broadband for Public Safety
Apart from the connection available to agencies at the office, mobile broadband connectivity is also important for staff in the field to quickly communicate needs in both emergency and non-emergency situations. This chart shows how agencies rate the importance of mobile broadband connectivity to the community's public safety agencies.
126
0% 20% 40% 60% 80% 100%
Tuscola County, Michigan
All Communities
Extremely important
Very important
Moderately important
Neutral
Somewhat important
Slightly important
Not important

Mobile Broadband Availability
This chart shows how the agencies in the community describe or rate the current availability of mobile broadband across the community. Issues with mobile broadband availability in the community are present if the agencies indicate that mobile coverage is very or extremely important but rate the current service as fair or poor.
127
0% 20% 40% 60% 80% 100%
Tuscola County, Michigan
All Communities
Excellent/Very Good Good Fair/Poor

Mobile Devices
0% 20% 40% 60% 80% 100%
Other
Vehicular modems
USB modems
Smartphones
Cellular phones with voice capability only
Air cards or computers with integrated wireless modems
All Communities Tuscola County, Michigan
128
Mobile broadband-enabled devices are necessary to take advantage of new and advancing mobile technologies. This chart shows the types of mobile devices provided to public safety personnel for use in the field compared to other Connected communities.