JONAS WETTRE retouch · JONAS WETTRE retouch [email protected] +46 (0) 704 88 27 28
date post
21-Dec-2015Category
view
216download
0
Turnover in the Wholesale Trade
Jonas Färnstrand
Statistics Sweden
------------------------------

Background
• EU-regulated survey
• Demands for decreased response burden
• Turnover by product important to National Accounts
• Concentration on economic statistics– Service sector in particular

Background
• Prior to 1997 – No administrative data– Sample of 15 000 enterprises (about 1 200 in the
wholesale trade)– Only total turnover (not by product)– Complementary survey every fifth year (turnover
by product)
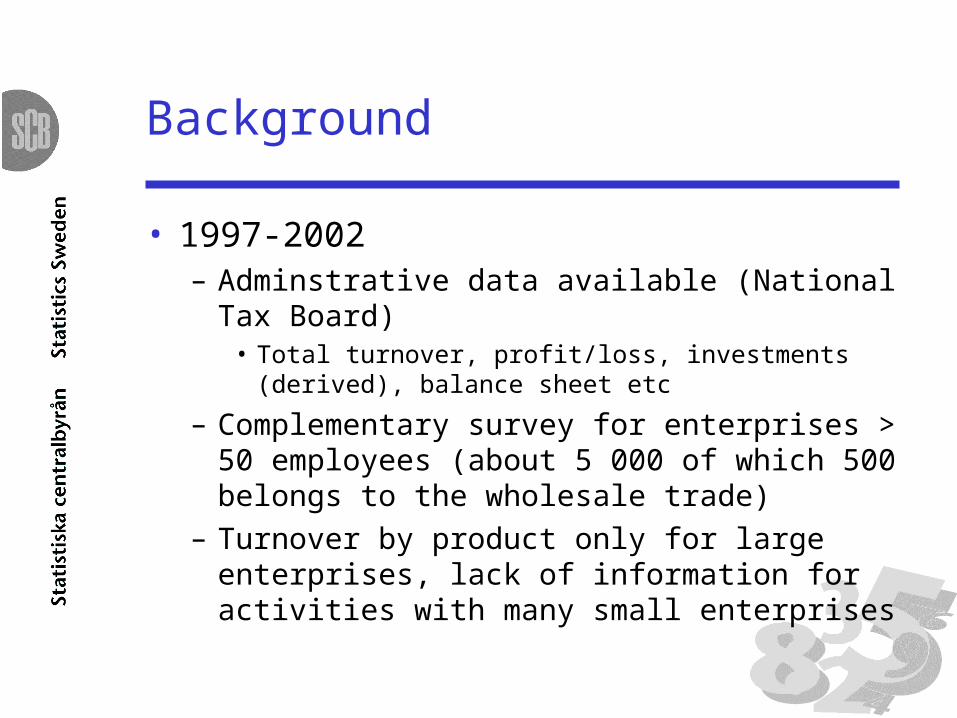
Background
• 1997-2002– Adminstrative data available (National Tax Board)
• Total turnover, profit/loss, investments (derived), balance sheet etc
– Complementary survey for enterprises > 50 employees (about 5 000 of which 500 belongs to the wholesale trade)
– Turnover by product only for large enterprises, lack of information for activities with many small enterprises
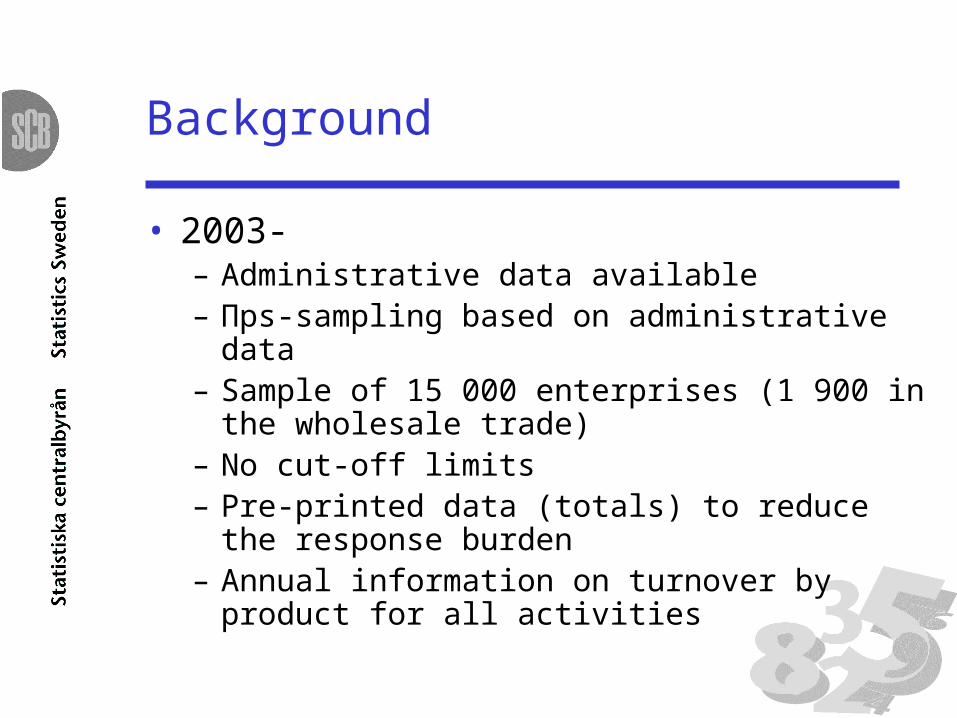
Background
• 2003-– Administrative data available– Πps-sampling based on administrative data – Sample of 15 000 enterprises (1 900 in the
wholesale trade)– No cut-off limits– Pre-printed data (totals) to reduce the response
burden– Annual information on turnover by product for all
activities
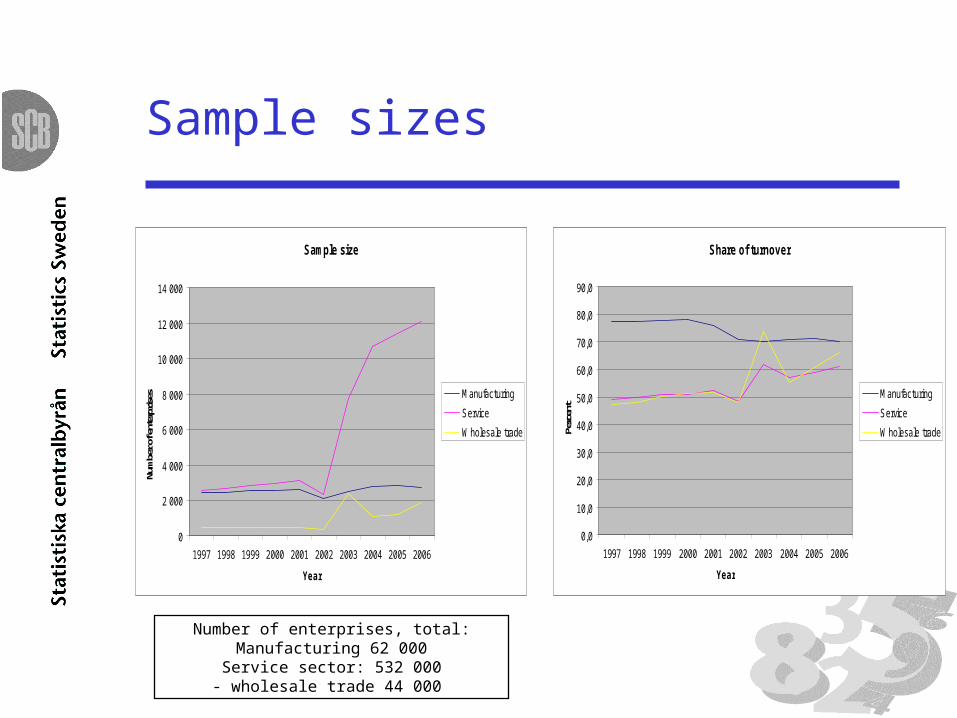
Sample sizes
Sample size
0
2 000
4 000
6 000
8 000
10 000
12 000
14 000
1997 1998 1999 2000 2001 2002 2003 2004 2005 2006
Year
Num
ber o
f ent
erpr
ises Manufacturing
Service
Wholesale trade
Share of turnover
0,0
10,0
20,0
30,0
40,0
50,0
60,0
70,0
80,0
90,0
1997 1998 1999 2000 2001 2002 2003 2004 2005 2006
YearPe
rcen
t
Manufacturing
Service
Wholesale trade
Number of enterprises, total:Manufacturing 62 000Service sector: 532 000
- wholesale trade 44 000
Stratification
• The goal is to cover as much turnover and as many product as possible
• 4-digit NACE in general
• Some 5-digit national level strata
• About 50 strata in total

Largest activities (divisions)
Data 2006
0,0
2,0
4,0
6,0
8,0
10,0
12,0
14,0
16,0
18,0
20,0
Wholesaletrade
Retail trade Construction Motor trade Otherbusinessservices
Activity
Per
cen
t
Share of turnover
Share of production value

Wholesale trade data
Wholesale trade compared to the total business sector
0,0
2,04,0
6,0
8,010,0
12,0
14,0
16,018,0
20,0
Pe
rce
nt

Time series, turnover
0
200 000
400 000
600 000
800 000
1 000 000
1 200 000
1 400 000
1 600 000
1 800 000
2 000 000
Year
Mil
lio
n S
EK
Manufacturing
Wholesale trade
Retail trade
Other business activities

Time table
Reference year t
November tThe population is created from the Business Register
March t+1Complete questionnaire for the very largest enterprises
August t+1Adminstrative data available
September t+1Sample is drawn,
questionnaires sent out
December t+1Preliminary results are published
June t+2Definitive results are published,
data sent to Eurostat and NA

Questionnaires
• Electronic questionnaires to enterprises > 10 employees (password by mail)
• Paper questionnaires and password to the smaller enterprises
• Pre-printed administrative data (total turnover, total personnel costs etc)

1. Pre-printed turnover 1
2. Turnover by product
2
2a. Main variables
2a
2b. Other variables belonging to the activity
2b
2c. Reported variables from last year
2c
2d. Other products (drop down-list)
2d
Electronic – pros and cons
+ Some checks/editing can be done already at the enterprise
+ Less expensive (at least for Statistics Sweden)
+ Less registration
+ XBRL in the future
+ Drop down-lists
- Problems to get to the questionnaire (macro settings in Excel, load times)

Response rates
Response rates
0
10
20
30
40
50
60
70
80
90
100
2003 2004 2005 2006
Year
Per
cen
t
Unweighted
Weighted

Response rates
Response rates
0
10
20
30
40
50
60
70
80
90
100
Paper, unweighted Electronic,unweighted
Paper, weighted Electronic,weighted
Per
cen
t
2005
2006

Wholesale groups
NACE (ISIC)
• 511 (461) Wholesale on a fee or a contract basis
• 512 (462) Wholesale of agricultural raw materials and live animals
• 513 (463) Wholesale of food, beverages and tobacco
• 514 (464) Wholesale of household goods
• 515 (466) Wholesale of non-agricultural intermediate products, waste and scrap
• 518 (465) Wholesale of machinery, equipment and supplies
• 519 (469) Other wholesale

Turnover 2006
Turnover by group
0
50000
100000
150000
200000
250000
300000
350000
400000
511 512 513 514 515 518 519
NACE
SE
K M
illi
on
s
511 Wholesale on a fee or a contract basis512 Wholesale of agricultural raw materials and live animals513 Wholesale of food, beverages and tobacco514 Wholesale of household goods515 Wholesale of non-agricultural intermediate products, waste and scrap518 Wholesale of machinery, equipment and supplies519 Other wholesale

Turnover 1997-2006
0
50 000
100 000
150 000
200 000
250 000
300 000
350 000
400 000
1997 1998 1999 2000 2001 2002 2003 2004 2005 2006
Year
SE
K M
illi
on 515
514
518
513
511
512
519
511 Wholesale on a fee or a contract basis512 Wholesale of agricultural raw materials and live animals513 Wholesale of food, beverages and tobacco514 Wholesale of household goods515 Wholesale of non-agricultural intermediate products, waste and scrap518 Wholesale of machinery, equipment and supplies519 Other wholesale

0
20 000
40 000
60 000
80 000
100 000
120 000
140 000
160 000
Sal
e of
fue
ls
Sal
e of
woo
d, o
ther
build
ing
equi
pmen
ts a
ndsa
nita
ryeq
upm
ents
Sal
e of
oth
erm
achi
nery
for
use
in in
dust
ry,
trad
ean
d na
viga
tion;
tele
com
mun
icat
ion
Sal
e of
com
pute
rs,
com
pute
rpe
riphe
ral
equi
pmen
t an
dso
ftw
are
Sal
e of
oth
erho
useh
old
good
s
Sal
e of
phar
mac
eutic
algo
ods
5151 5153 5187 5184 5147 5146
Product
SE
K M
illi
on
s
2003
2004
2005
2006
0
20 000
40 000
60 000
80 000
100 000
120 000
140 000
160 000
Sal
e of
fue
ls
Sal
e of
woo
d, o
ther
build
ing
equi
pmen
ts a
ndsa
nita
ryeq
upm
ents
Sal
e of
oth
erm
achi
nery
for
use
in in
dust
ry,
trad
ean
d na
viga
tion;
tele
com
mun
icat
ion
Sal
e of
com
pute
rs,
com
pute
rpe
riphe
ral
equi
pmen
t an
dso
ftw
are
Sal
e of
oth
erho
useh
old
good
s
Sal
e of
phar
mac
eutic
algo
ods
5151 5153 5187 5184 5147 5146
Product
SE
K M
illi
on
s 2003
2004
2005
2006
Turnover by product

Wholesale trade – the future
• The new NACE classification (reference year 2008)

Thank you!
Questions?