Turning the shelves: Empirical findings and Space Syntax ...
24
Turning the shelves: Empirical findings and Space Syntax analyses of two virtual supermarket variations Christopher Kalff 1 , David Kühner 1 , Martin Senk 1 , Ruth Conroy-Dalton 2 , Gerhard Strube 1 , and Christoph Hölscher 1 1 Center for Cognitive Science, University of Freiburg, Friedrichstr. 50, 79098 Freiburg i. Br., Germany {kalff, strube, hoelsch}@cognition.uni-freiburg.de 2 University College London, Gower Street, London, WC1E 6BT, United Kingdom. [email protected] Abstract. The spatial structure of a virtual supermarket was systematically varied to investigate human behavior and cognitive processes in unusual building configurations. The study builds upon experiments in a regular supermarket, which serve as a baseline case. In a between-participant design a total of 41 participants completed a search task in two different virtual supermarket environments. For 21 participants the supermarket shelves were turned towards them at a 45° angle when entering the store, giving high visual access to product categories and products. For 20 participants the shelves were placed in exactly the opposite direction obstructing a quick development of shopping goods dependencies. The obtained differences in search performance between the two conditions are analyzed using space syntax analyses and comparisons made of environmental features and participants’ actual search path trajectories. Keywords: Spatial Cognition, Space Syntax, Virtual Reality, Obliqueness. 1 Introduction Finding one’s way in a complex spatial environment can be considered a cognitive process of problem solving and decision-making. Authors like Passini (1981) emphasize that wayfinding entails the planning and execution of a sequence of movement decisions. These movement decisions are influenced by a number of factors, including familiarity with an environment and—quite prominently—the geometric structure of the environment. General background knowledge about typical configurations of objects in an environment can also influence such decision making, for example in a supermarket where shoppers typically know which products tend to be located close to each other. In the present study we investigate the relative impact of geometry and background knowledge and potential interactions between the two by systematically changing the geometry of a virtual supermarket. 25 brought to you by CORE View metadata, citation and similar papers at core.ac.uk provided by Northumbria Research Link
Transcript of Turning the shelves: Empirical findings and Space Syntax ...

Turning the shelves: Empirical findings and Space
Syntax analyses of two virtual supermarket variations
Christopher Kalff1, David Kühner1, Martin Senk1, Ruth Conroy-Dalton2 , Gerhard Strube1, and Christoph Hölscher1
1 Center for Cognitive Science, University of Freiburg, Friedrichstr. 50, 79098 Freiburg i.
Br., Germany {kalff, strube, hoelsch}@cognition.uni-freiburg.de
2 University College London, Gower Street, London, WC1E 6BT, United Kingdom. [email protected]
Abstract. The spatial structure of a virtual supermarket was systematically varied to investigate human behavior and cognitive processes in unusual building configurations. The study builds upon experiments in a regular supermarket, which serve as a baseline case. In a between-participant design a total of 41 participants completed a search task in two different virtual supermarket environments. For 21 participants the supermarket shelves were turned towards them at a 45° angle when entering the store, giving high visual access to product categories and products. For 20 participants the shelves were placed in exactly the opposite direction obstructing a quick development of shopping goods dependencies. The obtained differences in search performance between the two conditions are analyzed using space syntax analyses and comparisons made of environmental features and participants’ actual search path trajectories.
Keywords: Spatial Cognition, Space Syntax, Virtual Reality, Obliqueness.
1 Introduction
Finding one’s way in a complex spatial environment can be considered a cognitive process of problem solving and decision-making. Authors like Passini (1981) emphasize that wayfinding entails the planning and execution of a sequence of movement decisions. These movement decisions are influenced by a number of factors, including familiarity with an environment and—quite prominently—the geometric structure of the environment. General background knowledge about typical configurations of objects in an environment can also influence such decision making, for example in a supermarket where shoppers typically know which products tend to be located close to each other. In the present study we investigate the relative impact of geometry and background knowledge and potential interactions between the two by systematically changing the geometry of a virtual supermarket.
25
brought to you by COREView metadata, citation and similar papers at core.ac.uk
provided by Northumbria Research Link

The advent of virtual reality has propelled research on human spatial cognition. Of course, just as with every methodology the use of computer-generated environments has benefits (Ruddle, Payne & Jones, 1997) and drawbacks. However, one of the greatest advantages is the ease with which environmental features can be altered. We make use of this possibility by changing the layout of a virtual supermarket (see figure 1) whose basic layout had been investigated in previous studies.
Figure 1: Layout of the original supermarket environment and the location of the fifteen experimental items. The explanations for the numbers (which also represent their order in the search task) can be found in table 1. The black circle represents the starting point. Measurements are: length = 30.8m, width = 24m.
Our initial studies using an existing real store were designed to probe for the
influence of background knowledge on humans’ (Kalff & Strube, 2009) and robots’ (Joho, Senk & Burgard, 2009) navigation decisions. Results regarding the data of 52 human participants are highly indicative of the leverage of knowledge about typical spatial arrangements. Objects that are placed in the proximity of semantically related items yielded significantly lower search times than items violating common spatial (and semantic) proximity relations. Violation means that these items were grouped together with other items the average (and untrained) visitor thought to be inappropriate. Within this last group we further divide the items into two categories: Items that violate strong expectations and items that have many potential neighborhoods. For example, cereal bars, which are expected to be in the vicinity of candy bars, chocolate and sweets are to be found with cereals and oatmeal (which, again, are in a different meso-category, namely “breakfast items”) in this particular store. They are therefore in the group encompassing clearly mis-grouped items. We thus conclude that the congruence of items’ categorical membership and their real-world contextual embeddedness exerts an influence on navigation.
The results from the real world experiment were subsequently backed up by a replication study in a virtual version of the same supermarket (Kalff & Strube, in
26

preparation). This initial online experiment also serves as a stepping stone for the two variations that are being reported in this paper.
Man-made environments rarely confront their users with oblique angles. Studies have shown that obliqueness causes navigational difficulties (Thorndyke & Hayes-Roth, 1982; Meilinger, 2005) and also affects post-experimental drawings, e.g. the mental representations of street networks (Lynch, 1960). And once perpendicularity is violated, humans show a tendency to mentally straighten angles (Evans, 1980). Our goal in this study is to systematically vary a key spatial property of a realistic building setting while maintaining the majority of other features, like landmarks, thematic proximity of objects, et cetera. For this study we created two oblique versions of an originally highly perpendicular medium-sized German supermarket. This was achieved by rotating each shelf clockwise plus or minus 45° around its geometrical center (see figure 2). Turning the shelves provides a highly controlled, simple means for changing the length and number of key vistas in the setting.
Figure. 2. The two experimental supermarket layouts. The “minus 45°” version on the top and the “plus 45°” version on the bottom. The explanations for the numbers (which also represent their order in the search task) can be found in table 1. The black circles represent the starting points of the active navigation. None of the experimental items were moved during the reconfiguration process and it was strictly controlled for that the disassembly of the shelves didn’t affect background knowledge related processes.
27

A screenshot of the virtual supermarket, presenting a typical impression of the rotated shelves, can be found in figure 3.
Figure 3. Screenshot of the plus 45° condition of the rotated virtual supermarket. It was taken in the vicinity of item number 4 ‘salt’ and shows the main aisle when looking to the left after having slightly stepped away from the shelf displaying salt, sauces, oil and spices.
A second well-established methodology of spatial cognition research we want to incorporate in our study is space syntax (Hillier & Hanson, 1984). Visual access—to use the term Weisman (1981) coined—was identified as one of the key components of humans’ interactions with their environment. And as Gärling, Lindberg and Mäntylä (1983) pointed out, visual access has a substantial impact on wayfinding performance. If large parts of the building are immediately visible and mutual inter-visibility (vistas) connects different parts of the building, people have to rely less on stored spatial knowledge but can use information that is directly available through vision. While aforementioned researchers used intuitive and subjective measurements of visual accessibility, there have also been more formal approaches. Benedikt (1979), for example, evaluated scales of visual access through his notion of ‘isovists’. Another methodology for analysing visual access emerging nearly at the same time was space syntax (Hillier & Hanson, 1984). Space syntax is based on different variations of graph analysis and therefore allows researchers to formally “parse” (architectural) space. For both isovist analyses as well as space syntax findings good correspondences have been found regarding psychological measurements of environmental perception (Stamps, 2002) and actual (pedestrian) movement patterns (cf. Hillier et al., 1993; Peponis, Zimring & Choi., 1990; Haq & Zimring, 2003). Across a number of studies, different aspects of wayfinding and navigation have successfully been researched using graph or isovist analyses, e.g. Hölscher and Brösamle (2007) concerning navigation in multi-level buildings or Wiener et al. (2007) on navigation behavior in different architectural settings. Conroy-Dalton (2001) also analyzed the influence of angles at route decision points.
As we have two partially opposing versions of an indoor environment, space syntax is an ideal tool to analyze parameters that are affected by our reconfiguration and might therefore also affect building user’s navigation performance. Another strand of space syntax research deals with consumer behavior related issues. Gil et al. (2009), for instance, identified different shopper typologies and their respective shopping paths in a supermarket environment. Even though we are also using a grocery store environment, our sole goal is to investigate issues of (virtual) building reconfiguration and the influence of background knowledge on humans’ navigational decisions and not commercial in-store search strategies (e.g. Titus & Everett, 1996).
28

2 Method
Setting. Two oblique versions of an originally highly perpendicular medium-sized German supermarket were created by rotating each shelf clockwise plus or minus 45° around its geometrical center (see figure 2). A rearrangement that was performed for both versions of the rotated store consisted of disassembling the long produce section shelf to the right of the starting point (cf. figure 1). This resulted in an additional shorter shelf being inserted between the broader and lower produce shelves to the right of the starting point and the cereal shelf hosting item number two (cf. figure 2), so that all tall shelves are uniformly rotated in the store. Then all shelves were moved in such a way that the main aisle (which is the horizontal aisle in the very center of the layout) had an identical width in both conditions. The smaller aisles in-between the shelves (which we term ‘shelf aisles’) were also made identical with respect to their width and are consistent with the dimensions of the original store. This meant slightly changing the global properties of the two store versions: The length had to be increased for the rotated shelves and their aisle widths to fit. At the same time the width had to be decreased so that the aisles would not become too wide. Due to these changes the ‘wine section’ shelves on the upper-left side of the store and two sub-shelves of the frozen food department on the upper-right portion had to be moved slightly. As they have no bearing on the experimental items we do not expect effects on the search processes. Performing this reconfiguration led to the plus 45° store being slightly longer than the minus 45° store (lengthPLUS = 39.8m, lengthMINUS = 38.3m, both have width = 22.5m).
Participants. A total of 41 people (24 women) aged 20 to 35 years (M = 22.9; SD = 2.84) participated in the study. They were mainly psychology students from the University of Freiburg who either received course credit or a monetary compensation for their participation. Procedure. Just as with our previous supermarket experiments participants were first briefed on the course of events. A subsequent self-report questionnaire (Münzer & Hölscher, submitted) assessed participants’ navigational abilities. After a brief training with the navigation controls in a separate virtual building the main search task was initiated. After completion a series of post-tests were applied. To gauge biases in survey knowledge participants were either given a Euclidean distance estimation task or a triple-comparison of item locations task. A test in the same vein asked participants to render the interior of the store in a semi-structured sketch map and subsequently pinpoint the 15 item locations. A final questionnaire evaluates participants’ prior exposure to the specific store, stores of the same chain and more general shopping behavior data. This data will be used to identify the influence of prior experience. Main search task. The main search task consists of finding 15 different items (at different locations within the store). All items are regular supermarket goods that were not relocated by the experimenters. Instead, with the help of a pre-experimental card sorting task we determined three groups of items out of a reduced selection of 98 grocery goods with differences regarding their background knowledge congruency.
29

Group ‘A’ includes items that adhere to the common categorical knowledge of related grocery items with respect to their in-store placement. Furthermore there was high conformity between naïve participants and supermarket managers. Thus, we termed these items “congruent”. Group ‘B’ contains items that appear to be “incongruent” i.e. even though participants highly agreed on semantic relatedness these items are grouped together with other items in the store. The third group, ‘C’, is termed “ambiguous” because for both participants and store managers there is equivocality regarding item neighbors, respectively suitable in-store placements. Each group comprises 5 items each. An overview of the items and their group membership is shown in Table 1.
Table 1. Order and group membership of the experimental items. See figure 2 for the location of the respective items.
Order Item Category membership
Order Item Category membership
1 Yoghurt drinks A 9 Packaged marble cake B 2 Cereal bars B 10 Tomato puree C 3 Tinned maize A 11 Vanilla yoghurt B 4 5 6 7
Salt Cake decoration Deli olive oil UHT-milk
C A B C
12 13 14 15
Gravy powder Pickled herring Baby food Fresh yeast
A B C C
8 Long-grain rice A
The items had to be searched for in a fixed order. Every found item served as a
starting point for the next trial. The starting point for both layout-conditions is located at the left hand side of the supermarket just next to the wall in the middle of the main aisle looking towards the opposite side of the supermarket. Participants remained at that spot for 10 seconds before being passively navigated below the thicker first shelf in the lower half of the store to begin their active search trials. There was a 480 second time-limit for each trial. If participants exceeded this limit they were led to the respective location on the shortest possible path by verbal instructions. At the end of each trial the participants were asked if they had seen the respective item during previous trials. If affirmed, that item would be removed from further analyses.
3 Behavioral Results
Main search task. Before any calculations were performed we excluded those trials where the item had already been seen beforehand. This left us with 567 valid trials from the original 604. The first step in the analysis was to eliminate the influence of the different minimum route lengths (optimal paths) of the trials. A second set of influencing factors we want to eliminate from the raw search time is participants’ (differing) knowledge of this particular environment and the frequency of purchase of the experimental items. This was achieved by conducting a two-stepped linear
30
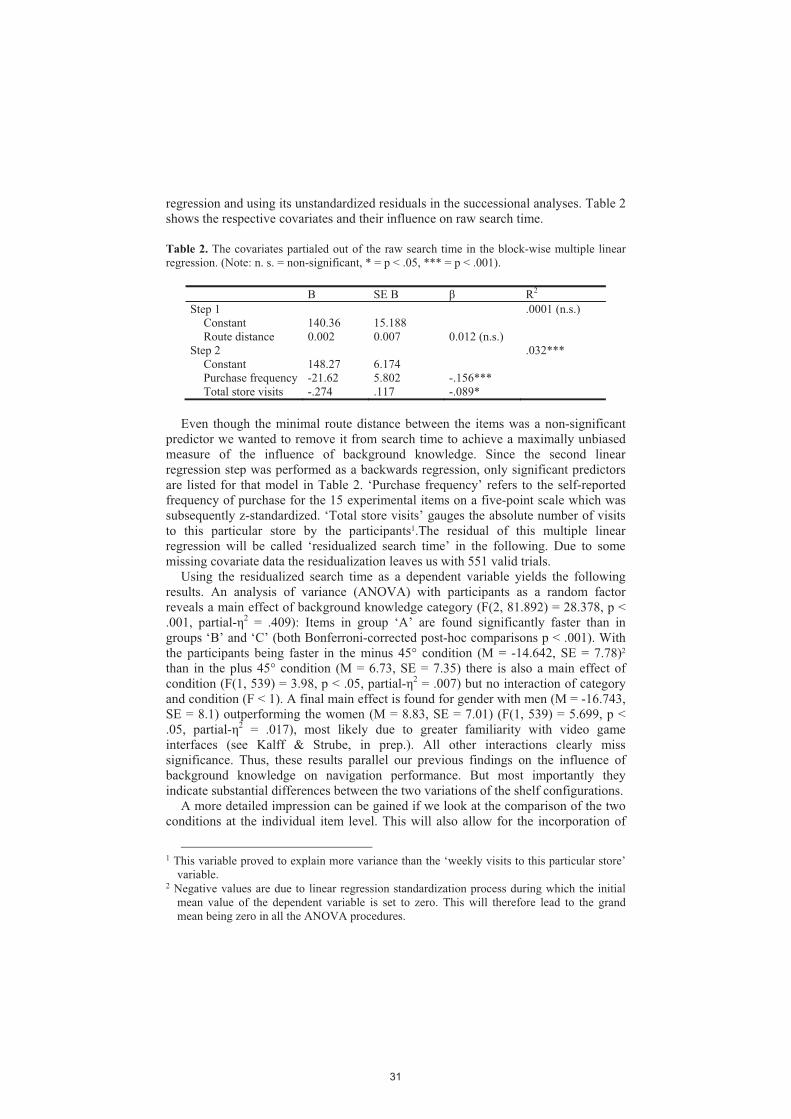
regression and using its unstandardized residuals in the successional analyses. Table 2 shows the respective covariates and their influence on raw search time.
Table 2. The covariates partialed out of the raw search time in the block-wise multiple linear regression. (Note: n. s. = non-significant, * = p < .05, *** = p < .001).
B SE B R2 Step 1 .0001 (n.s.)
Constant 140.36 15.188 Route distance 0.002 0.007 0.012 (n.s.)
Step 2 .032*** Constant Purchase frequency Total store visits
148.27 -21.62 -.274
6.174 5.802 .117
-.156*** -.089*
Even though the minimal route distance between the items was a non-significant
predictor we wanted to remove it from search time to achieve a maximally unbiased measure of the influence of background knowledge. Since the second linear regression step was performed as a backwards regression, only significant predictors are listed for that model in Table 2. ‘Purchase frequency’ refers to the self-reported frequency of purchase for the 15 experimental items on a five-point scale which was subsequently z-standardized. ‘Total store visits’ gauges the absolute number of visits to this particular store by the participants1.The residual of this multiple linear regression will be called ‘residualized search time’ in the following. Due to some missing covariate data the residualization leaves us with 551 valid trials.
Using the residualized search time as a dependent variable yields the following results. An analysis of variance (ANOVA) with participants as a random factor reveals a main effect of background knowledge category (F(2, 81.892) = 28.378, p < .001, partial-!2 = .409): Items in group ‘A’ are found significantly faster than in groups ‘B’ and ‘C’ (both Bonferroni-corrected post-hoc comparisons p < .001). With the participants being faster in the minus 45° condition (M = -14.642, SE = 7.78)2 than in the plus 45° condition (M = 6.73, SE = 7.35) there is also a main effect of condition (F(1, 539) = 3.98, p < .05, partial-!2 = .007) but no interaction of category and condition (F < 1). A final main effect is found for gender with men (M = -16.743, SE = 8.1) outperforming the women (M = 8.83, SE = 7.01) (F(1, 539) = 5.699, p < .05, partial-!2 = .017), most likely due to greater familiarity with video game interfaces (see Kalff & Strube, in prep.). All other interactions clearly miss significance. Thus, these results parallel our previous findings on the influence of background knowledge on navigation performance. But most importantly they indicate substantial differences between the two variations of the shelf configurations.
A more detailed impression can be gained if we look at the comparison of the two conditions at the individual item level. This will also allow for the incorporation of
1 This variable proved to explain more variance than the ‘weekly visits to this particular store’
variable. 2 Negative values are due to linear regression standardization process during which the initial
mean value of the dependent variable is set to zero. This will therefore lead to the grand mean being zero in all the ANOVA procedures.
31

space syntax measures which will be reported after the behavioral results (section 4). This analysis confirms the effects regarding condition and gender. Other than that, there is only a main effect of items: F(14, 491) = 6.648, p < .001, partial-!2 = .159. All other interactions clearly miss significance (all Fs < 1). Even though the item and condition interaction lacks overall significance a look at the individual items (see figure 4) reveals that the search time differences are most prominent for ‘tinned maize’, ‘vanilla yoghurt’ and ‘tomato puree’. In fact, if no measures are taken to control for multiple testing the difference for ‘vanilla yoghurt’ is significant (p < .05) and we observe marginal significance for ‘canned corn (also named tinned maize)’ (p = .074).
Figure 4. Mean residualized search time over items and experimental condition. Error bars depict one standard error of the mean.
Table 3 is designed to summarize the behavioral results. It will also include the post-test results which will be reported in the following. The ‘Direction’ column will explicitly show how the factors are influencing the dependent measures.
32

Table 3. Overview on the behavioral results. (Note: n. s. = non-significant, * = p < .05, *** = p < .001, the ‘<’ symbol represents superior performances [lower residualized search times/ more accurate drawings]).
Dependent
variable
Factor Significance Direction
Residualized
search time
category *** ‘A’ < ‘B’ & ‘C’
condition * ‘minus’ < ‘plus’ gender * ‘men’ < ‘women’ items *** cf. figure 4
all interactions n.s. - Turning of
drawn
shelves
condition n.s. -
gender * ‘men’ < ‘women’ Number of
drawn
shelves
condition n.s. -
gender n.s. - Individual
item
markings
items *** -
condition n.s. - items*condition n.s. -
Drawings. The post-experimental drawings are evaluated by three measures. First, we assessed if the shelves were turned at all (with the turning angle not necessarily equating the exact 45°) and if they were turned in the right direction. Thus, this resulted in a coarse binary ‘right/wrong’ measure. Second, the number of drawn-in shelves was counted. The third variable was assessed by measuring the deviations of participants’ item markings and the correct locations.
A comparison of the ‘correct shelf turning’, condition, and gender variables only shows significant differences for gender: Women’s (15 errors out of 24) mental representations are significantly poorer than men’s (4 errors out of 17): " 2(1) = 6.078, p = .025, # = .385. Regarding the number of shelves, participants tend to underestimate their true amount; the mean being -3.1 (SD = 1.99; Med = -3). The difference between the two conditions is marginally significant: the ANOVA shows that the minus 45° condition (M = -2.47, SE = .44) is superior to the renderings of the plus 45° condition (M = -3.58, SE = .43): F(1, 37) = 3.267, p = .079, partial-!2 = .081. All other F-values are smaller than 1.
Finally, the marking of the individual items reveals the following results (due to a violation of sphericity (" 2(104) = 156.27, p < .001, $ = .544) the Huynh-Feldt correction will be used). The repeated-measures ANOVA shows a marginally significant interaction of items and condition: F(12.318, 320.262 = 1.638, p = .078, partial-!2 = .059) and a significant main effect of items: F(12.318, 320.262) = 4.773, p < .001, partial-!2 = .155. Even though item marking accuracy was higher for the minus 45° condition (M = 37.32mm, SE = 4.7) than for the plus 45° condition (M = 46.89mm, SE = 4.7) this difference is not significant (F(1, 26) = 2.067, p = .162,
33

partial-!2 = .074). But again, in summary, one can conclude that the minus 45° condition produced better renderings of the store environment and by trend led to more accurate item markings. Correlational aspects. Taking all participants into account the following correlations are found. Drawing accuracy correlates highly with search time performance (r(39) = .549, p < .001). Search time is also marginally significantly correlated with the number of shelves participants missed drawing (r(40) = -.307, p = .054), i.e. the faster participants completed the search task the better were their renderings of the store’s interior. There are no correlations of experimental performance and the three scores derived from the pre-test questionnaire designed by Münzer and Hölscher (submitted). Preliminary result. Summarizing the behavioral results leads to the conclusion that the minus 45° condition was easier for the participants, both with respect to navigability and the creation of beneficial survey knowledge. One explanation we can offer at this point has to do with the first exposure participants received of the store. Before being led to the starting point the ten second information gain regarding the different product categories and their possible ordering is much higher in the minus 45° condition. Of course one could argue that participants in the plus 45° condition merely have to traverse the main aisle once to receive a similarly rich perspective. The original store. We want to briefly compare these results with those we determined in the original or perpendicular store (cf. fig. 1) before we head to the space syntax analyses. Regarding the effect of background knowledge congruency, there are main effects of category and (marginally significant) for condition with the perpendicular or normal version ranging between the rotated ones. And there is a marginally significant interaction of category and condition. This is due to lower search times for the incongruently placed items in the original store configuration. The gender effect of men outperforming women also remains stable. At the individual item level there is a significant interaction of items and condition, because of the significant difference for deli olive oil between the unrotated and the minus 45° degrees condition - latter yielding lower search times.
The strongest result concerns the post-experimental drawings. When comparing the unrotated virtual store with the (aggregation of the) two rotated versions drawing performance decreases drastically (MORIGINAL = 25.04mm, SE = 3.92; MROTATED = 42.1, SE = 3.272): F(1, 47) = 11.177, p < .002, partial-!2 = .192. A full account of the comparison between the original store and the layout variations will be reported in a future publication.
4 Space Syntax analyses
At this point the question arises, if and how visual access plays a role for the effects we found. To answer these questions we use space syntax analysis to compare the two different layouts. To begin with, we evaluate a selection of global measures of the two
34

store layouts. These include intelligibility, average integration, and average connectivity. From the wide range of analyses that space syntax offers we additionally performed the following: To check up on the postulated information gain difference at the exposure point a simple vista space evaluation will be performed as an isovist analysis. More elaborate analyses will consider the classical notions of intelligibility, integration and the different values of isovists and step depths. One further ad-hoc analysis we think is of great usefulness concerns the role of the main aisle. Not only are participants aware of its existence from their very first exposure of the virtual store, but we postulate that participants will preferentially resort to it, when navigating through the store. This should hold true especially when they have no clear-cut idea where the items’ (alleged) corresponding categories are. We therefore want to take into account how visible the main aisle is from every experimental item. In this paper, our source of an isovist is the target product itself, because we feel that in a complex environment like a supermarket it would be most useful to have a product that is visible from a great area. We propose to call such isovists of target products – product-catchment-areas.
However, the first stage of analysis deals with the global comparison of the two store versions. This will include intelligibility, average integration and average connectivity. All space syntax analyses were performed with the Depthmap software (Turner, 2004). Some areas of the store were purposefully blacked out before running the analyses. This includes a rectangular section in the lower-left corner that was never exploited by the participants. We also sealed off the gaps between the wall shelves, because they were not accessible for the participants. Global analysis. Table 4 shows the global properties of the two supermarket versions. As the numbers reveal, there are virtually no differences in the global geometrical properties of the two versions which could explain the significantly superior search time performance in the minus 45° condition.
Table 4. Global properties of the two store configurations.
Intelligibility3 Integration (HH4) Connectivity Plus 45° 0.8043 10.1394 1418.9471 Minus 45° 0.8715 10.2636 1380.7819
Since intelligibility is defined by the correlation between connectivity (i.e. the amount of neighbors a location is visibly connected to) and integration (which basically represents the amount of steps it takes to get from one particular location to any other in the environment) it provides information about how much the local structure allows for predicting the global structure. High intelligibility is the case for both layouts. The similarities between the two layouts are also corroborated when looking at the two visibility graph analyses (VGA; Turner, 2004) depicted in figure 5. The color ranges from red – representing highly integrated parts of the supermarket –
3 Values show R²-values of the linear regression as a result of the scatter plot for Integration
times Connectivity. 4 This is the Integration algorithm described by Hillier and Hanson (1984).
35

to dark blue, the least integrated areas. As can be noted the main aisle is the most integrated part of the environment in both conditions. Thus, no substantial environmental differences have been determined hitherto. We will therefore move to a more detailed comparison.
Figure 5. Visibility Graph Analyses (VGA) using the Hillier and Hanson (1984) Integration version. The minus 45° condition on top and the plus 45° on the bottom. The black rectangle in the lower left corner is used to exclude this area from the analyses. This was done because (even though not explicitly blocked during navigation) participants never used this portion of the store and there are no grocery goods there.
Individual item analyses. Individual item analyses were performed for every item as a ‘product-catchment-area’ considering all isovist measures and integration. Additionally, we analyzed the route between each starting point and its target location. We evaluated a total of 14 space syntax measures for each item (product) and condition (plus 45° / minus 45°):
36

The percentage of the main aisle that is visible from every ‘product catchment-area’.
Visual step depth which is based on the amount of visual turns that need to be made between starting point and target location (c.f. Turner, 2004). This provides useful information about the number of decisions people will have to make to reach a destination point.
Metric step depth weights those visual steps with their metric length. Shortest angular path and angular step depth: these measurements are
especially interesting, since the shelves’ rotation is the only actively induced modification compared to the original layout and leads to differing shortest paths between the conditions.
Isovist area gauges the influence of the area a product is directly visible from in the supermarket.
Isovist compactness: the ‘roundness’ of an isovist will be of interest for the difference between items that are located at the far ends of the market, where compactness is rather high versus the items between two shelves and even more so for the ones on aisles near the outer walls of the super market (called ‘side aisles’ in the following). In those latter cases compactness is rather low.
Isovist drift angle and isovist drift magnitude: these provide information about the influence of asymmetry on visual access for target products.
The minimum and maximum radial of the isovists as well as isovist perimeter. Especially for perimeter a high value increases the probability of this point to be seen from many different vista points.
Isovist occlusivity: this accounts for parts of the isovist perimeter that are occluded but permeable, and therefore, participants can pass those areas to gain visual access to the products.
A multiple ANOVA was conducted across all products and conditions (N = 15 * 2
= 30), with the space syntax variables as dependent measures. We obtained no significant differences between the two conditions regarding all these variables.
The next step of the analysis is to relate the environmental variables identified in this section to behavioral data, i.e. search performance in the supermarket. This will address the open question, what makes the minus 45° condition significantly easier for human participants. For this purpose we now include space syntax variables in a standardization process for obtaining a further refined residualized search time. The following analysis will thus test to what extent the (albeit small) differences in the space syntax measures can explain some of the variance leading to the performance differences between layout conditions. Re-analysis with space syntax measures. For this purpose another backward linear regression with the residualized search time as a dependent variable and the above mentioned variables as predictors will be performed (see Table 5). Multicollinearity is controlled for by examining the Variance Inflation Factors of the predictors (all VIF’s in the model % 1).
37

Table 5. The space syntax variables partialed out of the residualized search time in the stepwise multiple linear regression. (Note: * = p < .05, ** = p < .01, *** = p < .001).
B SE B Constant -95.64 14.52 Area of main aisle 112.51 25.49 .190*** Isovist compactness 309.14 47.57 .280**
R2 = .081, F(2, 548) = 24.268, p < .001.
Two of the space syntax measures are able to account for additional variance. A detailed look at the particular predictors explains their raison d’être. The area of main aisle visible from every item increasing search time appears counter-intuitive at first glance. But one has to keep in mind, that search in such a semantically dense environment as a supermarket is not (solely) guided by geometrical realities but by categorical dependencies, and therefore, more visual input which can be equated to more and possibly confusing product categories that increase search time. The significant influence of isovist compactness on the other hand shows that long lines of sight through the whole store nevertheless are beneficial since the lower the isovist compactness (and therefore the bigger the difference between maximum radial and average radial) the quicker participants find their way to the product. This also means that in areas where an isovist’s shape is more compact than, for example, in-between shelves, search times are rather high. In our study, round isovists are found at the sides of the supermarket which are areas where people do not tend to go since most products are visible from the middle of the store and therefore the main aisle.
Repeating the ANOVA procedures on the behavioral results section after the space syntax measures have been partialed out shows that even though the results regarding the background knowledge congruity still yield significance (F(2, 81.554) = 8.306, p < .01) their impact has dropped (partial-!2 = .169; compared to partial-!2 = .409 in the previous analysis, see section 3, ‘main search task’). Regarding the most prominent question of differences between the two conditions, the additional considerations of environmental properties yields the following picture: The minus condition (M = -13, SE = 7.57) is no longer significantly easier than the plus condition (M = 4.85, SE = 7.12): F(1, 539) = 6.87, p = .096, partial-!2 = .005. And again there is no interaction of items and condition: F(14, 491) = 1.226, p = .252.
As reassuring as these results are for gauging the influence of pertinent background knowledge on navigational decisions and performance, they also shed light on the difference between the two shelf configurations. After taking the space syntax measures into account, there is no longer a significant performance difference between the two, i.e., the space syntax measures indeed capture relevant variance underlying the performance difference. Yet, it still has to be identified how exactly the space syntax measures differ between the layouts. To dig into the matter we want to have a look at the two conditions separately. Perhaps they don’t share the same predicting variables and exhibit different correlational properties. For this purpose Table 6 contrasts the correlation of the residualized search time and the space syntax measures. The last column reports the significance value of the difference in correlations computed via Fishers Z-transformation, i.e. if the strength of correlation differs significantly between the two conditions.
38

As the last column shows, there are indeed differences in the correlations of environmental features and participants’ search times between the two conditions. Area of main aisle, isovist drift magnitude and the isovist’s minimum radial show significant differences. Of these variables, though, only area of main aisle has proven to be a significant predictor for search time and therefore we focus on it in the following analysis. While a higher value lowers search times (though not significantly) in the minus condition, the plus condition’s items worsen with increasing visibility from the main aisle. A factor analysis performed on the abovementioned 14 space syntax variables sheds some light on the fact that area of main aisle is a significant predictor in the regression (see table 5) despite being non-significant in table 6 here. This is due to it sharing variance with other (significant) variables like isovist area, isovist maximum radial and integration in the factor analysis.
Table 6. Correlations of residualized search time and space syntax measures for the overall case and the two conditions individually (n = 290 for plus and n = 261 for minus). (Note: M = p < .1, * = p < .05, ** = p < .01, *** = p < .001).
Overall Minus 45° condition
Plus 45° condition
p-value of significance of difference
Area of main aisle .103 -.010 .165** p = .039* Visual step depth .183** .168* .195*** p = .745 Metric step depth Angular step depth Shortest angular path Isovist area Isovist compactness Isovist drift angle Isovist drift magnitude Isovist max. radial Isovist min. radial Isovist occlusivity Isovist perimeter Integration
-.046 .217*** .192*** .085* .221*** -.008 -.035 -.019 .098* -.078M
-.028 -.008
-.065 .229*** .170** .014 .208** -.070 -.140* -.098 .005 -.084 -.042 -.081
-.031 .222*** .206*** .140** .238*** .022 .062 .056 .194** -.071 -0.10 .047
p = .691 p = .931 p = .664 p = .139 p = .713 p = .283 p = .018* p = .072M p = .026* p = .87 p = .497 p = .691
The second most influential factor contains isovist compactness and the significant
variables angular step depth and shortest angular path. We suppose that low compactness that is due to an isovist comprising big areas, especially along the main aisle and side aisles, is naturally correlated with lower step depth and particularly angular step depth. If one is in any of these aisles less steps and less turns are needed. Thus, the two predictors in table 5 are representative of the two strongest factors of the factor analysis.
Because the area of main aisle (visible from every item) yields a significant difference between the two conditions, we are convinced that this stems from participants using it in a different manner. Perhaps the shelf configurations “lead” participants either away or towards the main aisle, which is probably dependent on the location within the aisle. And of course, one always has to bear in mind that there may not only be differences between the two conditions but between the three
39

background knowledge congruency groups as well. Thus, participants may not have adhered to a single strategy, but switched depending on their metaknowledge of product categories. We want to tackle these questions in the following. Main aisle analysis. As the area of main aisle that is visible from the products is a significant predictor for the plus 45°-condition only, we first want to examine how much time participants spent on the main aisle. The data was obtained by computing gate counts from the trajectory data. Therefore, we subdivided the supermarket into different areas along the axis orthogonal to the supermarket’s main axis. We defined one area for the middle aisle, two areas tangent to that area covering all the shelves and two areas covering the aisles at the two long outer walls of the supermarket. The lengths of the areas were the same as that of the supermarket and the breadths were chosen so as to cover the stated areas. We then counted how long our test subjects remained near the outer walls, in the main aisle or in one of the two shelf aisles.
Again, to rid the data of the varying experience of participants with this particular store a stepwise linear regression with the data from the covariate questionnaire will be performed.
Table 7. The covariates partialed out the time participants spent in the main aisle. (Note: *** = p < .001).
B SE B Constant 712.52 32.25 Item purchase frequency -116.44 33.56 -.146***
R2 = .021, F(1, 550) = 12.035, p < .001. As can be seen in table 7 the only significant predictor is the z-standardized item purchase frequency. The unstandardized residuals of the regression are then analyzed using an ANOVA taking the same factors into account that were also used for the main search time evaluation. The ANOVA shows a significant difference between the two conditions (F(1, 554) = 3.874, p < .05, partial-!2 = .007): Participants spent more time in the main aisle in the plus condition (M = 48.42, SE = 44.13) than in the minus condition (M = -76.612, SE = 45.68). Of the other factors, both gender (F(1, 554) = 6.46, p < .05) and category (F(2, 554) = 16.18, p < .001) are significant with the same trend as for the search time analysis performed above. None of the interactions reach significance.
To examine this differing usage of the main aisle we want to report an exemplary qualitative analysis in the following.
5 Qualitative Analysis
As our goal is to determine the differences between the two experimental conditions, we want to examine more closely how the turning of the shelves and background related processes interact. This will be done in a qualitative fashion using participants’
40
actual trajectories and breaking down their behavior and decisions in a step-by-step fashion. This is achieved by iterating through the following set of questions:
Which choices might be encountered on an ideal search-path between
starting point und target product?
When does background knowledge prove to help or indeed make it more
difficult for participants to find a certain target product?
Are there indications that argue for the interaction between the use of
background knowledge and visually-driven search strategies? What does this
interaction look like?
We want to point out that the further analyses are qualitative and rather standing at the beginning of further research. As such, we are using examples of research elements that make it possible to figure out different strategies in detail. The goal is to try and understand strategies and heuristics for path choices in this particular environment by looking at the decisions made. Those decisions are reconstructed through interpretations of trajectories and thinking aloud protocols. We are giving one example to show the working process. Item and layout can be seen in figure 6: The task was to find the tinned maize.
We begin with analyzing the different layouts. Asterisks account for starting points, circles for target-product locations. We use numbers at points on a route to alleviate following the description. In both conditions the ideal path (as marked with continuous lines) would be: Firstly, choosing to walk along the main aisle and from there, secondly, in the direction of tinned maize. Then, thirdly, turn away from the main aisle at the appropriate junction. The next step will be looking at visual guiding principles and the influence of background knowledge separately for both conditions.
The plus 45° condition. Looking at the „plus” condition (see figure 6): Due to the rotation of shelves the main aisle is close and easy to reach from the departure point (marked by the asterisk), which is why one can assume preferences for the main aisle direction (c.f. Gärling, Säisä, Böök, & Lindberg, 1986). From that point, there is the possibility to go to the non-food section on the left or the food section on the right side of the supermarket (tagged with ‘p1’ in the figure). Although the rotation angle is bigger for the food section (one prominent strategy is to try minimizing the rotation angle at decision points, as worked out in Conroy-Dalton, 2001) background knowledge will presumably lead to the right side. Being on the main aisle heading for the food section participants face the difficulty of shelves being turned away from the main aisle so that products cannot be recognized easily without actually walking through the aisles between two shelves. Therefore it should be more difficult to decide on the appropriate path (see tag ‘p2’).
Still with respect to the plus 45°-condition, starting once more at the very first decision point (the asterisk), participants choosing their path to the lower side aisle will face quite different situations (see the dashed line). The shelves are rotated into the direction of the food section in the back of the supermarket. The integration of background knowledge and rotation of the shelves favor the way to the front end of the supermarket (‘p3’), following the lower side aisle. In this aisle, parts of the
41

shelves and therefore products and categories are clearly visible which makes it easy to see if there is a product that is similar to or even matches the one participants are searching for. However, participants need to make a rather big turn (more than 90°) if deciding to walk along one particular shelf. Since there are no obvious triggers for background knowledge until the last shelf in the row this increases the probability of walking along the lower side aisle until ‘p4’. In addition, when we looked at the trajectories we noticed quite a few participants searching for the target in this last shelf at the front end of the supermarket (see figure 7).
Figure 6. Departure point and target location for the experimental item ‘tinned maize’ in the plus 45° condition. The starting point (‘cereal bars’) is marked by the asterisk, maize is depicted through the circle. The ideal path is indicated by the continuous lines; alternative routes are marked with dashed lines. ‘p1’ to ‘p6’ denote decision points that we are focusing on.
Figure 7. Aggregated trajectories of participants searching for tinned maize in the plus 45° condition.
42
This is a shelf with delicatessen, including tins and jars. Those tins and jars probably trigger a packing heuristic: Thus, the shelf forms a distractor. This is backed by statements in thinking aloud protocols. Here, many participants communicate from the very beginning that they are searching for tinned food:
„… Maiskörner sind bei den Dosensachen…” „…maize is located near the tinned food…“
From this point, participants will presumably get lured along the shelf (searching for tinned maize at ‘p5’) straight into the main aisle (‘p6’), where they basically face the same problems as their partners using the main aisle straight away. Additionally, they now fare even worse due to them walking in the opposite direction; i.e. the tinned food is located at a suboptimal angle.
As one can see in figure 7 there is a quite obvious and extended usage of the main aisle. But participants are rather walking back and forth without being able to decide for one shelf or aisle. Only once they reach the back end do they tend to turn and walk through to the upper side aisle, where they stay on and walk until they can see the target product from this direction. The minus 45° condition. How might people act in the minus-layout? Again, we can assume that participants aim for the food section. This time, shelves are rotated in such a manner that the point of departure is not located near the main aisle, but rather facing the lower side aisle. Accounting for the “searching for food article assumption” we would still expect the preference for following the direction of the shelf into the main aisle. This is because the shelves lead to the food section on their way to the main aisle (see figure 8, tag ‘m1’). In contrast, turning 90° to the left and walking on will lead you to the back of the supermarket which is the non-food section (‘m4’). Moreover, the departure point is rather located in the back. Finally, we believe that the main aisle is part of a hierarchical strategy: if participants do not yet have a complete picture of the location of different product categories around the supermarket but do have semantic background knowledge about the target product and its semantic neighbors, the simplest way to find the product is to go where you can overlook the biggest part of the supermarket – the main aisle. This hypothesis is backed by several comments derived from thinking-aloud protocols where we found statements like the following:
„… geh ich mal wieder hier in diesen Mittelgang und versuche mir einen
Überblick zu verschaffen…“ „… again I go back here into this middle aisle and try to get an
overview…“. Once in the main aisle (‘m1’) lower turning angle and background knowledge both
favor turning right and going down to the front end. If participants are walking in this direction, the target shelf is facing the main aisle (‘m2’). The target product itself is not immediately visible but there are a lot of tins and jars (‘m3’).
43

Figure 8. Departure point and target location for the experimental item ‘tinned maize’ in the minus 45° condition. The starting point (‘cereal bars’) is marked by the asterisk, maize is depicted through the circle. The ideal path is indicated by continuous lines; alternative routes are marked with dashed lines. ‘m1’ to ‘m6’ denote decision points that we are focusing on.
Figure 9. Aggregated trajectories of participants searching for tinned maize in the minus 45° condition.
If participants use the lower side aisle in the beginning (‘m4’), background knowledge about placing of food items on this side might step in again to lead the way to the front end of the supermarket. The shelves’ rotation is turned away from the side aisle. Participants have to walk along between the shelves to see the products (for example turning at ‘m5’). This again guides them to the main aisle (‘m6’), if they don’t want to turn around and walk back to the lower side aisle (which would be of considerable cost regarding time and distance as there are no new products). Again, the trajectories fit very well with those interpretations (see figure 9).
44

This item search has been a fairly simple task but as you can see even this task shows a very complex structure where visibility and background knowledge are constantly interacting and, moreover, where route decisions can lead to different interactions of both variables. Sometimes strategies like using the main aisle can be very useful—if shelf rotation favors visibility of the target products—but very confusing as well—if shelf orientation doesn’t support the visibility of the shelf or even worse if it supports distractors. In fact, things become more difficult by taking into account heuristics like the aforementioned packing heuristic. Participants are most certainly not semantically connecting tinned maize and the delicatessen shelf. But in a complex environment visible bottom-up information (‘there are tins in the delicatessen shelf’) and top-down information (‘maize comes in tins’) are flexibly used while encountering products in the layout.
In summary we would like to conclude that reconstructing possible path choice decisions reveals complex interaction between background knowledge and visibility. The heuristic of using the most integrated part of the building—the main aisle—for orientation can be either helpful or irritating depending on the rotation of the shelves. The next step for future research on this aspect is to categorize different forms of interaction and provide a framework of possible rules that can be empirically validated.
6 General discussion and future research
With the help of a virtual version of an existing medium-sized supermarket we designed two new store layouts: All shelves were either rotated plus or minus 45° around their geometrical center. The participants’ task was to find 15 items which exhibited different degrees of congruency regarding their in-store placement and the generalized background knowledge average consumers have regarding their semantic neighborhood. The study finds significant differences between the two shelf configurations, as the minus 45° condition was overall easier for the participants. Breaking down this main effect by looking at differences for the individual items doesn’t yield any significant interactions, but confirms the superior search performance in the minus 45° configuration. An initial analysis of environmental features with a wide range of space syntax measures shows no major differences between the two conditions, neither for global properties such as overall intelligibility or connectivity, nor for several analyses at the individual item level. Re-analyzing the behavioral data after partialing out the strongest space syntax predictor variables does eliminate the significance of behavioral differences between the two conditions, though. Viz., the space syntax measures that were evaluated capture some of the behavioral and cognitive effects the layout variation has on human’s search performance. Namely, the area of main aisle that is visible from the target locations and isovist compactness are significant predictors of search time. Contrasting the strengths of the influence of the different layout properties reveals further differences, as the area of main aisle only has a hampering influence in the plus 45° condition. We thus conclude that the orientation of the shelves seems to function as a guiding appliance that “deflects” building users into different directions and causes the
45

significant difference in occupation of the main aisle throughout the search trials by participants in the two conditions. And, of course, the results reveal the strong coupling of semantically guided navigation decisions and the hard constraints of environmental properties. Geometrical variations between items and layout versions are able to explain variance that in our original study (Kalff & Strube, 2009) was attributed to background knowledge about category placement and category membership of products. At the same time, background knowledge has a significant impact beyond what the space syntax analyses have been able to explain thus far. To successfully untangle the interaction of background knowledge and geometric influences, we need to further refine the analyses on the level of individual products, categories and trajectories. The qualitative analysis of decision making for ‘tinned maize’ in the preceding section is a step towards this goal.
Another aspect we definitely want to tackle is to capture the navigation behavior with the help of an agent simulation. Turner & Penn (2001) and Penn & Turner (2001) have introduced a simulation approach that builds upon the Visibility Graph Analysis method employed in this paper. We have conducted preliminary test with these agents within the Depthmap software. So far, this VGA agent modeling has failed to match the human search pattern in our study. The qualitative analysis in section 5 suggests that this is likely attributable to a lack of modeling background knowledge in these agents. We suspect that at least for parts of the human trajectories observed in this study, the Depthmap agents could provide substantial correspondences. To capture this, we intend to analyze the trajectories of each participant per item in more detail. A promising approach is to translate the continuous space of the store environment into larger segments (roughly corresponding to single aisles) and obtain gate counts at segment boundaries (as detailed in Hölscher, Brösamle & Vrachliotis, in press, for a conference center setting). The relative usage frequency for different items between layout conditions can then be compared to the agent’s behavior.
A similar analysis of correlations between search times and space syntax measures (cf. table 5) will look at differences between the three groups of items (congruent, incongruent, and ambiguous) and how they are differently affected in the two layout conditions. Preliminary analyses suggest that the isovist area in the two layouts, for example, affects incongruent items differently than congruent items: For the congruently placed items of group ‘A’ isovist area shows a negative correlation with search time, i.e. ‘seeing more’ equals ‘finding faster.’ The opposite is true for items of groups ‘B’ and ‘C,’ which have a lot of plausible product-neighborhoods—the higher their visibility the longer they are searched for. And this, again, is more strongly pronounced in the plus 45° condition. It remains an issue of future research to clarify to what extent such differences reflect a true interaction of semantic and spatial features or whether they are better characterized as artefacts of item selection in this particular study. Acknowledgments. This work was funded by the German Research Council (DFG) in the SFB/TR8 ‘Spatial Cognition. We would like to thank Simone Maciej for her help in running the experiments and aiding the analyses, and Liza Veldhuis for proofreading the manuscript.
46

References
Benedikt, M. L. (1979). To take hold of space: Isovists and isovists fields. Environment and Planning B, 6, 47-65.
Conroy-Dalton, R. (2001). The secret is to follow your nose: route path selection and angularity. Proceedings of the 3rd International Space Syntax Symposium. Atlanta, Georgia, USA.
Evans, G. W. (1980). Environmental cognition. Psychological Bulletin, 88, 259-287. Gärling, T., Säisä, J., Böök, A., & Lindberg, E. (1986). The spatiotemporal
sequencing of everyday activities in the large-scale environment. Journal of Environmental Psychology, 6(4), 261-280
Gärling, T., Lindberg, E., Mäntylä, T. (1983). Orientation in buildings: Effects of familiarity, visual access, and orientation aids. Journal of Applied Psychology, 68(1), 177-186.
Gil, J., Tobari, E., Lemlij, M., Rose, A., & Penn, A. (2009). The Differentiating behavior of Shoppers Clustering of Individual Movement Traces in a Supermarket. Proceedings of the 7th International Space Syntax Symposium. Stockholm, Sweden.
Haq, S., & Zimring, C. (2003). Just down the road a piece: The development of topological knowledge of building layouts. Environment and Behavior, 5(1), 132-160.
Hillier, B, & Hanson, J. (1984). The social logic of space. Cambridge University Press: Cambridge.
Hillier, B., Penn, A., Hanson, J., Grajewski, T., & Xu, J., (1993). Natural movement: or configuration and attraction in urban pedestrian movement. Environment and Planning B: Planning and Design, 20, 29-66.
Hölscher, C., & Brösamle, M. (2007). Capturing indoor wayfinding strategies and differences in spatial knowledge with space syntax. In: A. Kubat, Ö. Ertekin, Y. Güney, & E. Eyübo&lu (Eds.). Proceedings of the 6th Space Syntax Symposium. Istanbul: ITU Faculty of Architecture.
Hölscher, C., Brösamle, M., & Vrachliotis, G. (in press). Challenges in multi-level wayfinding: A case-study with Space Syntax technique. Environment and Planning B: Planning & Design.
Joho, D., Senk, M., & Burgard, W. (2009). Learning wayfinding heuristics based on local information of object maps. Proceedings of the European Conference on Mobile Robots (ECMR) 2009, 117–122.
Kalff, C., & Strube, G. (2009). Background knowledge in human navigation: a study in a supermarket. Cognitive Processing, 10(2), 225-228.
Kalff, C., Strube, G. (in preparation). Background knowledge: An important factor in human navigation.
Lynch, K. (1960). The Image of the City. Cambridge, MA: MIT Press. Meilinger, T. (2005). Wayfinding with maps and verbal directions. Proceedings of the
27th Annual Conference of the Cognitive Science Society, 1473-1478. Münzer, S., & Hölscher, C. (submitted). Development and validation of a self-report
measure of spatial orientation. Passini, R. (1981). Wayfinding: a conceptual framework. Urban Ecology, 5, 17-31.
47

Penn, A., & Turner, A. (2001). Space Syntax based agent simulation. 1st International Conference on Pedestrian and Evacuation Dynamics. Duisburg: University of Duisburg, Germany.
Peponis, J., Zimring, C., & Choi, Y. K. (1990). Finding the building in wayfinding. Environment and Behavior, 22(5), 555-590.
Ruddle, R. A., Payne, S. J., & Jones, D. M. (1997). Navigating buildings in "desk-top" virtual environments: Experimental investigations using extended navigational experience. Journal of Experimental Psychology: Applied, 3, 143-159.
Stamps, A. E. (2002). Entropy, visual diversity, and preference. Journal of General Psychology, 129(3), 300-320.
Thorndyke, P. W., & Hayes-Roth, B. (1982). Differences in spatial knowledge acquired from maps and navigation. Cognitive Psychology, 14, 560-589.
Titus, P. A., & Everett, P. B. (1996). Consumer wayfinding tests, strategies and errors: an exploratory field study. Psychology & Marketing, 13(3), 265-290.
Turner, A. (2004). Depthmap 4, A Researcher's Handbook, http://www.vr.ucl.ac.uk/ depthmap/handbook/depthmap4.pdf
Turner, A., & Penn, A. (2001). Encoding natural movement as an agent-based system: an investigation into human pedestrian behaviour in the built environment. Environment and Planning B: Planning and Design, 29, 473-490.
Weisman, J. (1981): Evaluating architectural legibility – Way-finding in the built Environment. Environment and Behavior, 13(2), 189-204.
Wiener, J. M., Franz, G., Rossmanith, N., Reichelt, A., Mallot, H. A., & Bülthoff, H. H. (2007). Isovist analysis captures properties of space relevant for locomotion and experience. Perception, 36(7), 1066-1083.
48