Turning a Blind Eye to - Catskill Citizens for Safe...
24
-
Upload
trinhtuong -
Category
Documents
-
view
217 -
download
0
Transcript of Turning a Blind Eye to - Catskill Citizens for Safe...


Turning a Blind Eye to Illegal PollutionDEC’s Failing Record on Enforcing Environmental Laws
Acknowledgements: We thank the Robert Sterling Clark Foundation for their support of this work. We also thank the New York State Department of Environmental Conservation staff for the work they do every day. This report is not a condemnation of their important efforts. Rather, it is a pointed demon-stration that New York’s political leadership must prioritize enforcement of existing environmental laws in order to protect public health, safety, and our environment.
Author: Andrew Postiglione
Editors: David Gahl, Katherine Nadeau & Travis Proulx
Graphic Design & Layout: Loren Baum
GlossaryExecutive Summary...................................................3
General Recommendations........................................5
Introduction...............................................................6
Clean Water Act Enforcement...................................7
Clean Air Act Enforcement.....................................12
Hazardous Waste Enforcement................................16
Regulatory Roll Backs.............................................19
Conclusion...............................................................22
Acronyms Used in the ReportCAA Clean Air ActCAFO Concentrated Animal Feeding OperationCNMP Comprehensive Nutrient Management PlanDEC Department of Environmental ConservationDMR Discharge Monitoring ReportEBPS Environmental Benefit Permit StrategyECL Environmental Conservation LawEPA Environmental Protection AgencyFFY Federal Fiscal YearLQG Large Quantity Generator PCB Polychlorinated BiphenylsRCRA Resource Conservation and Recovery ActRCSD Rensselaer County Sewage DistrictSFY State Fiscal Year
SPDESState Pollution Discharge Elimination Systems
TSDF Treatment, Storage, and Disposal Facility

3
EXECUTIVE SUMMARYNew York has a robust body of environmental protections, and justifiably so. Environmental protections are inextricably linked to our state’s economic well-being and sound public health.
But as the result of sustained budget cuts during the last decade, the New York State Department of Environ-mental Conservation (DEC) has been forced to choose between increasingly poor options when it comes to enforcing the law.
Based on data reported by the DEC to the United States Environmental Protection Agency (EPA) this report demonstrates that environmental enforcement is on the decline. Further, the state is increasingly reliant on pol-luter-produced self-monitoring reports to oversee their compliance with environmental permit conditions.
Governor Andrew Cuomo often speaks about the need to make state government work better. And in some instances, he has. Governor Cuomo has led important green initiatives, such as dedicating more resources for preservation and conservation projects.
But the failure to address enforcement issues at the DEC will ultimately sully his record. And while the Cuomo administration is not responsible for the deep staff cuts of previous administrations, the Governor’s philosophy has been for his agency to do less with less, leaving it struggling to protect public health, safety, and our shared environment.
Community Consequences The dismantling of the state’s regulatory presence coincides with significant cuts to DEC’s regulatory divisions – cuts that have had an alarming toll on enforcement actions across all categories investigated.
EPA data from 2009 to 2012 compiled by Environmental Advocates show:
• Steep declines in total facilities inspected (down 35%), as well as facilities cited for violations (down 25%).
• A marked decrease in formal enforcement actions undertaken by DEC (down 24%).
DEC inspections of water pollution permit holders declined by 74% between 2009 and 2012 leaving pollut-er-produced monitoring reports largely unverified.
In just four years, air permit inspectors cut stack testing of emission sources by 44% and documented fewer facilities in violation (down 53%) or in significant noncompliance (down 50%) with permit provisions.
State hazardous waste regulators inspected only 3.5% of operating facilities and generators in New York and documented significantly fewer of these facilities in violation (down 31%) and in significant noncompliance (down 68%) of permit provisions as compared to four years ago.
Governor’s philosophy has been for his DEC to do less with less

4
Someone unfamiliar with this data could interpret these figures as demonstrating industry as behaving well, but it is more likely the state has become a place where it is easier for facilities to pollute without being held to task.
Even more troubling, Governor Cuomo has recently introduced new policies to further roll back environmental protections.
Led by the Governor, requirements aimed at protecting waterways and communities from agricultural wastes were eliminated for dairy operations with fewer than 300 cows under the guise of buoying the state’s Greek-yogurt industry. The Cuomo administration also introduced a self-audit policy that allows entities to avoid punishment by selectively bringing their own infractions to DEC’s attention.
A Path ForwardGovernor Cuomo can turn the ship around. There are many immediate actions the Cuomo administration can adopt which will renew the public’s faith in the agency’s oversight, and erase this black mark on the Governor’s green record.
The Governor’s next budget proposal must restore DEC staffing levels. DEC has not seen staff increases since fiscal year 2007-2008 when Governor Eliot Spitzer funded a modest growth of 109 positions – an increase long since erased.
Restoring staff would allow DEC to better enforce the state’s existing laws and regulations that protect our environment and public health. It would further empower DEC to assert its regulatory presence with on-site monitoring to verify self-produced compliance reports. In short, it would give New Yorkers the confidence of knowing their government is working to protect their interests.
DEC should also reinstitute rigorous agency-led testing at emission sources and identify the root causes of why air and hazardous waste inspections are now uncovering fewer infractions than in years past.
And perhaps the easiest fix to implement would be to renew DEC’s past practice of providing the public with information on how the state’s vital resources are being protected from toxic emissions through annual reports.
DEC is looking less and finding less

5
GENERAL RECOMMENDATIONS
• Increase DEC staff to prevent further reliance on polluter self-regulation and band-aid prioritization policies that diminish DEC’s enforcement presence and fail to compel compliance.
• Re-establish inspection presence and on-site testing, including stack and effluent testing, to verify self-reported data and lessen reliance on citizen detection of permit violations.
• Recognizing that it is impossible to have inspectors everywhere at all times, conduct random inspections across all areas with the public release of results.
• Impose significantly harsher penalties on permit holders that submit faulty, incom-plete, and late self-reports.
• Release to the media information on all inspections in which public and environmen-tal safety is compromised.
• Communicate inspection information to county, local, and state officials, the results of any inspections where DEC discovers that public and environmental safety is compro-mised.
• Identify root causes of why air and hazardous waste inspections are turning up fewer violations than they have in previous years.
• Prevent further roll backs of DEC authority to oversee facilities that present pollution risks to our air, water, and land.
• Return to publically issuing annual compliance and enforcement information for all environmental permits.
• Include results of inspections by region in the Environmental Notice Bulletin updated weekly on DEC’s website.

6
INTRODUCTIONThroughout its history, New York State has led the nation in enacting legislation and regulations that protect public health, safety, and the environment. From the creation of the Adirondack Park to passing an innovative acid rain law in the mid-1980s (under then-Governor Mario Cuomo) to passing legislation to control the spread of destructive invasive plants and animals, New York’s body of environmental protection is extensive.
However, little is known about how frequently and effectively these laws are being enforced — until now.
Data compiled by Environmental Advocates suggest that baseline enforcement of environmental laws has waned significantly. Formal enforcement actions across three major areas of environmental law – the Clean Wa-ter Act, Clean Air Act, and Resource Conservation and Recovery Act – have decreased by nearly 25% between 2009 and 2012.
Further, under the guise of making New York “Open for Business,” the Cuomo administration has actively be-gun rolling back regulations by:
• Adopting a series of weaker clean-water regulations for Concentrated Animal Feeding Operations (CAFOs), endangering state waterways and the communities they serve.
• Instituting dubious new policies that replace State inspections with self-audits by industries.
These actions call into question the Governor’s commitment to basic environmental and public health protec-tions. Turning a Blind Eye to Illegal Pollution examines these disturbing trends within major functional areas at the DEC, and recommends a series of measures to turn the situation around and burnish Governor Cuomo’s reputation as a national leader.
Enforcement Of Environmental Laws On The DeclineDEC is designated by the EPA to permit and enforce federal pollution regulations for over 33,000 emission sources covered under the Clean Water Act (CWA), Clean Air Act (CAA), and Resource Conservation and Re-covery Act (RCRA).
For years, DEC has absorbed staffing cuts and resource reductions while its responsibilities for monitoring and verifying environmental compliance have expanded. This balancing act has pushed the agency to increasingly rely on polluter-produced monitoring reports rather than reliably objective State-led field testing and verifica-tion.
New York data reported to EPA show the toll Albany’s staffing reductions have had on inspection rates with significantly fewer violations detected and corrected by regulators.
As displayed in figure (1), oversight and enforcement actions undertaken by the department across all environ-mental permit categories (CWA, CAA, and RCRA) since 2009 have been significantly reduced. State regulators inspected 840 (35%) fewer facilities in 2012 than 2009, while facilities found to be in violation of permit pro-visions have declined by 25%, and facilities found to be in serious violation have also decreased by more than 10% during this time period. Formal enforcement actions have decreased by almost 25%, while informal en-forcement actions and assessed fines have seen significant reductions. DEC is looking less and finding less.
7
-‐40
-‐35
-‐30
-‐25
-‐20
-‐15
-‐10
-‐5
0
5
% ∆ Total Facili3es
% ∆ Facili3es with Inspec3ons
% ∆ Facili3es with Viola3ons
-‐% ∆ Facili3es with Significant
NonCompliance
.% ∆ Facili3es with Formal
Enforcement Ac3ons
Figure (1) 2009-2012 violation and enforcement trends for all CAA, CWA and RCRA permits
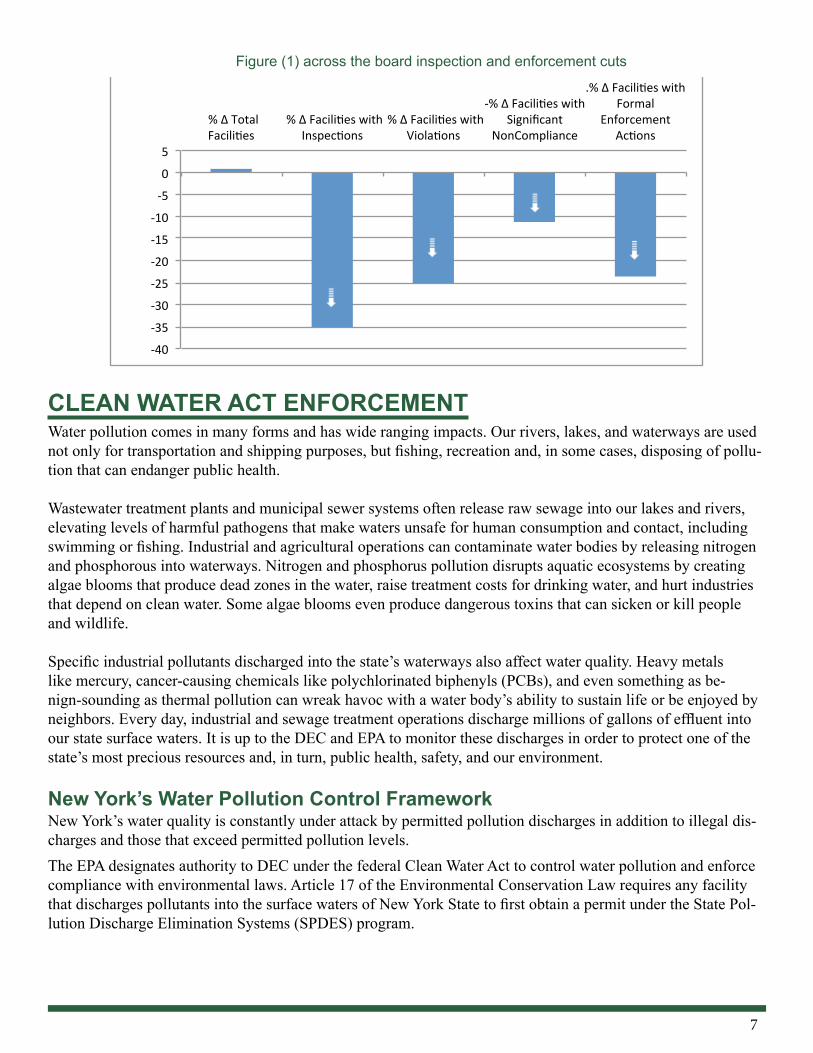
CLEAN WATER ACT ENFORCEMENTWater pollution comes in many forms and has wide ranging impacts. Our rivers, lakes, and waterways are used not only for transportation and shipping purposes, but fishing, recreation and, in some cases, disposing of pollu-tion that can endanger public health.
Wastewater treatment plants and municipal sewer systems often release raw sewage into our lakes and rivers, elevating levels of harmful pathogens that make waters unsafe for human consumption and contact, including swimming or fishing. Industrial and agricultural operations can contaminate water bodies by releasing nitrogen and phosphorous into waterways. Nitrogen and phosphorus pollution disrupts aquatic ecosystems by creating algae blooms that produce dead zones in the water, raise treatment costs for drinking water, and hurt industries that depend on clean water. Some algae blooms even produce dangerous toxins that can sicken or kill people and wildlife.
Specific industrial pollutants discharged into the state’s waterways also affect water quality. Heavy metals like mercury, cancer-causing chemicals like polychlorinated biphenyls (PCBs), and even something as be-nign-sounding as thermal pollution can wreak havoc with a water body’s ability to sustain life or be enjoyed by neighbors. Every day, industrial and sewage treatment operations discharge millions of gallons of effluent into our state surface waters. It is up to the DEC and EPA to monitor these discharges in order to protect one of the state’s most precious resources and, in turn, public health, safety, and our environment.
New York’s Water Pollution Control FrameworkNew York’s water quality is constantly under attack by permitted pollution discharges in addition to illegal dis-charges and those that exceed permitted pollution levels.The EPA designates authority to DEC under the federal Clean Water Act to control water pollution and enforce compliance with environmental laws. Article 17 of the Environmental Conservation Law requires any facility that discharges pollutants into the surface waters of New York State to first obtain a permit under the State Pol-lution Discharge Elimination Systems (SPDES) program.
Figure (1) across the board inspection and enforcement cuts

8
The SPDES program authorizes and monitors pollutant discharges into surface waters and works to ensure that discharging facilities maintain proper designs and operations to keep effluent below permitted levels. DEC permits discharging facilities ranging in size from Majors – which include large industrial facilities, energy producers, and wastewater treatment plants that discharge more than one million gallons per day or that release high-risk pollutants into our waters – to Minors which include smaller discharge sources like schools, restau-rants, and apartment complexes that frequently feed directly into municipal sewer systems. Because runoff after heavy rains carries sediment and toxic debris from construction and industrial sites into water bodies, and because heavy rainfall can cause treatment plants to release raw sewage into waterways, in 1998 EPA prioritized these wet weather discharges for regulation. Consistent with this new EPA strategy, DEC introduced general SPDES permits to cover stormwater runoff from sources such as construction and industrial sites, municipal storm sewers, and Concentrated Animal Feed-ing Operations (CAFOs, or factory farms). The addition of wet weather discharges to the SPDES permit pro-gram has significantly expanded New York’s oversight of pollution sources, but this expanded responsibility has come without any increase in DEC staff or resources to actually monitor and enforce permit compliance.
DEC’s Staffing CutsMany organizations and state agencies have been able to streamline their work and reduce staff as technology modernizes the workforce. However, the staffing cuts at DEC have disproportionately been in areas where real people are necessary to carry out inspections and other work.At DEC, the Division of Water carries out important water quality protection functions that include testing and monitoring the state’s water bodies, permitting discharges, and enforcing compliance with perfor-mance standards and operating conditions. Between SFY 2007-08 and 2012-13 the Divisions of Air and Water Quality Management were cut by 28%, losing 235 full time positions. While this substantial cut alone has hampered DEC’s ability to keep proper tabs on its water discharge permit holders, in that same time frame their responsibilities have increased. DEC reports that the SPDES-permitted universe increased by 63% between 1999 and 2012, from 11,210 to 18,320 facilities. Other DEC divisions that support the agency’s water pollution control efforts also saw significant cuts in this timeframe. For example, the Division of Environmental Enforcement, which supports the Division of Water in regulating SPDES permit holders, had its staff cut by 21%, or 115 positions. Lower staff numbers combined with more pollution sources to monitor increases the likelihood that serious environmental threats to public health, safety, and our environment go undetected. DEC has also adopted deeply flawed shortcuts. In 1992, DEC adopted a priority ranking system and adminis-trative renewal process called the Environmental Benefit Permit Strategy (EBPS). This triage system, itself the subject of previous Environmental Advocates reports , targets a small percentage of SPDES permits for a full five-year review and leaves the vast majority to be rubber stamped without the comprehensive technical reviews required by federal law.

9
Rensselaer County Sewer District Waste Water Treatment PlantDuring the summer of 2013, Riverkeeper, a nonprofit water-quality watchdog, alerted DEC to the presence of sewage bacteria greater than 400 times federal safety limits in the Hudson River. The pollution was traced back to a Rensselaer County Sewer District (RCSD) discharge pipe.
Prior to this violation, RCSD had been cited for noncompliance with water quality standards for at least nine quarters, primarily due to reporting violations in the past three years. A 2012 Order of Consent issued by DEC to the RCSD as well as the Cities of Troy and Rensselaer cited 409 instances where the RCSD failed to report violations between January and August of 2009, among other reporting, effluent, and dry weather overflow infractions. The DEC order also fined the sewer district and cities a combined $650,000. DEC then suspended $550,000 of these penalties when they were given good faith assurances that the systemic problems would be corrected.
Despite the consent order, the RCSD and its serviced cities continue to violate effluent and reporting permit requirements. In response to the latest detection of effluent limit violations, a spokesman for the Troy Mayor’s Office was quoted as saying, “As soon as we were notified by DEC, which was notified by Riverkeeper, we addressed the problem.”
Clearly, the perspective of the City of Troy, and presumably Rensselaer and the sewage district, is that the time to address violations is only after someone else has caught them.
The consent order’s schedule of compliance requires that SPDES reporting requirements be met lest suspended fines be reinstituted.
Despite the continued failure to comply with state water quality laws, DEC decided not to assess any of the $550,000 in previously suspended fines.
Credit: John Lipscomb, Riverkeeper

10
Enforcement WoesDEC relies on Discharge Monitoring Reports (DMRs) to oversee pollution from significant SPDES permit holders. These polluter-produced sampling reports are required of large volume or industrial dischargers on a monthly, quarterly, or annual basis depending on individual permit conditions. DEC reportedly received more than 20,000 DMRs containing over 500,000 data points in SFY 2011-12, which staff compared against permit limits to determine compliance. Fewer staff has made adequately monitoring compliance to prevent pollution a much more daunting task.In SFY 2011-12, permit holders, reporting through DMRs, stated that they were compliant with permitted effluent limits 97% of the time. But, how valid are these reports? Environmental Advocates found that in 1990, DEC sampled effluent 1,113 times to verify polluters’ reports but only conducted tests 112 times in 2008, a 94% decrease. These 112 tests were conducted against 228,000 discharge monitoring data points from 1600 permit-ted facilities. DEC’s inspection presence among polluters and their operations has decreased to negligible levels.Budget constraints have forced DEC to stop any effluent sampling as part of their SPDES inspection program. Reliance on polluter-reported discharges has compelled DEC to adopt a “we’ll take your word for it” approach that produces high compliance rates but little verification that rules are being followed and our waters protected.
All FacilitiesState data reported to the EPA show that all facilities found to be in violation (noncompliance or significant noncompliance) remained relatively constant over the four years from 2009 to 2012 with an average of 23% of facilities cited for violations annually. However, while the percentage has not changed, the total number of sites inspected has dropped dramatically.As Figure (2) shows, the number of facilities inspected declined by 74% from 1,028 in 2009 (18% of permitted facilities) to 264 in 2012 (just 5% of permitted facilities). DEC is monitoring fewer facilities while a segment of permit holders (at least 23%) is known to be out of compliance – leaving self-produced compliance forms as the only assurance against illegal, undetected pollution flowing into our waterways.
In 2008, DEC conducted just 112 effluent tests to verify permit compliance at 1,600 facilities and has since stopped performing the tests altogether.
While it is deeply unsettling that so many DMRs are escaping any review, DEC’s process to obtain these completed reports has been a cause for concern because of filing errors and missed deadlines that undermine the agency’s ability to properly protect New York’s water resources.
In late 2008, DEC instituted an aggressive enforcement strategy to combat delinquent and incorrectly filed DMRs that included a policy of issuing notices of violation for reporting offenses. This tactic has served, if perhaps for little else, as a useful indicator of reporting rates.

11
Major FacilitiesMajor facilities are consistently out of compliance with their permits, meaning they have either been flagged for polluting New York’s waterways or their improper reporting is preventing DEC from knowing whether illegal pollution is being discharged. DEC data reported to EPA show that an average of 76% of Major facilities have been cited for violations between 2009 and 2012. As shown in Figure (3), DEC inspections of Major discharging facilities fell dramatically between 2009 and 2012 despite the majority of the facilities’ incurring violations – often for unreliable and substandard reporting. Despite finding 76% of Major facilities were out of compliance with their permits, DEC decided to inspect 79% fewer Major polluting facilities at the end of that timeframe. DEC inspections fell from a strong enforcement presence of 74% of major facilities inspected in 2009 to just 16% in 2012, leaving regulators blind to violations and the public vulnerable to illegal pollution.
Inspections of Major polluting facilities dropped by 79% from 2009 to 2012
Figure (3) a major reduction in inspections of the state’s largest dischargers
Figure (2) SPDES permitted facilities inspected
Inspections of SPDES-permitted facilities declined by a staggering 74% over the last four years
0
300
600
900
1200
2009 2010 2011 2012
Figure (2) SPDES permitted facilities inspected

12
Over this same four year span, major facilities found to be in significant noncompliance with their SPDES permits increased by 49%. Just as a higher police presence can decrease the number of dangerous drunk drivers on the road, more frequent inspections can decrease the number of water-pollution violations. The contrasting trends shown in Figure (4) – increasing violation rates coupled with decreasing inspection rates – demonstrate that insufficient DEC staffing may be failing to keep pace with increased water pollution violations as polluters gain confidence that they can violate permit conditions with impunity.
Recommendations• Increase onsite inspections
• Increase agency testing of outflows and point sources
• Introduce random reviews of permit holders who fall outside the purview of the EBPS
CLEAN AIR ACT ENFORCEMENTThe most common pollutants afflicting the air we breathe are ground level ozone, or smog, and fine particulate matter which irritates the nose, throat, and respiratory system and contributes to the development of asthma and heart disease. According to the New York State Department of Health, one in eleven children and adults have asthma and there has been an upward trend in the prevalence of asthma in New York since 1998.
New York has made steady gains in cleaning up air quality over the last 30 years, but 4.7 million New Yorkers still live in counties receiving failing grades from the American Lung Association’s State of the Air 2013 report for ground level ozone demonstrating the danger of easing air quality standards.
New York’s Air Pollution Control FrameworkIndustrial operations in the United States annually emit more than 100 million tons of pollutants into the air (not including carbon dioxide, a major greenhouse gas), much of which emanates from large facilities like chemical plants.
Under the federal Clean Air Act, EPA implements and enforces regulations to reduce air pollutant emissions and states are required to develop and implement an operating permit program meeting minimum federal stan-dards. In New York, EPA delegates this authority to DEC which, through permit provisions, requires facilities to (a) install pollution control technologies or (b) change operating practices in conjunction with monitoring and enforcing activities.xxxi
Even with 79% fewer major SPDES facilities inspected in 2012 than in 2009, the number of facilities cited for significant noncompliance increased by 50%
Between 2009 and 2012, inspections of major polluting facilities declined by 79% – from a strong enforcement presence in 74% of major facilities in 2009 to just 16% in 2012.
Figure (4) inspections drop, noncompliance grows

13
Each year, 8.4 million pounds of legal emissions are released into New York’s air from permitted facilities.23
The majority of these releases are generated by Major permitted facilities that (a) produce or have the potential to produce over 100 tons per year of listed air pollutants or (b) produce lower levels of particularly hazardous air pollutants. Major sources of air pollution include power plants, food processing plants, and other industrial facilities. DEC also regulates facilities determined to be Minor emitters and Synthetic Minors. Synthetic Minor facilities could emit as much as Major permitted facilities but are limited to lower outputs by permit provisions. In 2012, DEC had permitted over 3,400 air pollution emitting sources, including 422 Major facilities.
DEC’s Staffing CutsAs previously mentioned, the Divisions of Air and Water Quality Management have been hit hard by recent staff cuts, losing 235 positions, or 28% of the divisions’ workforces, since SFY 2007-08 – leaving our health, safety, and environment at greater risk than four years ago (Figure (5).24 Important functions within the air divi-sion include monitoring ambient levels of criteria pollutants (i.e., ozone, sulfur dioxide, and particulate matter), analyzing and modeling ambient condition data, and coordinating permitting activities and regulatory develop-ment.
DEC’s Division of Air Resources FFY 2010 Compliance and Enforcement Report states, “The purpose of com-pliance monitoring and enforcement is to maintain an adequate regulatory presence so as to provide a deterrent against non-compliance. Elements of a good compliance monitoring and enforcement program include: on-site inspections, review of periodic monitoring reports, performance tests, compliance evaluations and tracking of compliance related activities.”25
DEC pursues a compliance strategy across all classes of emitting facilities that relies on polluter self-reporting of adherence to environmental laws. Like the EBPS for water pollution permit reviews, DEC’s Compliance Monitoring Strategy focuses scarce air division staff resources on Major and Synthetic Minor facilities.
DEC’s Divisions of Air and Water Quality Management have lost 235 full time staff since the 2007-08 SFY
Figure (5) staff cuts to air and water quality
500
550
600
650
700
750
800
850
2007-‐08 2008-‐09 2009-‐10 2010-‐11 2011-‐12 2012-‐13
Figure (&&&) staff cuts to air and water quality

14
Residents Resort to Homemade Air TestsTonawanda Coke exemplifies the hard road that environmental enforcement efforts have traveled in recent years. As with clean water enforcement, budget reductions and staff cuts have led DEC to replace boots on the ground with an increased reliance on polluter self-reporting. This regulatory shift allowed the Tonawanda Coke plant, located on the Niagara River just north of Buffalo, to spew carcinogens into surrounding commu-nities for years before residents were finally able to force regulators to take action.
To force DEC to take action against a known polluter, residents of the Town of Tonawanda had to use home-made air tests comprised of buckets and handheld vacuums to demonstrate that illegal toxic emissions were poisoning their community.
Until residents of Tonawanda began vociferously complaining about noxious odors and their concern about elevated cancer rates, DEC’s standard monitoring procedures failed to detect serious air-quality violations in a two-square mile area in which 50 factories abutted residential neighborhoods. When DEC did begin testing in earnest – after appealing to the EPA for monitoring equipment it could not afford on its own – they discov-ered elevated levels of formaldehyde and benzene, both known carcinogens.
Local groups who took testing upon themselves claim it took five years for New York regulators to formally identify Tonawanda Coke, a foundry coke and coal tar manufacturer in operation since 1917, as the source of the town’s air pollution. When federal regulators, mobilized by citizen complaints and DEC’s initial testing, finally targeted the facility as a source of environmental toxins, EPA-ordered monitoring equipment detected benzene emissions at a staggering 182,000 pounds per year, thirty times greater than the levels self-reported to regulators.
Alarmingly, this facility already amassed a long history of hazardous waste violations, specifically with regard to the carcinogen benzene, yet compliance with clean air laws was still left to an honor system.
DEC knew of Tonawanda Coke’s penchant for polluting be-cause land at their facility was classified as a Superfund site due to the widespread contamination by hazardous coke, tar, and light oil production byproducts – including benzene, phenols, and heavy metals. In fact, DEC investigation and soil sampling activities dated back more than 30 years to 1981. Yet this facility, whose operations were found to have thoroughly contaminated its own footprint, was allowed by DEC to continue with business as usual, entrusted to monitor and report its own compliance with air pollution controls.
After getting away with unchecked pollution for years until community members sickened by its toxic re-leases forced State and federal involvement, Tonawanda Coke was ultimately charged with 19 federal Clean Air Act and Resource Conservation and Recovery Act violations between 1998 and 2009. The company was found guilty of at least 14 of the charges, and today faces upwards of $200 million in fines as well as civil penalties. Citizen action – not government oversight – was needed to detect these serious violations.
DEC commissioner Joe Martens offered a dire prognosis for the DEC’s ability to maintain its regulatory pres-ence at Tonawanda Coke and around the state in an April 2013 news report. “You can’t believe them [indus-try] necessarily. That’s why you put in place things like monitoring systems so you have an indicator of what the industry is doing… Martens [went on to say that] his department hopes to keep the monitoring going but fiscal realities mean that may not last.”

15
Enforcement WoesAll FacilitiesEPA administrators consider a high violation rate as a sign of quality enforcement coverage that brings noncom-pliant facilities into the pipeline to correct environmentally harmful practices. In New York State, violations and enforcement actions have decreased substantially over the last four years across all classes of regulated facili-ties (Figure (6). For all permit holders, violations fell by 53% between 2009 and 2012, while citations for high priority violations and formal enforcement actions undertaken by the agency each fell by 50%.
Fewer staff are conducting fewer inspections and therefore identifying fewer violations. EPA’s criticism of low citation rates – criticism based on polluter patterns across the country – indicate the likelihood of dangerous violations being missed, with potentially serious consequences for neighboring communities.
Stack TestsAn important method for assessing air pollution emissions is the stack test. Stack tests measure the amount of a specific regulated pollutant, pollutants, or surrogate being emitted; demonstrates the efficiency of a capture system; or determines the destruction or removal efficiency of a control device. DEC’s 2010 Division of Air Re-sources Compliance and Enforcement Report states that stack tests are one of the most effective ways of deter-mining a facility’s compliance with emission limits as well as actual source emissions, but are very demanding on agency resources, often requiring staff to be at the facility to monitor tests as they are conducted. DEC and EPA data show consistent reductions in agency-led stack testing, resulting in a 44% decline since 2009 (Figure (7)). DEC’s ability to assert its regulatory presence in the field is crucial for compelling polluters to accurately report emissions, and fewer stack tests leave DEC blind to dangerous violations like those found at Tonawanda Coke and leave potential polluters without a cop on the beat.
DEC conducted 44% fewer stack tests to verify polluter self-reports in 2012 compared to 2009
Figure (6) change in regulatory actions for all CAA facilities 2009-2012
Figure (7) 44% stack testing decline
0
20
40
60
80
100
120
140
2009 2010 2011 2012
Figure (7) Stack Tests Reported
-‐60
-‐50
-‐40
-‐30
-‐20
-‐10
0
Facili/es with Full Compliance Evalua/ons
Facili/es with Alleged Violaitons
Facili/es with High Priority Viola/ons
Facili/es with Formal Enforcement Ac/ons
Figure () Change in Regulatory Ac5ons for all CAA Facili5es 2009-‐2012
16
Major FacilitiesWhile DEC’s Compliance Monitoring Strategy has led to a consistent number of Major air facilities receiving at least one inspection, federal data show a significant drop off in detected violations. Between 2009 and 2012 alleged violations by Major facilities decreased by nearly 60% and high priority violations decreased by 79%, with only four facilities – less than 1% – found to have seriously violated their permit conditions in 2012. Just as EPA suggests for all air permitted facilities, an oversight strategy that assesses few penalties may be failing to bring environmentally harmful processes into the regulatory system. Reduced levels of oversight staff along with the diminishing role of stack testing as a means of verifying polluter-produced reports may also be contrib-uting factors to decreased citations.
Recommendations• Maintain a strong inspection presence among permitted facilities
• Increase on-site testing for emissions including stack tests
• Identify root causes of why inspections are turning up fewer violations than in previ-ous years
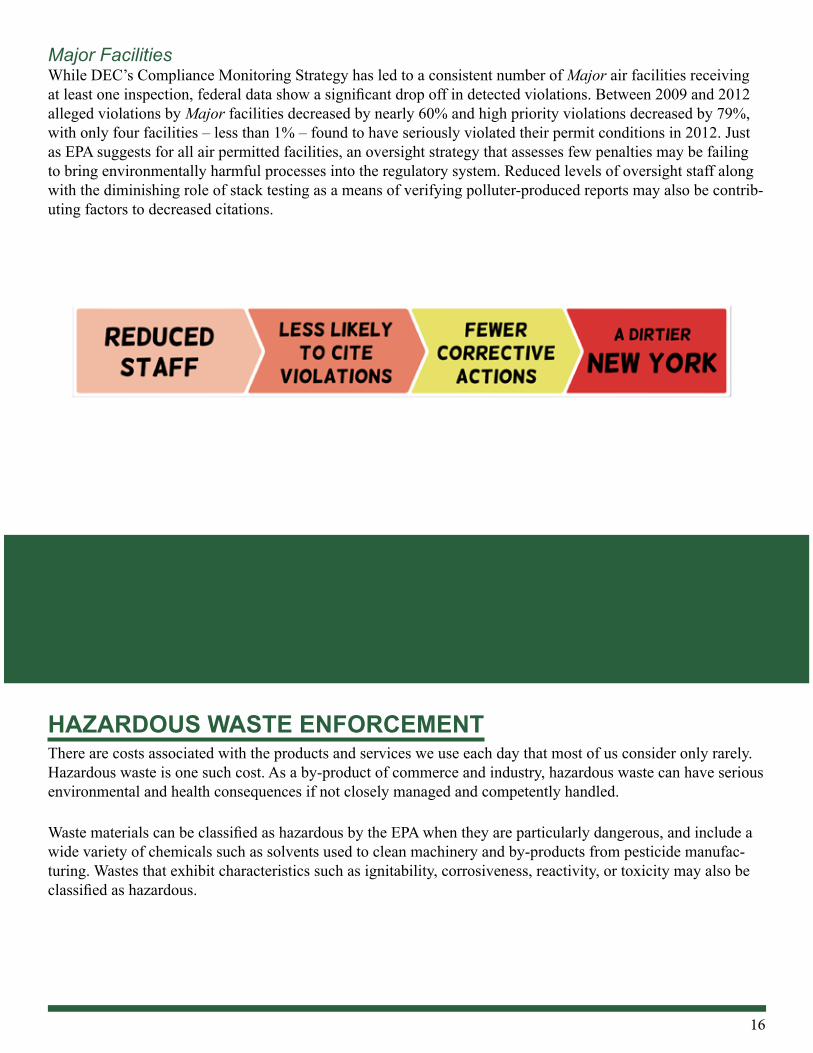
HAZARDOUS WASTE ENFORCEMENTThere are costs associated with the products and services we use each day that most of us consider only rarely. Hazardous waste is one such cost. As a by-product of commerce and industry, hazardous waste can have serious environmental and health consequences if not closely managed and competently handled.
Waste materials can be classified as hazardous by the EPA when they are particularly dangerous, and include a wide variety of chemicals such as solvents used to clean machinery and by-products from pesticide manufac-turing. Wastes that exhibit characteristics such as ignitability, corrosiveness, reactivity, or toxicity may also be classified as hazardous.

17
New York’s Hazardous Waste Control FrameworkEPA designates DEC, through the federal Resource Conservation Recovery Act (RCRA), to implement pro-grams that manage hazardous waste in New York State. In addition to issuing permits, DEC staff work with companies to improve processes so less waste is generated, and inspect facilities to ensure that hazardous waste generators, transporters, treatment, storage, and disposal facilities are compliant with environmental and public health regulations.
Facilities requiring hazardous waste permits range from large chemical manufacturers to hospitals, dry cleaners, and auto repair shops. EPA data indicate that there were over 24,000 permitted hazardous waste facilities and generators in New York State in 2012, of which just 869, or 3.5%, received inspections. Inspection coverage of this small scale all but ensures that some amount of hazardous waste will go mismanaged, possibly putting public health at risk. Furthermore, DEC inspections decreased 16% (from 936 to 869) between 2009 and 2012. DEC’s tiny inspection rate gives little reason for New Yorkers to believe the state is adequately ensuring com-pliance and protecting public safety and the environment.
DEC’s Staffing CutsDEC’s hazardous waste management programs lost 125 full time positions (18% of their employees) between SFY 2007-08 and SFY 2012-13. Despite conducting a paltry number of inspections to begin with, these re-ductions have further decreased DEC’s ability to put boots on the ground at these facilities. New York State data reported to EPA show across the board reductions in hazardous waste inspections, detected violations, and enforcement activities during this period of diminishing staff numbers.
Inspecting facilities that generate hazardous waste is resource intensive. Often, the same amount of staff effort is required to inspect a large facility that has the potential to significantly harm its surrounding community as is needed for a smaller facility in which violations would result in serious but more limited impacts.
Because they can only inspect a fragment of permitted facilities, DEC focuses its oversight on producers that generate more than 1,000 kg of hazardous waste or 1 kg of acutely hazardous waste per month as well as those facilities that treat waste to minimize its environmental threat or temporarily hold wastes for treatment or dis-posal. EPA data indicate that there were over 5,400 of these larger facilities and generators operating in New York in 2012, of which only 244, or 4.5%, received inspections. Again, DEC is not looking, so isn’t finding violations.
Enforcement WoesAll FacilitiesThe number of facilities inspected by DEC decreased from 936 in 2009 to 869 in 2012. In addition to fewer inspections, the number of new violations and new significant noncompliance violations decreased dramatically (by 31% and 68% respectively). DEC is inspecting hazardous waste facilities less frequently and is turning up far fewer violations than four years ago, finding only 9 hazardous waste facilities out of more than 24,000 to have seriously violated permit conditions in 2012.
96% of hazardous waste facilities went uninspected in 2012

18
-‐45% -‐40% -‐35% -‐30% -‐25% -‐20% -‐15% -‐10% -‐5% 0%
Facili/es with Inspec/ons
Facili/es with Viola/ons
Facili/es with Enforcement
Total Penal/es Assessed
Figure (%^&) % Change in Regulatory Ac8ons for Large RCRA Facili8es 2009-‐2012
Consistent with hazardous waste violation rates, DEC enforcement actions against permit violators declined between 2009 and 2012 (Figures (8) and (9)). Over this four year span, facilities subject to enforcement actions declined by 32% from 453 to just 308 out of more than 24,000 permit holders in New York. Fewer inspections are leading to fewer violations uncovered and fewer enforcement actions undertaken. While EPA has been critical of low DEC penalty levels in the past, penalties assessed to all hazardous waste permitted facilities fell by 41% to a four year low of $285,000 in 2012. The last four years has seen significant DEC staff reductions coupled with significant reductions in hazardous waste compliance and enforcement actions.
Major FacilitiesStaff reductions have taken their toll on the state’s oversight of large hazardous waste facilities and generators as well. These facilities, targeted by regulators because of the large amounts of hazardous waste they generate or handle, were already receiving scant attention in 2009 when only 290 out of more than 5,400 permit holders were inspected. According to EPA, DEC inspected 16% fewer (244 total) of these large facilities in 2012. While both of these numbers are low, cutting inspections by 16% further undermines DEC’s ability to protect the pub-lic from violations by some of the state’s biggest potential polluters. Further compounding this low inspection rate, EPA data also show that violations by Major facilities and generators fell by 36%, including a 71% drop off in facilities cited for significant violations which fell to just 5 in 2012 (Figure (10).
Figure (8) RCRA informal enforcement actions Figure (9) RCRA formal enforcement actions
Figure (10) drops in oversight of large RCRA facilities between 2009-2012 by percentage
250
300
350
400
450
2009 2010 2011 2012
Figure (*) RCRA informal enforcement ac6ons
0
10
20
30
40
50
2009 2010 2011 2012
Figure (!!) RCRA formal enforcement ac6ons
Violations and enforcement actions have declined dramatically from 2009 to 2012, but EPA con-cerns indicate this is likely a sign of violations being missed, not of greater compliance

19
Recommendations• Increase inspection presence to better compel compliance
• Identify root causes of why inspections are turning up fewer violations than in previ-ous years
• Introduce random reviews of small quantity generators who fall outside the scope of targeted facilities for inspection
REGULATORY ROLLBACKS DEC Self Audit PolicyDEC relies heavily on facilities self-reporting their emission levels to determine compliance with environmental laws. This arrangement places the onus on permit holders to voluntarily disclose violations, some of which can be costly to correct. A prime example of this dependence on voluntary disclosure is the Discharge Monitoring Report, which is re-quired under state water discharge permits to confirm that effluent releases comply with permitted levels. While the agency has made policy changes to increase the timely submittal of Discharge Monitoring Reports, verify-ing their accuracy requires a commitment of staff and resources that budget cuts have taken away. As a result, DEC introduced new policy changes that provide additional incentives for disclosing violations, rather than directly monitoring and enforcing state law. In early 2013, DEC issued its Final Environmental Audit Incentive Policy with the goal of giving modest permit violators the opportunity to correct self-identified violations on their own. The policy offers penalty avoidance incentives that are intended to compel violators to approach DEC with admissions of violations. The new policy replaces DEC’s Small Business Self-Disclosure Policy by significantly expanding eligibility from small, independently owned businesses employing fewer than 100 people to include large-scale and high-risk permitted activities such as oil and gas drilling operations. The only eligibility restriction explicitly placed on participants is they cannot have previously committed the most severe violations or have a history of violat-ing the specific infraction that they are now attempting to self-audit. While the program’s goal is to complement enforcement initiatives and increase compliance with environmen-tal laws, more staff time may be tied up in executing self-audit agreements than would have been expended conducting traditional enforcement activities. Moreover, self-disclosed violations and corrective prescriptions imposed by DEC that are currently publicized may never see the light of day as companies cut deals without any public disclosure. While multiple organizations used the policy’s comment period to call for DEC to regularly post self-audit agreements as well as consent orders on its website for public inspection, the final policy only requires the DEC Office of General Counsel to “periodically report on the progress made under the policy, including the number of entities who have participated and the type and number of violations reported and corrected.” The bottom line, however, is that self-auditing policies are not an adequate replacement for direct monitoring by DEC and asking violators to step forward and admit guilt when they have little fear of being caught does not bode well for New York’s public health, safety, or environment.

20
Yogurt-Induced CAFO RollbacksIn August, 2012, Governor Cuomo announced a suite of proposals with the purported goal of helping grow New York’s burgeoning yogurt industry. One major proposal was a weakening of water-protection regulations on dairy CAFOs, or factory farms.
At the time, CAFOs with fewer than 200 cows were exempted from SPDES permit requirements. The Gover-nor proposed shifting the exemption up to CAFOs with fewer than 300 cows, a move he finalized in May 2013. While this may seem to be a small regulatory shift, 299 cows generate as much waste each day as around 9,000 people – making them a significant water pollution source if not properly managed.
Prior to the governor’s decision, New York had protected water bodies from CAFO pollution by requiring facilities with more than 200 cows to comply with one of two distinct general permits: one authorized under the State’s delegated Clean Water Act authority, and one under New York’s Environmental Conservation Law (ECL). In early 2013, the state ended the ECL permitting requirement for dairy CAFOs with between 200-299 cows, with the stated goal of reducing costs for these operations and thereby promoting growth within the dairy industry.
The purpose of the permits is to ensure CAFOs implement manure management practices that protect New York’s waterways. Manure increases the amount of nutrients (like phosphorus) and pathogens (like E. coli) in streams and rivers. When nutrient levels reach a tipping point, they can trigger rapid algae growth that sucks oxygen out of the water and throttles aquatic ecosystems. High levels of manure in waterways can lead to fish kills and vegetation die-off.
Pathogens, on the other hand, can lead to illness for anyone who comes into contact with polluted waters, put-ting anglers and swimmers at risk. The main permitting requirement used to protect against such water quality risks is the production and implementation of a certified nutrient management plan (CNMP) that is specific to the individual circumstances of each CAFO.
Having and implementing a facility-specific CNMP is one of the best ways for a CAFO to operate responsibly. Each cow produces 120 pounds of wet manure/day on average, the same amount produced by 20-40 people. CNMPs include manure management actions that will keep the release of manure, whether direct or indirect (such as when heavy rain washes manure out of concentration yards and into nearby streams), below set goals.
If the costs of implementing these actions are not borne by the facility as a cost of business, they are passed on to others, perhaps in the form of a water body being placed on a DEC impairment list which requires costly res-toration. In some cases it will be taxpayers who have to pick up the tab. In others, it will be neighbors or down-stream farms forced to live with the impacts of uncontrolled pollution.
Under the new regulations, the CAFO operator is no longer responsible for properly managing the waste for an additional 100 cows through a CNMP. Imagine giving a similar pass to a campground owner who doesn’t want to keep the waste from 2,000-4,000 campers from washing into a nearby stream every day.
While there may be some CAFOs in need of compliance assistance or relaxed compliance schedules in order to grow their herds, rolling back the entire program creates far more problems than it solves. DEC defines Animal Feeding Operations as agricultural enterprises where animals are kept and raised in confined situations. These facilities congregate animals, feed, manure, urine, dead animals, and production operations on a small land area.

21
Taking these dirty operations “off the grid” so they can expand absent State oversight is a dubious tradeoff of water quality for Greek yogurt. A better approach would be to develop programs to help dairy CAFOs grow while still meeting vital clean water standards, not just lowering the standards and hoping for the best.
The Final Environmental Impact Statement for this regulatory attack claims that all will be well because of enforcement provisions already contained in the ECL. These provisions prohibit discharges that cause or con-tribute to “a condition of contravention” of water quality standards, giving DEC the authority to bring enforce-ment actions after the water’s quality has been compromised. The statement goes on to assert that “In light of this potential liability it is expected that farms would institute practices that would prevent discharges that could impair water quality.”
And therein lies the problem. After lifting the ECL permit requirement, the governor has left water protection to misplaced optimism. Proving that a CAFO is responsible for water pollution is incredibly difficult, as the pol-lution is often episodic, such as following heavy rains. Water samples must be taken by certified DEC staff, but low staffing numbers can leave days between a heavy pollution event and an official visit.
Recognizing the nature of CAFO pollution, DEC created a permitting program that relies not on effluent limits, as most water pollution permits do, but on preventative practices that when properly implemented prevent waste from causing pollution in the first place. But because of the governor’s actions, that program has been scrapped for facilities with up to 299 cows.
DEC has eliminated the need for hundreds of CAFOs to have permit coverage without having done anything to eliminate their potential to pollute. The administration points to a potluck of funding increases for various programs offering nutrient management assistance for voluntary upgrades in lieu of permits, but the two ap-proaches should not be mutually exclusive. Without a permit and associated CNMP requirement, there is no enforceable mechanism that New Yorkers can rely upon to ensure that these facilities will manage their manure in a way that protects our waterways and public health.
The administration made a decision to cut costs for polluting CAFOs and roll the dice with the environmental consequences to neighboring communities. Nowhere in the environmental impact statement for the increased CAFO exemption threshold does DEC argue that CAFOs with 200-299 cows do not have the potential to sig-nificantly pollute our waterways.

22
CONCLUSIONAs this report clearly shows, New Yorkers cannot afford the double-edged sword of rolling back protections to benefit industry, while also undermining the ability of DEC staff to hold polluters to the remaining protection standards.
The enforcement of New York’s environmental laws is on the decline. And fiscal storm clouds are gathering on the horizon, which could make a bad situation even worse.
The federal government’s sequester is having an impact on the DEC now. And at the beginning of the budgeting process for SFY 2014-15, there were rumblings that State agencies were being directed to look for more opera-tional savings, possibly to the extent of 10% cuts over the next two years.
Further cuts would have a profound impact on DEC’s ability to inspect facilities, issue violations, assess penal-ties, and ensure compliance with hard-fought environmental laws that protect our communities and health.
Currently, enforcement efforts are heavily weighted towards the review of polluter-produced compliance reports with agency testing and overall field presence on the decline. More staff and resources are needed for DEC to re-establish an enforcement presence that compels compliance.
But Governor Cuomo has a chance to turn this ship around. In addition to the general recommendations includ-ed at the beginning of this report, during the coming year, the Governor should:
• Bolster clean water, clean air, and hazardous waste regulatory programs in DEC.
• Build stronger programs to help CAFOs meet critical clean water standards.
• Reopen previously public files on violations and enforcement actions to help build public confidence that his administration truly is committed to protecting our health, safety, and environment.

23
Endnotes
1. http://www2.epa.gov/nutrientpollution/harmful-algal-blooms
2. General SPDES permits are issued to categories of discharges rather than the outputs of specific facilities as is the case with indi- vidual SPDES permits.
3. DEC was uncooperative in responding to requests for further breakdowns of staffing by division and bureau. 4. http://www.dec.ny.gov/docs/water_pdf/2011annualrpt.pdf
5. Environmental Advocates of New York. Muddying the Water: The Unknown Consequences of New York’s Failed Water Pollution Permit Program.2007. ; Environmental Advocates of New York. Permission to Pollute. 2008.
6. CO 4-20091123-154
7. http://www.timesunion.com/business/article/DEC-won-t-fine-Rensselaer-district-over-sewage-4601921.php
8. Id.
9. NYS Department of Environmental Conservation: SPDES Compliance and Enforcement Annual Report for SFY 2011/12
10. Id
11. EANY Defending Drinking Water: Agency in Crises: New York’s Department of Environmental Conservation
12. NYS DEC SPDES Compliance and Enforcement Annual Report April 1, 2008-March 31, 2009.
13. Sarah Crean. Exclusive: Proposed policy would allow industries to self-audit pollution-generating activities. Gotham Gazette. May 24, 2012.
14. New York State Department of Health 2009 New York State Asthma Surveillance Summary Report
15. http://www.stateoftheair.org/2013/states/new-york/
16. http://www.publicintegrity.org/2011/11/10/7355/where-regulators-failed-citizens-took-action-testing-their-own-air 17. http://www.publicintegrity.org/2013/06/18/12839/clean-air-case-yields-rare-criminal-convictions-new-york
18. Id.
19. http://www.dec.ny.gov/cfmx/extapps/derexternal/haz/details.cfm
20. http://news.wbfo.org/post/dec-leader-tours-areas-around-tonawanda-coke
21. http://www.epa.gov/oaqps001/permits/permitupdate/brochure.html#what
22. http://www.dec.ny.gov/chemical/8397.html
23. http://iaspub.epa.gov/triexplorer/tri_broker_statefs.broker?p_view=STCO&trilib=TRIQ1&state=NY&SFS=YES&-year=2010
24. DOB Exec Budget Agency Presentations
25. NYS DEC Division of Air Resources, Compliance and Enforcement Summary 2010.
26. U.S. EPA Releases Enforcement Performance Dashboards and Comparative Maps Webinar
27. US EPA Clean Air Act National Stack Testing Guidance. April, 2009.
28. NYS DEC Division of Air Resources, Compliance and Enforcement Summary 2010.
29. http://www.epa-echo.gov/echo/stateperformance/comparative_maps.html
30. DEC was uncooperative in providing staff breakdowns by division and bureau
31. US EPA. Office of Waste Programs Enforcement RCRA Enforcement Division. REVISED RCRA INSPECTION
MANUAL. Nov. 1998
32. New York State Assembly Audit and Investigation of Department of Environmental Conservation 2001
33. EPA. Incentives for Self Policing: Discovery, Disclosure, Correction and Prevention of Violations. April, 2000.
34. DEC Environmental Audit Incentive Policy
35. EPA Region 9 webpage, “What’s the Problem?” http://www.epa.gov/region9/animalwaste/problem.html
36. Karen DeWitt, North Country Public Radio August 16, 2012 Cuomo Eases Dairy Regulations To Help Grow Yogurt Industry. 37. Final Environmental Impact Statement Dairy Industry Rulemaking Proposed Action
38. Final Environmental Impact Statement Dairy Industry Rulemaking Proposed Action p.15.

353 Hamilton Street Albany, NY 12210 Tel 518.462.5526
Fax 518.427.0381 www.eany.org [email protected]