
Tunisia - PCR - Electricity Distribution Network Rehabilitation
30
AFRICAN DEVELOPMENT BANK ______________________________________________________________________________________________ COMPLETION REPORT MARCH 2012 REPUBLIC OF TUNISIA ELECTRICITY DISTRIBUTION NETWORK REHABILITATION PROJECT (ELECTRICITY VII)
Transcript of Tunisia - PCR - Electricity Distribution Network Rehabilitation
AFRICAN DEVELOPMENT BANK
______________________________________________________________________________________________
COMPLETION REPORT
MARCH 2012
REPUBLIC OF TUNISIA
ELECTRICITY DISTRIBUTION NETWORK REHABILITATION PROJECT (ELECTRICITY VII)
1
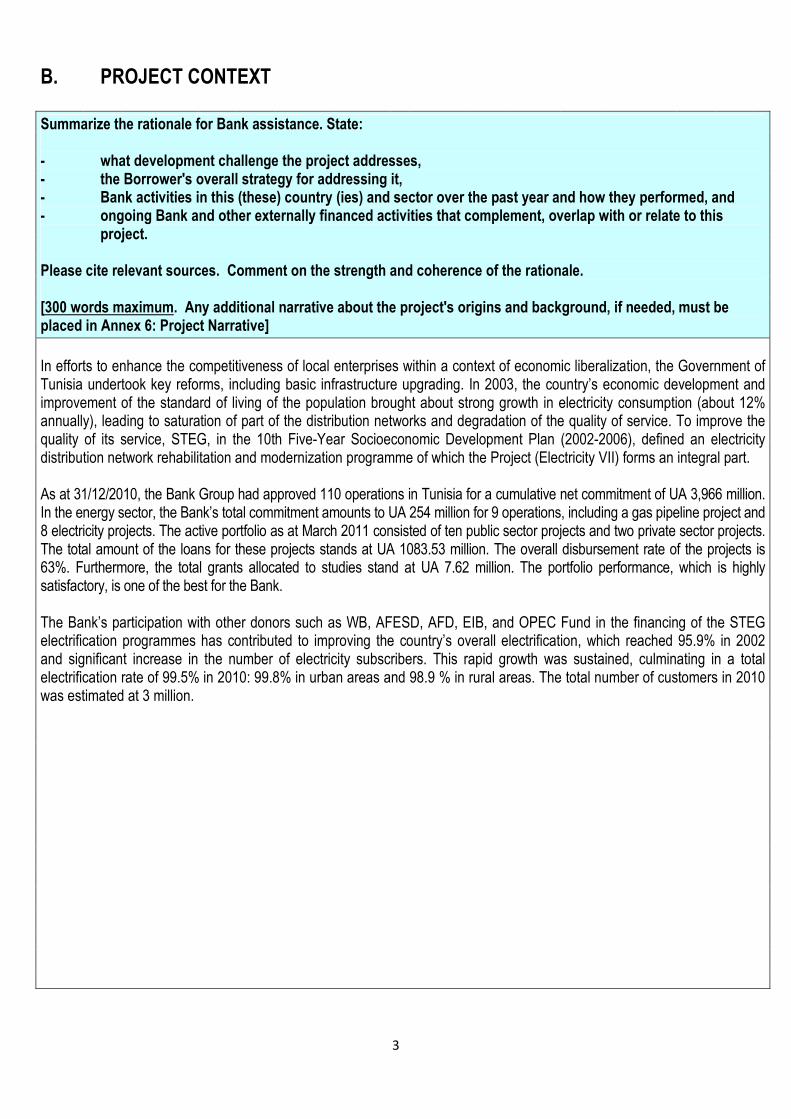
PROJECT COMPLETION REPORT (PCR) A. PROJECT DATA AND KEY DATES I. BASIC INFORMATION
Project Number Project Name Country (ies)
P-TN-FAC-002
ELECTRICITY DISTRIBUTION NETWORK REHABILITATION
PROJECT (ELECTRICITY VII)
TUNISIA
Lending Instrument(s) Department Environmental Classification
ADB Loan No. 2000130000120 ONEC Category 2
Original Commitment Amount Amount Cancelled Amount Disbursed % Disbursed
UA 64.085 million Or EUR 77.15 million
No amount was cancelled. The balance is being used for new procurements
UA 60.553 million or EUR 72.897 million
94.5%
Borrower
SOCIETE TUNISIENNE DE L'ELECTRICITE ET DU GAZ (ELECTRICITY AND GAS COMPANY OF TUNISIA - STEG) – LOAN GUARANTEED BY TUNISIAN GOVERNMENT
Executing Agency(ies) [List the main Ministries, Project Implementation Units, Agencies and civil society organizations responsible for implementing project activities.]
SOCIETE TUNISIENNE DE L'ELECTRICITE ET DU GAZ (STEG)
Co-financiers and other External Partners [List all other sources and amounts of financing, technical assistance or other resources used in this project]
Equity capital of STEG: TND 26.209 million
II. KEY DATES
Project Concept Note Cleared by Ops. Com.
Appraisal Report Cleared Board Approval
4/09/2003 4/11/2003 10/12/2003
Restructuring(s)
N/A
Original Date MM/DD/YY
Actual Date MM/DD/YY
Difference in months
EFFECTIVENESS - 21/02/2005 0.0
MID-TERM REVIEW N/A N/A 0.0

2
CLOSING 31/12/2008
For active projects enter date of 98% disb. rate 24
31/12/2010
III. RATINGS SUMMARY Insert scores from the relevant tables in the different sections of the PCR. For example, insert the “Overall Output score” in Section D.I. in the “Achievement of Outputs” box below
CRITERIA SUB-CRITERIA RATING
PROJECT OUTCOME
Achievement of Outputs (cf. score from Section D.I.) 4
Achievement of Outcomes (cf. score from Section D.II) 4
Timeliness (cf. score from Section F.4) 2
OVERALL PROJECT PERFORMANCE (Score is calculated as an average of the ratings)
3
BANK PERFORMANCE
Design and Readiness (cf. score from Section I.I) 4
Supervision (cf. score from Section I.I) 3
OVERALL BANK PERFORMANCE [Score is calculated as an average of the ratings]
4
BORROWER PERFORMANCE
Design and Readiness (cf. score from Section I.I) 4
Implementation (cf. score from Section I.I) 3
OVERALL BORROWER PERFORMANCE [Score is calculated as an average of the ratings]
4
IV. RESPONSIBLE BANK STAFF
POSITIONS AT APPROVAL AT COMPLETION
Regional Director J. KOLSTER
Sector Director K. BEDOUMRA H. CHEIKHROUHOU
Sector Manager N. MATONDO-FUNDANI V. ZONGO
Task Manager N. MATONDO-FUNDANI P. DJAIGBE
PCR Team Leader P. DJAIGBE
PCR Team Members
A. MOUSSA (ONEC.1) and H. ESSEBAA, Electrical Engineer and Consultant
3
B. PROJECT CONTEXT
Summarize the rationale for Bank assistance. State: - what development challenge the project addresses, - the Borrower's overall strategy for addressing it, - Bank activities in this (these) country (ies) and sector over the past year and how they performed, and - ongoing Bank and other externally financed activities that complement, overlap with or relate to this project. Please cite relevant sources. Comment on the strength and coherence of the rationale. [300 words maximum. Any additional narrative about the project's origins and background, if needed, must be placed in Annex 6: Project Narrative]
In efforts to enhance the competitiveness of local enterprises within a context of economic liberalization, the Government of Tunisia undertook key reforms, including basic infrastructure upgrading. In 2003, the country’s economic development and improvement of the standard of living of the population brought about strong growth in electricity consumption (about 12% annually), leading to saturation of part of the distribution networks and degradation of the quality of service. To improve the quality of its service, STEG, in the 10th Five-Year Socioeconomic Development Plan (2002-2006), defined an electricity distribution network rehabilitation and modernization programme of which the Project (Electricity VII) forms an integral part. As at 31/12/2010, the Bank Group had approved 110 operations in Tunisia for a cumulative net commitment of UA 3,966 million. In the energy sector, the Bank’s total commitment amounts to UA 254 million for 9 operations, including a gas pipeline project and 8 electricity projects. The active portfolio as at March 2011 consisted of ten public sector projects and two private sector projects. The total amount of the loans for these projects stands at UA 1083.53 million. The overall disbursement rate of the projects is 63%. Furthermore, the total grants allocated to studies stand at UA 7.62 million. The portfolio performance, which is highly satisfactory, is one of the best for the Bank. The Bank’s participation with other donors such as WB, AFESD, AFD, EIB, and OPEC Fund in the financing of the STEG electrification programmes has contributed to improving the country’s overall electrification, which reached 95.9% in 2002 and significant increase in the number of electricity subscribers. This rapid growth was sustained, culminating in a total electrification rate of 99.5% in 2010: 99.8% in urban areas and 98.9 % in rural areas. The total number of customers in 2010 was estimated at 3 million.

4
C. PROJECT OBJECTIVE AND LOGICAL FRAMEWORK
1 State the Project Development Objective(s) (as set out in the appraisal report)
The sector goal of the project is to meet the country’s electricity demand at least-cost under the most reliable and safe conditions, and contribute to the competitiveness of companies and the economy by upgrading and modernizing power infrastructure.
The project’s specific objectives were to improve food security, customer service quality, the safety of STEG staff and third parties, environmental protection and bring the distribution network operating costs under control. This was expected to enhance the performance and reliability of the power distribution network. It was to contribute to: (i) reducing the number and duration of failures, duration of faults and power supply outages (from 360 min. in 2002 to 264 min. by 2006 for MT and 444 min. in 2002 to 296 min. by 2006 for LT); (ii) reducing the number, frequency and gravity of accidents involving STEG employees and third parties; (iii) environmental improvement; and (iv) reducing losses, voltage drops, undistributed power (from 11 GWh in 2002 to 7.6 GWh by 2006) and the power distribution network operating and maintenance costs.
2. Describe the major project components and indicate how each will contribute to achieving the Project Development Objective(s)
The project comprises five (5) main components: (i) construction of new infrastructure; (ii) rehabilitation of the MT networks; (iii) rehabilitation of the LT networks; (iv) procurement of equipment and resources for studies and operations, and (v) engineering designs, works supervision and control.
a. Construction of New Infrastructure
This component entails the construction of new infrastructure to enhance supply security in industrial, agricultural and tourist areas, as well supply to new residential areas. The new infrastructure was expected to reduce the load on existing lines through better distribution of power between the old and new lines, thereby curbing voltage drops.
b. Rehabilitation of MT Networks
This component involves the rehabilitation and renewal of 10 kV, 15 kV and 30 kV links. It involves an improvement of the physical state of MT structures in terms of their mechanical solidity and the replacement of overhead lines in urban areas with underground cables, thereby creating a positive impact on the environment and the safety of the people.
c. Rehabilitation of LT Networks
This component consists of the overhaul of LT networks, the renewal of existing MT/LT distribution substations, and the construction and equipping of new substations. The impact of these actions would be directly perceived by the customers concerned mainly in terms of the quality of supply voltage
d. Procurement of Equipment and Resources for Studies and Operations
This component entails the procurement of 40 computers and special engineering software, 40 printers and a batch of testing and measuring apparatus, a digital protection set, 6 mobile cabins, 6 cable failure search vans, 6 trucks equipped for live MT line works and 6 live line insulator washing trucks. It also includes training of the technical staff of the STEG Studies and Operations Department who will also use the equipment. These procurement activities will help build the capacity of STEG to conduct studies, as well as maintain and repair the installations. Thus, these activities will ensure sustainability of the project.
e. Engineering Studies, Works Supervision and Control
This component entails conducting engineering studies and monitoring the works, which will be entirely executed by STEG. The studies will be conducted by engineers and technicians from engineering and works departments drawn from various districts and regions concerned by the project.
3. Provide a brief assessment (up to two sentences) of the project objectives along the following 3 dimensions. Insert a working score, using the scoring scale provided in Appendix 1.

5
PROJECT OBJECTIVES DIMENSIONS APPRAISAL WORKING SCORE
RELEVANT a) Relevant to the country's development priorities
The project objectives are relevant. The reduction in the number and duration of power outages enables economic agents to optimize the use of their installations and spread their fixed costs over larger production. Maintaining the voltage within its contractual limits protects equipment from pre-mature aging, and thereby reduces the operating costs. These two actions contribute to reducing the production costs of goods and services produced, thereby improving their competiveness.
4
ACHIEVABLE
b) Objectives could in principle be achieved with the project inputs and in the expected timeframe
The objectives were all achievable within the three years originally set. All the achievements exceeded the original objectives, resulting in a balance on the loan resources despite the differences in implementation periods.
4
CONSISTENT
c) Consistent with the Bank's country or regional strategy
The project is consistent with the Bank’s strategy to provide support to the Government in the implementation of the 10th Five-Year Plan (2002-2006) aimed at accelerated economic growth and employment creation through enhanced competitiveness of the country’s enterprises.
4
d) Consistent with the Bank's corporate priorities
The project is consistent with the Bank’s priorities set out in the CSP, in particular: (i) strengthening of economic infrastructure, (ii) strengthening of productive sectors, and (iii) private sector development.
4
4. Summarize the logical framework. If a logical framework does not exist, complete the table below, indicating the overall project development objective, the major components of the project, the major activities of each component and their expected outputs, outcomes, and indicators for measuring the achievement of outcomes. Please insert additional rows for components, activities, outputs or outcomes, if needed.
PROJECT LOGICAL FRAMEWORK
Hierarchy of Objectives (HO) Objectively Verifiable Indicators (OVIs)
Means of Verification (MOV) Assumptions and Risks
Sector Goal: 1. Meet the country’s electricity
demand at least-cost under the most
reliable and safe conditions, and
contribute to the competitiveness of
companies and the economy by
upgrading and modernizing power
infrastructure.
1.1 Continuous power availability
1.2 Reduce energy production costs.
1.1 Reports from the Ministry of
Industry and Energy; 1.2 STEG annual activity reports.
(Sector goal to overall goal)
6
Project Objectives:
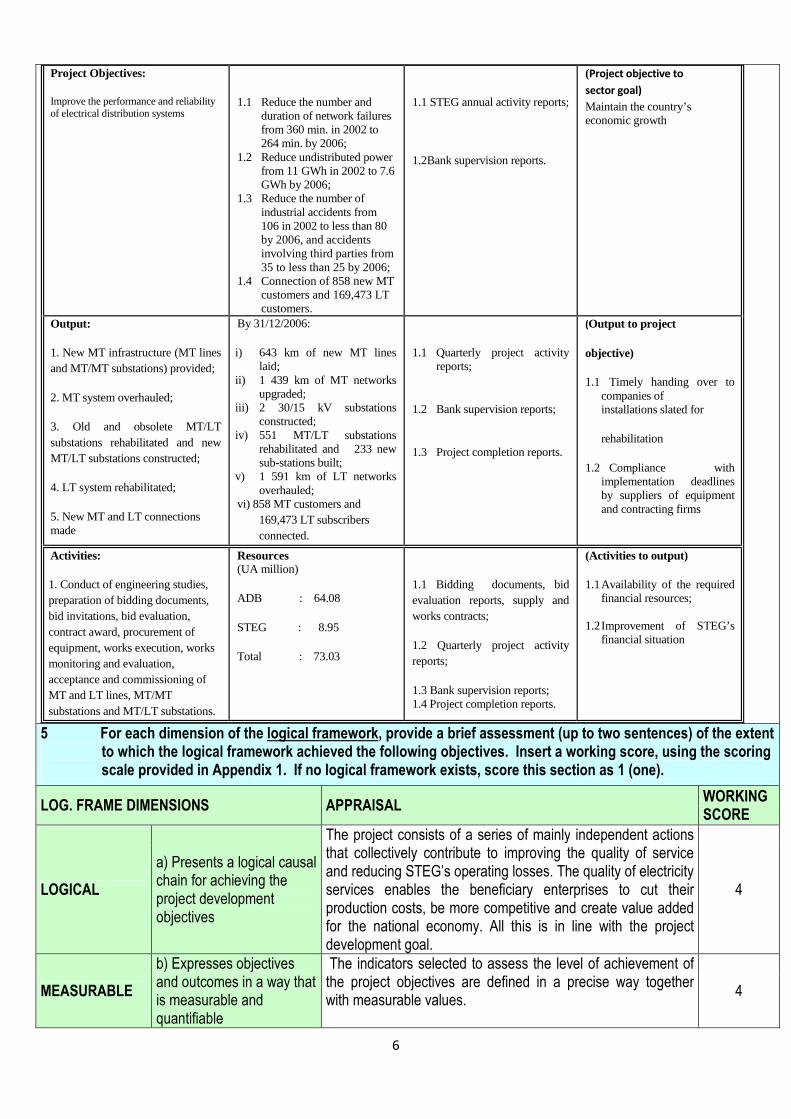
Improve the performance and reliability of electrical distribution systems
1.1 Reduce the number and duration of network failures from 360 min. in 2002 to 264 min. by 2006;
1.2 Reduce undistributed power from 11 GWh in 2002 to 7.6 GWh by 2006;
1.3 Reduce the number of industrial accidents from 106 in 2002 to less than 80 by 2006, and accidents involving third parties from 35 to less than 25 by 2006;
1.4 Connection of 858 new MT customers and 169,473 LT customers.
1.1 STEG annual activity reports;
1.2Bank supervision reports.
(Project objective to
sector goal)
Maintain the country’s economic growth
Output:
1. New MT infrastructure (MT lines and MT/MT substations) provided;
2. MT system overhauled;
3. Old and obsolete MT/LT substations rehabilitated and new MT/LT substations constructed;
4. LT system rehabilitated;
5. New MT and LT connections made
By 31/12/2006:
i) 643 km of new MT lines laid;
ii) 1 439 km of MT networks upgraded;
iii) 2 30/15 kV substations constructed;
iv) 551 MT/LT substations rehabilitated and 233 new sub-stations built;
v) 1 591 km of LT networks overhauled;
vi) 858 MT customers and 169,473 LT subscribers connected.
1.1 Quarterly project activity reports;
1.2 Bank supervision reports;
1.3 Project completion reports.
(Output to project
objective)
1.1 Timely handing over to companies of installations slated for
rehabilitation
1.2 Compliance with implementation deadlines by suppliers of equipment and contracting firms
Activities:
1. Conduct of engineering studies, preparation of bidding documents, bid invitations, bid evaluation, contract award, procurement of equipment, works execution, works monitoring and evaluation, acceptance and commissioning of MT and LT lines, MT/MT substations and MT/LT substations.
Resources (UA million)
ADB : 64.08
STEG : 8.95
Total : 73.03
1.1 Bidding documents, bid evaluation reports, supply and works contracts;
1.2 Quarterly project activity reports;
1.3 Bank supervision reports; 1.4 Project completion reports.
(Activities to output)
1.1 Availability of the required financial resources;
1.2 Improvement of STEG’s financial situation
5 For each dimension of the logical framework, provide a brief assessment (up to two sentences) of the extent to which the logical framework achieved the following objectives. Insert a working score, using the scoring scale provided in Appendix 1. If no logical framework exists, score this section as 1 (one).
LOG. FRAME DIMENSIONS APPRAISAL WORKING SCORE
LOGICAL
a) Presents a logical causal chain for achieving the project development objectives
The project consists of a series of mainly independent actions that collectively contribute to improving the quality of service and reducing STEG’s operating losses. The quality of electricity services enables the beneficiary enterprises to cut their production costs, be more competitive and create value added for the national economy. All this is in line with the project development goal.
4
MEASURABLE
b) Expresses objectives and outcomes in a way that is measurable and quantifiable
The indicators selected to assess the level of achievement of the project objectives are defined in a precise way together with measurable values.
4

7
THOROUGH c) States the risks and key assumptions
The logical framework clearly stated the risks and assumptions for their mitigation. Two risks were noted: i) timely handing over of installations earmarked for rehabilitation to companies: most of such installations were in operation; ii) Compliance by suppliers and contracting firms with implementation deadlines. Overall, the logical framework was thorough.
4
D. OUTPUTS AND OUTCOMES
I. ACHIEVEMENT OF OUTPUTS
In the table below, assess the achievement of actual vs. expected outputs for each major activity. Import the expected outputs from the log. frame in Section C. Score the extent to which the expected outputs were achieved. Weight the scores by the activities' approximate share of project costs. Weighted scores are auto-calculated by the computer. The overall output score must be calculated as the sum of the weighted scores. Override the calculated score, if desired, and provide justification.
MAJOR ACTIVITIES Working Score
Share of Project Costs in Percentage
(as mentioned in the Appraisal Report)
Weighted Score
Expected Outputs Actual Outputs
643 km of new MT networks (227 km underground and 416km overhead)
1404.6 km of new MT networks constructed (801.25 km underground and 603.55 km overhead)
4 16.6% 0.664
Two 30/15 kV substations 0 1 3.,3% 0 .033
1,439 km of MT networks (212 km underground and 1227 overhead) rehabilitated
1615.2 km of MT networks renovated or rehabilitated
4 32.7% 1.308
233 new MT/LT substations 395 MT/LT substations constructed
4 39.9%
1.596 551 MT/LT sub-stations renovated
1,290 MT/LT substations overhauled and/or equipped
1591 km of LT networks 1793.86 km of LT networks renovated or rehabilitated
Procurement of equipment and resources for engineering studies and operations
Equipment and resources for engineering studies provided to operational units
4 5.8% 0.232
Engineering studies Engineering studies and bidding documents, completion and audit reports
4 1.7% 0.068
OVERALL OUTPUT SCORE [Score is calculated as the sum of weighted scores]
3,9
Check here to override the calculated score
Provide justification for over-riding the calculated score
Insert the new score or re-enter the calculated score 3,9
8
II. ACHIEVEMENT OF OUTCOMES
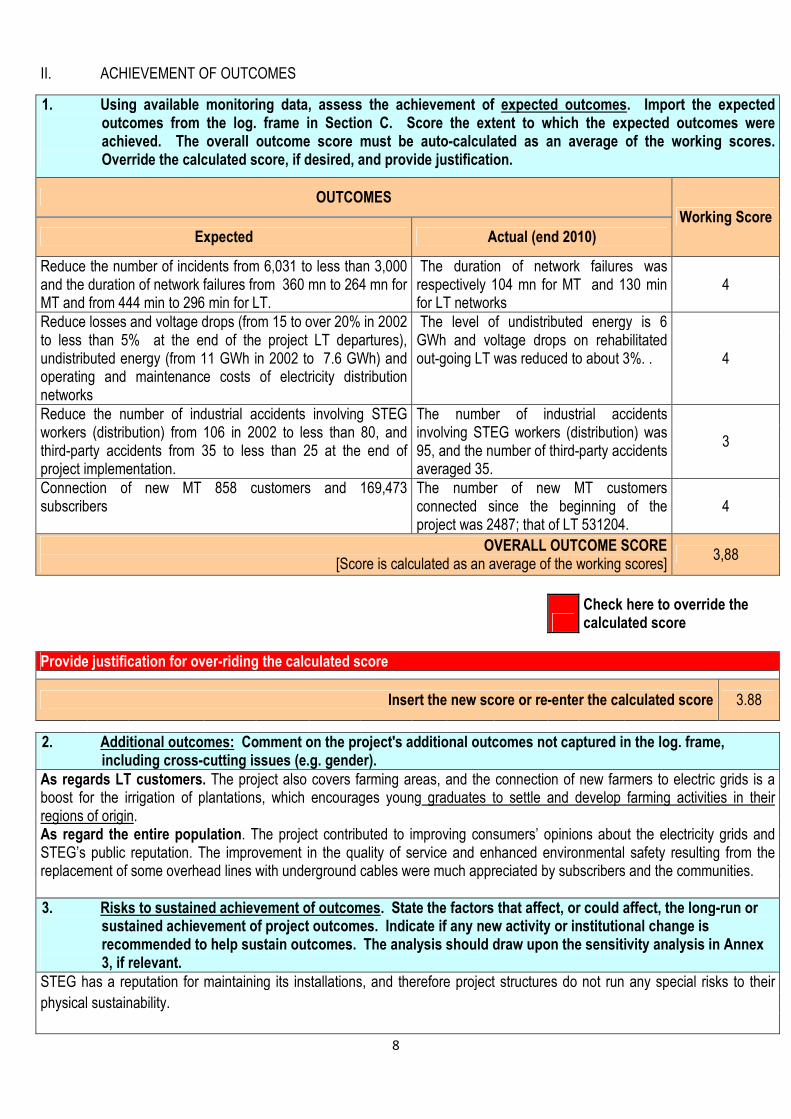
1. Using available monitoring data, assess the achievement of expected outcomes. Import the expected outcomes from the log. frame in Section C. Score the extent to which the expected outcomes were achieved. The overall outcome score must be auto-calculated as an average of the working scores. Override the calculated score, if desired, and provide justification.
OUTCOMES
Working Score
Expected Actual (end 2010)
Reduce the number of incidents from 6,031 to less than 3,000 and the duration of network failures from 360 mn to 264 mn for MT and from 444 min to 296 min for LT.
The duration of network failures was respectively 104 mn for MT and 130 min for LT networks
4
Reduce losses and voltage drops (from 15 to over 20% in 2002 to less than 5% at the end of the project LT departures), undistributed energy (from 11 GWh in 2002 to 7.6 GWh) and operating and maintenance costs of electricity distribution networks
The level of undistributed energy is 6 GWh and voltage drops on rehabilitated out-going LT was reduced to about 3%. . 4
Reduce the number of industrial accidents involving STEG workers (distribution) from 106 in 2002 to less than 80, and third-party accidents from 35 to less than 25 at the end of project implementation.
The number of industrial accidents involving STEG workers (distribution) was 95, and the number of third-party accidents averaged 35.
3
Connection of new MT 858 customers and 169,473 subscribers
The number of new MT customers connected since the beginning of the project was 2487; that of LT 531204.
4
OVERALL OUTCOME SCORE [Score is calculated as an average of the working scores]
3,88
Check here to override the calculated score
Provide justification for over-riding the calculated score
Insert the new score or re-enter the calculated score 3.88
2. Additional outcomes: Comment on the project's additional outcomes not captured in the log. frame, including cross-cutting issues (e.g. gender).
As regards LT customers. The project also covers farming areas, and the connection of new farmers to electric grids is a boost for the irrigation of plantations, which encourages young graduates to settle and develop farming activities in their regions of origin. As regard the entire population. The project contributed to improving consumers’ opinions about the electricity grids and STEG’s public reputation. The improvement in the quality of service and enhanced environmental safety resulting from the replacement of some overhead lines with underground cables were much appreciated by subscribers and the communities.
3. Risks to sustained achievement of outcomes. State the factors that affect, or could affect, the long-run or sustained achievement of project outcomes. Indicate if any new activity or institutional change is recommended to help sustain outcomes. The analysis should draw upon the sensitivity analysis in Annex 3, if relevant.
STEG has a reputation for maintaining its installations, and therefore project structures do not run any special risks to their
physical sustainability.
9
The levels of service quality achieved through the project require continuous monitoring and additional investments similar to those made by the project in view of the expected increase in customer electrical energy demand. The volume of the investments is proportionate to the country’s economic and population growth rates.
E. PROJECT DESIGN AND READINESS FOR IMPLEMENTATION
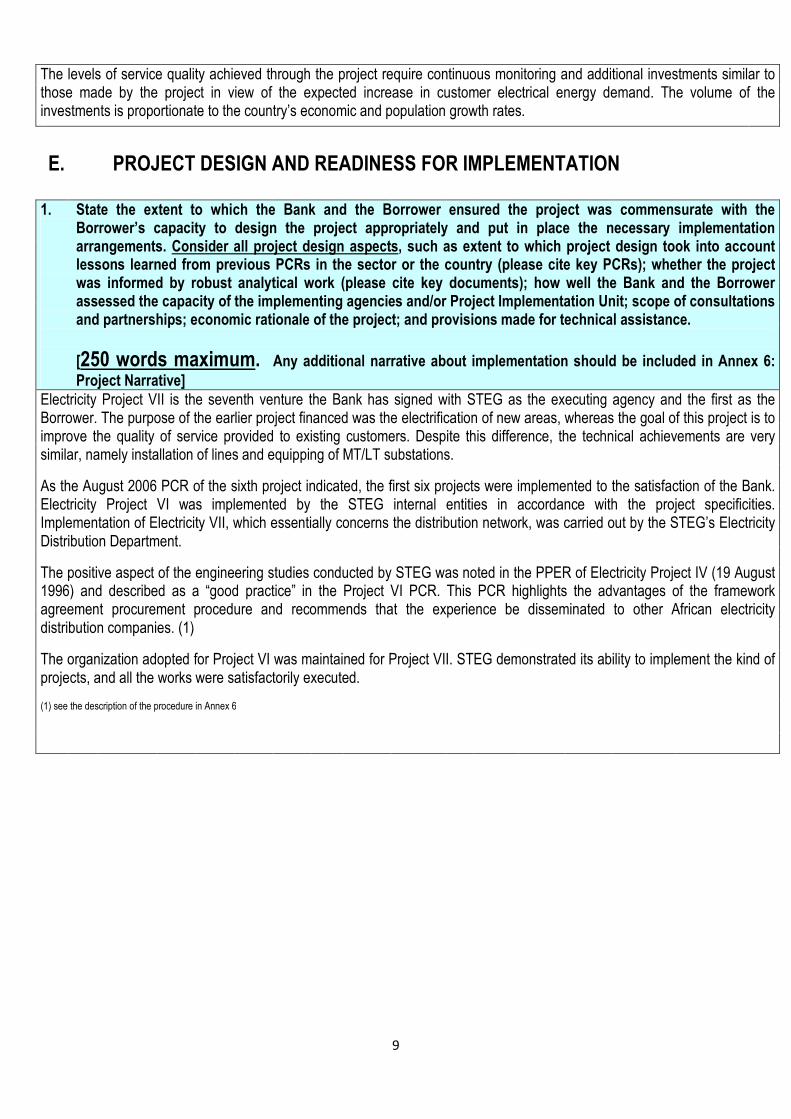
1. State the extent to which the Bank and the Borrower ensured the project was commensurate with the Borrower’s capacity to design the project appropriately and put in place the necessary implementation arrangements. Consider all project design aspects, such as extent to which project design took into account lessons learned from previous PCRs in the sector or the country (please cite key PCRs); whether the project was informed by robust analytical work (please cite key documents); how well the Bank and the Borrower assessed the capacity of the implementing agencies and/or Project Implementation Unit; scope of consultations and partnerships; economic rationale of the project; and provisions made for technical assistance.
[250 words maximum. Any additional narrative about implementation should be included in Annex 6:
Project Narrative]
Electricity Project VII is the seventh venture the Bank has signed with STEG as the executing agency and the first as the Borrower. The purpose of the earlier project financed was the electrification of new areas, whereas the goal of this project is to improve the quality of service provided to existing customers. Despite this difference, the technical achievements are very similar, namely installation of lines and equipping of MT/LT substations.
As the August 2006 PCR of the sixth project indicated, the first six projects were implemented to the satisfaction of the Bank. Electricity Project VI was implemented by the STEG internal entities in accordance with the project specificities. Implementation of Electricity VII, which essentially concerns the distribution network, was carried out by the STEG’s Electricity Distribution Department.
The positive aspect of the engineering studies conducted by STEG was noted in the PPER of Electricity Project IV (19 August 1996) and described as a “good practice” in the Project VI PCR. This PCR highlights the advantages of the framework agreement procurement procedure and recommends that the experience be disseminated to other African electricity distribution companies. (1)
The organization adopted for Project VI was maintained for Project VII. STEG demonstrated its ability to implement the kind of projects, and all the works were satisfactorily executed.
(1) see the description of the procedure in Annex 6
10
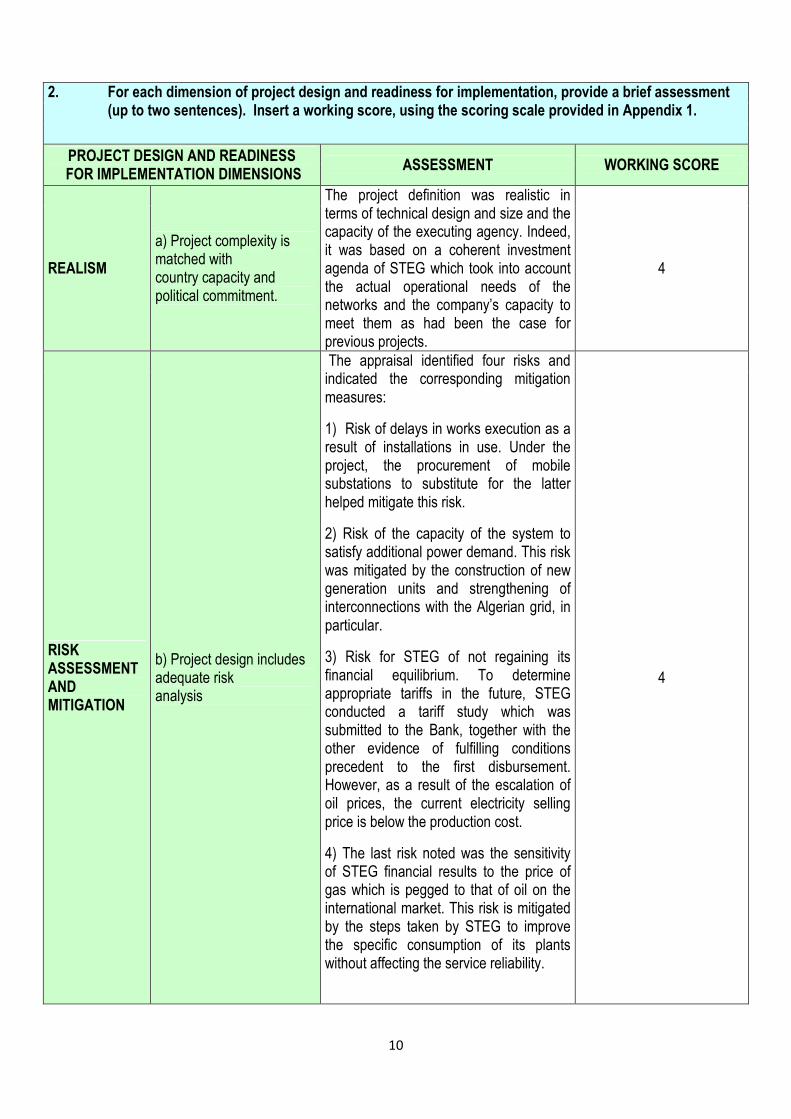
2. For each dimension of project design and readiness for implementation, provide a brief assessment (up to two sentences). Insert a working score, using the scoring scale provided in Appendix 1.
PROJECT DESIGN AND READINESS FOR IMPLEMENTATION DIMENSIONS
ASSESSMENT WORKING SCORE
REALISM
a) Project complexity is matched with country capacity and political commitment.
The project definition was realistic in terms of technical design and size and the capacity of the executing agency. Indeed, it was based on a coherent investment agenda of STEG which took into account the actual operational needs of the networks and the company’s capacity to meet them as had been the case for previous projects.
4
RISK ASSESSMENT AND MITIGATION
b) Project design includes adequate risk analysis
The appraisal identified four risks and indicated the corresponding mitigation measures:
1) Risk of delays in works execution as a result of installations in use. Under the project, the procurement of mobile substations to substitute for the latter helped mitigate this risk.
2) Risk of the capacity of the system to satisfy additional power demand. This risk was mitigated by the construction of new generation units and strengthening of interconnections with the Algerian grid, in particular.
3) Risk for STEG of not regaining its financial equilibrium. To determine appropriate tariffs in the future, STEG conducted a tariff study which was submitted to the Bank, together with the other evidence of fulfilling conditions precedent to the first disbursement. However, as a result of the escalation of oil prices, the current electricity selling price is below the production cost.
4) The last risk noted was the sensitivity of STEG financial results to the price of gas which is pegged to that of oil on the international market. This risk is mitigated by the steps taken by STEG to improve the specific consumption of its plants without affecting the service reliability.
4
11
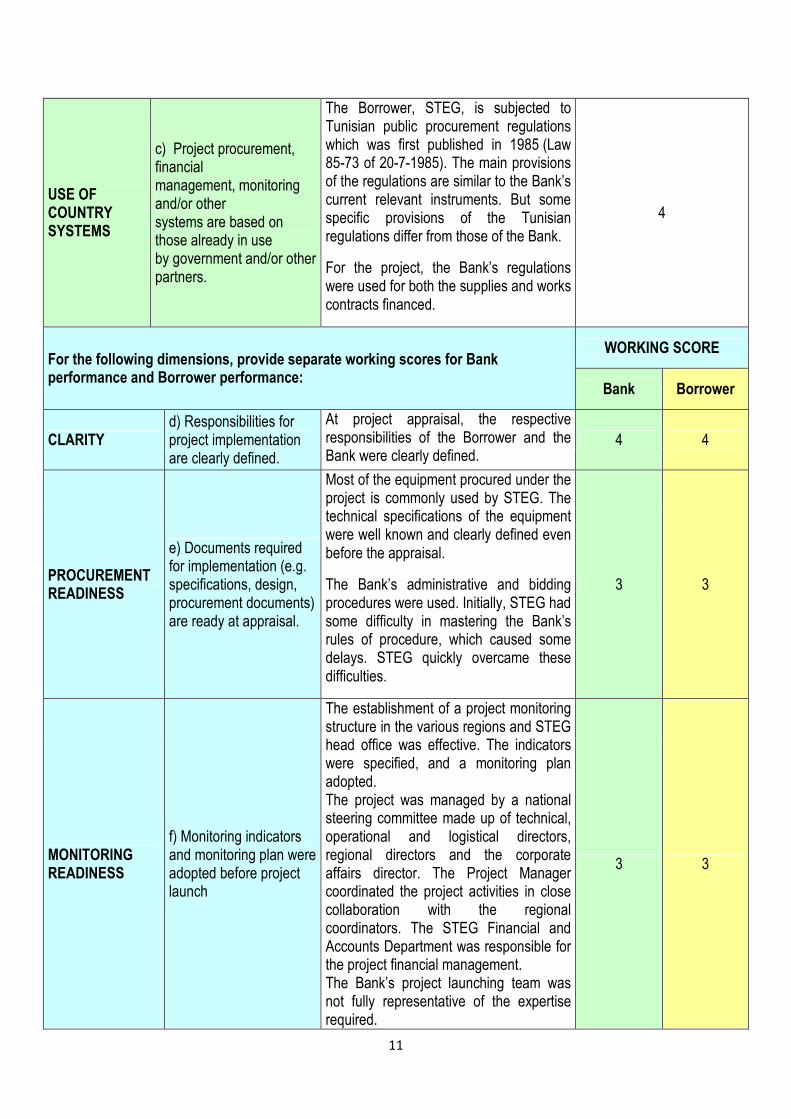
USE OF COUNTRY SYSTEMS
c) Project procurement, financial management, monitoring and/or other systems are based on those already in use by government and/or other partners.
The Borrower, STEG, is subjected to Tunisian public procurement regulations which was first published in 1985 (Law 85-73 of 20-7-1985). The main provisions of the regulations are similar to the Bank’s current relevant instruments. But some specific provisions of the Tunisian regulations differ from those of the Bank.
For the project, the Bank’s regulations were used for both the supplies and works contracts financed.
4
For the following dimensions, provide separate working scores for Bank performance and Borrower performance:
WORKING SCORE
Bank Borrower
CLARITY d) Responsibilities for project implementation are clearly defined.
At project appraisal, the respective responsibilities of the Borrower and the Bank were clearly defined.
4 4
PROCUREMENT READINESS
e) Documents required for implementation (e.g. specifications, design, procurement documents) are ready at appraisal.
Most of the equipment procured under the project is commonly used by STEG. The technical specifications of the equipment were well known and clearly defined even before the appraisal.
The Bank’s administrative and bidding procedures were used. Initially, STEG had some difficulty in mastering the Bank’s rules of procedure, which caused some delays. STEG quickly overcame these difficulties.
3 3
MONITORING READINESS
f) Monitoring indicators and monitoring plan were adopted before project launch
The establishment of a project monitoring structure in the various regions and STEG head office was effective. The indicators were specified, and a monitoring plan adopted. The project was managed by a national steering committee made up of technical, operational and logistical directors, regional directors and the corporate affairs director. The Project Manager coordinated the project activities in close collaboration with the regional coordinators. The STEG Financial and Accounts Department was responsible for the project financial management. The Bank’s project launching team was not fully representative of the expertise required.
3 3

12
BASELINE DATA g) Baseline data are available or are being collected
The sector baseline data were available at the outset. STEG regularly monitored the development of these data.
4 4
F. IMPLMENTATION
1. State the major characteristics of project implementation with reference to: adherence to schedules, quality of construction or other works, performance of consultants, effectiveness of Bank supervision, and effectiveness of Borrower oversight. Assess how well the Bank and the Borrower ensured compliance with safeguards.
[300 words maximum. [Any additional narrative about implementation should be included in
Annex 6: Project Narrative]
At appraisal, the project was intended to cover the 2004-2006 programme. Since the loan agreement was only signed on 20 September 2004, the 2004 programme was not considered and, consequently, the project implementation period changed to 2005-2007. This new implementation schedule was not adhered to since the works were completed only in 2010. This delay was due, in particular, to initial difficulties the Project Implementation Unit encountered getting familiar with the procurement procedures, as well as to delays caused by some works contracting firms.
The procurement of the equipment financed with the loan was based on technical specifications familiar to STEG. The works were entrusted to firms that were used to building STEG networks. Consequently, the quality of construction meets accepted standards and the structures are operating satisfactorily.
Since the project launch in February 2005, the Bank has undertaken six supervision missions, representing an average of one mission per year. Overall, the Bank’s recommendations were adhered to and the few challenges encountered were addressed. The location of the Borrower and the Bank in the same country facilitated contacts and improved communication effectiveness.
The STEG Regional Directorates were responsible for control and monitoring of the works, and have the necessary resources to perform these functions. A Project Coordination Unit was put in place at the central level.
Throughout the works, special effort was made to reduce the inconvenience caused to local residents (digging of trenches, emission of dust, noise, etc.) and amicably resolve objection to project activities on private property.
The project was regularly audited by an external auditor, and the reports were accepted by the Bank.
2 Comment on the role of other partners (e.g. donors, NGOs, contractors, etc.). Assess the effectiveness of co-financing arrangements and of donor coordination, if applicable.
The sole financing institution was the Bank. STEG co-financed the project without any special difficulty.
3. Harmonization. State whether the Bank made explicit efforts to harmonize instruments, systems
and/or approaches with other partners.
N/A.
13
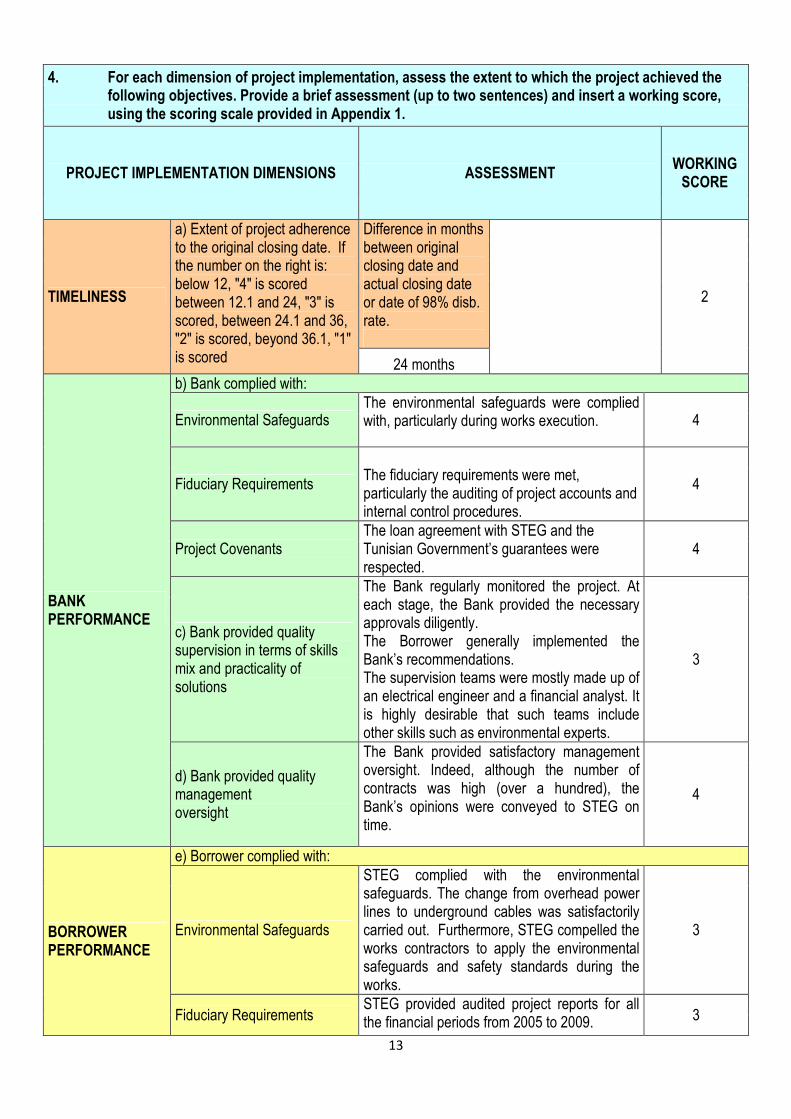
4. For each dimension of project implementation, assess the extent to which the project achieved the following objectives. Provide a brief assessment (up to two sentences) and insert a working score, using the scoring scale provided in Appendix 1.
PROJECT IMPLEMENTATION DIMENSIONS ASSESSMENT WORKING
SCORE
TIMELINESS
a) Extent of project adherence to the original closing date. If the number on the right is: below 12, "4" is scored between 12.1 and 24, "3" is scored, between 24.1 and 36, "2" is scored, beyond 36.1, "1" is scored
Difference in months between original closing date and actual closing date or date of 98% disb. rate.
2
24 months
BANK PERFORMANCE
b) Bank complied with:
Environmental Safeguards The environmental safeguards were complied with, particularly during works execution. 4
Fiduciary Requirements
The fiduciary requirements were met, particularly the auditing of project accounts and internal control procedures.
4
Project Covenants The loan agreement with STEG and the Tunisian Government’s guarantees were respected.
4
c) Bank provided quality supervision in terms of skills mix and practicality of solutions
The Bank regularly monitored the project. At each stage, the Bank provided the necessary approvals diligently. The Borrower generally implemented the Bank’s recommendations. The supervision teams were mostly made up of an electrical engineer and a financial analyst. It is highly desirable that such teams include other skills such as environmental experts.
3
d) Bank provided quality management oversight
The Bank provided satisfactory management oversight. Indeed, although the number of contracts was high (over a hundred), the Bank’s opinions were conveyed to STEG on time.
4
BORROWER PERFORMANCE
e) Borrower complied with:
Environmental Safeguards
STEG complied with the environmental safeguards. The change from overhead power lines to underground cables was satisfactorily carried out. Furthermore, STEG compelled the works contractors to apply the environmental safeguards and safety standards during the works.
3
Fiduciary Requirements STEG provided audited project reports for all the financial periods from 2005 to 2009. 3
14
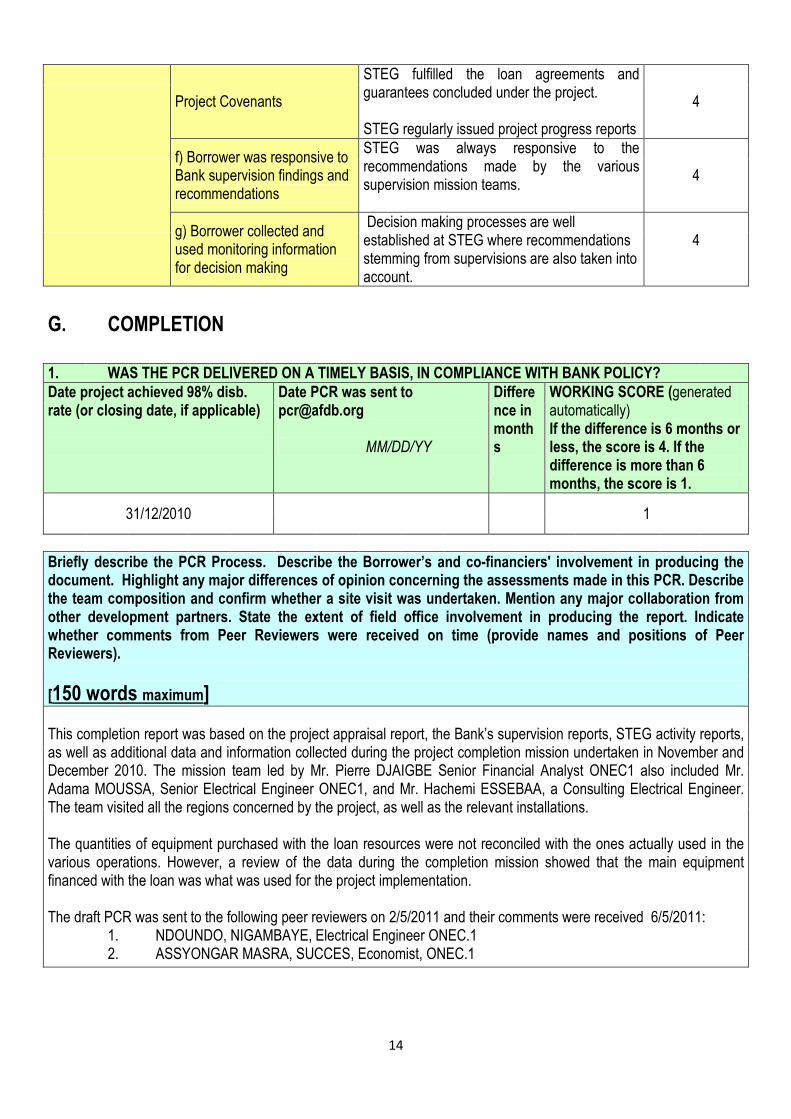
Project Covenants
STEG fulfilled the loan agreements and guarantees concluded under the project. STEG regularly issued project progress reports
4
f) Borrower was responsive to Bank supervision findings and recommendations
STEG was always responsive to the recommendations made by the various supervision mission teams.
4
g) Borrower collected and used monitoring information for decision making
Decision making processes are well established at STEG where recommendations stemming from supervisions are also taken into account.
4
G. COMPLETION
1. WAS THE PCR DELIVERED ON A TIMELY BASIS, IN COMPLIANCE WITH BANK POLICY?
Date project achieved 98% disb. rate (or closing date, if applicable)
Date PCR was sent to [email protected] MM/DD/YY
Difference in months
WORKING SCORE (generated automatically) If the difference is 6 months or less, the score is 4. If the difference is more than 6 months, the score is 1.
31/12/2010
1
Briefly describe the PCR Process. Describe the Borrower’s and co-financiers' involvement in producing the document. Highlight any major differences of opinion concerning the assessments made in this PCR. Describe the team composition and confirm whether a site visit was undertaken. Mention any major collaboration from other development partners. State the extent of field office involvement in producing the report. Indicate whether comments from Peer Reviewers were received on time (provide names and positions of Peer Reviewers).
[150 words maximum] This completion report was based on the project appraisal report, the Bank’s supervision reports, STEG activity reports, as well as additional data and information collected during the project completion mission undertaken in November and December 2010. The mission team led by Mr. Pierre DJAIGBE Senior Financial Analyst ONEC1 also included Mr. Adama MOUSSA, Senior Electrical Engineer ONEC1, and Mr. Hachemi ESSEBAA, a Consulting Electrical Engineer. The team visited all the regions concerned by the project, as well as the relevant installations. The quantities of equipment purchased with the loan resources were not reconciled with the ones actually used in the various operations. However, a review of the data during the completion mission showed that the main equipment financed with the loan was what was used for the project implementation. The draft PCR was sent to the following peer reviewers on 2/5/2011 and their comments were received 6/5/2011:
1. NDOUNDO, NIGAMBAYE, Electrical Engineer ONEC.1 2. ASSYONGAR MASRA, SUCCES, Economist, ONEC.1
15
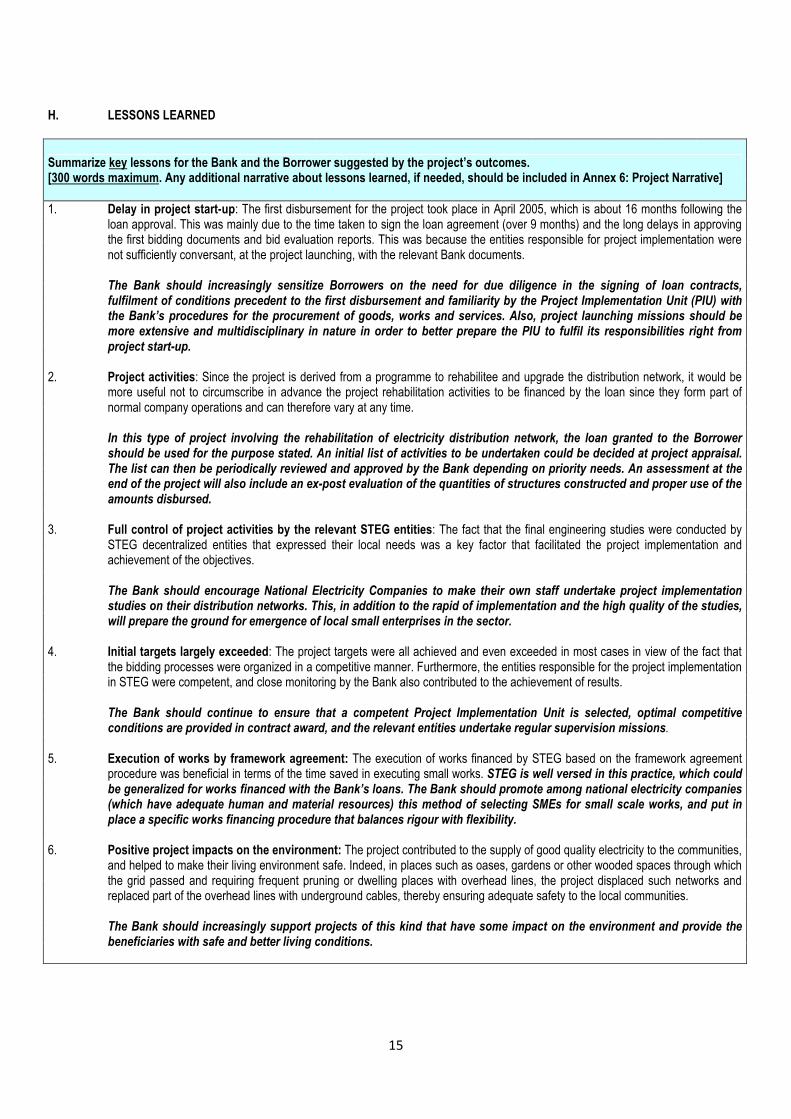
H. LESSONS LEARNED
Summarize key lessons for the Bank and the Borrower suggested by the project’s outcomes. [300 words maximum. Any additional narrative about lessons learned, if needed, should be included in Annex 6: Project Narrative]
1. Delay in project start-up: The first disbursement for the project took place in April 2005, which is about 16 months following the loan approval. This was mainly due to the time taken to sign the loan agreement (over 9 months) and the long delays in approving the first bidding documents and bid evaluation reports. This was because the entities responsible for project implementation were not sufficiently conversant, at the project launching, with the relevant Bank documents.
The Bank should increasingly sensitize Borrowers on the need for due diligence in the signing of loan contracts,
fulfilment of conditions precedent to the first disbursement and familiarity by the Project Implementation Unit (PIU) with the Bank’s procedures for the procurement of goods, works and services. Also, project launching missions should be more extensive and multidisciplinary in nature in order to better prepare the PIU to fulfil its responsibilities right from project start-up.
2. Project activities: Since the project is derived from a programme to rehabilitee and upgrade the distribution network, it would be
more useful not to circumscribe in advance the project rehabilitation activities to be financed by the loan since they form part of normal company operations and can therefore vary at any time.
In this type of project involving the rehabilitation of electricity distribution network, the loan granted to the Borrower
should be used for the purpose stated. An initial list of activities to be undertaken could be decided at project appraisal. The list can then be periodically reviewed and approved by the Bank depending on priority needs. An assessment at the end of the project will also include an ex-post evaluation of the quantities of structures constructed and proper use of the amounts disbursed.
3. Full control of project activities by the relevant STEG entities: The fact that the final engineering studies were conducted by
STEG decentralized entities that expressed their local needs was a key factor that facilitated the project implementation and achievement of the objectives.
The Bank should encourage National Electricity Companies to make their own staff undertake project implementation
studies on their distribution networks. This, in addition to the rapid of implementation and the high quality of the studies, will prepare the ground for emergence of local small enterprises in the sector.
4. Initial targets largely exceeded: The project targets were all achieved and even exceeded in most cases in view of the fact that
the bidding processes were organized in a competitive manner. Furthermore, the entities responsible for the project implementation in STEG were competent, and close monitoring by the Bank also contributed to the achievement of results.
The Bank should continue to ensure that a competent Project Implementation Unit is selected, optimal competitive
conditions are provided in contract award, and the relevant entities undertake regular supervision missions. 5. Execution of works by framework agreement: The execution of works financed by STEG based on the framework agreement
procedure was beneficial in terms of the time saved in executing small works. STEG is well versed in this practice, which could be generalized for works financed with the Bank’s loans. The Bank should promote among national electricity companies (which have adequate human and material resources) this method of selecting SMEs for small scale works, and put in place a specific works financing procedure that balances rigour with flexibility.
6. Positive project impacts on the environment: The project contributed to the supply of good quality electricity to the communities,
and helped to make their living environment safe. Indeed, in places such as oases, gardens or other wooded spaces through which the grid passed and requiring frequent pruning or dwelling places with overhead lines, the project displaced such networks and replaced part of the overhead lines with underground cables, thereby ensuring adequate safety to the local communities.
The Bank should increasingly support projects of this kind that have some impact on the environment and provide the
beneficiaries with safe and better living conditions.
16
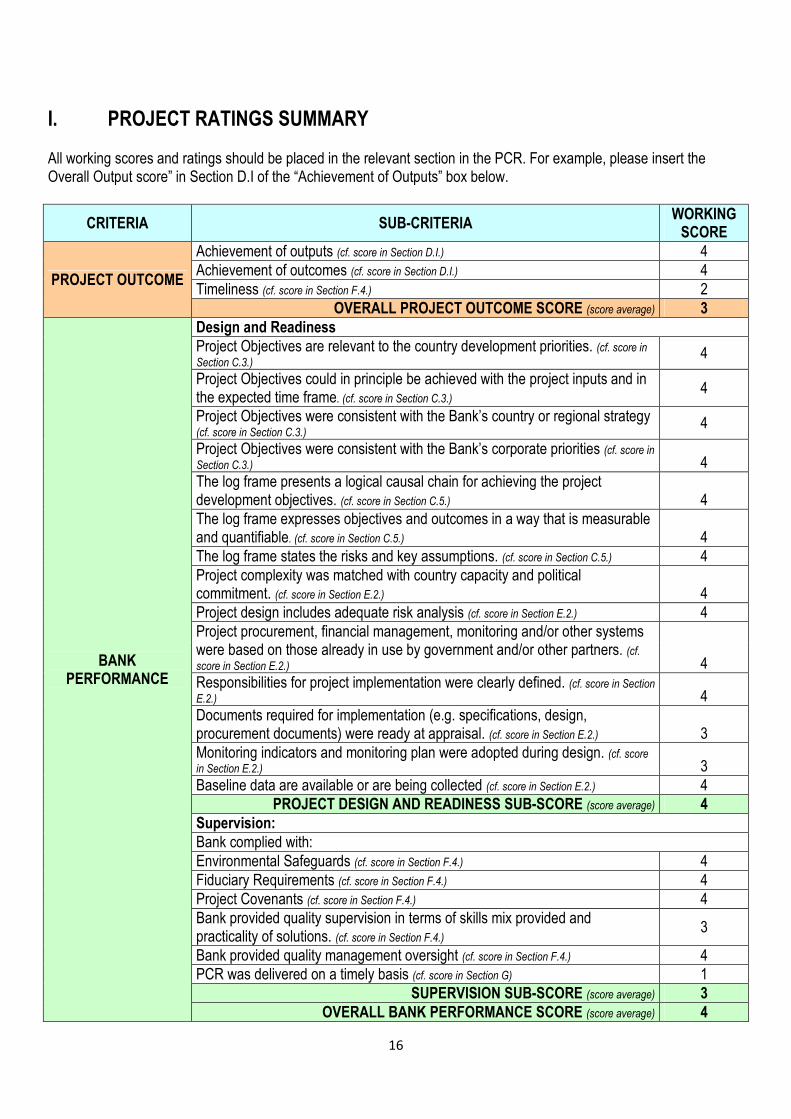
I. PROJECT RATINGS SUMMARY
All working scores and ratings should be placed in the relevant section in the PCR. For example, please insert the Overall Output score” in Section D.I of the “Achievement of Outputs” box below.
CRITERIA SUB-CRITERIA WORKING
SCORE
PROJECT OUTCOME
Achievement of outputs (cf. score in Section D.I.) 4
Achievement of outcomes (cf. score in Section D.I.) 4
Timeliness (cf. score in Section F.4.) 2
OVERALL PROJECT OUTCOME SCORE (score average) 3
BANK PERFORMANCE
Design and Readiness
Project Objectives are relevant to the country development priorities. (cf. score in
Section C.3.) 4
Project Objectives could in principle be achieved with the project inputs and in the expected time frame. (cf. score in Section C.3.)
4
Project Objectives were consistent with the Bank’s country or regional strategy (cf. score in Section C.3.)
4
Project Objectives were consistent with the Bank’s corporate priorities (cf. score in
Section C.3.) 4
The log frame presents a logical causal chain for achieving the project development objectives. (cf. score in Section C.5.) 4
The log frame expresses objectives and outcomes in a way that is measurable and quantifiable. (cf. score in Section C.5.) 4
The log frame states the risks and key assumptions. (cf. score in Section C.5.) 4
Project complexity was matched with country capacity and political commitment. (cf. score in Section E.2.) 4
Project design includes adequate risk analysis (cf. score in Section E.2.) 4
Project procurement, financial management, monitoring and/or other systems were based on those already in use by government and/or other partners. (cf.
score in Section E.2.) 4
Responsibilities for project implementation were clearly defined. (cf. score in Section
E.2.) 4
Documents required for implementation (e.g. specifications, design, procurement documents) were ready at appraisal. (cf. score in Section E.2.) 3
Monitoring indicators and monitoring plan were adopted during design. (cf. score
in Section E.2.) 3
Baseline data are available or are being collected (cf. score in Section E.2.) 4
PROJECT DESIGN AND READINESS SUB-SCORE (score average) 4
Supervision:
Bank complied with:
Environmental Safeguards (cf. score in Section F.4.) 4
Fiduciary Requirements (cf. score in Section F.4.) 4
Project Covenants (cf. score in Section F.4.) 4
Bank provided quality supervision in terms of skills mix provided and practicality of solutions. (cf. score in Section F.4.)
3
Bank provided quality management oversight (cf. score in Section F.4.) 4
PCR was delivered on a timely basis (cf. score in Section G) 1
SUPERVISION SUB-SCORE (score average) 3
OVERALL BANK PERFORMANCE SCORE (score average) 4
17
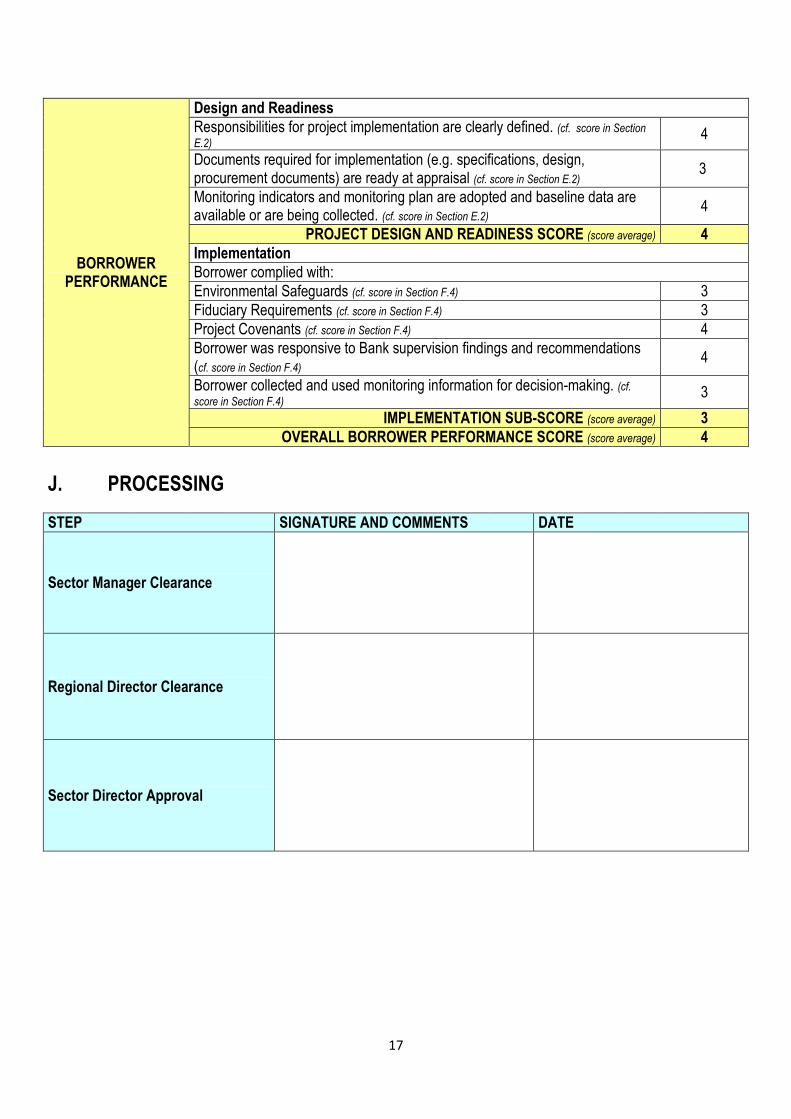
BORROWER PERFORMANCE
Design and Readiness
Responsibilities for project implementation are clearly defined. (cf. score in Section
E.2) 4
Documents required for implementation (e.g. specifications, design, procurement documents) are ready at appraisal (cf. score in Section E.2)
3
Monitoring indicators and monitoring plan are adopted and baseline data are available or are being collected. (cf. score in Section E.2)
4
PROJECT DESIGN AND READINESS SCORE (score average) 4
Implementation
Borrower complied with:
Environmental Safeguards (cf. score in Section F.4) 3
Fiduciary Requirements (cf. score in Section F.4) 3
Project Covenants (cf. score in Section F.4) 4
Borrower was responsive to Bank supervision findings and recommendations (cf. score in Section F.4)
4
Borrower collected and used monitoring information for decision-making. (cf.
score in Section F.4) 3
IMPLEMENTATION SUB-SCORE (score average) 3
OVERALL BORROWER PERFORMANCE SCORE (score average) 4
J. PROCESSING
STEP SIGNATURE AND COMMENTS DATE
Sector Manager Clearance
Regional Director Clearance
Sector Director Approval
18
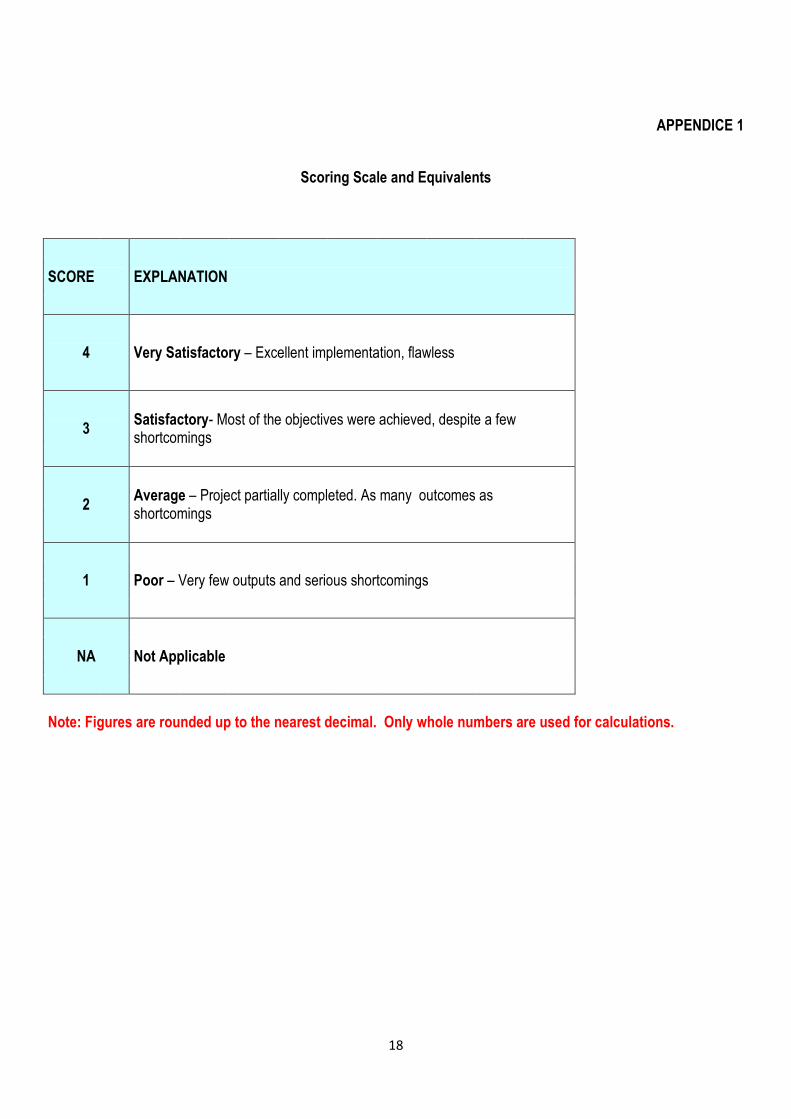
APPENDICE 1
Scoring Scale and Equivalents
SCORE EXPLANATION
4 Very Satisfactory – Excellent implementation, flawless
3 Satisfactory- Most of the objectives were achieved, despite a few shortcomings
2 Average – Project partially completed. As many outcomes as shortcomings
1 Poor – Very few outputs and serious shortcomings
NA Not Applicable
Note: Figures are rounded up to the nearest decimal. Only whole numbers are used for calculations.

19
ANNEXES
Annex 1 Page 1/2
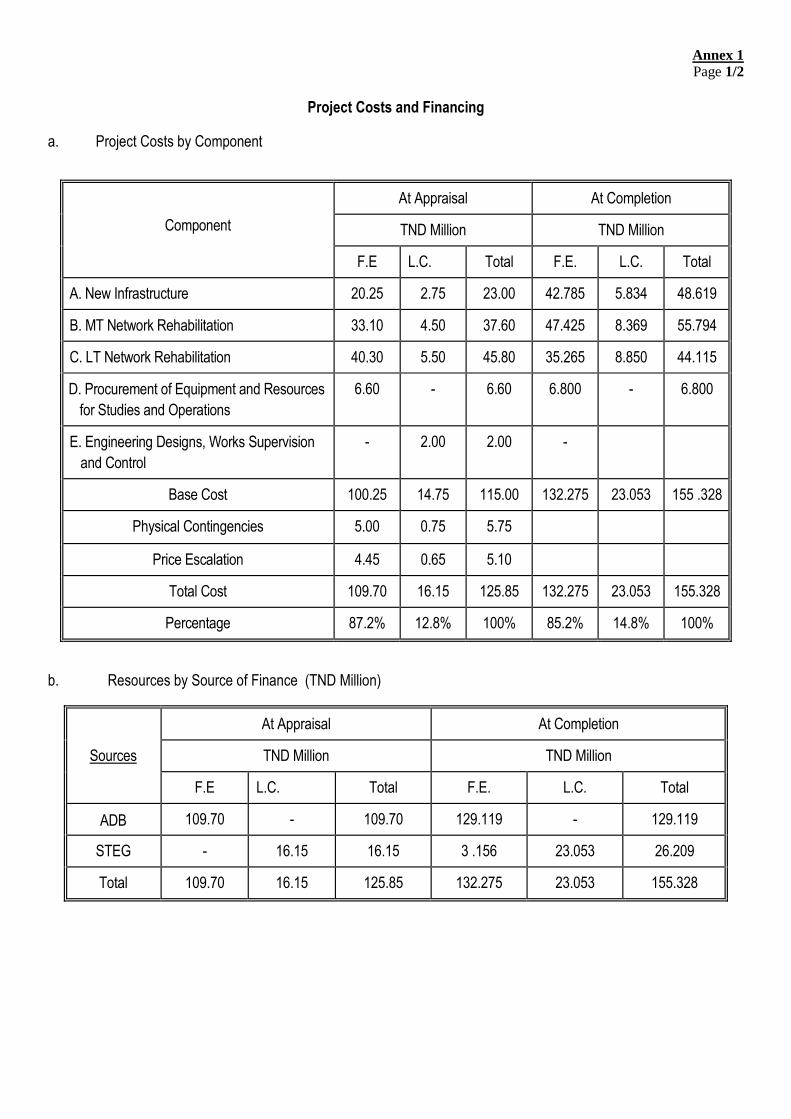
Project Costs and Financing
a. Project Costs by Component
Component
At Appraisal At Completion
TND Million TND Million
F.E L.C. Total F.E. L.C. Total
A. New Infrastructure 20.25 2.75 23.00 42.785 5.834 48.619
B. MT Network Rehabilitation 33.10 4.50 37.60 47.425 8.369 55.794
C. LT Network Rehabilitation 40.30 5.50 45.80 35.265 8.850 44.115
D. Procurement of Equipment and Resources
for Studies and Operations
6.60 - 6.60 6.800 - 6.800
E. Engineering Designs, Works Supervision
and Control
- 2.00 2.00 -
Base Cost 100.25 14.75 115.00 132.275 23.053 155 .328
Physical Contingencies 5.00 0.75 5.75
Price Escalation 4.45 0.65 5.10
Total Cost 109.70 16.15 125.85 132.275 23.053 155.328
Percentage 87.2% 12.8% 100% 85.2% 14.8% 100%
b. Resources by Source of Finance (TND Million)
Sources
At Appraisal At Completion
TND Million TND Million
F.E L.C. Total F.E. L.C. Total
ADB 109.70 - 109.70 129.119 - 129.119
STEG - 16.15 16.15 3 .156 23.053 26.209
Total 109.70 16.15 125.85 132.275 23.053 155.328

Annex 1 Page 2/2
Resources by Source of Financing (EUROS Million)
Source
At Appraisal At Completion
EUR Million EUR Million
F.E L.C. Total F.E. L.C. Total
ADB 77.150 - 77.150 72.897 - 72.897
STEG - 11.358 11.358 1.782 13.015 14.797
Total 88.508 74.679 13.015 87.694

Annex 2 Page 1/1
Bank Contributions
Description Dates Number
of Persons
Composition Staff-Days
Score (*)
Preparation 04 to 17/08/2003 3 - Electrical Engineer
36 - - 2 Financial Analysts
Appraisal 22 to 30/09/ 2003 3 - Electrical Engineer
27 - - 2 Financial Analysts
Supervision
10 to 15/07/2005 2 - Electrical Engineer
20 2.40 - Financial Analyst
16 to 25/01/2006 4
- Electrical Engineer
32 2.25 - Procurement Specialist
- Financial Analyst
- Consultant
09 to 19/02/2007 3
- Electrical Engineer
30 2.40 - Financial Analyst
- Procurement Specialist
28/04 to 09/05/2008 2 - Electrical Engineer
20 2.73 - Financial Analyst
24/11 to 04/12/2009 2 - Electrical Engineer
20 2.75 - Operations Assistant
15 to 28/06/2010 1 - Financial Analyst 12 3.00
Completion 08 to 19/11/2010 3
- Financial Analyst
30 3.00 - Electrical Engineer
- Consultant
Total - 23 - 227 2.64
(*) Project supervision score based on a maximum of 3 points.
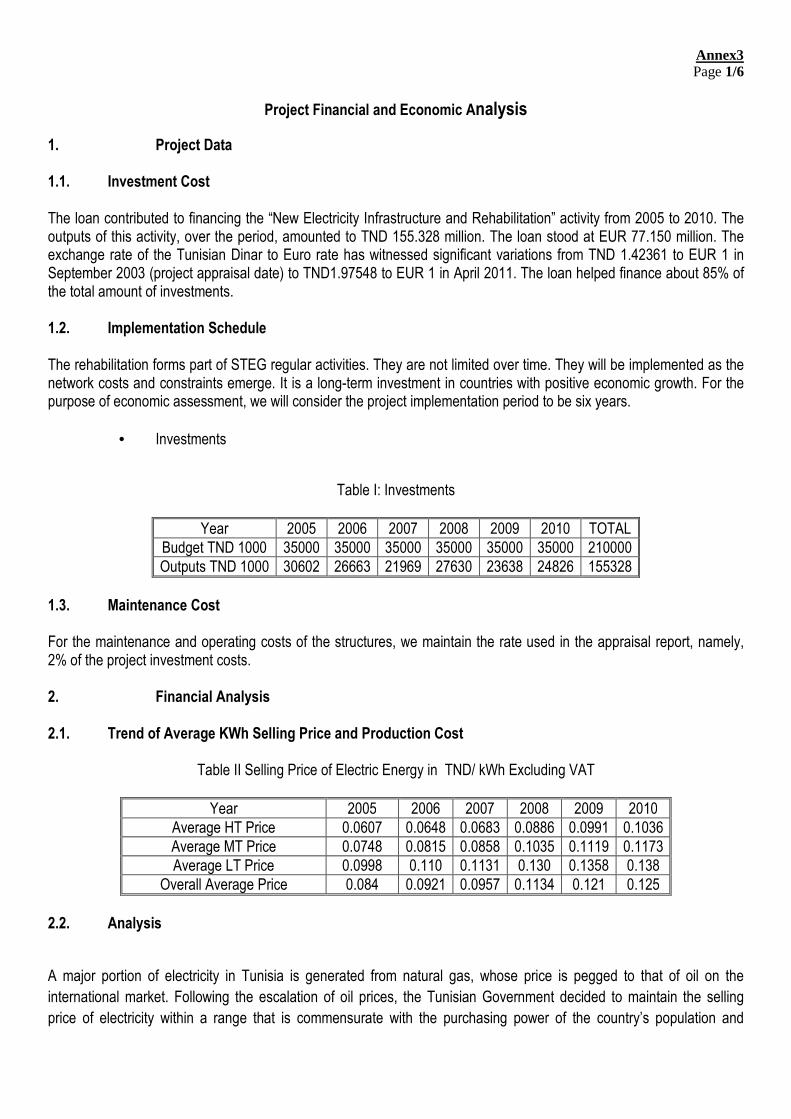
Annex3 Page 1/6
Project Financial and Economic Analysis
1. Project Data
1.1. Investment Cost The loan contributed to financing the “New Electricity Infrastructure and Rehabilitation” activity from 2005 to 2010. The outputs of this activity, over the period, amounted to TND 155.328 million. The loan stood at EUR 77.150 million. The exchange rate of the Tunisian Dinar to Euro rate has witnessed significant variations from TND 1.42361 to EUR 1 in September 2003 (project appraisal date) to TND1.97548 to EUR 1 in April 2011. The loan helped finance about 85% of the total amount of investments. 1.2. Implementation Schedule The rehabilitation forms part of STEG regular activities. They are not limited over time. They will be implemented as the network costs and constraints emerge. It is a long-term investment in countries with positive economic growth. For the purpose of economic assessment, we will consider the project implementation period to be six years.
• Investments
Table I: Investments
Year 2005 2006 2007 2008 2009 2010 TOTAL
Budget TND 1000 35000 35000 35000 35000 35000 35000 210000
Outputs TND 1000 30602 26663 21969 27630 23638 24826 155328
1.3. Maintenance Cost For the maintenance and operating costs of the structures, we maintain the rate used in the appraisal report, namely, 2% of the project investment costs. 2. Financial Analysis 2.1. Trend of Average KWh Selling Price and Production Cost
Table II Selling Price of Electric Energy in TND/ kWh Excluding VAT
Year 2005 2006 2007 2008 2009 2010
Average HT Price 0.0607 0.0648 0.0683 0.0886 0.0991 0.1036
Average MT Price 0.0748 0.0815 0.0858 0.1035 0.1119 0.1173
Average LT Price 0.0998 0.110 0.1131 0.130 0.1358 0.138
Overall Average Price 0.084 0.0921 0.0957 0.1134 0.121 0.125
2.2. Analysis
A major portion of electricity in Tunisia is generated from natural gas, whose price is pegged to that of oil on the
international market. Following the escalation of oil prices, the Tunisian Government decided to maintain the selling
price of electricity within a range that is commensurate with the purchasing power of the country’s population and
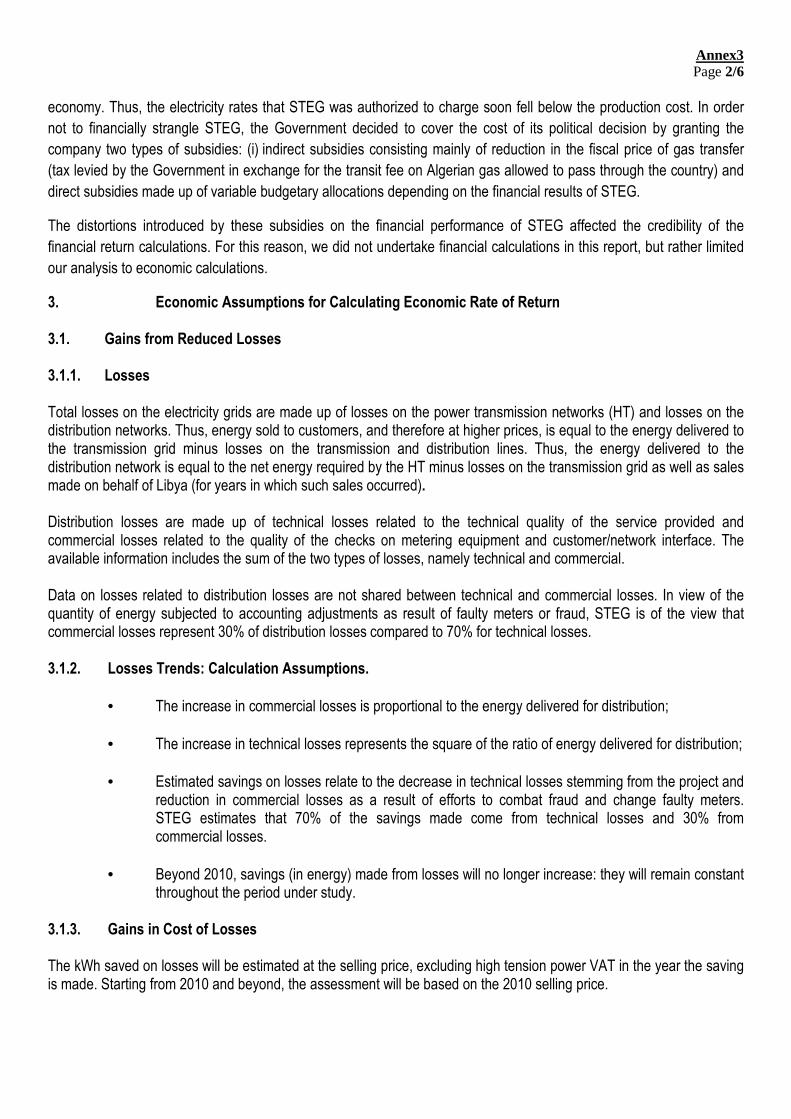
Annex3 Page 2/6
economy. Thus, the electricity rates that STEG was authorized to charge soon fell below the production cost. In order
not to financially strangle STEG, the Government decided to cover the cost of its political decision by granting the
company two types of subsidies: (i) indirect subsidies consisting mainly of reduction in the fiscal price of gas transfer
(tax levied by the Government in exchange for the transit fee on Algerian gas allowed to pass through the country) and
direct subsidies made up of variable budgetary allocations depending on the financial results of STEG.
The distortions introduced by these subsidies on the financial performance of STEG affected the credibility of the
financial return calculations. For this reason, we did not undertake financial calculations in this report, but rather limited
our analysis to economic calculations.
3. Economic Assumptions for Calculating Economic Rate of Return 3.1. Gains from Reduced Losses 3.1.1. Losses Total losses on the electricity grids are made up of losses on the power transmission networks (HT) and losses on the distribution networks. Thus, energy sold to customers, and therefore at higher prices, is equal to the energy delivered to the transmission grid minus losses on the transmission and distribution lines. Thus, the energy delivered to the distribution network is equal to the net energy required by the HT minus losses on the transmission grid as well as sales made on behalf of Libya (for years in which such sales occurred). Distribution losses are made up of technical losses related to the technical quality of the service provided and commercial losses related to the quality of the checks on metering equipment and customer/network interface. The available information includes the sum of the two types of losses, namely technical and commercial. Data on losses related to distribution losses are not shared between technical and commercial losses. In view of the quantity of energy subjected to accounting adjustments as result of faulty meters or fraud, STEG is of the view that commercial losses represent 30% of distribution losses compared to 70% for technical losses. 3.1.2. Losses Trends: Calculation Assumptions.
• The increase in commercial losses is proportional to the energy delivered for distribution;
• The increase in technical losses represents the square of the ratio of energy delivered for distribution;
• Estimated savings on losses relate to the decrease in technical losses stemming from the project and reduction in commercial losses as a result of efforts to combat fraud and change faulty meters. STEG estimates that 70% of the savings made come from technical losses and 30% from commercial losses.
• Beyond 2010, savings (in energy) made from losses will no longer increase: they will remain constant throughout the period under study.
3.1.3. Gains in Cost of Losses The kWh saved on losses will be estimated at the selling price, excluding high tension power VAT in the year the saving is made. Starting from 2010 and beyond, the assessment will be based on the 2010 selling price.
Annex3 Page 3/6
3.1.4. Gains from reductions in undistributed energy
a) Assumptions
• Without the project, the ratio of undistributed energy to distribution energy is constant
• During the project implementation period, reductions in undistributed energy are as a result of the project;
• Beyond 2010, the ratio of undistributed energy to distribution energy remains constant throughout the study period.
• The annual rate of increase in distribution energy is 5% starting from 2010.
b) Gains on undistributed energy
The assessment of gains resulting from a decrease in undistributed energy is based on the cost of supply failures, which is an estimation of losses suffered by the national economy as a result of unavailability (1) kWh. STEG estimates the cost at TND2/kWh (representing about 20 times its current HT price). This was the value adopted at appraisal and which we maintain here.
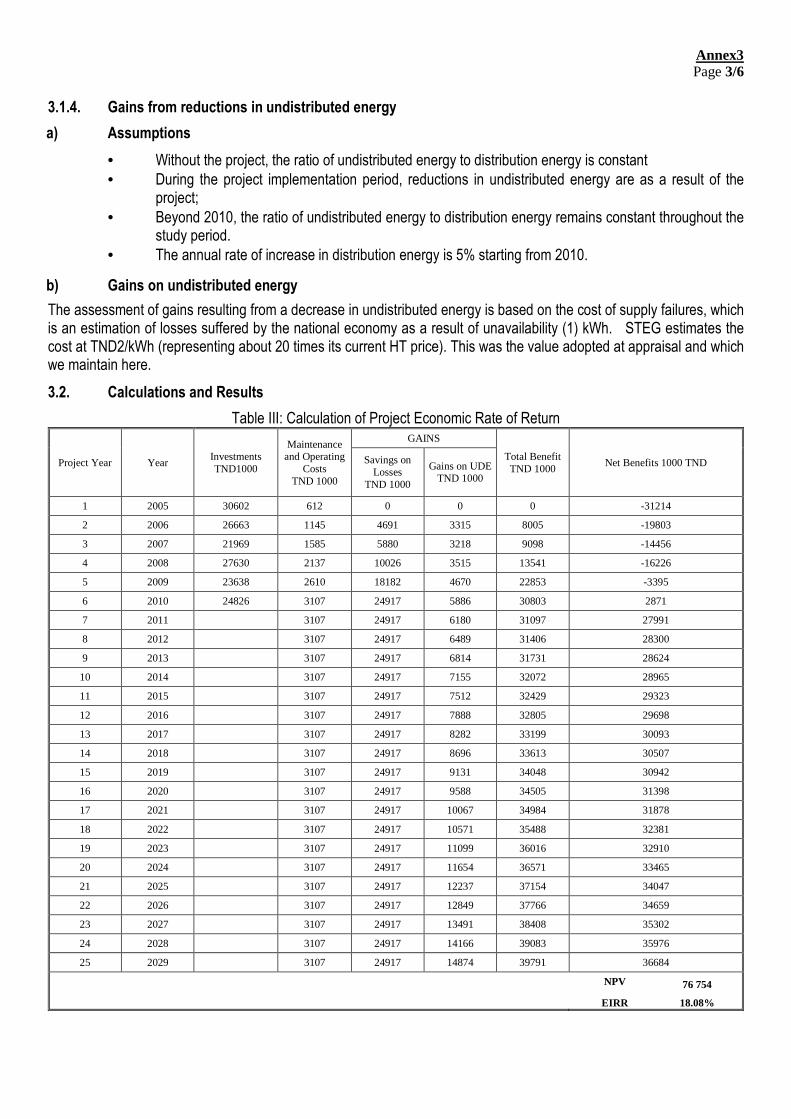
3.2. Calculations and Results
Table III: Calculation of Project Economic Rate of Return
Project Year Year Investments TND1000
Maintenance and Operating
Costs TND 1000
GAINS
Total Benefit TND 1000
Net Benefits 1000 TND Savings on Losses
TND 1000
Gains on UDE TND 1000
1 2005 30602 612 0 0 0 -31214
2 2006 26663 1145 4691 3315 8005 -19803
3 2007 21969 1585 5880 3218 9098 -14456
4 2008 27630 2137 10026 3515 13541 -16226
5 2009 23638 2610 18182 4670 22853 -3395
6 2010 24826 3107 24917 5886 30803 2871
7 2011
3107 24917 6180 31097 27991
8 2012
3107 24917 6489 31406 28300
9 2013
3107 24917 6814 31731 28624
10 2014
3107 24917 7155 32072 28965
11 2015
3107 24917 7512 32429 29323
12 2016
3107 24917 7888 32805 29698
13 2017
3107 24917 8282 33199 30093
14 2018
3107 24917 8696 33613 30507
15 2019
3107 24917 9131 34048 30942
16 2020
3107 24917 9588 34505 31398
17 2021
3107 24917 10067 34984 31878
18 2022
3107 24917 10571 35488 32381
19 2023
3107 24917 11099 36016 32910
20 2024
3107 24917 11654 36571 33465
21 2025
3107 24917 12237 37154 34047
22 2026
3107 24917 12849 37766 34659
23 2027
3107 24917 13491 38408 35302
24 2028
3107 24917 14166 39083 35976
25 2029
3107 24917 14874 39791 36684
NPV 76 754
EIRR 18.08%

Annex3 Page 4/6
3.3. EIRR Sensitivity to Post-Project Cost Trend
Consumed electrical energy growth rate
beyond 2010 (%) EIRR (%)
Base 5% 18.08
Max 10% 19.26
Min 1% 17.36
3.4. Comment
The economic internal rate of return (EIRR), estimated at 14.41% at appraisal exceeds 18% at the end of the project implementation. The EIRR remains high irrespective of the growth rate of electricity consumption required by the grid. This rate is closely related to the country’s economic growth. The 5% value represents the average power consumption growth rate observed over the last ten years. The 1% value pre-supposes deep economic recession, while 10% corresponds to strong economic growth. For the three scenarios, the calculations confirm the economic rate of return of the project. 4. List of Reference Documents
Project Appraisal Report STEG Project Progress Reports Bank Supervision Mission Reports STEG Completion Report STEG Annual Activity Report STEG Retrospective Statistics 1999 – 2009 Project Completion Reports (PCR) and Project Performance Evaluation Reports (PPERs) of the Tunisian energy sector Central Bank of Tunisia Annual Reports
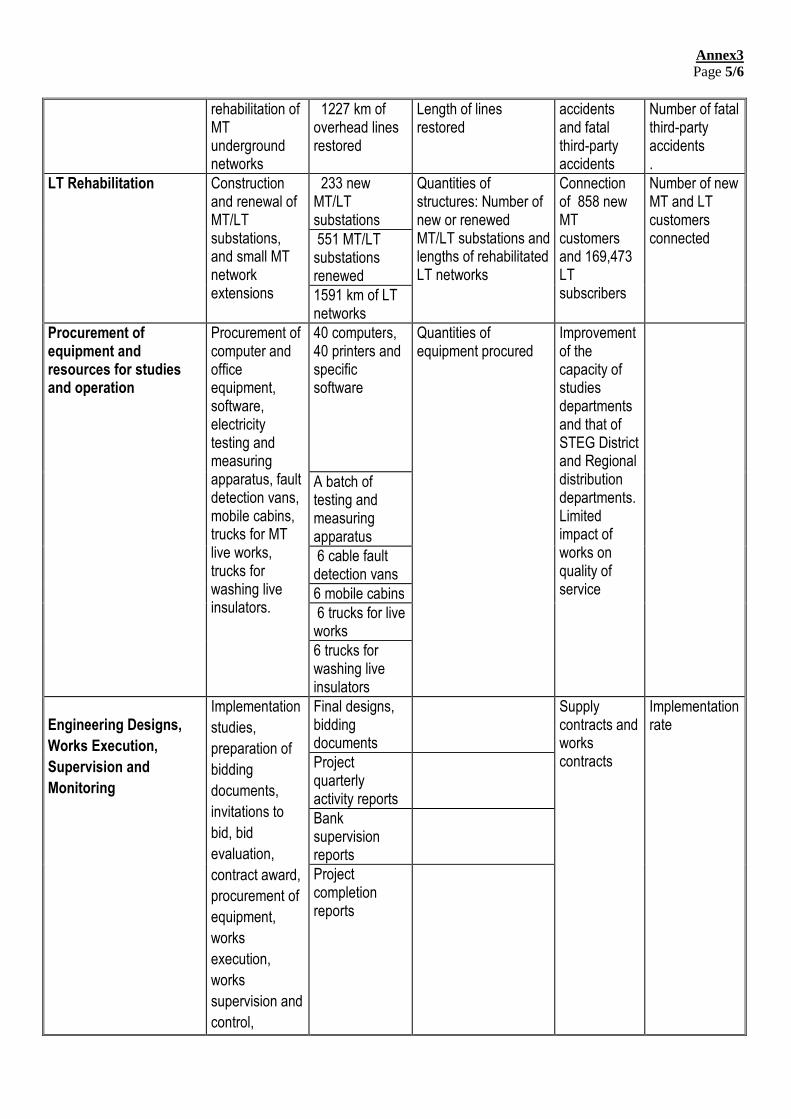
5. Summary Table of Log-frame Data (Section C 4)
4. Summarize the log. frame. If a log. frame does not exist, complete the table below, indicating the overall project development objective, the major components of the project, the major activities of each component and their expected outputs, outcomes, and indicators for measuring the achievement of outcomes. Please insert additional rows for components, activities, outputs or outcomes if needed.
COMPONENTS ACTIVITIES OUTPUTS EXPECTED OUTCOMES
INDICATORS TO BE MEASURED
COMPONENTS
Construction of New Infrastructure
Construction of new overhead MT lines, laying of underground MT cables and MT/LT sub-station equipment
227 km of underground cables laid
Length of cables laid Reduction in number and duration of networks failures
Average duration of distribution network failures
416 km of new overhead MT lines
Length of lines installed
A 30/15 kV substation in Sfax
Substation operating Reduction in undistributed energy (UDE)
Undistributed
energy (UDE)
A 30/15 kV substation in Gafsa
Substation operating
MT Rehabilitation Overhaul of MT overhead networks and
212 km of underground cables laid
Length of cables laid Reduction in the number of industrial
Frequency of industrial accidents.
Annex3 Page 5/6
rehabilitation of MT underground networks
1227 km of overhead lines restored
Length of lines restored
accidents and fatal third-party accidents
Number of fatal third-party accidents .
LT Rehabilitation Construction and renewal of MT/LT substations, and small MT network extensions
233 new MT/LT substations
Quantities of structures: Number of new or renewed MT/LT substations and lengths of rehabilitated LT networks
Connection of 858 new MT customers and 169,473 LT subscribers
Number of new MT and LT customers connected 551 MT/LT
substations renewed
1591 km of LT networks
Procurement of equipment and resources for studies and operation
Procurement of computer and office equipment, software, electricity testing and measuring apparatus, fault detection vans, mobile cabins, trucks for MT live works, trucks for washing live insulators.
40 computers, 40 printers and specific software
Quantities of equipment procured
Improvement of the capacity of studies departments and that of STEG District and Regional distribution departments. Limited impact of works on quality of service
A batch of testing and measuring apparatus
6 cable fault detection vans
6 mobile cabins
6 trucks for live works
6 trucks for washing live insulators
Engineering Designs,
Works Execution,
Supervision and
Monitoring
Implementation
studies,
preparation of
bidding
documents,
invitations to
bid, bid
evaluation,
contract award,
procurement of
equipment,
works
execution,
works
supervision and
control,
Final designs, bidding documents
Supply contracts and works contracts
Implementation rate
Project quarterly activity reports
Bank supervision reports
Project completion reports

Annex3 Page 6/6
acceptance and
commissioning
of MT and LT
lines, MT/LT
substations and
transformers
Annex 4
DEFINITION OF FRAMEWORK AGREEMENT
At the end of the 1960s, Tunisia realized that the country’s electrification was indispensable for its economic
development, and made it a development goal. STEG, which undertook small works on the distribution network using its
own teams and subcontracting major works, soon realized that this method was not suitable for the magnitude of the
task to be accomplished to achieve a decent level of electrification. Thus, a procurement procedure was introduced to
enable small distribution works to be outsourced to national entities outside STEG. This procedure is called “framework
agreement”.
The procedure, which is similar to the negotiated procedure, entails a price list based on national shopping by which
STEG awards works contracts to small enterprises located in the various regions according to their technical and
financial capacity.
The unit prices of the various operations forming part of electricity distribution activities under the framework agreement
procedure are determined through an assessment by STEG based on the prices of the most recent bids received for
similar works through competitive bidding, the general price trend observed in the country, estimation of hours of
services and equipment needed for each operation. These prices are discussed and approved by the representatives of
the contracting firms. The prices are revised periodically in line with pre-defined indices.
The use of this framework agreement procedure is limited to works whose estimated costs do not exceed TND 100,000.
Amounts exceeding this ceiling require the use of the competitive bidding procedure.