TUNING IN TO FORMAL POLITICS
23
TUNING IN TO FORMAL POLITICS Mock Elections at School and the Intention of Electoral Participation among First Time Voters in Norway Julie A. Ø. Borge ABSTRACT Does voting in mock elections at school have an effect RQ VWXGHQWVカ ZLOOLQJQHVV WR YRWH in the following Parliamentary election? Empirically tested through the case of mock elections at schools in Norway in relation to the Parliamentary election of 2013, the multivariate logistic regression analyses of the data shows that voting in mock elections proves to have an effect on WKH VWXGHQWVカ ZLOOLQJQHVV WR YRWH DQG WKDW WKLV HIIHFW SHUVLVWV DIWHU FRQWUROOLQJ IRU EDFNJURXQG factors. The results strengthen the case for political education in school while simultaneously acknowledging its limits. KEYWORDS Electoral participation -Norway-political education-mock elections-first time voters 1. INTRODUCTION Politicians, media and researchers alike are concerned about young people`s attitudes towards political participation in general and voting in particular. A declining electoral participation in advanced democracies alerts a disengagement from the community and political
Transcript of TUNING IN TO FORMAL POLITICS

TUNING IN TO FORMAL POLITICS
Mock Elections at School and the Intention of Electoral Participation among First
Time Voters in Norway
Julie A. Ø. Borge
ABSTRACT
Does voting in mock elections at school have an effect in the
following Parliamentary election? Empirically tested through the case of mock elections at
schools in Norway in relation to the Parliamentary election of 2013, the multivariate logistic
regression analyses of the data shows that voting in mock elections proves to have an effect on
factors. The results strengthen the case for political education in school while simultaneously
acknowledging its limits.
KEYWORDS
Electoral participation -Norway-political education-mock elections-first time voters
1. INTRODUCTION
Politicians, media and researchers alike are concerned about young people`s attitudes
towards political participation in general and voting in particular. A declining electoral
participation in advanced democracies alerts a disengagement from the community and political

life (Putnam, 2000; Wattenberg, 2012), a lack of political knowledge (Delli Carpini and Keeter,
1996; Galston, 2001) and a generation of apolitical youth (Øia, 1995).
to examine the role mock elections as political education in
in mock
elections at school have an effect in the following Parliamentary
election?
Much of the scholarly interest in the individuals relation to the political system grows
out of the claim that voting is democracy`s sine qua non, without which it cannot be. Thus, a
decreasing voter turnout may not only challenge one of the core characteristics of a democratic
regime but also question the effectiveness of the institutions in imbuing in young people the
desired political behavior and support for the regime. At a macro level, this process, in which
institutions legitimate support for the regime, is in political science research often referred to
as political socialization, with the main objective of enabling system persistence (Easton, 1965;
Hyman, 1959). Democratic states depend on institutions to promote democratic citizens (March
and Olsen, 1995), and the school has, in many countries, been given the role of safeguarding
this functional dimension of education (Rokkan, 1987).
Thus, it is of high relevance to study the field of political education, which, in this
article, is defined as `the knowledge, attitudes, and skills necessary for citizens to participate
in the political process`. This definition is distinct from
in the literature, is treated in a broader manner; it is instilling in young people the knowledge,
skills and attitudes that will enable them `to participate in the communities of which they are a
part, locally, nationally and globally` (Arthur, Davies and Hahn 2008, p.5, own italics).
An example of institutionalized political education can be found in Norway where mock
elections were introduced after the Second World War to promote democratic participation,
values and attitudes for the future (Storstein, 1946). The mock elections have expanded through

the last 70 years to include all upper secondary schoolsi. Norway is the sole country in the world
with a long tradition for and a national frame to this activity, which is conducted every second
year a week before the local or Parliamentary elections. The Norwegian mock elections involve
other educational features than the act of voting. There is a school debate where youth
politicians visit the school and debate current political issues, and since 2011 there has also
been an election square. The election square is a market place where the students can meet and
interact with party members from the political youth organizations.
This study is based on data from the 2013 School Election Surveys (SES), collected by
the Norwegian Centre for Research Data (NSD)ii, and conducted among students in upper
secondary schools in Norway in the classrooms either later the same day or a few days after the
mock election has taken place. In 2013, there were 177 participating schools in the survey across
the country. To avoid selection bias due to school variances, this analysis is based on a sample
of students weighted on educational program and geography (N=1611).
The relation between education and political participation is perhaps the most well-
established relation that exists in research on political behavior (Persson 2015, p.689).
However, we do not know the mechanisms at work. Persson (2015, p.691) asks whether
education is a direct cause of political participation or if it works as a proxy for other factors.
`The Absolute Education Model` suggests that it is the skills and knowledge gained through
education that matters; the `Pre- adult Socialization Model` is the extreme alternative where
education is merely a proxy for factors such as family socioeconomic status, or political
socialization in the home environment and personal characteristics.
I conduct a multivariate logistic regression analysis to test if voting in mock elections
in the Parliamentary election and
whether this effect persists after controlling for background factors. It is important to keep in
mind that the study does not have an experimental design. The mock election takes place earlier
in the day or a few days before the students answer the survey, and the causal effect might be
understood as if participating in mock elections is responsible for students` positive attitudes
towards voting. However, in general, a process has many causes. Statistical studies, which omit
all contextual factors except those codified in the variables selected for measurement or used
for constituting a population of cases, necessarily leave out many contextual and intervening
variables (George and Bennett 2005, p.21). Therefore, it might be that the students who
participated in the mock elections already were favorable towards attending elections and that
other underlying factors can explain the relation between voting in mock elections and
willingness to vote in the Parliamentary election.
(Angrist and Pischke, 2015). All schools conduct mock elections and almost all students
participate, thus it is difficult to provide comparable individuals that did not have the
opportunity to vote in mock elections.
However, one of the current debates in civic and political education research regards the
role the school plays in comparison to background factors (such as parental socialization see
for example Neundorf et al., 2015). In this case, the mock elections make an interesting test. If
voting in in the
Parliamentary election and this effect persists after controlling for background factors such as
pre- adult socialization factors, it strengthens the case for political education in school.
Section 2 provides a brief overview of the literature on political education in school with
regard to political participation before moving on to the presentation of the case of Norwegian
mock elections in section 3. Section 4 presents the data and method applied in the empirical
analysis. The results are presented in section 5. Finally, a discussion and conclusion follow.

2. POLITICAL EDUCATION AND POLITICAL PARTICIPATION
In regard to research on political education in school, many scholars, based on the
writings of John Dewey, argue in favor of active learning through participation such as live
simulations in class, hands-on experiences with political campaigns and voting (Coffey, Miller
and Feurestein, 2011), mock trials (Bengston and Sifferd, 2010), mock congress and other
forms of project-based learning (Parker et al., 2013). Others focus on the general democratic
atmosphere of the school, such as having an open classroom climate (Sherrod, Torney-Purta
and Flanagan 2010; Hooghe and Stolle, 2004). For instance, Hooghe and Dassonneville (2013)
show how an open classroom climate promotes the willingness to vote in future elections among
adolescents by presenting several sides of the issues, encouraging students to express their own
opinions, and encouraging them to make up their own minds and discuss issues with people
having different opinions.
The whole idea about active learning and schools as democratic institutions is to enable
students to participate and, thus, learn from their democratic experiences (Solhaug 2003). The
underlying theoretical assumption is that participatory experiences in school are transferred to
Through engagement in an activity, individuals change and handle a later
situation in ways prepared by their own participation in the previous situation (Rogoff 1995,
p.153). However, there is minimal knowledge regarding mock elections. The mock elections in
Norway provide an excellent case study of active learning because it offers a meeting place
between youth politicians and students in a school debate, an election square and the
opportunity to vote in all upper secondary schools. Thus, the mock elections as political
education also taps into the debate of what active learning is. This study tests the effects of three
and voting in mock elections, on the students` willingness to vote in the Parliamentary election.
By now, it has become generally accepted that there is a wide array of factors that may
be of importance when explaining the intentions of political participation. On the one hand,
scholars stress contextual factors (Campbell, 2006), institutional frameworks (Lijphart, 1999),
individual level predictors of socio-demographics such as gender, age and socioeconomic status
(Wolfinger and Rosenstone, 1980) or resources such as time, money and civic skills (Brady,
Verba and Schlozman, 1995). On the other hand, Almond and Verba`s (1963) cross cultural
study was a main breakthrough in the 1960s highlighting the role of individual level cognitive,
evaluative and affective explanations. Researchers agree the following individual level
background variables are of basic relevance, and they are expected to be so in the Norwegian
case: gender, place of residence, educational program, socio-economics and previous political
action experiences.
First, there has been persistence in the gender gap (Inglehart and Norris, 2003) where
men traditionally have been found to participate to a higher extent than women in all forms of
political participation. However, studies on adolescents have shown that girls and boys tend to
prefer different forms of participation and that girls are in fact more likely to state that they will
vote than boys (Hooghe and Dassonneville, 2013; Hooghe and Stolle, 2004). In Norway,
previous research has found no gender gap effect (Strømsnes, 2003).
Second, more political activity is predicted in urban rather than in rural settings
according to the center-periphery paradigm (Lipset and Rokkan, 1967). The levels of political
participation vary, particularly with regards to voter turnout in the Northern part of Norway
(lower voter turnout) and the Southern part. Additionally, immigrants from outside Western
Europe typically have a lower rate of political participation in Norway than other groups. At
the Parliamentary election of 2013, the immigrant turnout rate was approximately 50 percent
compared to 78.2 percent (SSB 2014) for the general population.

Third, previous research has shown that students in general educational programs
(academics) are more likely to participate and to intend to participate politically than students
from vocational programs (Ekman, 2007). In Norway, school education is compulsory to the
10th grade, and nearly all students attend upper secondary school as well. However, upper
secondary school offers both general educational programs, which approximately six of ten
students attend; and vocational programs (SSB 2016).
Fourth
occupation, which has traditionally been a strong predictor of participation (Wolfinger and
Rosenstone 1980), the students are naturally not asked about their income and occupation since
they are students. However, the survey includes a question regarding the parents education
ly background (Lauglo and Øia 2006),
and political socialization in the home environment.
The previous political action experiences the students have may be an indicator of a
(Beaumont et al., 2006).
Being a member of an organization can have a positive impact on participation and attitudes
towards participation. Those who are already active in youth associations and volunteering are
more likely to participate later on (Hooghe, 2003). A consistent finding in research thus far is
becoming a member of a political party, whereas direct forms of participation such as boycotts,
demonstrations and short-term engagements increase in scope (White, Bruce and Ritchie, 2000;
Taft, 2006; Dalton, 2008; Ødegård, 2010). In accordance with this finding, Quintelier (2015)
argues that organizations are the political socialization agents with the strongest effect on
political behavior among adolescents. In Norway, the youth organizations of the political parties
are essential parts of the mock election.

3. THE NORWEGIAN CASE OF MOCK ELECTIONS AT SCHOOL
At a macro level, political education is introduced in schools to imbue in young people
the appropriate behavior to uphold the political system (Easton, 1965). According to March and
Olsen (1995), democratic states depend on institutions to create democratic citizens. In Norway,
the mock elections have become an institution of political education; however, there are mock
elections conducted by organizations and school in countries around the world (McDevitt and
Spiro 2006; Linimon and Joslyn, 2002; Undervisningsministeriet 2015, MUCF 2015). These
mock elections differ with regards to educational policies such as school support and
cooperation with organizations, age (who participates and when), curriculum, whether the mock
elections are an integrated part and the teaching practices are related to them, the actors (roles
of teachers and youth parties) and the publication of the results.
In Norway, the mock elections are nationally coordinated, administered by the
Norwegian Centre for Research Data (NSD) and financed by the Norwegian Directorate for
Education and Training. The NSD analyzes and reports the results. The mock elections have
received increased attention from the media, politicians and society in general, and all schools
arrange them prior to parliamentary and local elections in Norway. Thus, all students have had
the possibility to vote at least once in school before actually receiving the right to voteiii. The
activities proceed as follows: The school debate assembles one representative from each of the
seven major political parties, and they present several political issues chosen by either the
teachers or a few of the students. The duration of the debate varies from school to school, from
one hour to two and a half hours; students gather in a gymnasium or assembly hall. During the
debate, the politicians discuss current political events and issues. Thereafter, there is an election
square where the students have the opportunity to participate in discussions with the party
representatives and ask them about specific political issues they are interested in. Either the
same day or a few days after the party politicians have visited the school; the school conducts
the mock election in a classroom, a gym or a common area. There was a turnout in the mock
election in 2013 of 81.1 percent (NSD 2013).
4. DATA AND METHOD
The main purpose of this study is to investigate the effects of voting in mock elections on
the students` willingness to vote in the following Parliamentary election. As was noted in the
introduction in section 1, the idea is to test if voting in mock elections proves to have an effect
in the Parliamentary election, and whether this effect
persists after controlling for background factors such as pre- adult socialization factors (Person
2015, p. 691).
and behavior in addition to background information. The dependent variable is willingness to
vote in the Parliamentary election
with the twofold question is avoided by solely examining those who have the right to vote.
When excluding everyone who did not have the right to vote, the sample consists of 1611
students. Of those, 9.4 percent responded that they have the right to vote, but do not intend to
vote, and the significant majority of 90.6 percent said they have the right to vote and do intend
to vote. This is a high number, particularly because first time voters at the age of 18-21 generally
have a lower turnout than the remainder of the population. In the Parliamentary election in
2013, the turnout rate among first time voters was 66. 5 percent, an increase from 56. 2 percent
in 2009. In the local election in Norway of 2011, 46 percent of first time voters decided to cast
a ballot on Election Day compared with 33 percent four years earlier (Bergh 2013).iv In this
context, I want to emphasize two aspects.

willingness to vote. The survey is conducted after
the mock election, approximately one week before the Parliamentary election. Therefore,
whether the students actually have voted is not the focus of the analysis. Nevertheless, asking
about the likelihood of future political participation is, in most youth research, the sole means
of grasping electoral behavior among a group that does not have the right to vote (Hooghe and
Dassonville, 2013; Torney-Purta, et al., 2001). There is a large discrepancy between intentions
to vote and actual turnout rates for first time voters. Two reasons may explain this. One regards
how survey data may overstate turnout because respondents misreport their own participation
(Denny and Doyle, 2008)v. The other reason may be that abstainers are typically less likely than
voters to participate in surveys overall. However, in this case, the students are encouraged to
answer and complete the survey during class, which ensures a non-biased and high response
rate.vi
Second, there are methodological considerations to consider when working with a
highly skewed sample. Of the 1611 students who had the right to vote, 1459 reported intentions
of voting, whereas 152 stated that they had the right to vote but did not want to use it. One
challenge is that the study may suffer from a small-sample bias (King and Zeng, 2001). What
is important with regards to sufficient variation on the dependent variable in a logistic
regression is that the total sample is sufficiently high to include a high number of cases on each
value (1) or (0). The number of students who said that they did not intend to vote was three
digits, and this is not an excessively small number. Because the research question has a
dependent variable, which is a dummy, logistic regression was applied.
Two additional comments must be made before the presentation of the results. First, the
sample in this study consists of a particular group of respondents, and the results may not be
generalizable to groups other than students. Second, 2013 was chosen as an empirical snapshot
of the mock election because this is the first time the survey included questions about election

squares. The election squares were introduced as an alternative to school debates in 2011vii. I
therefore have the unique opportunity to examine the effects of participating in the three
elements of the mock elections on the students` willingness to vote in the Parliamentary
election.
The strategy of the analysis presented in the next section is to start out with a binary
analysis of the impact of voting in the mock election, followed by the activities of the mock
election in detail: the effects of participating in the school debate and the election square on
II) examines the effect of participating in the political education of mock elections at school
controlling for the background factors expected to have an impact on intentions of political
participation.
5. ANALYSIS AND RESULTS
Does voting in mock elections at school have an effect on the students` willingness to vote in
the following Parliamentary election? A high majority of the students in the sample voted in
the mock elections at school. There were 1359 students who participated, and 221 who did not
(N=1580, 31 respondents N.A). A correlation analysis was computed to examine the relation
between voting in the mock election and the intentions of voting in the Parliamentary election.
Overall, there is a weak and positive correlation (r = 0.212,N= 1580, p= .000) between voting
Exploring the relations more thoroughly in a cross tabulation in Table 1 reveals that 88.4
percent of the students who voted in the mock election intended to vote in the Parliamentary
election.

Table 1: The relationship between voting in the mock election and intentions to vote in the Parliamentary election of 2013
Intention to vote in Parliamentary election YES NO
Did you vote in the mock election?
NO 11,6 % (166)
36,7 % (55)
YES 88,4 % (1264)
63,3 % (95)
Total 100,0 % (1430)
100,0% (150)
Moving to a binary analysis of the impact of voting in the mock election, the results
presented in Table 2 below show that there is a positive and significant effect of voting in the
mock election. Voting in the mock election increases the likelihood that students intend to vote
in the following Parliamentary election. The Exp(B) column, the Odds Ratio, tells us that the
students who have voted in the mock election at school are about 4 and a half times (or 340
percent) more likely to be willing to vote in the Parliamentary election than those who have not
participated in the mock election. The explained variance of voting in the mock election on the
willingness to vote is 7. 3 percent.
Table 2: The impact of voting in the mock election at school on whether the students intend to
vote
Voting in the mock election 4.408 (.188)*** Nagelkerke .073 N 1580
Note: The table shows the Odds Ratio (Exp (B) and (S.E). *** p < .001
Table 3 below explores the impact of attending the school debate and the election square
on the intention to vote in the following Parliamentary election. In regard to the activities of
mock elections, it is necessary to emphasize that all students do not engage in all activities. It

may very well be that a student participates in the debate but does not attend the mock election
or vice versa. In addition, the election square has a different, less mandatory feel to it. In the
sample (N=1611), 64.4 percent of the students attended the debate, whereas 40.5 percent
attended the election square. There is a weak and positive correlation (r = 0.137, N= 1611, p =
.000) between attending the school debate and the students willingness to vote in the
Parliamentary election of 2013. This finding is also the case with attending the election square
(r = 0.115, N=1611, p=.000).
The results in Table 3 show that students who were present at the school debate are 2.2
times (or 122 percent) more likely to be willing to vote in the Parliamentary election than the
students who were absent from the school debate. Also, the students who attended the election
square were about 2.3 times (or 129 per cent) more likely to intend to vote in the Parliamentary
election than their schoolmates who did not visit the party representatives at the election square.
In addition, voting in the mock election continues to have a strong and positive effect on the
willingness to vote in the Parliamentary election. The overall goodness of fit experiences an
increase to 12.4 percent.
Table 3: The impact of attending the school debate and election square on the intention to vote
Model I Voting in the mock election 3.778 (.194)*** Attending the school debate 2.218 (.179)*** Attending the election square 2.289 (.209)*** Nagelkerke .124 Hosmer & Lemeshow test .997 N 1580
Note: The table shows the Odds Ratio (Exp (B )and (S.E). *** p < .001
From the results in Model I, the conclusion may be derived that the mock elections have
willingness to vote in the Parliamentary election. What
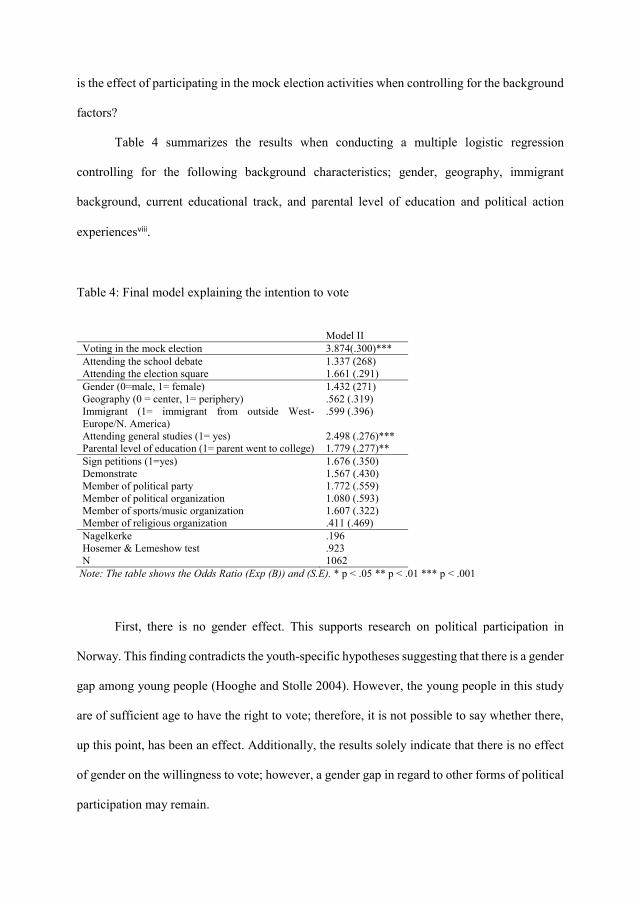
is the effect of participating in the mock election activities when controlling for the background
factors?
Table 4 summarizes the results when conducting a multiple logistic regression
controlling for the following background characteristics; gender, geography, immigrant
background, current educational track, and parental level of education and political action
experiencesviii.
Table 4: Final model explaining the intention to vote
Model II Voting in the mock election 3.874(.300)*** Attending the school debate Attending the election square
1.337 (268) 1.661 (.291)
Gender (0=male, 1= female) 1.432 (271) Geography (0 = center, 1= periphery) .562 (.319) Immigrant (1= immigrant from outside West-Europe/N. America)
.599 (.396)
Attending general studies (1= yes) 2.498 (.276)*** Parental level of education (1= parent went to college) 1.779 (.277)** Sign petitions (1=yes) 1.676 (.350) Demonstrate 1.567 (.430) Member of political party 1.772 (.559) Member of political organization 1.080 (.593) Member of sports/music organization 1.607 (.322) Member of religious organization .411 (.469) Nagelkerke .196 Hosemer & Lemeshow test .923 N 1062
Note: The table shows the Odds Ratio (Exp (B)) and (S.E). * p < .05 ** p < .01 *** p < .001
First, there is no gender effect. This supports research on political participation in
Norway. This finding contradicts the youth-specific hypotheses suggesting that there is a gender
gap among young people (Hooghe and Stolle 2004). However, the young people in this study
are of sufficient age to have the right to vote; therefore, it is not possible to say whether there,
up this point, has been an effect. Additionally, the results solely indicate that there is no effect
of gender on the willingness to vote; however, a gender gap in regard to other forms of political
participation may remain.

Second, there is also no effect of whether the students live in urban or rural areas nor
the immigrant variable on their willingness to vote, contradicting the expectation that there is
lower political participation among people in the Northern part of Norway and immigrants.
Third, membership in
willingness to vote as opposed to Quintelier`s findings (2015) that organizations have the
strongest effect on political behavior among adolescents. In addition, partaking in
demonstrations does not have a significant effect. This result supports the persistent finding in
research on political participation among youth that there exists a distinction between informal
and formal forms of political participation.
The results in Table 4 further show that two background factors, attending general
studies and parent`s educational program, have a positive and significant impact on the students
willingness to vote. The students who attend general educational programs are about 2.5 times
(or 149 percent) more likely of being willing to vote than the students who attend vocational
education programs. Additionally, the students who have a parent who has attended college are
about 1.7 times (or 77.9 percent) more likely to be willing to vote in the Parliamentary election
than the students who do not have college educated parents.
A main finding in Table 4 is that participating in the mock election continues to have a
strong and significant effect. The students who have voted in the mock election at school are
about 3.8times (or 287 percent) more likely to be willing to vote in the Parliamentary election
than those who have not participated in the mock election. All the other variables lose
significance with the exception of educational program and parental level of education.
Although participating in the school debate and election square had significant effects on
students intentions of voting in Model I, the significance of the effects were lost in the final
model. Neither participation at the debate nor the election square have an effect on the students`

willingness to vote in the following Parliamentary election when controlling for the background
factors.
y analysis had
an explanatory power of approximately seven percent. The first model analyzed the effects of
the activities of the mock election, explaining as much as twelve percent of the variance.
However, the final model appears to fit better than the previous, explaining nearly 20 percent
of the students willingness to cast a ballot on Election Day.
6. DISCUSSION
Examining the effect of mock elections is interesting in itself because it contributes to
our prior understanding of what influences political participation. The persistence of the effect
ontrolling for background
factors strengthens the case for political education in school.
Political education can be defined as the knowledge, attitudes, and skills necessary for
citizens to participate in the political process. There is no doubt that voting in the mock election
has an influence on students attitudes because the findings in this study show that voting in
mock elections increases the willingness to vote. What may explain this?
When mock elections are conducted at school, it simulates a Parliamentary election
because the votes cast do not actually elect anyone. As a simulation, mock elections become a
interrupt the classroom routine to make time for voting. Then, when the students partake in the
election, they observe other students casting ballots and the teachers encouraging them to do
so. Thus, voting at school becomes a means of promoting voting as the norm. It is an activity
that interrupts the da
elections are also a means for students to express their political identities: am I someone who
votes? The results of the mock elections paint a picture of the political voice of youth today.
perspectives on mock elections as political education? Additionally, qualitative differences in
how the schools conduct the mock elections can lay the framework for a comparative analysis
of schools. For instance, are the students encouraged to participate by their teachers? Is the
mock elections organized freely, or are the student followed to the voting booths? How do these
school-level factors impact stud
This study shows that practice and participation in activities in school is a means of
enabling youth to participate in the political process. However, the effect is limited to voting in
the mock election, and not partaking in the activities of the mock election: the school debate
and the election square. This is interesting particularly because the school debate is the main
event the schools organize, to the extent that it has become an institution of political education
in itself. During this debate, young party politicians present their view on various political
issues. According to the literature, a willingness to vote can be promoted by presenting several
sides of the issues, encouraging students to express their own opinions and decide for
themselves and to discuss issues with people having different opinions (Hooghe and
Dassonneville 2013). Initially, the debate would fulfill the two criteria of bringing current
political events and debates into school and presenting several sides of the political issues,
therein promoting the students` willingness to vote. However, the debate has no effect on the
with people having different opinions also has no effect. This article tests the effect of
participating in the mock elections as active learning. The findings show that the active learning
Without in-depth studies of the activities occurring in relation to the mock election, it is difficult

to explain their lack of effect. Thus, further studies need to explore what occurs when the
political youth parties and the students meet and interact.
Additionally, the findings in this study emphasize the continued relevance of two
but one arena for political education, in which youth make up their minds regarding electoral
participation. The influence of parents cannot be underestimated. The pre- adult socialization
factor of what occurs at home has a significant impact. These findings have implications for
political education because it emphasizes the limits of educational efforts. Political education
Second is the students` educational track. Although the latter may be a proxy for other
underlying factors (Persson, 2012), which navigate certain students into vocational education
and others into general education, there are also differences in the political education curriculum
in the two tracks that can offer possible explanations. In the Norwegian upper secondary school
(grade 11-13), social studies is a two-hour course per week the first or second year for all
students. However, the students in general education can also choose to specialize in social
studies. The different curricula give more time for political education in general than in
vocational educational programs. There is no potential in the data to explore the possible effects
of the students` specializations in the general program on the willingness to vote, which would
provide more information about the effects of political education with regards to form and
scope.
The findings in this study reveal certain factors that influence students` willingness to
vote; however, most of the variance remains unexplained. In sum, the model explains 20 percent
of
remainder? When surveyed, the students report an intention to vote; however, on Election Day,
many young people who obtain the right to vote for the first time choose not to participate.
Thus, what actually makes first time voters decide to vote is yet another part of the story.
Therefore, further studies should examine subjective factors and, particularly, the individual
motivations to understand what makes young people tune in to formal politics.
7. CONCLUSION
The aim of this study has been to examine the role mock elections as political education
in school play in stimulating young people to vote. While voting in the mock elections has an
effect on students` willingness to vote in the following Parliamentary election, partaking in the
mock election activities of the school debate and the election square does not. This underlines
the importance of research on teaching and learning on the topics of politics and democracy
with regards to present and future political participation among youth.
REFERENCES
Almond, G. A. and Verba, S. (1963) The civic culture: political attitudes and democracy in five nations. Newbury Park, Calif.: Sage Publications Angrist, J. D., and Pischke, J. (2015.). Mastering 'metrics: The path from cause to effect. Princeton University Press. Arthur, J., Davies, I., and Hahn, C. (Eds.) (2008) The SAGE handbook of education for citizenship and democracy. London: SAGE Bengston, T., J. and Sifferd, K.L. (2010) `The Unique Challenges Posed by Mock Trial: Evaluation and Assessment of a Simulation Course.` Journal of Political Science Education 6(1), pp.70-86. Beaumont, E., Colby, A., Ehrlich, T., Torney-Purta, J. (2006) Promoting Political Competence and Engagement in College Students: An Empirical Study. Journal of Political Science Education, 2 (3), 249-270. Bergh, J. (2013). Valgdeltakelse i ulike aldersgrupper. Historisk utvikling og oppdaterte tall fra Stortingsvalget 2013. [Turnout in different age groups. Historical development and updated numbers from the Parliamentary election of 2013]. Institutt for samfunnsforskning. Oslo 2013. Brady, H.E, Verba, S. and Schlozman, K.L (1995) Beyond SES: A Resource Model of Political Participation. The American Political Science Review. 89 (2), pp. 271-294.
Campbell, D. E. (2006) Why We Vote: How Schools and Communities Shape Our Civic Life. Princeton, NJ: Princeton University Press. Coffey, Daniel J., Will Miller and Derek Feuerstein. (2011) `Classroom as Reality: Demonstrating Campaign Effects through Live Simulation.` Journal of Political Science Education 7, pp. 14-33. Dalton, R. J. (2008) `Citizenship norms and the expansion of political participation`. Political Studies, 56, 76-98. Delli Carpini, M. X., and Keeter, S. (1996) What Americans know about politics and why it matters. New Haven [Conn.]: Yale University Press. Denny, K. and Doyle, O. (2008) `Political Interest, Cognitive Ability and Personality: Determinants of Voter Turnout in Britain.` British Journal of Political Science 38, 291 310. Easton, D. (1965) A Systems Analysis of Political Life, New York: Wiley Ekman, T. (2007) Demokratisk kompetens om gymnasiet som demokratiskola. [Democratic competence- about upper secondary school as a democratic school]. Göteborg: Statsvetenskapliga institutionen. Falch, T. and Nyhus, O.H (2009) `Frafall fra videregående opplæring og arbeidsmarkedstilknytning for unge vaksne`. [Dropout from upper secondary school and attachement to the labor market] SØF-rapport nr. 07/09. Galston, W. A (2001) Political knowledge, political engagement, and civic educaiton. Annual Review of Political Science 4, 217-234. George, A.L., and Bennett, A. (2005). Case studies and Theory development in the social sciences. Cambridge, MA: MIT Press. Hooghe, M. (2003) Participation in voluntary associations and value indicators: The effect of current and previous participation experiences. Nonprofit and Voluntary Sector Quarterly 32(1), pp. 47-69. Hooghe, M., and Stolle, D. (2004) Good girls go to the polling booth, bad boys go everywhere: gender differences in anticipated political participation among American fourteen-year-olds. Women and Politics, 26 (3and4), pp. 1 23. Hooghe, M., and Dassonneville, R. (2013) `Voters and Candidates of the Future: The Intention of Electoral Participation among Adolescents in 22 European Countries´, Young. Nordic Journal of Youth Research 21 (1), pp. 1-28. Hyman, H. (1959) Political socialization. New York, NY, US: Free Press Inglehart, R., and Norris, P. (2003) Rising Tide: Geneder Equality and Cultural Change around the World. Cambridge University Press. King, G. and Zeng, L. (2001) `Logistic Regression in Rare Events Data.` Political Analysis 9, 137-163. Kortizinsky, T. (2012) Samfunnskunnskap- fagdidaktisk innføring. [Social studies- an introduction to didactics]. Universitetsforlaget.
14/06. Oslo: NOVA Norwegian Social Research.

Lijpart, A. (1999) Patterns of democracy. Yale University Press. Linimon, A. and M. R. Joslyn (2002) `Trickle up Political Socialization: The Impact of Kids Voting USA on Voter Turnout in Kansas`. State Politics and Policy Quarterly 2(1), pp.24-36. Lipset, S. M and Rokkan, S. (1967) (eds), Party Systems and Voter Alignments, New York: Free Press March, G. J., and Olsen, J. P. (1995) Democratic Governance. New York - London -Toronto Sydney - Tokyo - Singapore.: The Free Press. Markussen, E. (2009) Videregående opplæring for (nesten) alle. [Upper secondary school for (almost) everyone]. Cappelen akademisk. McDevitt, M., and Spiro K. (2006) Experiments in Political Socialization: Kids Voting USA as a Model for Civic Education Reform. CIRCLE Working Papers 49, pp. 1 52. MUCF (2015) Öva och ta ställning. En utvärdering av arbetet med skolvalen 2014. [Practice taking a position. A report of the work of mock elections 2014]. Myndigheten för ungdoms- och civilsamhällesfrågor. Neundorf, A., Niemi R.G., and Smets, K. (2015) The Compensation Effect of Civic Education of Political Engagement: How Civic Classes Make Up for Missing Parental Socialization. Working Papers Series in Politics.Nuffield College. NSD Samfunnsveven. https://www.samfunnsveven.no/
Parker, W. C., Lo., J., Yeo, A.J, Valencia, S.W, Diem, N., Abbott, R.D, Nolen, S.B, Bransford, J.D and Vye, N.J (2013). Beyond breadth-speed-test: Toward deeper knowing and engagement in an Advanced Placement course American Educational Research Journal, 50(6), 1424-1459.
Persson, M. (2012) Does Type of Education Affect Political Participation. Results from a Panel Survey of Swedish Adolescents Scandinavian Political Studies. Volume 35, Issue 3. Persson, M. (2015) Education and Political Participation. British Journal of Political Science 45, pp 689-703 doi:10.1017/S0007123413000409. Putnam, R. (2000) Bowling Alone: The Collapse and Revival of American Community. New York: Simon and Schuster. Quintelier, E. (2015) Engaging Adolescents in Politics: The Longitudinal Effect of Political Socialization Agents Youth and Society 47, pp. 51-69. doi:10.1177/0044118X13507295 Rogoff, B. (1995). Observing sociocultural activity on three planes: participatory appropriation, guided participation, and apprenticeship. In: Wertsch, J.V, Rio, P, and Alvarez,A. (Eds.) Sociocultural Studies of Mind. Cambridge; New York: Cambridge University Press, pp. 139165. Rokkan, S. (1987). Stat, nasjon, klasse.[State, Nation, class]. Universitetsforlaget Oslo Sherrod, L., Torney-Purta J.and Flanagan, C. A. (2010) Handbook of Research on Civic Engagement in Youth. John Wiley and Sons, Inc. Solhaug, T. (2003) Utdanning til demokratisk medborgerskap [Education for democratic citizenship]. Oslo, Institutt for lærerutdanning og skoleutvikling, Universitetet i Oslo. SSB (2014) https://www.ssb.no/valg/statistikker/vundinnv/hvert-4-aar/2014-01-16

SSB (2016) https://www.ssb.no/utdanning/statistikker/vgu/aar/2016-02-25 Storstein, O. (1946) Fremtiden sitter på skolebenken. [The future is at school]. Tiden norsk forlag Strømsnes, K. (2003) Folkets makt: medborgerskap, demokrati, deltakelse. [Power of the people: citizenship, democracy and participaiton]. Oslo: Gyldendal akademisk
Meaning of Politics.` Politics and Gender 2, pp. 329-352. Torney-Purta, J., Lehmann, R., Oswald, H., and Schulz, W. (2001) Citizenship and education in twenty-eight countries: Civic knowledge and engagement at age fourteen. Amsterdam: IEA Undervisningministeriet (2015) http://www.emu.dk/modul/skolevalg-et-autentisk-gennemfper centC3per centB8rt-valg-elever-i-8-og-9-klasse-i-januar-2015. Wattenberg, M. P. (2012) Is voting for young people?: With a new chapter on the 2008 and 2010 election. New York: Pearson Longman. White, C., S. Bruce and J. Ritchie (2000) Young People's Politics: Political interest and engagements amongst 14- and 24-year olds, London: Joseph Rowntree Foundation. Wolfinger, R.E. and S.J Rosenstone (1980) Who votes? New Haven: Yale University Press. Ødegård, G. (2010) Motløs ungdom?: nytt engasjement i et gammelt demokrati. [Dejected youth? New political engagment in an old democracy]. Oslo: Akademisk publisering. Øia, T. (1995) Apolitisk ungdom? [Apolitical youth]. Cappelen Akademisk.
i The Norwegian school system can be divided into three parts: elementary school (Barneskole, age 6-13), lower secondary school (Ungdomsskole, age 13-16), and upper secondary school (Videregående skole, age 16-19). Although there is a dropout rate of approximately 30 percent (Markussen 2009), many return; in addition, 81 percent of the students have completed the course of five years (Falch and Nyhus, 2009). ii NSD is not responsible for the analysis of the data presented here. iii There are 420 upper secondary schools in Norway: 341 county, 77 private and 2 at the state level (http://www.udir.no/Tilstand/Utdanningsspeilet/Utdanningsspeilet/Utdanningsspeilet-2013/1-Fakta-om-grunnskole-og-videregaende-opplaring/110-Fortsatt-nedgang-i-antall-videregaende-skoler-i-Norge/) In 2013, 419 of them arranged elections. One of the schools has students who are adults, and the school did not conduct a mock election. iv Whether this is a burst or a part of trend is a matter to follow with close scrutiny. v For instance, the questionnaire is distributed (immediately) after the mock elections, a week before Election Day. Thus, voting is all over the media, the school and (for some) at home. This may facilitate over-reporting. vi However, this may vary. It is an electronic survey, and there is of course a chance that the students do not actually spend the time provided to complete the forms but prefer other kinds of internet activities despite the teachers’ recommendations. vii After the 2011 Norway terror attacks in Oslo and at Utøya, where the Labor Party`s youth organization, AUF, was having a summer camp, the electoral campaign for the local elections were postponed. As a direct consequence of the attacks, the debates were canceled out of respect for the loss of many lives of young politicians. Instead, the politicians agreed to replace the school debate with an election square where the politicians would be available for questions. Although the debates were canceled in 2011, they returned in 2013 in addition to election squares. Therefore, 2013 is the second year with election squares in most schools.

viii Controlling for gender (1= female; 51,6 percent), geography (1= Troms, Finnmark, Nordland 13,1 percent), immigrant background (1= outside West- Europe/N. America; 10 percent), current educational track (1=general studies; 61, 5 percent), and parental level of education (1= at least one parent has attended college; 47,1 percent). Political action experiences: (N= (+/-) 1500); here referring to whether the students have signed petitions (1= 28.1 percent), participated in demonstrations (1=17,2 percent), are members of political parties (12,2 percent), other political organizations (8,5 percent), sports or music organizations (34,1 percent) and religious organizations (8,6 percent).