Tunable oscillations in the Purkinje neuron - UC...
9
PHYSICAL REVIEW E 85, 041905 (2012) Tunable oscillations in the Purkinje neuron Ze’ev R. Abrams, 1,2 Ajithkumar Warrier, 1 Yuan Wang, 1 Dirk Trauner, 3 and Xiang Zhang 1,2,4,* 1 NSF Nanoscale Science and Engineering Center, 3112 Etcheverry Hall, University of California, Berkeley, California 94720, USA 2 Applied Science & Technology, University of California, Berkeley, California 94720, USA 3 Department of Chemistry and Biochemistry, Ludwig-Maximilians-Universit¨ at M ¨ unchen (LMU), Butenandtstrasse 5–13, 81377 Munich, Germany 4 Material Sciences Division, Lawrence Berkeley National Laboratory, Berkeley, California 94720, USA (Received 27 October 2011; revised manuscript received 18 January 2012; published 9 April 2012) In this paper, we experimentally study the dynamics of slow oscillations in Purkinje neurons in vitro, and derive a strong association with a forced parametric oscillator model. We observed the precise rhythmicity of these oscillations in Purkinje neurons, as well as a dynamic tunability of this oscillation using a photoswitchable compound. We found that this slow oscillation can be induced in every Purkinje neuron measured, having periods ranging between 10 and 25 s. Starting from a Hodgkin-Huxley model, we demonstrate that this oscillation can be externally modulated, and that the neurons will return to their intrinsic firing frequency after the forced oscillation is concluded. These findings signify an additional timing functional role of tunable oscillations within the cerebellum, as well as a dynamic control of a time scale in the brain in the range of seconds. DOI: 10.1103/PhysRevE.85.041905 PACS number(s): 87.19.lh, 03.65.Ge, 87.19.ll, 87.19.lj I. INTRODUCTION The Purkinje neuron (PN) is the largest neuron in the cerebellum, with over 100,000 inputs and a single output axon [1,2]. Due to its geometry and orientation in the cerebellum, it has been cited as a possible integrator for the motor control system of the brain [2], with many basic neuroscience and artificial intelligence theories based on its complex neuronal network [3,4]. While most studies of the PN focus on biological sources of memory (plasticity) [5,6], a number of studies also describe the functionality of the cerebellum in terms of independent oscillators [6–8]. We have previously reinforced this set of theories with an experimental study demonstrating the intrinsic firing charac- teristics of the PN [9,10]. We identified three frequency bands inherent to the PN, which we denoted as the sodium (Na + ; >30 Hz), calcium (Ca 2+ ; 1–10 Hz), and switching bands (<1 Hz). This set of frequency bands is distinct from other regions of the brain [11–14], with the “switching” frequency described and measured for the first time [9]. This switching frequency operates at lower frequencies than those typically associated with memory and other cerebellar processes [14]; however, there have recently been parallel in vivo experiments that have demonstrated similar slow oscillations between 0.039 and 0.078 Hz [15]. We have used the terminology of digital circuits and nonlinear oscillators to describe the switching from rapid firing to quiescence as an astable mode, which oscillates between the “on” and “off” states in a rhythmic pattern, without maintaining any single state indefinitely (“astable”) [10]. This is in contrast with the known bistable mode in the PN [16–18], where the firing rate can be toggled between firing and quiescence and maintains that state indefinitely; or a monostable mode where the PN has been shown to fire rapidly in vivo with only brief pauses [19]. These three modalities are intrinsically linked, and we have postulated that a system exhibiting one of these modes will likely display the other modes under certain conditions [10]. * [email protected] This paper attempts to validate this claim by focusing entirely on the astable mode of firing. In this paper, we first show that every PN measured here in vitro can exhibit this slow form of astable oscillation when activated using pharmacological compounds. These slow oscillations are shown to be precise, maintaining the same rhythmic oscillation frequency over time with high quality factors of resonance. While we had previously described some cells displaying this oscillatory switching when measured in vitro, we show that this mode can be activated in every cell measured, thereby indicating an inherent functional role. Next, we modulate the frequency of these neurons using a unique form of highly specific, photoswitchable compound [20]. By doing this, we show that this frequency pattern acts as a forced oscillator when externally driven, and that the oscillations revert back to their initial frequency once the driving force is stopped. Using the Hodgkin-Huxley neuron model [21], we derive a form of parametric oscillator that describes the slow oscillations observed, as well as their ability to be externally tuned. Finally, we analyze the parameters of oscillation, and compare them with the existing literature to further understand the gating mechanism controlling this oscillation behavior of Purkinje neuron cells. The results are summarized in terms of neuronal oscillation models and cerebellar timing functions. II. METHODS Animal handling and care was done according to guidelines set by the Office of Laboratory Animal Care (OLAC) at UC Berkeley. Sprague-Dawley rats (aged 21 to 30 days) were initially euthanized using isoflurane and then decapitated. Their cerebella were isolated and 250-μm-thick parasagittal slices were obtained using a vibratome (Leica VT1000s) while submerged in a sucrose-based slicing media. Brain slices were transferred to an incubation chamber containing artificial cerebrospinal fluid (ACSF) bubbled with carboxygen (95% O 2 /5% CO 2 ) held at 37 ◦ C for 1–4 h prior to experiment. For a complete description of sample preparation, solutions used, and the optical patch-clamp setup, please refer to [9], which matched the experimental conditions here exactly. 041905-1 1539-3755/2012/85(4)/041905(9) ©2012 American Physical Society
Transcript of Tunable oscillations in the Purkinje neuron - UC...

PHYSICAL REVIEW E 85, 041905 (2012)
Tunable oscillations in the Purkinje neuron
Ze’ev R. Abrams,1,2 Ajithkumar Warrier,1 Yuan Wang,1 Dirk Trauner,3 and Xiang Zhang1,2,4,*
1NSF Nanoscale Science and Engineering Center, 3112 Etcheverry Hall, University of California, Berkeley, California 94720, USA2Applied Science & Technology, University of California, Berkeley, California 94720, USA
3Department of Chemistry and Biochemistry, Ludwig-Maximilians-Universitat Munchen (LMU),Butenandtstrasse 5–13, 81377 Munich, Germany
4Material Sciences Division, Lawrence Berkeley National Laboratory, Berkeley, California 94720, USA(Received 27 October 2011; revised manuscript received 18 January 2012; published 9 April 2012)
In this paper, we experimentally study the dynamics of slow oscillations in Purkinje neurons in vitro, andderive a strong association with a forced parametric oscillator model. We observed the precise rhythmicity ofthese oscillations in Purkinje neurons, as well as a dynamic tunability of this oscillation using a photoswitchablecompound. We found that this slow oscillation can be induced in every Purkinje neuron measured, having periodsranging between 10 and 25 s. Starting from a Hodgkin-Huxley model, we demonstrate that this oscillation canbe externally modulated, and that the neurons will return to their intrinsic firing frequency after the forcedoscillation is concluded. These findings signify an additional timing functional role of tunable oscillations withinthe cerebellum, as well as a dynamic control of a time scale in the brain in the range of seconds.
DOI: 10.1103/PhysRevE.85.041905 PACS number(s): 87.19.lh, 03.65.Ge, 87.19.ll, 87.19.lj
I. INTRODUCTION
The Purkinje neuron (PN) is the largest neuron in thecerebellum, with over 100,000 inputs and a single output axon[1,2]. Due to its geometry and orientation in the cerebellum,it has been cited as a possible integrator for the motor controlsystem of the brain [2], with many basic neuroscience andartificial intelligence theories based on its complex neuronalnetwork [3,4]. While most studies of the PN focus on biologicalsources of memory (plasticity) [5,6], a number of studiesalso describe the functionality of the cerebellum in terms ofindependent oscillators [6–8].
We have previously reinforced this set of theories with anexperimental study demonstrating the intrinsic firing charac-teristics of the PN [9,10]. We identified three frequency bandsinherent to the PN, which we denoted as the sodium (Na+;>30 Hz), calcium (Ca2+; 1–10 Hz), and switching bands(<1 Hz). This set of frequency bands is distinct from otherregions of the brain [11–14], with the “switching” frequencydescribed and measured for the first time [9]. This switchingfrequency operates at lower frequencies than those typicallyassociated with memory and other cerebellar processes [14];however, there have recently been parallel in vivo experimentsthat have demonstrated similar slow oscillations between0.039 and 0.078 Hz [15]. We have used the terminologyof digital circuits and nonlinear oscillators to describe theswitching from rapid firing to quiescence as an astablemode, which oscillates between the “on” and “off” statesin a rhythmic pattern, without maintaining any single stateindefinitely (“astable”) [10]. This is in contrast with the knownbistable mode in the PN [16–18], where the firing rate canbe toggled between firing and quiescence and maintains thatstate indefinitely; or a monostable mode where the PN hasbeen shown to fire rapidly in vivo with only brief pauses [19].These three modalities are intrinsically linked, and we havepostulated that a system exhibiting one of these modes willlikely display the other modes under certain conditions [10].
This paper attempts to validate this claim by focusing entirelyon the astable mode of firing.
In this paper, we first show that every PN measured herein vitro can exhibit this slow form of astable oscillationwhen activated using pharmacological compounds. These slowoscillations are shown to be precise, maintaining the samerhythmic oscillation frequency over time with high qualityfactors of resonance. While we had previously described somecells displaying this oscillatory switching when measured invitro, we show that this mode can be activated in every cellmeasured, thereby indicating an inherent functional role. Next,we modulate the frequency of these neurons using a uniqueform of highly specific, photoswitchable compound [20]. Bydoing this, we show that this frequency pattern acts as a forcedoscillator when externally driven, and that the oscillationsrevert back to their initial frequency once the driving forceis stopped. Using the Hodgkin-Huxley neuron model [21], wederive a form of parametric oscillator that describes the slowoscillations observed, as well as their ability to be externallytuned. Finally, we analyze the parameters of oscillation, andcompare them with the existing literature to further understandthe gating mechanism controlling this oscillation behavior ofPurkinje neuron cells. The results are summarized in terms ofneuronal oscillation models and cerebellar timing functions.
II. METHODS
Animal handling and care was done according to guidelinesset by the Office of Laboratory Animal Care (OLAC) at UCBerkeley. Sprague-Dawley rats (aged 21 to 30 days) wereinitially euthanized using isoflurane and then decapitated.Their cerebella were isolated and 250-μm-thick parasagittalslices were obtained using a vibratome (Leica VT1000s) whilesubmerged in a sucrose-based slicing media. Brain sliceswere transferred to an incubation chamber containing artificialcerebrospinal fluid (ACSF) bubbled with carboxygen (95%O2/5% CO2) held at 37 ◦C for 1–4 h prior to experiment. Fora complete description of sample preparation, solutions used,and the optical patch-clamp setup, please refer to [9], whichmatched the experimental conditions here exactly.
041905-11539-3755/2012/85(4)/041905(9) ©2012 American Physical Society

ABRAMS, WARRIER, WANG, TRAUNER, AND ZHANG PHYSICAL REVIEW E 85, 041905 (2012)
The stimulation of PNs was done by activating kainatereceptors using a variety of highly selective molecular kainatereceptor agonists (KRAs). These molecules act only uponkainate receptors without activating any of the other gluta-matergic receptors on the cell, particularly AMPA (α-amino-3-hydroxyl-5-methyl-4-isoxazole-propionate) receptors, whichare the majority of ionotropic glutamatergic receptors on PNs.Additional pharmacological blockers were used to isolatethe kainate response in the PN. The photoswitchable kainatereceptor agonist (PSKRA) [20] was used as a traditional KRAwhen in the dark. The photoresponse is described in Ref. [20],as well as in the text.
All drugs except the PSKRA were purchased via Sigma-Aldrich or Tocris Bioscience. Drugs were applied to theACSF reservoir and allowed to perfuse onto the slice usinga closed-loop system. Kainate activation of the PNs wasachieved using either highly specific KRAs, or monosodiumglutamate (MSG, 100 μM) in conjunction with an AMPAreceptor blocker GYKI-52466 (10–20 μM). The KRAsused consisted of the commercially available (2S,4R)-4-methylglutamic acid (SYM-2081, 10–50 μM), a nonselectiveGluK1/GluK2 agonist (nonselective for GluR5/6, selectiveover AMPA receptors), as well as the PSKRA. The PSKRAwas based upon a variant of the commercially available SYM-2081, called LY339434 [22], which was designed specificallyto be selective towards GluK1 (GluR5) over both GluK2(GluR6) and AMPA receptors, and was used at 50–100 μM,the ideal concentration as described in Ref. [20].
Additional network activity upon the cell was re-moved via the application of tetrodotoxin (TTX, 1 μM),which blocks most synaptic activity by silencing Na+ in-duced action potentials. Inhibitory synaptic transmissionwas blocked in some cells via the application of bothionotropic and metabotropic GABA blockers [GABAA wasblocked with GABAzine (SR-95531), 10 μM, or picrotoxin,PTX, 100 μM, and GABAB with 5-bis(1,1-dimethylethyl)-4-hydroxy-a,a-dimethylbenzenepropanol (CGP, 20 μM)], aswell as blocking glycine (strychnine, 1 μM). (RS)-a-methyl-4-carboxyphenylglycine (MCPG, 500 μM) was used to blockmGluR1/2 metabotropic receptors. Despite the PN havingno N -methyl-D-aspartic acid (NMDA) receptors, the possiblepresynaptic release of glutamate via NMDA receptors on theparallel fibers was preempted via the application of D-( − )-2-amino-5-phosphonopentanoic acid (APV, 50 μM). Completeblocking of excitatory glutamatergic inputs to the cell wasdone by adding and 6,7-dinitroquinoxaline-2,3(1H,4H)-dione(DNQX, 10 μM), which blocks both AMPA and kainate recep-tors. For each of these network activity blocking experiments,at least n = 2 cells were measured with the compounds listedabove.
Data analysis was done using a combination of PCLAMP
(Molecular Devices, Inc.), Microsoft Excel, and MATLAB
(Mathworks, Inc.) software. Patch-clamp sampling was doneat 10 kHz, and then decimated to 1 kHz for data analysis.Period/duty-cycle (DC) tracking was implemented using acustom code. The periods/DCs were tracked over time byselecting overlapping windows in time (30–60 s each, differentfor each cell), and collecting the start and stop times for spikebursts. “Off” times were defined as any period longer than 2 s,and the DC was calculated as the “On” times divided by the
full period (measured as the time between Off cycles, or Oncycles, within each window). Time-constant (τ ) evaluationof the forced modulation via the PSKRA was done usingthe MATLAB Curve Fitting Toolbox. The fitting was doneon a basic, time-shifted exponential decay function, of theform x(t) = xf − �x/ exp[−(t − t0)/τ , with the parametersdependent upon the data.
Fast Fourier transforms (FFTs) were done using standardMATLAB functions. The confidence intervals on the spectrumwere found by fitting a Gaussian function to the peak usingthe Curve Fitting Toolbox in MATLAB. This fitting providedthe 95% confidence intervals of the fit, which were plotted inFig. 2. The deviation of the oscillation frequency (in Fig. 2)can also be measured by the full width at half maximum(FWHM) as well as by fitting the Gaussian to obtain thestandard deviation. For a Gaussian fitting of the peak, thestandard deviation (SD) or σ is σ = FWHM/2.354. Broaderpeaks indicate higher fluctuations in the frequency. The qualityfactor Q of a resonator/oscillator is the ratio between the peakmeasured and the FWHM, which is an equivalent measure to itssignal to noise ratio (SNR), or the reciprocal of the coefficientof variation.
III. RESULTS
A. Induction of astability
We first demonstrate that PN will change its firing patternto that consisting of slow oscillations of Ca2+ spikes [23],nested within a slow switching envelope wave, when measuredin vitro using a current-clamp setup. Figures 1(a) and 1(c)display the recordings of two cells transitioning to this modeafter the application of KRAs in conjunction with tetrodotoxin(1 μM), which abolishes the Na+ spikes, and accentuates theunderlying Ca2+ spike pattern, as well as an AMPA receptorblocker (GYKI, 10 μM). The transition to a slow oscillationmode consisting of switching and calcium frequencies occursafter 0.5–2 min (green line in dotted box), after which a clearoscillation pattern is shown (gray line in dashed box). Onceinduced into this slow oscillation mode, the system retains itsrhythmic astability, with cells oscillating between firing Ca2+spikes and quiescence for up to 40 min in some cells. Theoscillation frequency can be measured from the highest peak inthe FFT of the recording, as shown in Figs. 1(b) and 1(d) beloweach recording. The sharp peaks in the FFT signify a clearoscillation frequency. The existence of some low-frequencypeaks in the initial firing pattern in Fig. 1(d) reveal that this lowfrequency was inherent to the cells, even before induction intothe astable mode via KRAs [9]. Results such as those displayedin Fig. 1 were obtained in n > 50 cells, with induction intothe astable mode occurring in nearly all of the cells measured,signifying the reproducibility of these results. Induction ofastability was possible using both the PSKRA in the dark (n >
50), as well as by using the commercially available compoundSYM-2081 (n = 8) from which the PSKRA was derived, aswell as using standard MSG in conjunction with blockingthe AMPA receptors (n = 3 of 5 cells; this method was lesspreferable due to the initiation of a depolarization block at highdoses of MSG, 100 μM). The SYM-2081 was used to verifythat the result was reproducible to other methods of kainate
041905-2

TUNABLE OSCILLATIONS IN THE PURKINJE NEURON PHYSICAL REVIEW E 85, 041905 (2012)
20 70 120 170 220 270 320 370-20
-10
0
10
20
30
40
Time [sec]
Volt
age
[mV
](a)
(b)
(c)
(d)
offon
0.1 10
1
2
3
4
5x 10⁵
Po
wer
[m
V2 /
Hz]
0.1 10
1
2
3
4
5x 10⁵
0.1 1
2468
10x 103
Frequency [Hz]
150 200 250 300 350 400
-10
0
10
20
30
40
Time [sec]
Volt
age
[mV
]
0.1 10
0.5
1
1.5
2
2.5
3
3.5
4 x 10⁴
Po
wer
[m
V2 /
Hz]
0.1 10
0.5
1
1.5
2
2.5
3
3.5
4 x 10⁴
Frequency [Hz]
0.1 1
2468
10x 103
FIG. 1. (Color online) Astability induction in a Purkinje neuron. [(a), (c)] Signal output recordings of cells transitioning to an astableoscillatory mode after applying a kainate receptor agonist (PSKRA, 100 μM) in conjunction with an AMPA receptor blocker (GYKI, 10 μM)and Na+ channel blocker (TTX, 1 μM). Clear oscillations are at the far right (gray line in dashed box), after a short transition period (green line indotted box). Inset: analogy between the astable firing/quiescence pattern with a digital oscillator switching between two states [(b), (d)] Fouriertransforms (power spectra) of the recordings before (black), during (green inset), and after (gray) the induction of oscillations (logarithmicx axis). A clear peak at 0.075 Hz can be seen in (b), whereas a split peak centered at 0.07 Hz is seen in (d), signifying a transition between twofrequencies for this wave form. The transition period of the cell in (a) contained some low-frequency signatures, whereas the transition periodin (c) contained nearly no low-frequency signature (other than zero-frequency noise).
activation, and not an artifact of the photoswitchable moietyof the PSKRA.
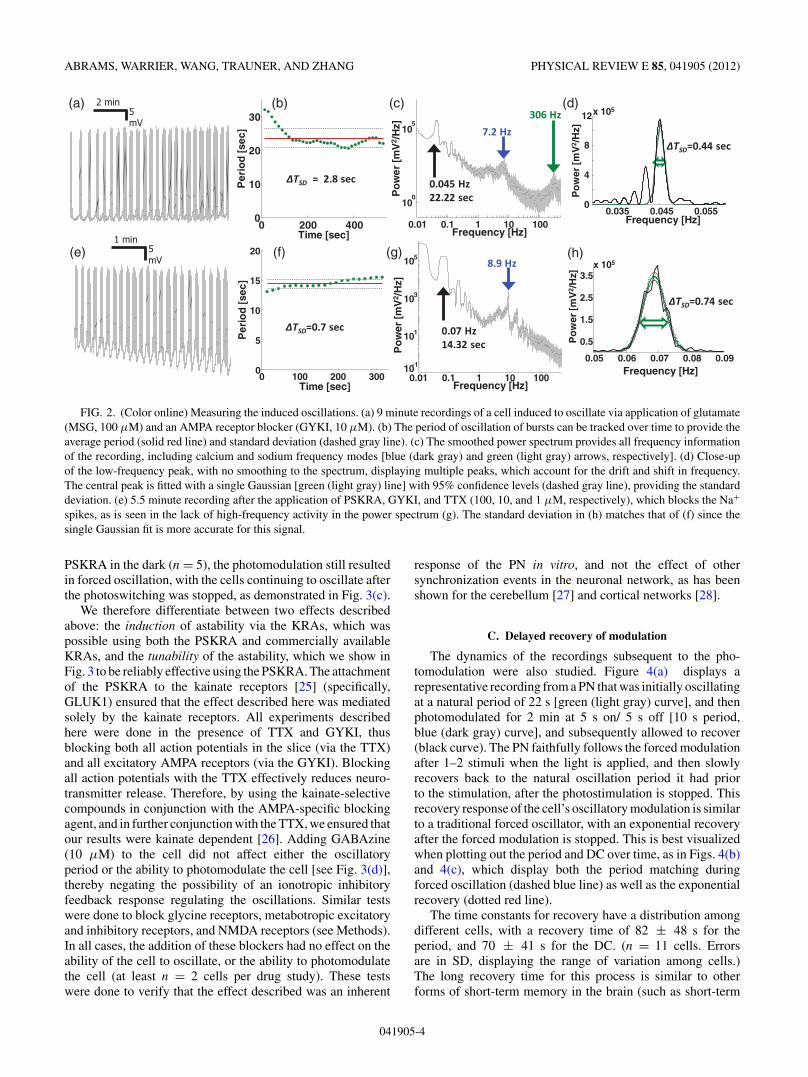
The frequency of the astable oscillations can be measuredby tracking the on/off transitions in time using a windowingalgorithm (see Methods), or directly by measuring the low-frequency peak in the Fourier transform. This is shown inFigs. 2(a) and 2(e) for two cells already induced into theastable mode using different pharmacological methods. In bothrecordings, a clear oscillation is seen for long periods of time(9 and 5.5 min, respectively). The oscillation is shown inFig. 2(e) to consist of a sequence of Ca2+ spike bursts,occurring even when the Na+ spikes are blocked with TTX.Tracking the slow oscillation cycles in the time domain[Figs. 2(b) and 2(f)] provide the average period (solid red line)and standard deviation (SD, dashed gray line) in a directlyvisible manner. In the frequency domain, the FFT providesall frequency information about the signal [Figs. 2(c) and2(g)], including higher frequency Ca2+ and Na+ spikes (ifthey are present). The low-frequency peak is best seen whenno smoothing is added to the power spectrum, and the signal iszero padded for higher resolution. This allows a direct measureof the standard deviation (or FWHM) of the peaks in the bottomof Figs. 2(d) and 2(h), when fitted with single Gaussians. Driftsand shifts in the central frequency produce a broadening of the
peaks in the FFT, as well as the possibility of multiple peaksappearing in the spectrum [as in Fig. 2(d)].
B. Tunability via photoswitching
Until now we have shown only the natural astabilityfrequencies measured in PNs after pharmacological induction;this induction of astability is comparable to the naturallyoccurring switching frequencies seen in control in vitroexperiments [9]. Presently, we show that the PN can actas a forced oscillator, and thus extends the frequency rangeavailable for oscillations. This tunability can allow the PNs toproduce a wider range of frequencies per cell, which can thenbe integrated together in other regions of the cerebellum [10],[24]. Using the PSKRA and the appropriate photoswitchingwavelengths, shown in Fig. 3(a), we can gradually toggle thefiring of Ca2+ spike bursts in a PN to a given oscillation period[Fig. 3(b)]. We observed that the firing pattern then matchesthe period of forced modulation. This was done at a wide rangeof periods (6–30 s) and duty cycles (DCs, 25%–75%).
The tunability of cells using the PSKRA was effective inall cells measured, with the slow oscillations following theforced photomodulation. Additionally, in a few of the cells thatdid not exhibit astability initially when in the presence of the
041905-3
ABRAMS, WARRIER, WANG, TRAUNER, AND ZHANG PHYSICAL REVIEW E 85, 041905 (2012)
10-1
101
103
105
0 100 200 3000
5
10
15
20
Time [sec]
Per
iod
[sec
]
0 200 4000
10
20
30
Time [sec]P
erio
d [s
ec]
0.01 0.1 1 10 100
100
105
Frequency [Hz]
Po
wer
[mV
2 /H
z]
0.045 Hz 22.22 sec
7.2 Hz 306 Hz
ΔTSD=0.74 sec
2 min5mV
(a) (b) (c) (d)
1 min5mV
(g)(f)(e) (h)
0.01 0.1 1 10 100Frequency [Hz]
0.07 Hz 14.32 sec
8.9 Hz
ΔTSD=0.44 sec
ΔTSD=0.7 sec
ΔTSD = 2.8 sec
Po
wer
[mV
2 /H
z]
Po
wer
[mV
2 /H
z]
0.035 0.045 0.0550
4
8
12x 105
Po
wer
[mV
2 /H
z]
0.05 0.06 0.07 0.08 0.09
0.5
1.5
2.5
3.5x 10⁵
Frequency [Hz]
Frequency [Hz]
FIG. 2. (Color online) Measuring the induced oscillations. (a) 9 minute recordings of a cell induced to oscillate via application of glutamate(MSG, 100 μM) and an AMPA receptor blocker (GYKI, 10 μM). (b) The period of oscillation of bursts can be tracked over time to provide theaverage period (solid red line) and standard deviation (dashed gray line). (c) The smoothed power spectrum provides all frequency informationof the recording, including calcium and sodium frequency modes [blue (dark gray) and green (light gray) arrows, respectively]. (d) Close-upof the low-frequency peak, with no smoothing to the spectrum, displaying multiple peaks, which account for the drift and shift in frequency.The central peak is fitted with a single Gaussian [green (light gray) line] with 95% confidence levels (dashed gray line), providing the standarddeviation. (e) 5.5 minute recording after the application of PSKRA, GYKI, and TTX (100, 10, and 1 μM, respectively), which blocks the Na+
spikes, as is seen in the lack of high-frequency activity in the power spectrum (g). The standard deviation in (h) matches that of (f) since thesingle Gaussian fit is more accurate for this signal.
PSKRA in the dark (n = 5), the photomodulation still resultedin forced oscillation, with the cells continuing to oscillate afterthe photoswitching was stopped, as demonstrated in Fig. 3(c).
We therefore differentiate between two effects describedabove: the induction of astability via the KRAs, which waspossible using both the PSKRA and commercially availableKRAs, and the tunability of the astability, which we show inFig. 3 to be reliably effective using the PSKRA. The attachmentof the PSKRA to the kainate receptors [25] (specifically,GLUK1) ensured that the effect described here was mediatedsolely by the kainate receptors. All experiments describedhere were done in the presence of TTX and GYKI, thusblocking both all action potentials in the slice (via the TTX)and all excitatory AMPA receptors (via the GYKI). Blockingall action potentials with the TTX effectively reduces neuro-transmitter release. Therefore, by using the kainate-selectivecompounds in conjunction with the AMPA-specific blockingagent, and in further conjunction with the TTX, we ensured thatour results were kainate dependent [26]. Adding GABAzine(10 μM) to the cell did not affect either the oscillatoryperiod or the ability to photomodulate the cell [see Fig. 3(d)],thereby negating the possibility of an ionotropic inhibitoryfeedback response regulating the oscillations. Similar testswere done to block glycine receptors, metabotropic excitatoryand inhibitory receptors, and NMDA receptors (see Methods).In all cases, the addition of these blockers had no effect on theability of the cell to oscillate, or the ability to photomodulatethe cell (at least n = 2 cells per drug study). These testswere done to verify that the effect described was an inherent
response of the PN in vitro, and not the effect of othersynchronization events in the neuronal network, as has beenshown for the cerebellum [27] and cortical networks [28].
C. Delayed recovery of modulation
The dynamics of the recordings subsequent to the pho-tomodulation were also studied. Figure 4(a) displays arepresentative recording from a PN that was initially oscillatingat a natural period of 22 s [green (light gray) curve], and thenphotomodulated for 2 min at 5 s on/ 5 s off [10 s period,blue (dark gray) curve], and subsequently allowed to recover(black curve). The PN faithfully follows the forced modulationafter 1–2 stimuli when the light is applied, and then slowlyrecovers back to the natural oscillation period it had priorto the stimulation, after the photostimulation is stopped. Thisrecovery response of the cell’s oscillatory modulation is similarto a traditional forced oscillator, with an exponential recoveryafter the forced modulation is stopped. This is best visualizedwhen plotting out the period and DC over time, as in Figs. 4(b)and 4(c), which display both the period matching duringforced oscillation (dashed blue line) as well as the exponentialrecovery (dotted red line).
The time constants for recovery have a distribution amongdifferent cells, with a recovery time of 82 ± 48 s for theperiod, and 70 ± 41 s for the DC. (n = 11 cells. Errorsare in SD, displaying the range of variation among cells.)The long recovery time for this process is similar to otherforms of short-term memory in the brain (such as short-term
041905-4

TUNABLE OSCILLATIONS IN THE PURKINJE NEURON PHYSICAL REVIEW E 85, 041905 (2012)
(a) 30 sec 10 mV
(b)
15/15
10/10
LY339434
trans
cis
500 nm
380 nm
PSKRA
10/10
60 sec 10 mV
(c)
1 min 10 mV
1 min10mV
(d)
Add GABAzine
7/5
101 min
mV
FIG. 3. (Color online) Photoswitchable compound modulates the oscillation. (a) Comparison of the GluK1 selective compound LY339434and the PSKRA, which has an added azobenzene moiety, rendering it photoswitchable at 500 and 380 nm. (b) The ultraviolet [UV, 380 nm,as shown in violet (light gray) area] and cyan [500 nm, as shown in cyan (dark gray) area] light turn the bursting on and off, respectively,as a function of the modulation period, here shown for two modulation patterns with differing periods. The stimulation pattern is noted tothe right of each recording, with stimulations at 15 s cyan, 15 s UV; 10 s cyan, 10 s UV (DC = 50%); and 7 s cyan, 5 s UV (DC = 42%).(c) Photomodulation followed by induction of oscillation in a cell not displaying astability prior to the modulation. The cell continued tooscillate after the photoswitching was completed. (d) Adding synaptic blockers to the solution (such as GABAzine, 10 μm, which blocksGABA receptors) did not affect any of the photoswitching, resulting in identical traces before and after introducing the drugs, verifying thekainate mediated effect.
depression [1,5]), allowing the cell to “remember” its forcedmodulation for a short duration after the stimulus is applied,however, the cells typically did not retain the forced frequency.The direction of recovery was generally toward the naturalastable period in the cell prior to photomodulation, with forcedphotomodulation of the cells done both below and above theirnatural period [below: 5/5 s on/off modulation, n = 7; above:10/10 s on/off modulation, n = 9; 15/15 s on/off modulation,n = 4, with representative cell recordings in Figs. 4(d) and4(e), respectively].
IV. PARAMETRIC OSCILLATOR MODEL
The bursting oscillations of the PNs are nondissipating, witha clear frequency signature in the FFTs. We can simplify theHodgkin-Huxley equations [29–32] to reach a model similarto the fundamental parametric oscillator equations to describethis slow harmonic signal. This derivation can be appliedto any cell exhibiting slow rhythmic bursting, such as sleepspindles [33], and is particularly applicable to the knownslow oscillatory firing patterns of the PN [16,30,34]. Thegeneralized formula for the membrane potential V , injectedcurrent I , and membrane capacitance C, is [30,31]
CV = −I −∑
gixkii (V − Ei), (1)
with each gating variable xi , being a function of the voltage:xi = [x0i(V ) − xi]/τi(V ), which is a generalized differentialform for the gating variable as a function of the asymptoticvalue of the gating variable x0i , and a generalized time constantτi [32]. In Eq. (1), gi is the conductance per ion channel and
the (V − Ei) term is the driving force per ion channel. Takinga time derivative of Eq. (1) results in
CV = −I −∑ [
gixkii (V − Ei) + gi
d(xki
i
)dt
(V − Ei)
+ gixkii V
]. (2)
Assuming that the injected current (I , if any exists) isconstant with time, and that the conductance coefficients gi
are also time independent, we can neglect the dI/dt and dgi/dt
terms, remaining with
CV = −∑ [
gi
d(xki
i
)dt
(V − Ei) + gixkii V
]. (3)
Since we are interested in the slow changing terms only,whose changes with time are of the order of the oscillationperiod (10–25 s), we can isolate these terms by removingthem from the summation:
CV = −gS
d(xs
S
)dt
(V − ES) − gSxsSV
−∑fast
[gi
d(xki
i
)dt
(V − Ei) + gixkii V
]. (4)
In Eq. (4), the slow gating variable gS has an exponentof s. We will assume that this exponent is unity, since theslow action of our experimental results is somewhat similar
041905-5

ABRAMS, WARRIER, WANG, TRAUNER, AND ZHANG PHYSICAL REVIEW E 85, 041905 (2012)
(a) Astable Modulated (5/5) Recovery1 min
5mV
0 5 10 Time [min]
30
20
10Per
iod
[se
c]
0 5 10 Time [min]
75
50
25
Du
ty-C
ycle
[%
]
(c)(b)
(d)
(e)
35
0 5 10 Time [min]
25
15
40
0 5 10 Time [min]
30
20
Per
iod
[se
c]P
erio
d [
sec]τRecover τRecover
FIG. 4. (Color online) Recovery from the photomodulation follows a forced-oscillator model. (a) Exemplary recording of a Purkinje neuronshowing a natural oscillation [green (light gray) curve] that is then photomodulated at 5 s on [violet (light gray) area] /5 s off [cyan (dark gray)area] with a 10 s period for 2 min [blue (dark gray) curve], and then allowed to recover from the modulation (black curve). [(b), (c)] Periodand duty-cycle tracking of the cell in (a), displaying the forced-modulation (dashed blue line) and exponential recovery. Dots are color codedas in (a). Red dotted lines are fitted exponential curves for the recovery segment, with a time constant of τ = 124 s and τ = 67 s for the periodand duty cycle, respectively. [(d), (e)] Representative plotted periods of the natural, modulated, and recovering oscillators for two differentmodulations: (d) 10/10 and (e) 15/15 on/off, in seconds (τ = 97, 40 s, respectively). Actual recordings appear below each plot.
to that of either the muscarinic gating variable M , or h forthe Ih refractory current, both of which have an exponent ofunity [30,31].
The rightmost bracketed term in the summation can betaken as the average value for long periods where the fastacting terms within these brackets change at a rate that ismuch higher than the slow oscillations examined here. Thisis because the time derivative d/dt for long time durationsis defined by changes of the order of 1/T = fS , which isthe switching frequency of the cell. This is comparable withtaking the average membrane potential during the firing ofaction potentials, otherwise known as the “up” state of abistable system [16], such that we are dealing only with aslow wave form that is similar to a square-wave envelope [asshown in the inset of Fig. 1(a)]. With these assumptions, weobtain
CV = −gSxSV + gSxSES − gSxSV
−⟨∑
fast
[gi
d(xki
i
)dt
(V − Ei) + gixiV
]⟩avg
. (5)
The middle term gSxSES can further be isolated, sinceit is a term that is directly dependent upon the time, butonly indirectly on the voltage. Reorganizing the above equa-tion, we can obtain a generalized second-order differential
equation:
CV + gSxSV + gSxSV
= gSxSES −⟨ ∑
fast
[gi
d(xki
i
)dt
(V − Ei) + gixiV
]⟩avg
. (6)
Or, if we replace the time average of the faster spikes witha constant
CV + gSxSV + gSxSV ≈ gSxSES + 〈const〉avg . (7)
Comparing this to the harmonic oscillator with a drivensource, F (t) [35]:
mV + bV + kV = F (t). (8)
Equation (8) is the classic equation for a driven harmonicoscillator with a resonant frequency of ω2
0 = k/m and a qualityfactor of Q = ω0m/b, with F (t) being the time-dependentdriving input. Comparing terms, we find that
m = C, b(V,t) = gSxS, k(V,t) = gSxS. (9)
As can be seen, the parameters of this equation aretime/voltage dependent. This makes the equation a parametricoscillator as opposed to a simple harmonic oscillator. The
041905-6

TUNABLE OSCILLATIONS IN THE PURKINJE NEURON PHYSICAL REVIEW E 85, 041905 (2012)
parameters in Eq. (9) are related to the biological and measur-able aspects of each neuron, with the membrane capacitancedirectly measurable, and the gating variables measurable usingvoltage-clamp experiments to determine the dynamics of theion channels involved.
If the oscillator is underdamped (Q > 1/2, which isequivalent to b � ω0), it is easy to then measure the resonancefrequency of the Purkinje neuron (2πf0 = ω0) as well asthe quality factor Q, from the signal-to-noise ratio (SNR).The frequency of an oscillating Purkinje neuron can bemeasured directly in the frequency domain, and the SNR canbe calculated either through the time-tracking algorithm, orfrom the width of the peak in the FFT. The frequency ofthe damped oscillator, which is the experimentally measuredswitching frequency ωS = 2πfS , is related to the resonancefrequency
ω20 = ω2
S/[1 − 1/(4Q2)], (10)
with Q taken as the SNR. For highly precise oscillatingneurons with Q > 2: ωS ≈ ω0. Therefore, by measuringthese two parameters (fS and Q), and taking a general valueof the membrane capacitance of C = 1 μF/cm2 [31], wecan obtain estimations for the parameters k and b. Thisvalue of the membrane capacitance is used to provide anorder-of-magnitude estimation of the relevant parameters.
Equation (7) is the parametric oscillator equation for anoscillating neuron that can be analyzed using phase-spacediagrams [32]. Obtaining the van der Pol oscillator equationfrom the Hodgkin-Huxley equations follows a similar method.Floquet analysis posits that the signal of the oscillation shouldvary similarly to the source. Since the measured signal from thecell is periodic in time, we can inversely infer that the gatingvariable is also periodic, with the same frequency. Equation (7)therefore gives the driving force of the parametric oscillationas a function of the gating variable.
V. DATA ANALYSIS
The period (1/frequency) and DC of the astable mode weremeasured in n= 43 cells, each oscillating for at least 3 min, andare displayed in Figs. 5(a) and 5(b). Since each cell acts as anindependent oscillator, it is expected to find a range of inherentfrequencies. We found that the average period of the cells was20 ± 8 s, and the average DC was 46 ± 8% ( ± SD). Weagain note the similarity between the range of slow oscillationsmeasured here, and those measured in vivo in PNs in totteringmice, which ranged between 12.82 and 25.64 s [15]. Thereappears to be a slight increase in the period with the applicationof the SYM-2081/MSG in comparison to the PSKRA (24 ± 7vs 19 ± 8 s; verified with a two-tailed t test, assuming unequalvariance, p < 0.013). The cause of this variation may be due tothe concentrations used, as low concentrations of SYM-2081(10 μM) did not induce oscillations, but only continuous Ca2+spikes, and that the effective “active” concentration of 100 μMPSKRA in the dark is not uniquely defined [20].
The precision of oscillation over time can be measuredby the quality factor of the resonator Q or the SNR. Thiswas measured using the window-tracking algorithm in thetime domain, for each of the cells measured, and displayedin Fig. 5(c) for each individual cell. Of the PSKRA activatedcells, 45% [n = 13/29, blue (dark gray) circles] had a SNRlarger than 10, corresponding to less than a 10% deviation inperiod over time, whereas the SYM-2081/MSG activated cellswere less accurate [green (light gray) triangles]. This may beattributable to either the selectiveness of the PSKRA, or theconcentration ratios.
Using the formalism of the parametric oscillator above, wecan view each PN as an independent oscillator, each with itsown measurable parameters of oscillation. To obtain an orderof magnitude approximation for the channel conductance, wecan use the time and voltage averaged value for the gatingvariable, which is normalized to vary between 0 and 1 [32],such that 〈xS〉 ≈ 0.5. Therefore, using Eq. (9), we can relate themeasured quantities to find the conductance: 〈b〉 = gS 〈xS〉 ≈
0
10
20
30
40
5 10 15 20 25 30 35<gS> [μS/cm2]
Q o
r SN
R
Period [sec]
0
2
4
6
8
0
2
4
6
8
10
12
No
. of
cells
No
. of
cells
%][ elcyC-ytuD ]ces[ doireP
(b) (a)
(d) (c)
No
. of
cells
02468
1012
0.0
40
.08
0.1
20
.16
0.2
0.2
40
.28
0.3
20
.36
0.4
Mor
e
Total
PSKRA
SYM-2081/MSG
FIG. 5. (Color online) Period, duty-cycle,and precision of oscillation. [(a), (b)] His-tograms of the average period and duty cycle(n = 43 cells total) showing the central fre-quency of 20 s/0.05 Hz, and 46% duty cyclein total (black). The cells could be brokendown to PSKRA activated cells (horizontalblue, n = 29) and SYM-2081/MSG activatedcells (diagonal green, n = 14), with periods of24 ± 7 and 19 ± 8, respectively. (c) Qualityfactor or SNR data for the PSKRA [blue (darkgray) circles] and SYM-2081/MSG [green(light gray) triangles] activated cells, as ameasure of the precision of oscillation. Eachcell is plotted individually, with the PSKRAactivated cells having higher precision values.(d) Histogram of the time averaged valueof the slow gating variable for each cell.The average value of 〈gS〉 was 0.12 ± 0.1μS/cm2.
041905-7

ABRAMS, WARRIER, WANG, TRAUNER, AND ZHANG PHYSICAL REVIEW E 85, 041905 (2012)
gS/2 and b = Cω0/Q from the experimental measurements.This procedure provides an order-of-magnitude result only,since each cell has its own membrane capacitance, and since asubstantial number of approximations were used to obtain therelationship in Eq. (9).
Implementing this calculation on the n = 43 cells for thetime-averaged gating variable for each cell is displayed inFig. 5(d). Each oscillator is independent, with an averagechannel conductance of 〈gS〉 = 0.12 ± 0.1 μS/cm2. Onceagain the SD is of the same order as the mean, signifying thatthis average value provides a wide range for the conductance.This value of channel conductance is far smaller than thoseof existing channels listed for the PN, which are as lowas 30–300 μS/cm2 for gh [30,36] and 40–750 μS/cm2 forgM [31,36], both of which are known to activate on scales ofroughly under 1 s. The relationship between the h current andbistability has previously been shown for PNs with similar timescales of switching [16], as well as in 1–2 Hz rhythmic bursts inthalamic relay neurons, which have gh = 0.015–0.03 μS (notnormalized to cm2) [37]. Due to the units of the membranecapacitance (μF/cm2) and low frequency of astability, thevalues for the conduction are quite low, and match the lowfrequency of oscillation of these PNs. Since the time scaleof these astable oscillations is orders of magnitude longerthan those of Na+ and Ca2+ spikes, and since the kainatereceptors which mediate this effect only comprise ∼5% ofthe ionotropic glutamate receptors on the PN [38], this lowconductivity channel would appear to describe a conductionpathway that is not currently incorporated into existing PNmodels [30,31,36,39].
VI. CONCLUSIONS
This work has shown the capability of a PN to act as anastable oscillator with long periods of oscillation (10-25 s), aswell as the ability to externally tune this frequency for extendedperiods of time. This frequency range is notably outside therange typically studied in the brain [11–14], but matches otherin vivo results of the PN [15]. The approximate range of thechannel conductance mediating this oscillation was also shownto be outside that of the traditionally modeled channels [39].
This work describes a new functional role for the PN,that of an astable oscillator in the cerebellum. The astableoscillator is the basic form of clock for most modern circuits[10], and the long periods of the bursting mode described inFigs. 1 and 2 correspond to a timing cycle that is outsidethe realm of frequencies typically studied in other parts ofthe brain [11,12], as well as in the cerebellum itself [14].The long periods measured here lie in the region of temporalrecognition that is between the realm of high-frequency actionpotentials and our own conscious thought [40], and similartiming modes in other regions of the brain should be searchedfor in order to parallel this newfound capability of the PN in thecerebellum. The KRA induction of this clocking mode is quitedifferent from the well-known induction of gamma frequencies(30–80 Hz) in other parts of the brain [41]. The similaritywith those faster oscillations is comparable to our analysisof the calcium frequency (1–15 Hz) in the PN [9], which iscloser to the theta frequency band (5–10 Hz) [11]. While wehad previously shown calcium frequency activation using the
KRA ATPA, as well as a partial modulation capability of thecalcium frequency with the PSKRA [9], we here show thatthe kainate receptor activation using PSKRA and SYM-2081(both molecular variants of each other [20,22]) can reliablyinduce and modulate the switching frequency, which is heredenoted as the astability frequency. Furthermore, while we hadpreviously shown inherent switching frequencies only in somein vitro “control” preparations, this work demonstrates thatnearly every PN can be induced into an astable state under theinfluence of certain KRAs. There have been no other reportsof sub-1 Hz kainate induced oscillations in any region of thebrain.
The ability to tune this clock externally adds another dimen-sion to this paradigm, since it allows a variable clock speed tobe considered. This would be an essential characteristic of adynamic control system, which the cerebellum is theorized toact as [1,6,24]. This short duration entraining of the switchingfrequency can be accomplished externally using synaptictransmission, which was here emulated with the PSKRA. Itis unknown if there is a similar long-term memory capabilityfor plastically changing the rhythm of this astable behavior.
The assumed existence of such a timing functionality ofthe PN in the cerebellum also lies in complete agreement withtemporal pattern generator theories of the cerebellum [24].We have previously postulated that the PN can act as the basictiming circuit for the cerebellum [10], since it has demonstratedboth monostability and bistability, and is here shown to exhibitboth constant and tunable astability. Since a temporal patterngenerator would require the ability to combine a full range offrequencies, the three frequency ranges of the PNs [9] can helprecreate nearly any mathematical signal via inverse Fourierexpansion.
The source of the slow oscillation was here described interms of the possible periodic gating variable dynamics ofthe parametric oscillator model, as well as the dependenceupon the poorly understood kainate receptors in the PN [26].This can be compared with a parametric variation of theresistors and capacitors connected to a multivibrator circuit,which can transition such a circuit between astable, bistable,and monostable modalities (see Fig. 5 in Ref. [10]). Thetransition between each of these modalities would be possiblevia an external modification to the PN’s inputs, such as isknown to occur with the climbing fiber input to the PN,which can toggle the bistability of the PN’s membrane voltage[16–18]. We here showed the induction of the astable modalityusing KRAs, which are typically not considered in most PNmodels. The activation of astable oscillations in cells suchas in Fig. 3(c) signifies that the inherent capability of thePN to oscillate may need to be externally activated, perhapsvia the surplus of glutamate in the synaptic clefts, whichwould activate all the kainate receptors on the cell. Both theparametric oscillator and multivibrator circuit models predictthis phenomenon, since a parametric oscillator will only beginto oscillate once its parameters are initially perturbed, andan astable multivibrator circuit will only oscillate once oneof its external components are thermally perturbed. Usingmathematical dynamic systems, circuit modeling and newlyderived optical activation techniques [25] will allow us toprobe the intrinsic behavior of cells within a network, thereby
041905-8
TUNABLE OSCILLATIONS IN THE PURKINJE NEURON PHYSICAL REVIEW E 85, 041905 (2012)
enabling us to reverse engineer the neuronal circuitry of thebrain at a higher complexity.
ACKNOWLEDGMENTS
This research was conducted with support from the NationalInstitutes of Health through the NIH Roadmap for MedicalResearch (PN2 EY018228) and the National Science Foun-
dation Nano-Scale Science and Engineering Center (NSF-NSEC) under award CMMI-0751621. Z.R.A. acknowledgesgovernment support under and awarded by DoD, Air ForceOffice of Scientific Research, National Defense Science andEngineering Graduate (NDSEG) Fellowship, 32 CFR 168a.Z.R.A. would also like to thank Professor Harold Lecar for hisuseful discussion.
[1] M. Ito, Prog. Neurobiol. 78, 272 (2006).[2] J. C. Eccles, M. Ito, and J. Szentagothai, The Cerebellum as a
Neuronal Machine (Springer-Verlag, Berlin, 1967).[3] D. Marr, J. Physiol. London 202, 437 (1967).[4] J. S. Albus, Math. Biosci. 10, 25 (1971).[5] M. Ito, Physiol. Rev. 81, 1143 (2001).[6] K. Doya, H. Kimura, and M. Kawato, IEEE Control Syst. Mag.
21, 42 (2001).[7] D. Rokni, R. Llinas, and Y. Yarom, Front Neurosci. 2, 192
(2008).[8] J. M. Bower, Front. Cell. Neurosci. 4, 27 (2010).[9] Z. R. Abrams, A. Warrier, D. Trauner, and X. Zhang, Front.
Neur. Circ. 4, 13 (2010).[10] Z. R. Abrams and X. Zhang, Front. Neur. Circ. 5, 11 (2011).[11] G. Buzsaki and A. Draguhn, Science 304, 1926 (2004).[12] M. Steriade, Neuroscience 137, 1087 (2006).[13] A. K. Roopun, M. A. Kramer, L. M. Carracedo, M. Kaiser, C. H.
Davies, R. D. Traub, N. J. Kopell, and M. A. Whittington, Front.Neurosci. 2, 145 (2008).
[14] C. I. De Zeeuw, F. E. Hoebeek, and M. Schonewille, Neuron 58,655 (2008).
[15] G. Chen, L. S. Popa, X. Wang, W. Gao, J. Barnes, C. M. Hendrix,E. J. Hess, and T. J. Ebner, J. Neurophysiol. 101, 234 (2009).
[16] Y. Loewenstein, S. Mahon, P. Chadderton, K. Kitamura,H. Sompolinsky, Y. Yarom, and M. Hausser, Nat. Neurosci.8, 202 (2005).
[17] B. E. McKay, J. D. T. Engbers, W. H. Mehaffey, G. R. J. Gordon,M. L. Molineux, J. S. Bains, and R. W. Turner, J. Neurophysiol.97, 2590 (2007).
[18] M. Yartsev, R. Givon-Mayo, M. Maller, and O. Donchin, Front.Syst. Neurosci. 3, 1 (2009).
[19] M. Schonewille, S. Khosrovani, B. H. J. Winkelman, F. E.Hoebeek, M. T. G. De Jeu, I. M. Larsen, J. Van Der Burg, M. T.Schmolesky, M. A. Frens, and C. I. De Zeeuw, Nat. Neurosci.9, 459 (2006).
[20] M. Volgraf, P. Gorostiza, S. Szobota, M. R. Helix, E. Y. Isacoff,and D. Trauner, J. Am. Chem. Soc. 129, 260 (2007).
[21] A. L. Hodgkin and A. F. Huxley, J. Physiol. 117, 500 (1952).[22] B. Small, J. Thomas, M. Kemp, K. Hoo, B. Ballyk, M. Deverill,
A. M. Ogden, A. Rubio, C. Pedregal, and D. Bleakman,Neuropharmacology 37, 1261 (1998).
[23] J. Hartmann and A. Konnerth, Cell Calcium 37, 459 (2005).[24] G. A. Jacobson, D. Rokni, and Y. Yarom, Trends Neurosci. 31,
617 (2008).[25] T. Fehrentz, M. Schonberger, and D. Trauner, Angew. Chem.,
Int. Ed. 50, 2 (2011).[26] D. E. Jane, D. Lodge, and G. L. Collingridge,
Neuropharmacology 56, 90 (2009).[27] G. A. Jacobson, D. Rokni, and Y. Yarom, Trends Neurosci. 31,
617 (2008).[28] I. Baruchi, V. Volman, N. Raichman, M. Shein, and E. Ben-
Jacob, Eur. J. Neurosci. 28, 1825 (2008).[29] C. Morris and H. Lecar, Biophys. J. 35, 193 (1981).[30] F. R. Fernandez, J. D. T. Engbers, and R. W. Turner,
J. Neurophysiol. 98, 278 (2007).[31] M. A. Kramer, R. D. Traub, and N. J. Kopell, Phys. Rev. Lett.
101, 068103 (2008).[32] E. M. Izhikevich, Dynamical Systems in Neuroscience: The
Geometry of Excitability and Bursting (MIT Press, Cambridge,MA, 2006).
[33] M. V. Sanchez-Vives and D. A. McCormick, Nat. Neurosci. 3,1027 (2000).
[34] W. Chang, J. C. Strahlendorf, and H. K. Strahlendorf, Brain Res.614, 335 (1993).
[35] L. S. Borkowski, Phys. Rev. E 83, 051901 (2011).[36] E. De Schutter and J. M. Bower, J. Neurosci. 71, 375 (1994).[37] J. R. Huguenard and D. A. McCormick, J. Neurophys. 68, 1373
(1992).[38] Y. H. Huang, M. Dykes-Hoberg, K. Tanaka, J. D. Rothstein, and
D. E. Bergles, J. Neurosci. 24, 103 (2004).[39] P. Achard and E. De Schutter, Front. Comput. Neurosci. 2, 8
(2008).[40] D. V. Buonomano, Nat. Chem. Biol. 3, 594 (2008).[41] A. Fisahn, J. Physiol. 562, 65 (2005).
041905-9