TUI AG Financial Year 2009/10 30625 Hanover Germany ... · Annual General Meeting 2011 9 February...
48
TUI AG Financial Year 2009/10 Corrected Interim Report 1 October 2009 – 30 June 2010 Aktiengesellschaft
Transcript of TUI AG Financial Year 2009/10 30625 Hanover Germany ... · Annual General Meeting 2011 9 February...

TUI AGKarl-Wiechert-Allee 430625 HanoverGermany
TUI AG Financial Year 2009/10Corrected Interim Report1 October 2009 – 30 June 2010
Aktiengesellschaft

Table of Contents
Interim Report 3rd quarter 2009/10 11 August 2010Annual Press Conference 2009/10 14 December 2010Annual General Meeting 2011 9 February 2011
Imprint
TUI AGKarl-Wiechert-Allee 430625 HanoverGermany
Phone +49.511.566-00Fax +49.511.566-1901E-Mail [email protected] www.tui-group.com
The German version of this interim report is legally binding. The Company cannot be held responsible for any misunderstandings or misinterpretation arising from this translation. Both versions are available on the web: www.tui-group.com
Financial Calendar 2010
2 Economic Situation
2 General Economic Situation
2 Correction of Interim Financial Statements
3 Special Events in the Quarter Under Review
3 Consolidated Turnover and Earnings 4 Development of turnover 4 Development of earnings
6 Development of the Tourism Division 6 TUI Travel 9 TUI Hotels & Resorts 12 Cruises
14 Central Operations
15 Information on Container Shipping
17 Consolidated Earnings
20 Net Assets and Financial Position
22 Other Segment Indicators
23 Prospects
25 Corporate Governance
26 Interim Financial Statements
26 Corrected Profit and Loss Statement 27 Corrected Condensed Statement of Comprehensive Income 28 Corrected Financial Position 29 Corrected Condensed Cash Flow Statement 29 Corrected Condensed Statements of Changes in Equity
30 Notes
30 Correction of Interim Financial Statements 31 Accounting Principles 32 Group of Consolidated Companies 35 Discontinued Operation 37 Notes on the Consolidated Profit
and Loss Statement 39 Notes on the Consolidated Statement
of Financial Position 40 Changes in Equity 40 Contingent Liabilities 41 Other Financial Commitments 42 Notes on the Consolidates Cash Flow Statement 43 Segment Indicators 44 Related Parties
Reservation concerning future-related statementsThe present Interim Report contains various statements relating to TUI’s future development. These statements are based on assumptions and estimates. Although we are convinced that these forward-looking statements are realistic they are not guarantees of future performance since our assumptions involve certain risks and uncertainties that may cause actual results to differ materially from expected results. This may be due to market fluctuations, the development of world market prices for commodities and exchange rates or funda-mental changes in the economic environment. TUI does not intend to and does not undertake any obligation to update or revise any forward-looking statements in order to reflect events or developments after the date of this report.
1Interim Report 3rd Quarter 2009/10
Q3 2009/10
Corrected TUI Group in figures
€ millionQ3 2009/10 Q3 2008/09
revisedVar. % 9M 2009/10 9M 2008/09
revisedVar. %
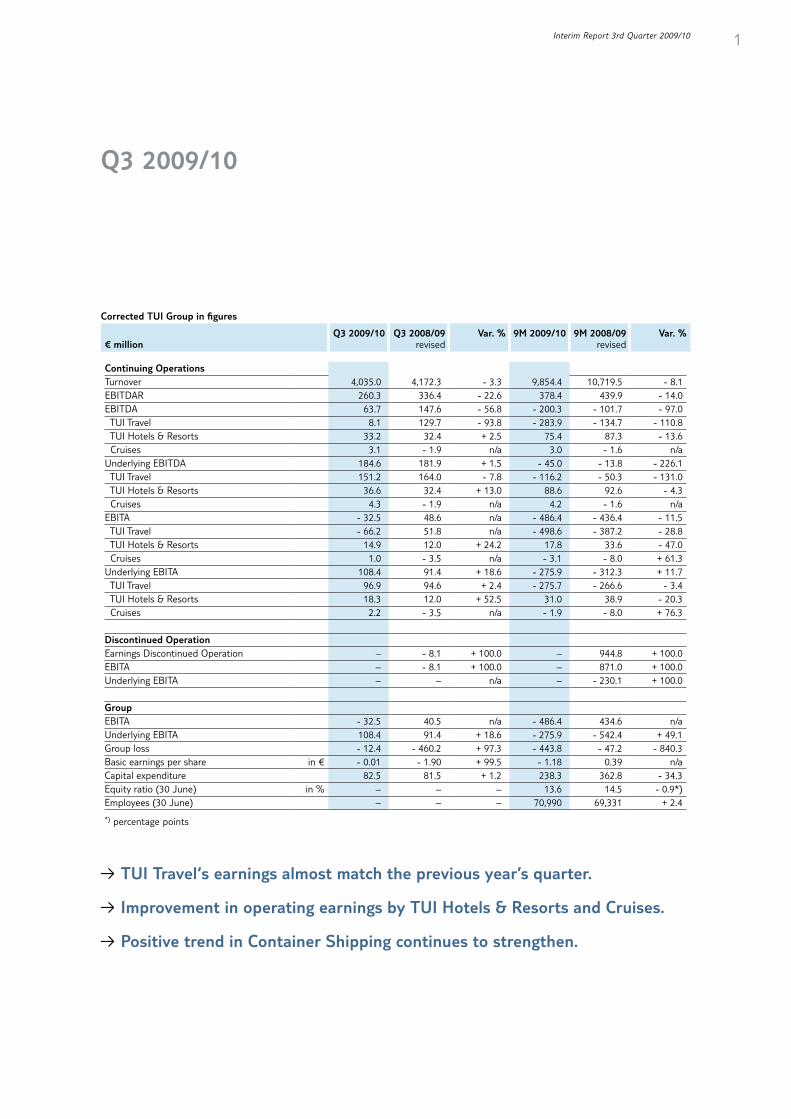
Continuing OperationsTurnover 4,035.0 4,172.3 - 3.3 9,854.4 10,719.5 - 8.1EBITDAR 260.3 336.4 - 22.6 378.4 439.9 - 14.0EBITDA 63.7 147.6 - 56.8 - 200.3 - 101.7 - 97.0 TUI Travel 8.1 129.7 - 93.8 - 283.9 - 134.7 - 110.8 TUI Hotels & Resorts 33.2 32.4 + 2.5 75.4 87.3 - 13.6 Cruises 3.1 - 1.9 n/a 3.0 - 1.6 n/aUnderlying EBITDA 184.6 181.9 + 1.5 - 45.0 - 13.8 - 226.1 TUI Travel 151.2 164.0 - 7.8 - 116.2 - 50.3 - 131.0 TUI Hotels & Resorts 36.6 32.4 + 13.0 88.6 92.6 - 4.3 Cruises 4.3 - 1.9 n/a 4.2 - 1.6 n/aEBITA - 32.5 48.6 n/a - 486.4 - 436.4 - 11.5 TUI Travel - 66.2 51.8 n/a - 498.6 - 387.2 - 28.8 TUI Hotels & Resorts 14.9 12.0 + 24.2 17.8 33.6 - 47.0 Cruises 1.0 - 3.5 n/a - 3.1 - 8.0 + 61.3Underlying EBITA 108.4 91.4 + 18.6 - 275.9 - 312.3 + 11.7 TUI Travel 96.9 94.6 + 2.4 - 275.7 - 266.6 - 3.4 TUI Hotels & Resorts 18.3 12.0 + 52.5 31.0 38.9 - 20.3 Cruises 2.2 - 3.5 n/a - 1.9 - 8.0 + 76.3
Discontinued OperationEarnings Discontinued Operation – - 8.1 + 100.0 – 944.8 + 100.0EBITA – - 8.1 + 100.0 – 871.0 + 100.0Underlying EBITA – – n/a – - 230.1 + 100.0
GroupEBITA - 32.5 40.5 n/a - 486.4 434.6 n/aUnderlying EBITA 108.4 91.4 + 18.6 - 275.9 - 542.4 + 49.1Group loss - 12.4 - 460.2 + 97.3 - 443.8 - 47.2 - 840.3Basic earnings per share in € - 0.01 - 1.90 + 99.5 - 1.18 0.39 n/aCapital expenditure 82.5 81.5 + 1.2 238.3 362.8 - 34.3Equity ratio (30 June) in % – – – 13.6 14.5 - 0.9*)Employees (30 June) – – – 70,990 69,331 + 2.4
*) percentage points
b TUI Travel‘s earnings almost match the previous year’s quarter.
b Improvement in operating earnings by TUI Hotels & Resorts and Cruises.
b Positive trend in Container Shipping continues to strengthen.

2
General Economic Situation
The world economy, which started to pick up again in mid-2009, continued to recover in the period under review. While the pace of expansion continued to accelerate in the emerging markets and developing countries, the upward trend was less pronounced in the industrialised countries. Economic activity in the Eurozone was additionally curbed by the crisis of confidence in the financial markets. Due to the crisis, investors withdrew from higher-risk investments.
The United States and Japan recorded considerably stronger growth than the Eurozone. However, reducing the structural deficits in the US and Japan will hinge upon sustained economic recovery.
Since macroeconomic output only rose slightly overall in the Eurozone and the UK, private demand in these regions was curbed by the associated slow growth in employment. Private consumption was also impacted by the expiry of scrapping premiums, the initiation of fiscal consolidation in various member states of the Eurozone and the effects of the recession, which continue to be felt in the labour markets.
In contrast, global trade continued to normalise at a high pace. The recovery was stimulated by the emerging markets, which showed considerably stronger eco-nomic momentum. The main drivers were changes in companies’ stock manage-ment policies and expansionary fiscal policies pursued by the majority of countries.
Correction of Interim Financial Statements
As described in the corrected consolidated financial statements for the short financial year 2009, TUI AG directly corrected the booking errors identified in TUI Travel PLC in turnover recognition and the reversal of adjustment items shown under trade accounts payable in the respective consolidated financial statements and in the interim reports that might be of relevance for TUI AG’s ability to operate in the financial markets.
Against this backdrop, the present Management Report has also been corrected. Further details and the effects, in particular on the consolidated profit and loss statement, are presented in a note on this item on pages 30 and 31 in the con-solidated Notes.
Economic Situation in Q3 2009/10

3Economic Situation General Economic Situation Special Events in the Quarter Under Review Consolidated Turnover and Earnings
Tourism Central Operations Information on Container Shipping Consolidated Earnings Net Assets and Financial Position
Other Segment Indicators Prospects Corporate Governance
Special Events in the Quarter Under Review
Closure of Europe’s airspace due to volcanic ash cloud As a result of the volcanic eruption in Iceland, large parts of Europe’s airspace were closed from 15 to 21 April 2010 due to the volcanic ash cloud. The associ-ated flight disruptions had an adverse impact on the scheduled implementation of the TUI Group’s tourism business. In total, over 180,000 TUI customers in resorts were affected. TUI organised holiday extensions or alternative return options from the holiday regions for these customers. In addition, more than 175,000 TUI trips had to be cancelled; these customers were offered rebooking their holidays free of charge. The cumulative cost resulting from the airspace closure for the TUI Group’s earnings totalled €128m. The largest portion of €123m related to the activities of the TUI Travel Group, while €3m related to TUI Hotels & Resorts and €1m to Hapag-Lloyd Kreuzfahrten.
As the earnings effects associated with the airspace closure were one-off in nature, they were carried as an adjustment item in the interim financial state-ments for the third quarter of 2009/10.
TUI Travel PLC issues convertible bond On 27 April 2010, TUI Travel PLC issued convertible bonds worth £400m. TUI AG has secured the purchase of 50% of these convertible bonds via an agreement with Deutsche Bank expiring in March 2013. A mechanism has been put in place to always secure TUI AG’s voting rights majority in TUI Travel PLC by then in the event of any third party conversions.
TUI Cruises announces expansion On 27 May 2010, TUI Cruises GmbH announced an expansion of its fleet. Follow-ing the successful establishment of Mein Schiff, the company will thus further expand its market position in the volume cruise segment. The second liner will be commissioned in May 2011. A cruise ship built in 1997 and currently sailing for Celebrity Cruises will be extensively converted and redesigned. The aim is to follow the successfully implemented premium concept in modernising the cabins and the catering and wellness facilities of Mein Schiff 2.
Consolidated Turnover and Earnings
Following the introduction of a nine-month short financial year in 2009, the TUI Group now reports about the period from 1 October of any one year until 30 September of the subsequent year. The quarter Q3 2009/10 and the first nine months of 2009/10 are thus presented alongside the reporting periods from April to June 2009 and from October 2008 to June 2009, respectively.
Following the completion of the sale of Container Shipping, the 43.33% stake in ‘Albert Ballin’ Joint Venture GmbH & Co. KG has been measured at equity in TUI’s consolidated financial statements since April 2009. In line with their partici-pating nature, the proportionate at equity earnings of the stake in Container Shipping to be included in consolidated earnings as of the third quarter of 2008/09 are not included in the TUI Group’s operating performance indicator EBITA. Accordingly, the comments provided below will focus on the development of business operations in Tourism and Central Operations (Continuing Operations).

4
Information about the development of business operations in Container Shipping in the third quarter of 2009/10 is presented from page 15 of this interim report.
In the summer of 2010, TUI AG and TUI Travel PLC decided to transfer the operation of the club hotel chain Magic Life, previously shown under Discontinued Operation, to TUI Travel. This move will be subject to approval by the supervisory bodies and regulatory authorities. Due to this decision, the Magic Life Group is no longer shown under Discontinued Operation but will be carried under TUI Hotels & Resorts until the transfer. In the previous year’s comparative period, Discontinued Operation had still included the key indicators for Container Shipping.
Development of turnover
Divisional turnover
€ millionQ3 2009/10 Q3 2008/09
revisedVar. % 9M 2009/10 9M 2008/09
revisedVar. %
Tourism 4,019.2 4,155.4 - 3.3 9,808.5 10,648.5 - 7.9 TUI Travel 3,890.3 4,004.5 - 2.9 9,409.5 10,238.2 - 8.1 TUI Hotels & Resorts 97.3 106.3 - 8.5 266.7 262.6 + 1.6 Cruises 31.6 44.6 - 29.1 132.3 147.7 - 10.4Central Operations 15.8 16.9 - 6.5 45.9 71.0 - 35.4Continuing Operations 4,035.0 4,172.3 - 3.3 9,854.4 10,719.5 - 8.1Discontinued Operation – – n/a – 2,705.2 n/aConsolidation – – n/a – - 30.3 + 100.0Divisional turnover 4,035.0 4,172.3 - 3.3 9,854.4 13,394.4 - 26.4
In the third quarter of 2009/10, turnover by the Continuing Operations was €4.0bn, down 3.3% year-on-year. The decline in turnover was above all attributa-ble to turnover losses in connection with the closure of European airspace due to a volcanic ash cloud. On the other hand, turnover benefited from the 3% rise in the exchange rate of Sterling against the Euro. This development resulted in a slight increase in turnover by the British tour operators in Tourism on a Euro basis. Cumulative turnover for the first nine months of 2009/10 totalled €9.8bn, down 7.9% year-on-year.
Development of earnings
Underlying divisional EBITA
€ millionQ3 2009/10 Q3 2008/09
revisedVar. % 9M 2009/10 9M 2008/09
revisedVar. %
Tourism 117.4 103.1 + 13.9 - 246.6 - 235.7 - 4.6 TUI Travel 96.9 94.6 + 2.4 - 275.7 - 266.6 - 3.4 TUI Hotels & Resorts 18.3 12.0 + 52.5 31.0 38.9 - 20.3 Cruises 2.2 - 3.5 n/a - 1.9 - 8.0 + 76.3Central Operations - 9.0 - 11.7 + 23.1 - 29.3 - 76.6 + 61.7 All other segments - 9.0 - 11.7 + 23.1 - 29.3 - 76.6 + 61.7 Consolidation – – n/a – – n/aContinuing Operations 108.4 91.4 + 18.6 - 275.9 - 312.3 + 11.7Discontinued Operation – – n/a – - 230.1 + 100.0Underlying divisional earnings (EBITA) 108.4 91.4 + 18.6 - 275.9 - 542.4 + 49.1
Continuing Operations

5
Divisional EBITA
€ millionQ3 2009/10 Q3 2008/09
revisedVar. % 9M 2009/10 9M 2008/09
revisedVar. %
Tourism - 50.3 60.3 n/a - 483.9 - 361.6 - 33.8 TUI Travel - 66.2 51.8 n/a - 498.6 - 387.2 - 28.8 TUI Hotels & Resorts 14.9 12.0 + 24.2 17.8 33.6 - 47.0 Cruises 1.0 - 3.5 n/a - 3.1 - 8.0 + 61.3Central Operations 17.8 - 11.7 n/a - 2.5 - 74.8 + 96.7 All other segments 17.8 - 11.7 n/a - 2.5 - 74.8 + 96.7 Consolidation – – n/a – – n/aContinuing Operations - 32.5 48.6 n/a - 486.4 - 436.4 - 11.5Discontinued Operation – - 8.1 + 100.0 – 871.0 + 100.0Divisional earnings (EBITA) - 32.5 40.5 n/a - 486.4 434.6 n/a
In the third quarter of 2009/10, underlying earnings by the Continuing Operations (underlying divisional EBITA) rose by €17m year-on-year to €108m. The positive development of earnings was driven by the development of business in Tourism and higher earnings by Central Operations.
In the third quarter of 2009/10, Tourism achieved a year-on-year increase in underlying earnings of €14m to €117m. The development of earnings varied for the individual sectors. While TUI Travel was almost flat year-on-year in the third quarter of 2009/10, TUI Hotels & Resorts and Cruises each recorded earnings growth of €6m.
In the third quarter of 2009/10, underlying earnings by Central Operations totalled €-9m, up €3m year-on-year. The positive development in earnings of €47m in the first nine months of 2009/10 was driven by charges for the measure-ment of financial instruments included in the previous year’s figures.
Cumulative underlying earnings by Continuing Operations totalled €-276m for the first nine months of 2009/10, up €36m year-on-year.
Underlying divisional EBITA: Continuing Operations
€ millionQ3 2009/10 Q3 2008/09
revisedVar. % 9M 2009/10 9M 2008/09
revisedVar. %
Divisional EBITA - 32.5 48.6 n/a - 486.4 - 436.4 - 11.5 Gains on disposal - 9.4 - 0.6 - 11.4 + 1.4 Restructuring + 9.0 + 6.2 + 22.2 + 5.6 Purchase price allocation + 17.8 + 11.1 + 49.7 + 33.0 Other one-off items + 123.5 + 26.1 + 150.0 + 84.1Underlying divisional EBITA 108.4 91.4 + 18.6 - 275.9 - 312.3 + 11.7
In the third quarter of 2009/10, the Group’s Continuing Operations had one-off items worth a total of €141m to be adjusted. This total included €128m for expenses in connection with the closure of European airspace due to the volcanic ash cloud. Reported divisional EBITA by the Continuing Operations accounted for €-33m in the third quarter, down €81m versus the comparative prior-year period. In the first nine months, reported divisional EBITA totalled €-486m, down €50m. Cumulative adjustments amounted to €211m.
Continuing Operations
Economic Situation General Economic Situation Special Events in the Quarter Under Review Consolidated Turnover and Earnings
Tourism Central Operations Information on Container Shipping Consolidated Earnings Net Assets and Financial Position
Other Segment Indicators Prospects Corporate Governance

6
TUI Travel
TUI Travel – Key figures
€ millionQ3 2009/10 Q3 2008/09
revisedVar. % 9M 2009/10 9M 2008/09
revisedVar. %
Turnover 3,890.3 4,004.5 - 2.9 9,409.5 10,238.2 - 8.1Divisional EBITA - 66.2 51.8 n/a - 498.6 - 387.2 - 28.8 Gains on disposal - 9.4 - 0.6 - 11.4 - 0.6 Restructuring + 9.0 + 6.2 + 22.2 + 5.6 Purchase price allocation + 17.8 + 11.1 + 49.7 + 33.0 Other one-off items + 145.7 + 26.1 + 162.4 + 82.6Underlying divisional EBITA 96.9 94.6 + 2.4 - 275.7 - 266.6 - 3.4
Underlying divisional EBITDA 151.2 164.0 - 7.8 - 116.2 - 50.3 - 131.0Capital expenditure 63.2 62.4 + 1.3 188.7 172.3 + 9.5Headcount (30 June) – – – 51,718 50,391 + 2.6
Turnover and earnings In the third quarter of 2009/10, turnover by TUI Travel decreased by 3% year-on-year. The decline was primarily driven by the closure of Europe’s airspace due to the volcanic ash cloud and the associated loss in turnover. Moreover, the pace of recovery varied in individual source markets following the financial crisis. A slightly positive effect arose from the 3% rise in the exchange rate of Sterling against the Euro versus the previous year.
At €97m, underlying earnings by TUI Travel were almost flat versus the prior year in the third quarter of 2009/10.
The development of earnings benefited in particular from the scheduled delivery of integration synergies in the UK. Moreover, the French tour operator activities grew year-on-year both in terms of customer volumes and average margins and thus contributed to a positive develop ment.
Additional positive effects arose from the restructuring of business in Canada in the wake of the completion of a strategic venture between operations in Canada and tour operator Sunwing in January 2010.
On the other hand, the performance was considerably impacted by the develop-ment of the tour operator business in the UK and Germany. Both source markets recorded declining margins in highly competitive environments, with corresponding decreases in earnings year-on-year. The fall in margins in the UK was above all driven by the closure of airspace due to the volcanic eruption and the budget cuts implemented by the government. In Germany the situation was also affected by price pressure on consumer goods and the economic environment, causing a shift in demand to lower value tours, which was higher than expected.
In the third quarter of 2009/10, TUI Travel had to carry adjustments worth a total of €163m for the following one-off effects:
1�gains on disposal of €9m, mainly arising in connection with the restructuring of the Canadian business,
1�restructuring costs of €9m, in particular for restructuring the tour operator activities in France and Poland and integrating incoming service providers in Spain,

7
1�effects of purchase price allocations worth €18m, and 1�one-off effects of €146m. These one off-effects included one-off expenses for
the closure of European airspace due to the volcanic ash cloud of €123m.
In the third quarter of 2009/10, reported earnings by TUI Travel decreased by €118m year-on-year to €-66m. Cumulative unadjusted earnings for the first nine months of the year 2009/10 fell by €111m year-on-year to €-499m. Cumulative underlying earnings amounted to €-276m, down €9m year-on-year.
MainstreamMainstream, the largest sector within TUI Travel, comprises sales of flight, accom-modation and other tourism services in the three source markets Central Europe, Northern Region and Western Europe.
TUI Travel – Mainstream volumes
'000 Q3 2009/10 Q3 2008/09 Var. % 9M 2009/10 9M 2008/09 Var. %
Central Europe1) 1,965 2,650 - 25.8 4,658 6,200 - 24.9Northern Region2) 1,905 1,885 + 1.1 3,931 4,289 - 8.3Western Europe 1,419 1,407 + 0.9 3,104 3,152 - 1.5Total 5,289 5,942 - 11.0 11,693 13,641 - 14.3
1) Numbers include city-pairs business up until takeover by Air Berlin.
2) The figures were restated retroactively since Canadian customers are no longer included in the statistics due to the formation of the Sunwing joint venture in Canada.
Central Europe In the Central Europe sector (Germany, Austria, Switzerland, Poland and airline TUIfly), customer volumes declined by 26% year-on-year in the third quarter of 2009/10. This was mainly attributable to TUIfly’s exit from the city-pairs business, which was taken over by Air Berlin in accordance with the agreement made. Adjusted for the effect of exiting the city-pairs business, customer volumes decreased by 7%. The German market was impacted by declines in volumes and lower margins year-on-year. Markets in Switzerland and Austria also recorded fall-ing customer volumes in a highly competitive environment. TUI Poland, by contrast, showed a gratifying development and generated substantial increases in customer volumes.
Northern Region In the Northern Region sector (UK, Ireland, Canada, Nordics and airlines Thomson Airways and TUIfly Nordic), customer volumes rose slightly by 1% year-on-year in the third quarter of 2009/10. While volumes rose considerably in the Nordics, the UK recorded a relatively weak development of customer volumes. The British market in particular was also affected by lower average margins.
Integration of activities in the UK remained on track in the third quarter of 2009/10 so that the expected synergies were delivered. Business in Canada bene-fited from the strategic venture with tour operator Sunwing. The joint venture, in which TUI Travel holds a 49% interest, was established in January 2010 in order to enhance the market position.
Economic Situation General Economic Situation Special Events in the Quarter Under Review Consolidated Turnover and Earnings
Tourism Central Operations Information on Container Shipping Consolidated Earnings Net Assets and Financial Position
Other Segment Indicators Prospects Corporate Governance

8
Western Europe The Western Europe sector (France, the Netherlands, Belgium and airlines Corsairfly, Arkefly and Jetairfly) recorded a slight year-on-year increase in volumes of 1% in the third quarter of 2009/10. Tour operators in France reported growth, driven above all by an increase in demand for tours to destinations suffering from civil unrest in the previous year. Activities in Belgium were flat versus the previous year, while the Netherlands reported a decline in volumes. The French airline Corsairfly benefited from a stabilisation of margins in a highly competitive environment.
Specialist & Emerging Markets The Specialist & Emerging Markets sector consists of specialist tour operators in Europe, North America and emerging markets such as Russia. In the third quarter of 2009/10, customer volumes fell by 8% year-on-year to 269 thousand. While specialists in Continental Europe benefited from slight growth, specialists in the UK recorded a decline in volumes. Business in North America decreased year-on-year in the quarter under review, primarily due to continued weak demand for student travel. The development of business in the emerging markets was impacted by the cost of acquisition for newly acquired interests.
ActivityThe Activity sector, which comprises Marine, Adventure, Ski, Student and Sport, reported a year-on-year decline in the third quarter of 2009/10. The adverse effect was above all attributable to lower volumes in the Ski and Sport divisions, while the Student division benefited from new acquisitions. Adventure, by contrast, was impacted by lower capacity and tougher competition, in particular in the polar expedition segment.
Accommodation and Destinations (A&D)The A&D sector comprises online services and incoming agencies. Online services again recorded volume growth, in particular in large European cities, following an expansion of their portfolio and promotional activity. The incoming agency business was almost flat versus the prior year.

9
TUI Hotels & Resorts
The Group’s hotel companies are pooled in TUI Hotels & Resorts. In the third quarter of 2009/10, the sector reported a total of 8.3m bednights (previous year: 8.2m). Bed occupancy was 73% in the third quarter, flat on the previous year, on slightly increased capacity. The development of business varied for the individual hotel groups and regions.
Due to the decision to transfer the club hotel chain Magic Life to TUI Travel, Magic Life has no longer been carried under Discontinued Operation, unlike in previous quarters. Since the transfer to TUI Travel will be subject to approval by the supervisory bodies and regulatory authorities, the Magic Life activities will be reported under TUI Hotels & Resorts until the transfer will be completed and have thus been included in Continuing Operations.
TUI Hotels & Resorts – Key figures
€ millionQ3 2009/10 Q3 2008/09
revisedVar. % 9M 2009/10 9M 2008/09
revisedVar. %
Total turnover 200.2 209.3 - 4.3 556.9 550.9 + 1.1Turnover 97.3 106.3 - 8.5 266.7 262.6 + 1.6Divisional EBITA 14.9 12.0 + 24.2 17.8 33.6 - 47.0 Gains on disposal – – – + 3.8 Restructuring – – – – Purchase price allocation – – – – Other one-off items + 3.4 – + 13.2 + 1.5Underlying divisional EBITA 18.3 12.0 + 52.5 31.0 38.9 - 20.3
Underlying divisional EBITDA 36.6 32.4 + 13.0 88.6 92.6 - 4.3Capital expenditure 17.5 16.2 + 8.0 40.9 60.4 - 32.3Headcount (30 June) – – – 18,396 18,061 + 1.9
Turnover and earnings TUI Hotels & Resorts posted total turnover of €200m, down 4% year-on-year. This was attributable to a 2% decline in average revenues per bednight, only partly offset by a slight rise in occupancy rates on higher capacity. Consolidated turnover, by contrast, totalled €97m in the third quarter of 2009/10, down 9% year-on-year. Total cumulative turnover for the first nine months increased by 1% to €557m, while consolidated turnover also grew slightly by 2% to €267m.
At €18m, underlying earnings grew by €6m year-on-year in the third quarter of 2009/10. With capacity up by around 1 percentage point, the previous year‘s sound occupancy rate was reproduced. The year-on-year development of earnings in the quarter under review also benefited from cost savings and positive effects of cur-rency translation. By contrast, earnings were adversely impacted by the overall decline in average revenues per bednight in the hotel portfolio. At €31m, cumula-tive underlying earnings for the first nine months of 2009/10 were €8m down year-on-year, in particular due to a weaker Winter season in the first quarter of 2009/10.
In the third quarter of 2009/10, TUI Hotels & Resorts had to carry adjustments worth €3m for one-off effects in connection with the effects of the volcanic ash cloud.
In the third quarter of 2009/10, reported earnings by the hotel sector rose €3m year-on-year to €15m. For the first nine months of 2009/10, reported earnings totalled €18, down €16m year-on-year.
Economic Situation General Economic Situation Special Events in the Quarter Under Review Consolidated Turnover and Earnings
Tourism Central Operations Information on Container Shipping Consolidated Earnings Net Assets and Financial Position
Other Segment Indicators Prospects Corporate Governance

10
TUI Hotels & Resorts
Capacity ('000)1) Occupancy rate (%)2) Average revenue per bed (€)3)
Hotel brandQ3
2009/10Q3
2008/09 Var. %Q3
2009/10Q3
2008/09Var.
% pointsQ3
2009/10Q3
2008/09
Var. %
Riu 4,216 4,151 + 1.6 77.4 78.6 - 1.2 41.90 43.44 - 3.5Robinson 792 767 + 3.3 57.6 59.4 - 1.8 73.67 73.61 + 0.1Magic Life 776 810 - 4.2 79.0 73.1 + 5.9 38.98 38.68 + 0.8Iberotel 726 729 - 0.4 69.5 63.1 + 6.4 37.02 34.51 + 7.3Grupotel 287 287 + 0.0 69.3 72.2 - 2.9 39.52 39.75 - 0.6Grecotel 224 211 + 6.2 59.7 65.1 - 5.4 55.20 59.79 - 7.7Dorfhotel4) 42 45 - 6.7 45.8 45.0 + 0.8 31.99 39.66 - 19.3aQi 12 15 - 20.0 23.5 8.8 + 14.7 39.71 44.31 - 10.4Total 7,075 7,015 + 0.9 73.4 73.2 + 0.2 44.09 45.04 - 2.1
Capacity ('000)1) Occupancy rate (%)2) Average revenue per bed (€)3)
Hotel brand9M
2009/109M
2008/09
Var. %9M
2009/109M
2008/09Var.
% points9M
2009/109M
2008/09
Var. %
Riu 12,074 11,880 + 1.6 74.6 77.3 - 2.7 45.20 48.33 - 6.5Robinson 1,984 1,910 + 3.9 56.7 60.7 - 4.0 82.58 81.76 + 1.0Magic Life 1,908 1,950 - 2.2 63.5 62.5 + 1.0 38.07 37.27 + 2.1Iberotel 1,966 1,965 + 0.1 65.6 60.4 + 5.2 37.74 37.23 + 1.4Grupotel 506 507 - 0.2 60.2 66.0 - 5.8 37.70 38.71 - 2.6Grecotel 283 290 - 2.4 57.5 61.7 - 4.2 52.72 54.68 - 3.6Dorfhotel4) 127 128 - 0.8 43.7 54.6 - 10.9 28.09 27.86 + 0.8aQi 47 43 + 9.3 46.7 41.0 + 5.7 60.17 58.80 + 2.3Total 18,895 18,673 + 1.2 69.8 71.5 - 1.7 46.88 48.99 - 4.3
1) Number of hotel beds multiplied by open days per quarter 2) Occupied beds divided by capacity 3) Turnover from arrangements divided by occupied beds 4) Indicators refer to the two owned hotels
RiuRiu, one of Spain’s leading hotel chains, operated 100 hotels in the period under review. In the third quarter of 2009/10, capacity grew by 2% year-on-year to 4.2m hotel beds available. While positive effects were achieved thanks to strict cost management, earnings were impacted by lower average rates, in particular in the Caribbean. Overall, average revenues per bednight fell by 4%. Occupancy of Riu hotels was slightly down year-on-year in the third quarter.
Business developed as follows in the individual regions:
Average occupancy of Riu hotels in the Canaries decreased by 3 percentage points to 81% year-on-year.
At 76%, occupancy of Riu hotels in the Balearics was flat year-on-year. By contrast, facilities in mainland Spain recorded a decline in occupancy of 5 percentage points to 71% year-on-year.
In the long-haul segment, Riu hotels recorded an average occupancy rate of 74%, flat on the previous year’s level. Jamaica and the Dominican Republic recorded lower bookings, while the load factor on tours to Mexico rose by 11 percentage points. Average revenues per bednight declined by 6%, in particular due to the weakening of the national currencies in the Caribbean.

11
RobinsonIn the third quarter of 2009/10, 24 Robinson club facilities were open. With three new facilities in Morocco, the Maldives and Turkey, capacity rose by 3% year-on-year. While the clubs in Spain, Austria and Switzerland recorded lower load factors, facilities in Greece and Turkey reported flat year-on-year load factors. Overall, occupancy was 2 percentage points down year-on-year with average revenues per bednight flat versus the previous year.
Magic LifeIn the third quarter of 2009/10, 14 Magic Life facilities were open. Capacity decreased slightly due to a change in the portfolio. Occupancy and average revenues per bednight rose year-on-year, above all due to the positive develop-ment in Turkey and Egypt.
IberotelIn the third quarter of 2009/10, 26 facilities in Egypt, Turkey, Italy, the United Arab Emirates and Germany were open. At 70%, occupancy of Iberotels was 6% up year-on-year. This was mainly due to the significant rise in the load factor in the facilities in Turkey and Egypt. Average revenues per bednight grew by 7%.
GrupotelIn the third quarter of 2009/10, 33 hotels of the Grupotel chain represented in Majorca, Menorca and Ibiza were open. Grupotel recorded an occupancy rate of 69%, down 3 percentage points year-on-year, with flat year-on-year capacity. Average revenues per bednight matched the previous year’s level.
GrecotelAll of the 20 facilities of the leading Greek hotel company were operated in the third quarter of 2009/10. As the season started earlier than in 2008/09, the number of open days rose so that capacity grew by 6%. Occupancy and average revenues per bednight decreased year-on-year.
DorfhotelThe indicators relate to the two Group-owned Dorfhotel complexes in Austria. Dorfhotel additionally operates the Dorfhotels in Land Fleesensee, Sylt, and Boltenhagen on the Baltic Sea as a management company. Dorfhotel recorded stable load factors, while average revenues decreased by 19%.
aQiOccupancy and average revenues of the first hotel of the lifestyle hotel brand fell short of expectations.
Economic Situation General Economic Situation Special Events in the Quarter Under Review Consolidated Turnover and Earnings
Tourism Central Operations Information on Container Shipping Consolidated Earnings Net Assets and Financial Position
Other Segment Indicators Prospects Corporate Governance

12
Cruises
The Cruises sector comprises Hapag-Lloyd Kreuzfahrten and the joint venture TUI Cruises. The companies operate in the German-speaking market for cruises and serve the luxury and expedition cruises segment and the volume market for premium cruises. With the waning of the impact of the global financial crisis, the two companies saw improvements in bookings.
Cruises – Key figures
€ millionQ3 2009/10 Q3 2008/09
revisedVar. % 9M 2009/10 9M 2008/09
revisedVar. %
Turnover 31.6 44.6 - 29.1 132.3 147.7 - 10.4Divisional EBITA 1.0 - 3.5 n/a - 3.1 - 8.0 + 61.3 Gains on disposal – – – – Restructuring – – – – Purchase price allocation – – – – Other one-off items + 1.2 – + 1.2 –Underlying divisional EBITA 2.2 - 3.5 n/a - 1.9 - 8.0 + 76.3
Underlying divisional EBITDA 4.3 - 1.9 n/a 4.2 -1.6 n/aCapital expenditure 1.3 0.5 + 160.0 6.1 2.8 + 117.9Headcount (30 June) – – – 225 213 + 5.6
Turnover and earnings In the third quarter of 2009/10, turnover by Hapag-Lloyd Kreuzfahrten totalled €32m, down 29% year-on-year. This decline was attributable to interruption of service of MS Europa due to repairs and associated unscheduled time in dock in Singapore. The joint venture TUI Cruises, the second company in this sector, was measured at equity in the consolidated financial statements so that its turnover is not shown here.
In the third quarter of 2009/10, underlying earnings by the Cruises sector stood at €2m, up €6m year-on-year. The profit contribution by Hapag-Lloyd Kreuzfahrten remained flat versus the previous year. The unscheduled dry-dock period of MS Europa mentioned above only had a minor earnings impact since most of the resulting cancellations were covered by corresponding insurance policies. The remaining impact on earnings from the deductible for the trip cancellation insurance was offset by cost savings.
The considerable increase in earnings by the Cruises sector was driven by TUI Cruises. While earnings in the comparative prior-year period still reflected start-up costs, a clearly positive development of operating earnings was recorded in the period under review.
In the third quarter of 2009/10, the Cruises sector had to carry adjustments worth €1m in connection with the effects of the ash cloud. Total reported earnings by the sector were €1m in the third quarter of 2009/10, up €5m year-on-year.
Cumulative underlying earnings for the first nine months of 2009/10 grew by €6m to €-2m year-on-year. Reported earnings for the first nine months of 2009/10 grew by €5m to €-3m.

13
Hapag-Lloyd Kreuzfahrten
Q3 2009/10 Q3 2008/09 Var. % 9M 2009/10 9M 2008/09 Var. %
Occupancy (in %) 54.7 71.0 - 16.31) 66.7 74.3 - 7.61)
Passenger cruise days 56,248 78,757 - 28.6 210,001 229,959 - 8.7Average daily rates (in €2)) 367 381 - 3.7 400 410 - 2.4
1) percentage points 2) per day and passenger
Hapag-Lloyd KreuzfahrtenIn the third quarter of 2009/10, Hapag-Lloyd Kreuzfahrten recorded a load factor of 55%, down 16 percentage points year-on-year. The average rate per passenger per day was €367, down 4% year-on-year. In the third quarter of 2009/10, 56,248 passenger days were achieved, down 29%. These declines in operating indicators were above all driven by the unscheduled dry-dock period of MS Europa, which did not resume its cruising schedule until 15 June 2010 so that the number of cruise days completed during the quarter under review was very low. MS Columbus completed a world tour ending in Nice in May, setting sail for Nordland and the Baltic Sea in order to implement several summer cruises in these regions. MS Hanseatic sailed the American East Coast, while MS Bremen crossed the Atlantic and subsequently completed a scheduled dry-dock period.
TUI Cruises
Q3 2009/10 Q3 2008/09 Var. % 9M 2009/10 9M 2008/092) Var. %
Occupancy (in %) 92.7 n/m n/a 82.0 n/m n/aPassenger cruise days 162,249 n/m n/a 430,549 n/m n/aAverage daily rates (in €1)) 166 n/m n/a 136 n/m n/a
1) per day and passenger 2) meaningful comparative values for previous year’s reporting periods are not available, because operations of Mein Schiff started in May 2009
TUI CruisesFollowing the Atlantic crossing, Mein Schiff cruised the Mediterranean and set sails for Nordland and the Baltic Sea in the third quarter of 2009/10. At 93%, the load factor again rose significantly versus the previous quarter of 2009/10. This growth was primarily driven by the sustained general recovery of the cruise market and particularly attractive products and events of TUI Cruises, e.g. the ‘Rock Liner’ theme cruise. Following the successful positioning of Mein Schiff in the market, Mein Schiff 2 will be commissioned in May 2011. Bookings of the sister ship have also shown a promising development.
TUI Cruises continued to strengthen its brand profile in a market environment that remained highly competitive, above all in traditional destinations such as the Mediterranean and the Canary Islands. In the third quarter of 2009/10, 162,249 passenger days were recorded, up 10% versus the previous quarter in 2009/10. The average rate grew by €44 per passenger per day to €166 versus the previous quarter in 2009/2010.
Economic Situation General Economic Situation Special Events in the Quarter Under Review Consolidated Turnover and Earnings
Tourism Central Operations Information on Container Shipping Consolidated Earnings Net Assets and Financial Position
Other Segment Indicators Prospects Corporate Governance

14
Central Operations
Central Operations comprise the corporate centre functions of TUI AG and the interim holdings as well as other operating areas, primarily including the Group’s real estate companies.
Central Operations – Key figures
€ millionQ3 2009/10 Q3 2008/09
revisedVar. % 9M 2009/10 9M 2008/09
revisedVar. %
Turnover 15.8 16.9 - 6.5 45.9 71.0 - 35.4Divisional EBITA 17.8 - 11.7 n/a - 2.5 - 74.8 + 96.7 Gains on disposal – – – - 1.8 Restructuring – – – – Purchase price allocation – – – – Other one-off items - 26.8 – - 26.8 –Underlying divisional EBITA - 9.0 - 11.7 + 23.1 - 29.3 - 76.6 + 61.7
Underlying divisional EBITDA - 7.5 - 12.6 + 40.5 - 21.6 - 4.5 + 60.4Capital expenditure 0.5 2.4 - 79.2 2.6 6.6 - 60.6Headcount (30 June) – – – 651 666 - 2.3
In the third quarter of 2009/10, underlying earnings by Central Operations grew by €3m to €-9m year-on-year. Cumulative earnings for the first nine months rose by €47m year-on-year. This was mainly attributable to the charges for the meas-urement of financial instruments included in the prior-year figures.
In the third quarter of 2009/10, Central Operations had to carry adjustments for income worth €27m from currency gains in connection with capital reduction measures in foreign subsidiaries.
At €18m, reported earnings by Central Operations were up €30m year-on-year. For the first nine months, reported earnings totalled €-3m, an improvement of €72m year-on-year.

15
Information on Container Shipping
The 43.33% stake in ‘Albert Ballin’ Joint Venture GmbH & Co. KG taken after the sale of Container Shipping has been measured at equity in TUI’s consolidated financial statements since April 2009. Since the stake in ‘Albert Ballin’ constitutes a financial investment from TUI AG’s perspective, the proportionate at equity result is not included in the TUI Group’s operative performance indicator EBITA. For information purposes, the table below presents Container Shipping from Hapag-Lloyd’s perspective on a 100 per cent basis.
Key figures – Container Shipping
€ million Q3 2009/10 Q3 2008/09 Var. % 9M 2009/10 9M 2008/09 Var. %
Turnover 1,630.4 1,268.8 + 28.5 4,046.1 3,974.0 + 1.8EBITA 213.5 - 222.7 n/a 158.2 656.4 - 75.9 Gains on disposal - 2.2 – - 0.8 - 1,143.0 Restructuring – + 17.1 + 0.4 + 17.2 Purchase price allocation + 13.5 + 12.3 + 36.4 + 45.7 Other one-off items + 1.4 – + 24.1 + 0.3Underlying EBITA 226.2 - 193.3 n/a 218.3 - 423.4 n/a
Development of business operationsTurnover and earnings The positive trend in Container Shipping strengthened in the third quarter of
2009/10. Turnover grew by 29% year-on-year to around €1.6bn. This development was mainly driven by a considerable rise in freight rate levels and a year-on-year increase in transport volumes.
Underlying earnings grew by €420m to €226m in the third quarter of 2009/10. Hapag-Lloyd thus posted the highest quarterly earnings since the onset of the financial crisis. Earnings benefited above all from a substantial rise in freight rates and higher transport volumes. In the course of the third quarter of 2009/10, rates were increased by 114 US dollars/TEU on average. Moreover, the planned cost savings were successfully implemented. In addition, the development of costs benefited from the 7% weakening of the Euro exchange rate versus the functional currency US Dollar.
In the quarter under review, one-off effects worth €13m had to be adjusted for. Reported earnings before adjustment of these effects totalled €214m.
Cumulative underlying earnings for the first nine months of 2009/10 grew by €642m to €218m. Reported earnings for the first nine months of 2009/10 totalled €158m. The previous year’s comparative period had comprised the book profit from the sale of the majority stake in Hapag-Lloyd of €1.1bn.
Transport volumes and freight rates Hapag-Lloyd
Q3 2009/10 Q3 2008/09 Var. % 9M 2009/10 9M 2008/09 Var. %
Transport volumes (in '000 TEU) 1,279 1,187 + 7.8 3,595 3,624 - 0.8Freight rates (in US$/TEU) 1,536 1,182 + 29.9 1,445 1,382 + 4.6
Economic Situation General Economic Situation Special Events in the Quarter Under Review Consolidated Turnover and Earnings
Tourism Central Operations Information on Container Shipping Consolidated Earnings Net Assets and Financial Position
Other Segment Indicators Prospects Corporate Governance

16
In the third quarter, Hapag-Lloyd’s transport volume totalled 1.3m TEU, up 8%. The volume growth was driven by almost all trade lanes, with the Latin America and Atlantic trade lanes achieving the strongest growth in transport volumes. In the framework of selective cargo management, services in the Australasia trade lane continued to exclude unprofitable intra-Asian cargo transportation. For the first nine months of 2009/10, transport volumes totalled 3.6m TEU, only 1% down year-on-year.
Freight rate levels also continued to show a positive trend. In the third quarter of 2009/10, Hapag-Lloyd achieved average freight rates of 1,536 US dollars/TEU, up 30% year-on-year. This growth was mainly driven by freight rate increases in the Far East and Trans-Pacific trade lanes.
In the light of the continued recovery of Container Shipping, Hapag-Lloyd expects to be able to generate clearly positive earnings for the reporting period from October 2009 to September 2010. In the framework of the gratifying develop ment of business operations in Container Shipping, a notedly positive profit contribution for the TUI Group’s share of results from joint ventures and associated is expected.
Financial exposure of TUI AG in Container Shipping
Financial exposure of TUI AG in Container Shipping
€ million 31 Dec 2009 31 Mar 2010 30 June 2010
Equity stake in March 2009 910 910 910Cash capital increase 62 124 124Debt equity swap – 153 15343,33% stake 972 1,187 1,187TUI short-term loan 380 227 227TUI revolving credit facility 200 – –TUI vendor loan 180 180 180Loans 760 407 407Hybrid capital I 350 350 350Hybrid capital II 350 350 350Hybrid capital III 215 215 215Hybrid capital 915 915 915Financial exposure 2,647 2,509 2,509
As at 30 June 2010, the financial exposure in Container Shipping totalled €2.51bn, matching the prior-quarter level as at 31 March 2010. Since the refinancing measures for Container Shipping agreed between the shareholders on 17/18 December 2009 were completed in the second quarter of 2009/10, no further measures were required in the quarter under review.
17
Consolidated Earnings
Consolidated Profit and Loss Statement
€ millionQ3 2009/10 Q3 2008/09
revisedVar. % 9M 2009/10 9M 2008/09
revisedVar. %
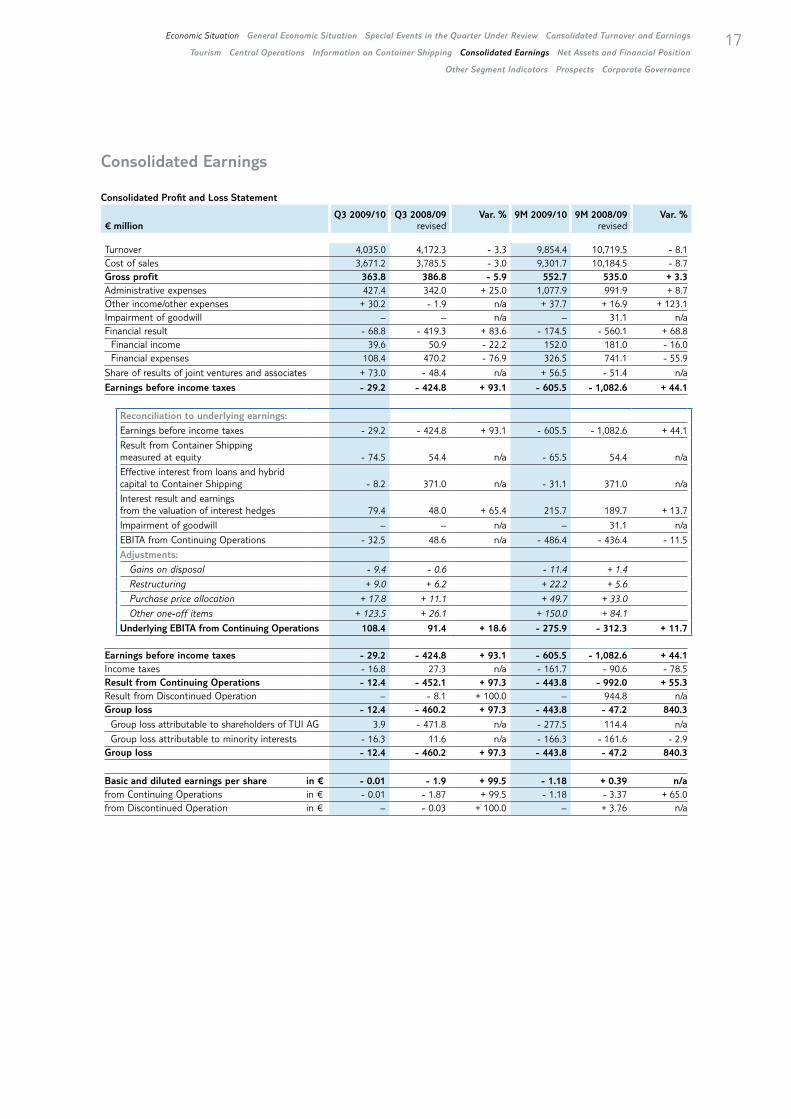
Turnover 4,035.0 4,172.3 - 3.3 9,854.4 10,719.5 - 8.1Cost of sales 3,671.2 3,785.5 - 3.0 9,301.7 10,184.5 - 8.7Gross profit 363.8 386.8 - 5.9 552.7 535.0 + 3.3Administrative expenses 427.4 342.0 + 25.0 1,077.9 991.9 + 8.7Other income/other expenses + 30.2 - 1.9 n/a + 37.7 + 16.9 + 123.1Impairment of goodwill – – n/a – 31.1 n/aFinancial result - 68.8 - 419.3 + 83.6 - 174.5 - 560.1 + 68.8 Financial income 39.6 50.9 - 22.2 152.0 181.0 - 16.0 Financial expenses 108.4 470.2 - 76.9 326.5 741.1 - 55.9
Share of results of joint ventures and associates + 73.0 - 48.4 n/a + 56.5 - 51.4 n/a
Earnings before income taxes - 29.2 - 424.8 + 93.1 - 605.5 - 1,082.6 + 44.1
Reconciliation to underlying earnings:
Earnings before income taxes - 29.2 - 424.8 + 93.1 - 605.5 - 1,082.6 + 44.1
Result from Container Shipping measured at equity - 74.5 54.4 n/a - 65.5 54.4 n/a
Effective interest from loans and hybrid capital to Container Shipping - 8.2 371.0 n/a - 31.1 371.0 n/a
Interest result and earnings from the valuation of interest hedges 79.4 48.0 + 65.4 215.7 189.7 + 13.7
Impairment of goodwill – – n/a – 31.1 n/a
EBITA from Continuing Operations - 32.5 48.6 n/a - 486.4 - 436.4 - 11.5
Adjustments:
Gains on disposal - 9.4 - 0.6 - 11.4 + 1.4
Restructuring + 9.0 + 6.2 + 22.2 + 5.6
Purchase price allocation + 17.8 + 11.1 + 49.7 + 33.0
Other one-off items + 123.5 + 26.1 + 150.0 + 84.1
Underlying EBITA from Continuing Operations 108.4 91.4 + 18.6 - 275.9 - 312.3 + 11.7
Earnings before income taxes - 29.2 - 424.8 + 93.1 - 605.5 - 1,082.6 + 44.1Income taxes - 16.8 27.3 n/a - 161.7 - 90.6 - 78.5Result from Continuing Operations - 12.4 - 452.1 + 97.3 - 443.8 - 992.0 + 55.3Result from Discontinued Operation – - 8.1 + 100.0 – 944.8 n/aGroup loss - 12.4 - 460.2 + 97.3 - 443.8 - 47.2 840.3
Group loss attributable to shareholders of TUI AG 3.9 - 471.8 n/a - 277.5 114.4 n/a
Group loss attributable to minority interests - 16.3 11.6 n/a - 166.3 - 161.6 - 2.9Group loss - 12.4 - 460.2 + 97.3 - 443.8 - 47.2 840.3
Basic and diluted earnings per share in € - 0.01 - 1.9 + 99.5 - 1.18 + 0.39 n/afrom Continuing Operations in € - 0.01 - 1.87 + 99.5 - 1.18 - 3.37 + 65.0from Discontinued Operation in € – - 0.03 + 100.0 – + 3.76 n/a
Economic Situation General Economic Situation Special Events in the Quarter Under Review Consolidated Turnover and Earnings
Tourism Central Operations Information on Container Shipping Consolidated Earnings Net Assets and Financial Position
Other Segment Indicators Prospects Corporate Governance

18
The consolidated profit and loss statement of the Continuing Operations reflects the seasonality in tourism, with positive operating results primarily generated in the third and fourth quarter, i.e. the summer season, for seasonal reasons. Earn-ings by Continuing Operations reflected the adverse earnings effect caused by the closure of European airspace due to the volcanic eruption in Iceland in April 2010. This effect was partly offset by the strengthening of Sterling against the Euro.
Turnover and cost of sales Turnover comprised the turnover of the Continuing Operations, i.e. Tourism and Central Operations. In the third quarter of 2009/10, turnover declined by 3% year-on-year to €4.0bn. In the first nine months of 2009/10, the year-on-year decline was 8%. It was primarily attributable to lower business volumes in TUI Travel in the wake of the cancellations of holidays due to the ash cloud. Turnover was presented alongside the cost of sales, which decreased in line with the declin-ing business volume. A detailed breakdown of turnover and the development of turnover are presented in the section ‘Consolidated turnover and earnings’.
Gross profit At €364m, gross profit as the balance of turnover and the cost of sales decreased by €23m year-on-year in the third quarter of 2009/10. For the nine-month period, gross profit amounted to €553m, down €18m year-on-year.
Administrative expenses Administrative expenses comprised expenses not directly allocable to the turnover transactions, such as expenses for general management functions. At €427m, they were up €85m year-on-year in the third quarter. This increase was mainly driven by expenses incurred in connection with the impact of the closure of European airspace and the year-on-year strengthening of Sterling against the Euro. For the first nine months, the corresponding expenses also rose year-on-year to €1.1bn.
The balance of other income and other expenses totalled €30m in the third quar-ter of 2009/10, up €32m year-on-year. This increase was mainly attributable to other income from currency gains in connection with capital reductions in foreign subsidiaries. A year-on-year rise of €21m to €38m was recorded for the first nine months of 2009/10.
Impairment of goodwill No goodwill impairment charges were carried for the third quarter of 2009/10 or the nine-month period. In the previous year, impairments of goodwill were required in the hotel sector for the first nine months of the year.
Financial result The financial result comprised the interest result and the net result from market-able securities. At €-69m, it improved by €351m year-on-year in the third quarter of 2009/10 and comprised financial income of €40m, down €11m, and financial expenses of €108m, down €362m. In the prior-year comparative period, financial expenses had been impacted by the measurement of the loans granted to Con-tainer Shipping totalling €371m. In the first nine months of 2009/10, the financial result improved by €386m year-on-year. It included interest effects of €31m from the measurement of the loans and hybrid capital granted to Container Shipping using the effective interest method.
The share of results of joint ventures and associates comprised the share in net profit for the year of the associated companies and joint ventures. In the third quarter of 2009/10, the share of result of joint ventures and associates rose €121m year-on-year to €73m. For the nine-month period under review, it grew by
Other income/
Other expenses
Share of results of joint
ventures and associates

19
€108m year-on-year to €57m. This increase was primarily attributable to the measurement of the 43.33% stake in Container Shipping retained by the TUI Group as an associated company in the consolidated financial statements. In the third quarter of 2009/10, the share of result of Container Shipping amounted to €75m. The cumulative share of result for the first nine months was €66m.
In the third quarter of 2009/10, underlying earnings by the Continuing Operations totalled €108m, up €17m year-on-year. Cumulative underlying earnings for the first nine months totalled €-276m, up €36m year-on-year. EBITA was adjusted for gains on disposal, restructuring expenses, purchase price allocations and one-off items. The development of earnings and the adjustments are outlined in detail in the section ‘Consolidated turnover and earnings’ and the comments concerning the development of business.
Income taxes comprised taxes on profits from the business activities of the Continuing Operations. Tax income of €26m arose for the third quarter of 2009/10, following tax expenses of €27m in the prior-year comparative quarter. Cumulative tax income for the first nine months totalled €171m, following €91m in the previous year’s comparative period. In the previous year, the tax income was relatively low in relation to earnings. This was attributable to a negative share of result of Container Shipping and charges resulting from the measurement of the loans granted to Container Shipping.
The result for the periods under review for the current financial year did not comprise any results from Discontinued Operation since the activities of the Magic Life hotel club chain previously carried under this item will now be shown under TUI Hotels & Resorts until they will be transferred to TUI Travel PLC. The results carried for the prior-year periods related to the sale of Container Shipping. A detailed breakdown of this item is provided in the section ‘Result from Discon-tinued Operation’ in the notes.
Group loss In the third quarter of 2009/10, the Group result was negative at €-12m (previous year: €-460m). The year-on-year decline in the Group loss was mainly attributable to lower financial expenses, which had included a one-off expense for the meas-urement of the loans granted to Container Shipping in the previous year. The year-on-year increase in the Group loss in the first nine months of 2009/10 was attributable to the book profit from the sale of Container Shipping, included in the result for the previous year’s comparative quarter.
Minority interests Minority interests amounted to €-16m for the third quarter of 2009/10 and €166,3m for the nine-month period. They related to the minority shareholders of TUI Travel PLC and companies in the TUI Hotels & Resorts sector.
Earnings per shareAfter deduction of minority interests, TUI AG shareholders accounted for €-4m (previous year: €-472m) of the Group result in the third quarter of 2009/10. As a result, basic earnings per share amounted to €-0.01 (previous year: €-1.90) in the third quarter and €-1.18 (previous year: €+0.39) for the first nine months of 2009/10.
Underlying EBITA from
Continuing Operations
Income taxes
Result from
Discontinued Operation
Economic Situation General Economic Situation Special Events in the Quarter Under Review Consolidated Turnover and Earnings
Tourism Central Operations Information on Container Shipping Consolidated Earnings Net Assets and Financial Position
Other Segment Indicators Prospects Corporate Governance

20
Performance indicators
Key figures of Profit and Loss Statement of the Continuing Operations
€ millionQ3 2009/10 Q3 2008/09
revisedVar. % 9M 2009/10 9M 2008/09
revisedVar. %
Earnings before interest, income taxes, depreciation, impairment and rent (EBITDAR) 260.3 336.4 - 22.6 378.4 439.9 - 14.0Operating rental expenses 196.6 188.8 + 4.1 578.7 541.6 + 6.9
Earnings before interest, income taxes, depreciation and impairment (EBITDA) 63.7 147.6 - 56.8 - 200.3 - 101.7 - 97.0
Depreciation/amortisation less reversals of depreciation1) 96.2 99.0 - 2.8 286.1 334.7 - 14.5
Earnings before interest, income taxes and impairment of goodwill (EBITA) - 32.5 48.6 n/a - 486.4 - 436.4 - 11.5
Impairment of goodwill – – n/a – 31.1 n/aEarnings before interest and income taxes (EBIT) - 32.5 48.6 n/a - 486.4 - 467.5 - 4.0Interest result - 71.2 - 419.0 + 83.0 - 184.6 - 560.7 + 67.1Non-operating equity result 74.5 - 54.4 n/a 65.5 - 54.4 n/aEarnings before income taxes (EBT) - 29.2 - 424.8 + 93.1 - 605.5 - 1 082.6 + 44.1
1) on property, plant and equipment, intangible assets, financial and other assets
Net Assets and Financial Position
The Group’s balance sheet total rose by 14% to €15.3bn versus the end of the short financial year 2009. The changes in the consolidated statement of financial position against 30 September 2009 primarily reflected the seasonality in tourism.
Assets and liabilities
€ million30 June 2010 30 Sep 2009
revisedVar. %
Non-current assets 10,188.7 9,100.2 + 12.0Current assets 5,124.2 4,367.1 + 17.3Assets 15,312.9 13,467.3 + 13.7Equity 2,079.5 2,240.8 - 7.2Provisions 2,389.1 2,220.6 + 7.6Financial liabilities 4,579.2 3,714.8 + 23.3Other liabilities 6,265.1 5,291.1 + 18.4Liabilities 15,312.9 13,467.3 + 13.7
Non-current assetsAs at 30 June 2010, non-current assets accounted for 67% of total assets, com-pared with 68% as at 30 September 2009. Non-current assets rose from €9.1bn to €10.2bn in the period under review. The increase was partly driven by a rise in goodwill, mainly attributable to the translation of goodwill not carried in the TUI Group’s functional currency into Euro. The item ‘Companies measured at equity’ rose above all due to additions, translation effects and improvements in quarterly earnings by Container Shipping.
Current assetsAs at 30 June 2010, current assets accounted for 33% of total assets, following 32% as at 30 September 2009. Current assets grew from €4.4bn as at 30 Sep-tember 2009 to €5.1bn as at 30 June 2010. This increase was mainly attributable to the seasonality of the tourism business.

EquityEquity totalled €2.1bn as at 30 June 2010. At 14%, the equity rate decreased against its level as at 30 September 2009, i.e. the balance sheet date. Detailed information on the changes in equity is provided in the notes to this interim report.
ProvisionsProvisions mainly comprised provisions for pension obligations, effective and deferred tax provisions and provisions for typical operating risks. As at 30 June 2010, they totalled €2.4bn, up 8% versus the level recorded as at 30 September 2009, i.e. the balance sheet date.
Financial liabilitiesAs at 30 June 2010, financial liabilities consisted of non-current financial liabilities of €2.9bn and current financial liabilities of €1.7bn. As at 30 September 2009, non-current financial liabilities stood at €3.2bn, with current financial liabilities of €0.5bn. The changes resulted, inter alia, from the reclassification of the bonds maturing in December 2010 and May 2011, respectively, from non-current to current financial liabilities and recognition of the convertible bonds issued by TUI Travel and TUI AG in October and November 2009 and in April 2010, respec-tively, as well as recognition of new borrowings by TUI Travel in the second quarter as non-current financial liabilities.
Other liabilities As at 30 June 2010, other liabilities amounted to €6.3bn, up 18% against 30 September 2009. The increase was primarily attributable to changes in connection with the seasonality of the tourism business.
21Economic Situation General Economic Situation Special Events in the Quarter Under Review Consolidated Turnover and Earnings
Tourism Central Operations Information on Container Shipping Consolidated Earnings Net Assets and Financial Position
Other Segment Indicators Prospects Corporate Governance

22
Other Segment Indicators
Underlying divisional EBITDA
€ millionQ3 2009/10 Q3 2008/09
revisedVar. % 9M 2009/10 9M 2008/09
revisedVar. %
Tourism 192.1 194.5 - 1.2 - 23.4 40.7 n/a TUI Travel 151.2 164.0 - 7.8 - 116.2 - 50.3 - 131.0 TUI Hotels & Resorts 36.6 32.4 + 13.0 88.6 92.6 - 4.3 Cruises 4.3 - 1.9 n/a 4.2 - 1.6 n/aCentral Operations - 7.5 - 12.6 + 40.5 - 21.6 - 54.5 + 60.4Continuing Operations 184.6 181.9 + 1.5 - 45.0 - 13.8 - 226.1Discontinued Operation – 9.6 n/a – - 107.8 + 100.0Underlying divisional EBITDA 184.6 191.5 - 3.6 - 45.0 - 121.6 + 63.0
Divisional EBITDA
€ millionQ3 2009/10 Q3 2008/09
revisedVar. % 9M 2009/10 9M 2008/09
revisedVar. %
Tourism 44.4 160.2 - 72.3 - 205.5 - 49.0 - 319.4 TUI Travel 8.1 129.7 - 93.8 - 283.9 - 134.7 - 110.8 TUI Hotels & Resorts 33.2 32.4 + 2.5 75.4 87.3 - 13.6 Cruises 3.1 - 1.9 n/a 3.0 - 1.6 n/aCentral Operations 19.3 - 12.6 n/a 5.2 - 52.7 n/aContinuing Operations 63.7 147.6 - 56.8 - 200.3 - 101.7 - 97.0Discontinued Operation – – n/a – 1,027.1 n/aDivisional earnings (EBITDA) 63.7 147.6 - 56.8 - 200.3 925.4 n/a
Capital expenditure
€ millionQ3 2009/10 Q3 2008/09
revisedVar. % 9M 2009/10 9M 2008/09
revisedVar. %
Tourism 82.0 79.1 + 3.7 235.7 235.5 + 0.1 TUI Travel 63.2 62.4 + 1.3 188.7 172.3 + 9.5 TUI Hotels & Resorts 17.5 16.2 + 8.0 40.9 60.4 - 32.3 Cruises 1.3 0.5 + 160.0 6.1 2.8 + 117.9Central Operations 0.5 2.4 - 79.2 2.6 6.6 - 60.6Continuing Operations 82.5 81.5 + 1.2 238.3 242.1 - 1.6Discontinued Operation – – n/a – 120.7 n/aTotal 82.5 81.5 + 1.2 238.3 362.8 - 34.3
Amortisation of other intangible assets and depreciation of property, plant and equipment
€ millionQ3 2009/10 Q3 2008/09
revisedVar. % 9M 2009/10 9M 2008/09
revisedVar. %
Tourism 94.7 98.0 - 3.4 278.4 311.2 - 10.5 TUI Travel 74.3 79.0 - 5.9 214.7 250.4 - 14.3 TUI Hotels & Resorts 18.3 17.3 + 5.8 57.6 54.4 + 5.9 Cruises 2.1 1.7 + 23.5 6.1 6.4 - 4.7Central Operations 1.5 1.0 + 50.0 6.3 4.7 + 34.0Continuing Operations 96.2 99.0 - 2.8 284.7 315.9 - 9.9Discontinued Operation – – n/a – – n/aTotal 96.2 99.0 - 2.8 284.7 315.9 - 9.9

23Economic Situation General Economic Situation Special Events in the Quarter Under Review Consolidated Turnover and Earnings
Tourism Central Operations Information on Container Shipping Consolidated Earnings Net Assets and Financial Position
Other Segment Indicators Prospects Corporate Governance
Employees
30 June 10 30 Sep 09 revised
Var. %
Tourism 70,339 68,861 + 2.1 TUI Travel 51,718 50,285 + 2.8 TUI Hotels & Resorts 18,396 18,357 + 0.2 Cruises 225 219 + 2.7Central Operations*) 651 675 - 3.6Continuing Operations 70,990 69,536 + 2.1Discontinued Operation – – n/aTotal 70,990 69,536 + 2.1
*) of which Corporate Center: 180 employees as of 30 June 2010; 200 employees as of 30 Sept 2009.
Prospects
The global economy has recovered substantially since mid-2009, driven by the dynamic development in Asia. The upswing in the industrialised countries has also been stronger than initially expected. It was driven by changes in companies’ stock management policies and expansionary fiscal policies pursued by most countries.
For calendar year 2010, the economic indicators of the global economy are expected to increase, albeit with considerable regional variations. Expansion will continue to be driven by the developing countries and emerging markets. The crisis of confidence in the financial markets caused a slowdown in the economic parameters in the Eurozone in the second half of the calendar year. Since many countries only have limited fiscal policy options to stimulate economic activities due to their deficits, budget consolidation is expected to occur. The European countries, in particular, have already initiated fiscal tightening in response to pres-sure in the financial markets. In the United States and Japan, this policy will hinge upon continued economic recovery. Budget consolidation in the industrialised countries may also lead to a considerable slowdown in the economic development in the emerging markets.
In spite of this risk, the International Monetary Fund has again lifted its forecast for calendar year 2010 (IMF, World Recovery Continues, But Risks Increase, Says IMF, July 8, 2010) and now expects global growth of 4.6%, with growth of 3.3% in the United States, 2.4% in Japan and 1.0% in the Eurozone, as before. By contrast, the emerging Asian economies are expected to achieve growth rates almost matching the pre-crisis levels. For 2010, the IMF expects growth of 10.5% for China and 9.4% for India.
Tourism markets usually follow the general economic development with a time lag. After international tourist arrivals declined in the first three calendar quarters of 2009, this trend reversed at the end of the year. Asia, the Pacific region and the Middle East, in particular, recorded considerable growth, while international tourist arrivals grew less strongly in Europe and America. Moreover, growth in Europe was dampened by the one-week closure of airspace due to the ash cloud resulting from volcanic eruption in Iceland in April 2010.
24
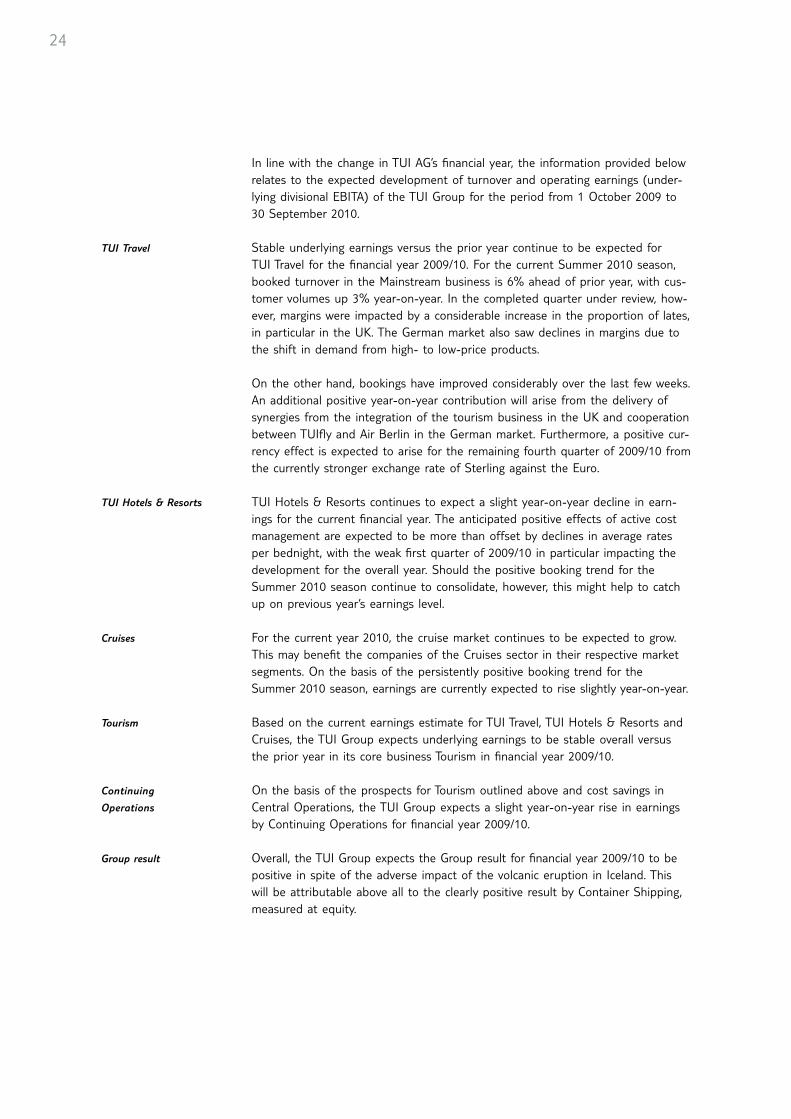
In line with the change in TUI AG’s financial year, the information provided below relates to the expected development of turnover and operating earnings (under-lying divisional EBITA) of the TUI Group for the period from 1 October 2009 to 30 September 2010.
TUI Travel Stable underlying earnings versus the prior year continue to be expected for TUI Travel for the financial year 2009/10. For the current Summer 2010 season, booked turnover in the Mainstream business is 6% ahead of prior year, with cus-tomer volumes up 3% year-on-year. In the completed quarter under review, how-ever, margins were impacted by a considerable increase in the proportion of lates, in particular in the UK. The German market also saw declines in margins due to the shift in demand from high- to low-price products.
On the other hand, bookings have improved considerably over the last few weeks. An additional positive year-on-year contribution will arise from the delivery of synergies from the integration of the tourism business in the UK and cooperation between TUIfly and Air Berlin in the German market. Furthermore, a positive cur-rency effect is expected to arise for the remaining fourth quarter of 2009/10 from the currently stronger exchange rate of Sterling against the Euro.
TUI Hotels & Resorts TUI Hotels & Resorts continues to expect a slight year-on-year decline in earn-ings for the current financial year. The anticipated positive effects of active cost management are expected to be more than offset by declines in average rates per bednight, with the weak first quarter of 2009/10 in particular impacting the development for the overall year. Should the positive booking trend for the Summer 2010 season continue to consolidate, however, this might help to catch up on previous year’s earnings level.
Cruises For the current year 2010, the cruise market continues to be expected to grow. This may benefit the companies of the Cruises sector in their respective market segments. On the basis of the persistently positive booking trend for the Summer 2010 season, earnings are currently expected to rise slightly year-on-year.
Tourism Based on the current earnings estimate for TUI Travel, TUI Hotels & Resorts and Cruises, the TUI Group expects underlying earnings to be stable overall versus the prior year in its core business Tourism in financial year 2009/10.
On the basis of the prospects for Tourism outlined above and cost savings in Central Operations, the TUI Group expects a slight year-on-year rise in earnings by Continuing Operations for financial year 2009/10.
Group result Overall, the TUI Group expects the Group result for financial year 2009/10 to be positive in spite of the adverse impact of the volcanic eruption in Iceland. This will be attributable above all to the clearly positive result by Container Shipping, measured at equity.
Continuing
Operations

25
Corporate Governance
The composition of the boards of TUI AG did not change in the period under review. The current, complete composition of the Executive Board and Supervisory Board is listed on the Company’s website (www.tui-group.com) where it has been made permanently available to the public.
TUI AG
The Executive BoardAugust 2010
Economic Situation General Economic Situation Special Events in the Quarter Under Review Consolidated Turnover and Earnings
Tourism Central Operations Information on Container Shipping Consolidated Earnings Net Assets and Financial Position
Other Segment Indicators Prospects Corporate Governance

26
Corrected Profit and Loss Statement of the TUI Group for the period from 1 October 2009 to 30 June 2010
€ millionNotes Q3 2009/10 Q3 2008/09
revised9M 2009/10 9M 2008/09
revised
Turnover 4,035.0 4,172.3 9,854.4 10,719.5Cost of sales (1) 3,671.2 3,785.5 9,301.7 10,184.5Gross profit 363.8 386.8 552.7 535.0Administrative expenses (1) 427.4 342.0 1,077.9 991.9Other income/other expenses (2) + 30.2 - 1.9 + 37.7 + 16.9Impairment of goodwill – – – 31.1Financial income (3) 39.6 50.9 152.0 181.0Financial expenses (3) 108.4 470.2 326.5 741.1Share of results of joint ventures and associates + 73.0 - 48.4 + 56.5 - 51.4Earnings before income taxes - 29.2 - 424.8 - 605.5 - 1,082.6
Reconciliation to underlying earnings:Earnings before income taxes - 29.2 - 424.8 - 605.5 - 1,082.6Result from Container Shipping measured at equity - 74.5 54.4 - 65.5 54.4Effective interest from loans and hybrid capital to Container Shipping - 8.2 371.0 - 31.1 371.0Interest result and earnings from the valuation of interest hedges 79.4 48.0 215.7 189.7Impairment of goodwill – – – 31.1EBITA from Continuing Operations - 32.5 48.6 - 486.4 - 436.4Adjustments: (4) Gains on disposals - 9.4 - 0.6 - 11.4 1.4 Restructuring 9.0 6.2 22.2 5.6 Purchase price allocation 17.8 11.1 49.7 33.0 Other one-off items 123.5 26.1 150.0 84.1
Underlying EBITA from Continuing Operations 108.4 91.4 - 275.9 - 312.3
Earnings before income taxes - 29.2 - 424.8 - 605.5 - 1,082.6Income taxes (5) - 16.8 27.3 - 161.7 - 90.6Result from Continuing Operations - 12.4 - 452.1 - 443.8 - 992.0Result from Discontinued Operation – - 8.1 – 944.8Group loss - 12.4 - 460.2 - 443.8 - 47.2 Group loss attributable to shareholders of TUI AG + 3.9 - 471.8 - 277.5 114.4 Group loss attributable to minority interests (6) - 16.3 11.6 - 166.3 - 161.6Group loss - 12.4 - 460.2 - 443.8 - 47.2
€Q3 2009/10 Q3 2008/09
revised9M 2009/10 9M 2008/09
revised
Basic and diluted earnings per share - 0.01 - 1.90 - 1.18 + 0.39from Continuing Operations - 0.01 - 1.87 - 1.18 - 3.37from Discontinued Operation – - 0.03 – + 3.76
Interim Financial Statements

27Financial Statements Interim Report 3rd Quarter 2009/10
Corrected Condensed Statement of Comprehensive Income of the TUI Group for the period from 1 October 2009 to 30 June 2010
€ millionQ3 2009/10 Q3 2008/09
revised9M 2009/10 9M 2008/09
revised
Group loss - 12.4 - 460.2 - 443.8 - 47.2Currency translation + 136.8 + 155.1 + 384.1 + 193.2Financial instruments available-for-sale + 0.3 + 0.8 + 4.1 - 0.9Cash flow hedges - 169.6 - 66.8 + 44.6 - 456.0Actuarial gains and losses from pension provisions and related fund assets - 97.2 - 150.0 - 132.5 - 302.9Changes in the measurement of companies measured at equity outside profit and loss - 4.6 - 63.4 - 2.0 - 98.7Income tax on other comprehensive income + 73.8 + 58.6 + 26.9 + 151.7Other comprehensive income - 60.5 - 65.7 325.2 - 513.6Total comprehensive income - 72.9 - 525.9 - 118.6 - 560.8 attributable to shareholders of TUI AG - 95.5 - 528.6 - 179.7 - 558.2 attributable to minority interest + 22.6 + 2.7 + 61.1 - 2.6Total comprehensive income - 72.9 - 525.9 - 118.6 - 560.8

28
Corrected Financial Position of the TUI Group
€ million30 June 2010 30 Sep 2009
revised1 Oct 2008
revised
Assets Goodwill 3,036.6 2,719.2 2,856.0Other intangible assets 948.7 887.9 883.7Investment property 66.3 76.7 87.1Property, plant and equipment 2,504.6 2,371.1 2,648.9Companies measured at equity 1,805.0 1,184.0 446.3Financial assets available-for-sale 606.9 103.0 117.1Trade accounts receivables and other receivables 611.5 1,369.0 423.4Derivative financial instruments 214.5 111.4 78.3Deferred income tax claims 394.6 277.9 182.1Non-current assets 10,188.7 9,100.2 7,722.9
Inventories 95.0 81.5 81.1Financial assets available-for-sale 0.0 2.0 11.4Trade accounts receivables and other receivables 2,600.5 2,066.6 2,018.0Derivative financial instruments 353.0 338.1 219.3Current income tax receivables 136.3 21.2 42.3Cash and cash equivalents 1,680.7 1,452.0 2,793.4Assets held for sale 258.7 405.7 4,805.8Current assets 5,124.2 4,367.1 9,971.3
15,312.9 13,467.3 17,694.2
€ million30 June 2010 30 Sep 2009
revised1 Oct 2008
revised
Equity and liabilitiesSubscribed capital 643.1 642.8 642.3Capital reserves 913.5 871.3 2,471.9Revenue reserves - 154.9 107.5 - 900.6Hybrid capital 294.8 294.8 294.8Equity before minority interests 1,696.5 1,916.4 2,508.4Minority interests 383.0 324.4 321.5Equity 2,079.5 2,240.8 2,829.9
Pension provisions and similar obligations 967.6 838.6 573.6Current income tax provisions 182.0 169.5 157.7Deferred income tax provisions 217.3 181.3 273.0Other provisions 549.1 500.3 524.5Non-current provisions 1,916.0 1,689.7 1,528.8Financial liabilities 2,854.0 3,175.1 4,258.2Derivative financial instruments 95.2 78.7 95.5Other liabilities 95.8 92.6 95.0Non-current liabilities 3,045.0 3,346.4 4,448.7Non-current provisions and liabilities 4,961.0 5,036.1 5,977.5
Pension provisions and similar obligations 34.0 29.8 34.5Current income tax provisions 71.0 85.9 154.1Other provisions 368.1 415.2 384.6Current provisions 473.1 530.9 573.2Financial liabilities 1,725.2 539.7 810.5Trade accounts payable 2,322.9 2,640.8 2,800.9Derivative financial instruments 317.0 363.4 284.2Other liabilities 3,336.8 1,935.4 2,428.7Current liabilities 7,701.9 5,479.3 6,324.3Liabilities related to assets held for sale 97.4 180.2 1,989.3Current provisions and liabilities 8,272.4 6,190.4 8,886.8
15,312.9 13,467.3 17,694.2

29Financial Statements Interim Report 3rd Quarter 2009/10
Corrected Condensed Cash Flow Statement
€ million9M 2009/10 9M 2008/09
revised
Cash flow from operating activities + 123.6 - 361.7Cash flow from investing activities - 231.1 - 249.3Cash flow from financing activities + 298.0 - 333.3Change in funds with cash effect + 190.5 - 944.3Change in cash and cash equivalents due to exchange rate fluctuation + 31.9 - 75.1Cash and cash equivalents at beginning of period 1,458.3 2,944.2Cash and cash equivalents at end of period 1,680.7 1,924.8 of which included in the balance sheet as assets held for sale – + 123.9Cash and cash equivalents at end of period for Continuing Operations 1,680.7 1,800.9
Corrected Condensed Statements of Changes in Group Equity for the Period from 1 October 2009 to 30 June 2010
€ millionSubscribed
capitalCapital
reservesRevenue reserves
Hybrid capital
Equity before
minority interests
Minority interests Equity
Balance as at 1 Oct 2009 (revised) 642.8 871.3 107.5 294.8 1,916.4 324.4 2,240.8Dividend payments – – - 76.1 – - 76.1 - 2.5 - 78.6Hybrid capital dividend – – - 19.4 – - 19.4 – - 19.4Issue of convertible bonds – 41.8 91.3 – 133.1 – 133.1Issue of employee shares 0.3 0.4 – – 0.7 – 0.7Effect of the aquisition of minority interests – – - 92.3 – - 92.3 – - 92.3Deconsolidation – – - 2.0 – - 2.0 – - 2.0Share-based payment schemes of TUI Travel – – 15.9 – 15.9 – 15.9Group total comprehensive income – – - 179.8 – - 179.8 61.1 - 118.7Balance as at 30 June 2010 643.1 913.5 - 154.9 294.8 1,696.5 383.0 2,079.5
Corrected Condensed Statements of Changes in Group Equity for the Period from 1 October 2008 to 30 June 2009
€ millionSubscribed
capitalCapital
reservesRevenue reserves
Hybrid capital
Equity before
minority interests
Minority interests Equity
Balance as at 1 Oct 2008 (revised) 642.3 2,471.9 - 900.6 294.8 2,508.4 321.5 2,829.9Dividend payments – – - 55.2 – - 55.2 - 11.3 - 66.5Hybrid capital dividend – – - 19.3 – - 19.3 – - 19.3Issue of employee shares 0.5 1.2 - – 1.7 – 1.7First-time consolidation – – 1.9 – 1.9 – 1.9Effect of step acquisitions – – - 6.6 – - 6.6 0.1 - 6.5Effect of the aquisition of minority interests – – - 18.2 – - 18.2 0.3 - 17.9Deconsolidation – – – – – - 0.4 - 0.4Effect of option writer position from an option on minority interests – – - 15.4 – - 15.4 – - 15.4Share-based payment schemes of TUI Travel – – 14.9 – 14.9 – 14.9Transfer from reserves – - 1,503.8 1,503.8 – – – –Group total comprehensive income – – - 558.2 – - 558.2 - 2.6 - 560.8Balance as at 30 June 2009 (revised) 642.8 969.3 - 52.9 294.8 1,854.0 307.6 2,161.6

30
Correction of Interim Financial Statements
As described in the corrected consolidated financial statements for the short financial year 2009, TUI AG directly corrected the booking errors identified in TUI Travel PLC in turn over recognition and the reversal of adjustment items shown under trade accounts payable in the respective consolidated financial statements and in the interim reports that might be of relevance for TUI AG’s ability to operate in the financial markets.
The following corrections were effected in the profit and loss statement:
Corrected items of the TUI Group’s profit and loss statement for the period from 1 April 2010 to 30 June 2010
Q3 2009/10 Q3 2008/09
€ millionbefore
revision revision revisedbefore
revision revision revised
Turnover 4,002.1 32.9 4,035.0 4,175.7 - 3.4 4,172.3
Gross profit 330.9 32.9 363.8 390.2 - 3.4 386.8Earnings before income taxes - 62.1 32.9 - 29.2 - 421.4 - 3.4 - 424.8
EBITA from continuing operations - 65.4 32.9 - 32.5 52.0 - 3.4 48.6
Underlying EBITA from continuing operations 104.8 3.6 108.4 94.8 - 3.4 91.4
Income taxes - 25.8 9.0 - 16.8 27.3 0.0 27.3
Result from continuing operations - 36.3 23.9 - 12.4 - 448.7 - 3.4 - 452.1
Group profit/loss for the year - 36.3 23.9 - 12.4 - 456.8 - 3.4 - 460.2
Attributable to TUI AG shareholders - 9.4 13.3 3.9 - 470.1 - 1.7 - 471.8
Attributable to minority interests - 26.9 10.6 - 16.3 13.3 - 1.7 11.6
Earnings per share € - 0.06 0.05 - 0.01 - 1.89 - 0.01 - 1.90
Corrected items of the TUI Group’s profit and loss statement for the period from 1 October 2009 to 30 June 2010
9M 2009/10 9M 2008/09
€ millionbefore
revision revision revisedbefore
revision revision revised
Turnover 9,821.5 32.9 9,854.4 10,728.6 - 9.1 10,719.5Gross profit 519.8 32.9 552.7 544.1 - 9.1 535.0
Earnings before income taxes - 638.4 32.9 - 605.5 - 1 073.5 - 9.1 - 1,082.6
EBITA from continuing operations - 519.3 32.9 - 486.4 - 427.3 - 9.1 - 436.4
Underlying EBITA from continuing operations - 279.5 3.6 - 275.9 - 303.2 - 9.1 - 312.3
Income taxes - 170.7 9.0 - 161.7 -90.6 0.0 - 90.6
Result from continuing operations - 467.7 23.9 - 443.8 - 982.9 - 9.1 - 992.0
Group profit/loss for the year - 467.7 23.9 - 443.8 - 38.1 - 9.1 - 47.2Attributable to TUI AG shareholders - 290.8 13.3 - 277.5 119.1 - 4.7 114.4
Attributable to minority interests - 176.9 10.6 - 166.3 - 157.2 - 4.4 - 161.6Earnings per share € - 1.23 0.05 - 1.18 0.41 - 0.02 0.39
Notes

31Notes Interim Report 3rd Quarter 2009/10
The corrections result in a reduction in trade accounts receivable of €49.0m as at 30 June 2010 (previous year € 59.1m) and an increase in trade accounts payable of €52.6m (previous year €63.4m). Equity (other revenue reserves) is reduced by €111.3m (previous year €122.5m), with an amount of €75.0m relating to prior financial years.
Accounting Principles
In accordance with IAS 34 ‘Interim Financial Reporting’, the Group’s interim report as at 30 June 2010 are published in a condensed form compared with the consoli-dated annual financial statements. As before, they were based on the historical cost principle, the only exception being the accounting method applied in measur-ing financial instruments.
Following the change in TUI AG’s financial year-end to 30 September, the TUI Group now reports about the period from 1 October of any one year until 30 September of the subsequent year. Accordingly, the comparative period for Q3 2009/10 was the period from April to June 2009 (Q3 2008/09), while the comparative period for the nine-month period in 2009/10 was the period from October 2008 to June 2009 (9M 2008/09).
The comparative figures for the prior-year periods were adjusted for the purchase price allocations of the acquisitions made from 1 October 2008 to 30 June 2009, finalised within the mandatory 12-month period.
At the end of September 2009, ‘Magic Life’ was classified as Discontinued Opera-tion. Due to a change in the disposal plan the respective results were reallocated to Continuing Operations. This also applies to the comparative figures.
As a matter of principle, the accounting and measurement methods applied in the preceding consolidated financial statements as per 30 September 2009 were retained in preparing the interim report as per 30 June 2010.
In addition, the following standards and interpretations revised or newly pub-lished by the IASB were mandatory as of the beginning of financial year 2009/10:
1 IFRS 3: ‘Business Combinations’1 IAS 27: ‘Consolidated and Separate Financial Statements according to IFRS’ 1 IAS 39: ‘Financial Instruments: Recognition and Measurement – Eligible Hedged
Items’ 1 IFRIC 12: ‘Service Concession Arrangements’1 IFRIC 16: ‘Hedges of a Net Investment in a Foreign Operation’1 Annual Improvements Project (2009) where IFRS 2 ‘Share-based Payment’, and
IAS 38 ‘Intangible Assets’ are concerned
TUI AG has been an early adopter of the amendments to IFRS 3 ‘Business Com-binations’ and IAS 27 ‘Consolidated and Separate Financial Statements according to IFRS’ and has applied the amendments since 1 January 2009. The provisions of IFRIC 17 ‘Distribution of Non-cash Assets to Owners’ and IFRIC 18 ‘Transfers of Assets from Customers’ were voluntarily applied in the present interim report prior to their effective date of 1 November 2009.

32
The application of all amendments and newly published standards listed above did not result in any material effects on the TUI Group’s net assets, financial position and financial performance in the present interim report.
Group of Consolidated Companies
The consolidated financial statements included all major subsidiaries in which TUI AG was able to directly or indirectly govern the financial or operating policies such that the Group obtained benefits from the activities of these companies.
The interim report as at 30 June 2010 included a total of 45 domestic and 693 foreign subsidiaries, besides TUI AG.
Since 1 October 2009, four companies have been newly included in consolidation due to an expansion of their business operations and a further nine companies due to acquisitions. Two companies were newly established. One company previously measured at equity was included as a fully consolidated subsidiary due to the purchase of additional shares. Twelve companies were deconsolidated due to mergers or liquidation. Five companies were sold and therefore removed from consolidation. Two companies were newly included in the group of companies measured at equity due to acquisitions, and one company was measured at equity for the first time due to an expansion of its business operations.
Acquisitions
Summary presentation of acquisitions
Name and headquarters of the acquired company Business activity Acquirer
Date of acquisition
Acquiredshare
Acquisitioncosts
€ million
Select-World Pty Ltd., Australia Cruise handlingFirst Choice Holdings
Australia Pty Ltd. 26 Nov 2009 100.0% 8.3
Sport Executive Travel Limited, UK (5 companies)Tour operator
for studentsTUI Travel
Holdings Ltd. 22 Dec 2009 100.0% 0.5
The Hampstead School of English Ltd., UK Language coursesTUI Travel
Holdings Ltd. 19 Feb 2010 n/a 8.0
TUI Travel Hotel Management Services Ltd., Turkey Hotel managementTUI Travel
Holdings Ltd. 1 Mar 2010 n/a –
TURKUAZ Insaat Turizm A.S., Turkey Hotel company TUI AG 30 Mar 2010 50.0% 9.0
Hilario Tours S.A., Dominican Republic Bus companyHotelbeds
Dominicana S.A. 27 Apr 2010 n/a 9.9
Wonderholding AB, Sweden and its stake in another company Tour operator
TUI Nordic Holding AB 19 May 2010 100.0% 0.7
19 travel agencies in Germany Travel agenciesTUI Leisure
Travel GmbH Various n/a 7.7
Total 44.1
Following its formation, TUI Travel Hotel Management Services Ltd. acquired the business operations and associated contracts of a hotel management company, including services for hotels in Turkey.

33Notes Interim Report 3rd Quarter 2009/10
Following acquisition of the shares listed above, TUI AG now holds 100% of TURKUAZ Insaat Turizm A.S. Fair value measurement of the previously held shares of €3.7m as at the acquisition date resulted in income of €0.2m, carried under Other income.
Acquisition costs comprised paid purchase prices and an amount of €1.4m which depends on the outcome of future events. Ancillary acquisitions costs and pay-ments for future services by the employees of the acquired companies were car-ried as administrative expenses through profit and loss in accordance with the amendments to IFRS 3. In the period under review, total acquisition costs amounted to €11.2m.
Summary presentation of statements of financial position as at the date of first-time consolidation
€ million, translatedCarrying amounts at
date of acquisition
Revaluationof assets
and liabilities
Revaluedcarrying amounts
at date of first-timeconsolidation
Other intangible assets – 46.4 46.4Property, plant and equipment 16.8 1.9 18.7Fixed assets 16.8 48.3 65.1Inventories 0.8 – 0.8Receivables and other assets including prepaid expenses 1.9 – 1.9Cash and cash equivalents 5.2 – 5.2Deferred income tax provisions 0.1 3.5 3.6Other provisions 1.8 – 1.8Financial liabilities 8.1 – 8.1Liabilities and deferred income 39.9 – 39.9Equity - 25.2 44.8 19.6
The difference arising between the acquisition costs and the revalued acquired net assets, constituting synergy potential, was temporarily carried as goodwill. As a result, goodwill rose by a total of €29.1m.
The 12-month period permitted under IFRS 3 for finalising purchase price alloca-tions was used. It permits temporary allocation of the purchase price to the indi-vidual assets and liabilities until the end of that period.
€6.9m of the goodwill capitalised in the period under review are expected to be tax-deductible.
The companies and business operations acquired in the period under review posted turnover of €15.3m, contained in the profit and loss statement for the period from 1 October 2009 to 30 June 2010. They generated profits of €2.0m. If they had been included in the consolidated financial statements since 1 October 2009, turnover for the reporting period ended 30 June 2010 would have been €16.5m higher and the Group result would have changed by €1.3m.

34
In the present interim report, the purchase price allocations of the following com-panies and groups acquired in the period from 1 October 2008 to 30 June 2009 were finalised within the required 12-month period in accordance with the provisions of IFRS 3:
1 Travel Adventures Inc., USA1 Sport Abroad Ltd., UK1 Teamlink Travel Group, UK1 Sunshine Cruises Ltd., UK1 Edwin Doran Travel Ltd., UK1 Master Yachting GmbH, Germany1 On the piste.com Group, UK1 Adventure Tours Australia Group, Australia1 Williment World Travel Group, New Zealand1 Aragon Tours Ltd., UK1 Zeghram Expeditions Group, USA
Comparative information for reporting periods prior to the completion of the first-time accounting for an acquisition transaction retrospectively has to be presented as if the purchase price allocation had already been finalised as at the acquisition date. The table below provides an overview of the combined final purchase price allocations:
Summary presentation of the final statements of financial positionas at the date of first-time consolidation
€ million, translatedCarrying amounts at
date of acquisition
Revaluation of assets
and liabilities
Carrying amounts at date of first-time
consolidation
Other intangible assets 2.5 17.8 20.3Property, plant and equipment 60.2 - 15.4 44.8Fixed assets 62.7 2.4 65.1Inventories 2.0 – 2.0Receivables and other assets including prepaid expenses 31.3 3.1 34.4Cash and cash equivalents 37.8 – 37.8Deferred income tax provisions 0.1 1.4 1.5Other provisions 7.2 4.2 11.4Financial liabilities 2.8 – 2.8Liabilities and deferred income 50.3 1.5 51.8Equity 73.4 - 1.6 71.8
The goodwill arising in the consolidated statement of financial position on eliminat-ing the acquisition cost against the acquirer’s interest in the revalued equity declined by €3.4m as against 30 September 2009. The capitalised goodwill essen-tially represents a part of the expected synergy potential.
As at the end of March 2009, the 43.33% stake in ‘Albert Ballin’ Joint Venture GmbH & Co. KG was measured at equity for the first time. The determination of the fair values of the assets and liabilities, in particular of Hapag-Lloyd AG, imple-mented in connection with this measurement, was finalised in the second quarter of 2009/10. As a result, the carrying amount of Container Shipping, measured at equity, decreased by €16.7m as per 30 September 2009. At the same time, the result from joint ventures and associates for the previous year’s comparative period rose by €66.8m due to the changed depreciation or reversal of the assets and liabilities revalued in the framework of purchase price allocation. The prior year comparative periods were restated accordingly.

35Notes Interim Report 3rd Quarter 2009/10
DivestmentsThe tourism operations of the TUI Travel Group in Canada, hereinafter referred to as Canada Mainstream, were classified as a disposal group in accordance with IFRS 5 as at 30 September 2009.
On 14 January 2010, following regulatory clearance by the competent authorities, Canada Mainstream was contributed to the Sunwing Group. In consideration, TUI Travel received a 49% stake in the tourism venture formed with the Sunwing Travel Group. In addition, €97.7m were paid as the purchase price for shares in the new company and as a cash contribution to the new company. The new com-pany will be measured at equity as an associated company. The disposal resulted in income of €2.0m, carried under Other income.
In order to enhance comparability, the expenses and income of Canada Main-stream included in the periods under review are presented below.
Effect of the change in the basis of consolidation on the profit and loss statement due to the disposal of Canada Mainstream
€ million Q3 2009/10 Q3 2008/09 9M 2009/10 9M 2008/09
Turnover – 24.9 58.8 196.5Cost of sales and administrative expenses – 36.3 65.2 221.2Financial result – - 0.4 - 0.3 + 0.1Earnings before income taxes – - 11.8 - 6.7 - 24.6Result from Continuing Operations – - 11.8 - 6.7 - 24.6
Other divestments did not have any noteworthy effects on the TUI Group’s net assets, financial position and financial performance.
Discontinued Operation
In the quarter under review, the decision was taken to sell the Magic Life hotel company, available for sale since 30 September 2009, to TUI Travel PLC as an intra-Group transaction. Due to that decision, the hotel activities of the Magic Life Group will be combined with the remaining tourism activities of TUI Travel PLC in Turkey and placed under the responsibility of the tour operators in Tourism. The four owned hotel facilities in Turkey leased by the Magic Life Group had to be classified as a disposal group in accordance with IFRS 5.
Accordingly, the results of the Magic Life Group have been reallocated to Continu-ing Operations. The depreciation and amortisation suspended for the period under review were caught up on. Earnings by Continuing Operations declined overall by €35.9m (previous year: €-31.8m), while earnings by Discontinued Operation rose accordingly by €34.4m (previous year: €+31.8m).
In the comparative period from 1 October 2008 to 30 June 2009, this item still included the Container Shipping activities until they were sold at the end of March 2009 and the stakes in the container terminals in Altenwerder and Montreal/Canada.

36
Result from Discontinued Operation
Result from Discontinued Operation
€ millionQ3 2009/10 Q3 2008/09
revised9M 2009/10 9M 2008/09
revised
Turnover – – – 2,705.2Cost of sales – – – 2,767.5Administrative expenses – – – 68.3Other income/other expenses – – – - 1.5Financial income – – – 6.7Financial expenses – – – 34.8Earnings before income taxes – – – - 160.2Income taxes – – – 29.9 of which deferred tax expenses/income – – – - 36.2
Earnings after income taxes – – – - 190.1
Result on disposal – - 8.1 – 1,134.9
Result from Discontinued Operation – - 8.1 – 944.8
Reconciliation to underlying earnings:Earnings after income taxes – - 8.1 – 944.8
Income taxes – – – 29.9
Interest result – – – 27.9EBITA from Discontinued Operation1) – - 8.1 – 1,002.6Adjustments: Gains on disposal – 8.1 – - 1,134.9 Restructuring – – – - 0.2 Purchase price allocation – – – 33.8 One-off items – – – 0.2 IFRS 5 effects1) – – – - 131.6
Underlying EBITA from Discontinued Operation – – – - 230.1
1) Where earnings were determined in accordance with IFRS 5, taking account of the discontinuation of depreciation/amortisation and at equity measurement, this earnings effect was additionally included in the adjustments for the Discontinued Operations in order to enhance comparability of the underlying EBITA with the results from Continuing Operations.
Due to the deconsolidation of Container Shipping as at the end of March 2009, the assets and liabilities of the Discontinued Operation as at 30 September 2009 exclusively related to the Magic Life hotel company, including the four owned hotel facilities.
Assets and liabilities of the Discontinued Operation
€ million 30 Jun 2010 30 Sep 2009
Non-current assets – 100.7Current assets – 50.8Assets held for sale – 151.5Non-current provisions and liabilities – 92.0Current provisions and liabilities – 30.5Liabilities related to assets held for sale – 122.5
Cash flows from operating, investing and financing activities
€ million9M 2009/10 9M 2008/09
revised
Cash flow from operating activities – + 43.0Cash flow from investing activities – - 113.0Cash flow from financing activities – + 271.1
Change in cash and cash equivalents due to exchange rate fluctuation – + 0.0Change of cash and cash equivalents – + 201.1
37Notes Interim Report 3rd Quarter 2009/10
Notes on the Consolidated Profit and Loss Statement
As a matter of principle, the consolidated profit and loss statement for the Continu ing Operations reflect the seasonality of the tourism business, as a result of which earnings are highest in the months falling into the third and fourth quarters due to the nature of the business. Earnings in the third quarter of 2009/10 reflected the impact caused by the closure of Europe’s airspace due to the volcanic eruption in Iceland in April 2010 totalling €127.8m. This negative effect was slightly offset by the strengthening of Sterling against the Euro.
The cost of sales and administrative expenses comprised the following items:
Lease, rental and leasing expenses
€ millionQ3 2009/10 Q3 2008/09
revised9M 2009/10 9M 2008/09
revised
Lease, rental and leasing expenses 196.6 176.3 578.7 541.6
Personnel costs
€ millionQ3 2009/10 Q3 2008/09
revised9M 2009/10 9M 2008/09
revised
Personnel costs 559.2 535.9 1,619.1 1,596.3
Depreciation/amortisation/impairments
€ millionQ3 2009/10 Q3 2008/09
revised9M 2009/10 9M 2008/09
revised
Depreciation and amortisation 90.4 96.7 280.0 296.2Impairments of property, plant and equipment – – 4.7 19.7Total 90.4 96.7 284.7 315.9
Other income/other expenses
€ millionQ3 2009/10 Q3 2008/09
revised9M 2009/10 9M 2008/09
revised
Other income 34.1 1.4 46.6 38.6Other expenses 3.9 3.3 8.9 21.7Total 30.2 -1.9 37.7 16.9
Other income carried in the quarter under review mainly resulted from currency gains in connection with capital reduction measures in foreign subsidiaries (€27.4m).
The financial result for 9M 2009/10 included in particular interest effects of €31.1m from the measurement of the loans and hybrid capital granted to ‘Albert Ballin’ Holding GmbH & Co. KG and Hapag-Lloyd AG using the effective interest method.
In connection with these loans, charges for interest effects totalling €371.0m were carried for the previous year’s comparative period. They resulted from a comparison of appropriate interest rates at the time with the originally agreed interest rates.
In addition to the disclosures required under IFRS, the consolidated profit and loss statement comprises a reconciliation to underlying earnings. The adjustments show deconsolidation income as gains on disposals, events according to IAS 37 as restructuring and effects of purchase price allocations on EBITA, ancillary acquisition
(1) Cost of sales and
administrative expenses
(2) Other income/
Other expenses
(3) Financial income/
Financial expenses
(4) Adjustments

38
costs and contingent purchase price payments to be carried as expenses as purchase price allocation. This reconciliation also includes the one-off items presented below:
One-off items by sector
€ millionQ3 2009/10 Q3 2008/09
revised9M 2009/10 9M 2008/09
revised
Tourism 150.3 26.1 176.8 84.1 TUI Travel 145.7 26.1 162.4 82.6 TUI Hotels & Resorts 3.4 – 13.2 1.5 Cruises 1.2 – 1.2 –All other segments - 26.8 – - 26.8 –Total 123.5 26.1 150.0 84.1
The one-off items carried for the third quarter of 2009/10 included an amount of €127.8m reflecting the impact from the closure of European airspace due to the volcanic eruption in Iceland in April 2010, comprising €123.2m related to TUI Travel, €3.4m related to TUI Hotels & Resorts and €1.2m related to Cruises.
One-off items relating to Other segments consisted of currency effects in connection with capital reduction measures in foreign subsidiaries.
The tax income arising for the first nine months of the financial year was largely attributable to the seasonality in tourism.
The previous year’s tax income, which was relatively low in relation to results, was attributable to the negative share of result of Container Shipping and the charges for the loan granted to Container Shipping, which did not affect deferred taxes.
Group loss attributable to minority interests
€ millionQ3 2009/10 Q3 2008/09
revised9M 2009/10 9M 2008/09
revised
TUI Travel - 24.0 6.5 - 188.7 - 182.1TUI Hotels & Resorts 7.7 5.1 22.4 20.5Total - 16.3 + 11.6 - 166.3 - 161.6
(5) Income taxes
(6) Group loss attributable
to minority interests

39Notes Interim Report 3rd Quarter 2009/10
Notes on the Consolidated Statement of Financial Position
The changes in the consolidated statement of financial position as against 30 September 2009 primarily reflected the seasonality in tourism.
The increase in goodwill mainly resulted from the translation of goodwill not carried in the TUI Group’s functional currency into Euros.
Moreover, the refinancing agreement concluded in December 2009 between the shareholders of the container shipping line already caused shifts in non-current assets in prior quarters. Under the Container Shipping refinancing agreement, TUI AG converted part of its non-current receivables from Container Shipping into hybrid capital.
Assets held for sale
€ million 30 Jun 2010 30 Sep 2009
Discontinued Operation ’Magic Life’ – 151.5Property and hotel facilities 195.6 101.9’Jet4You’ 32.3 18.8Other assets 30.8 55.5’Canada Mainstream’ – 78.0Total 258.7 405.7
Liabilities related to assets held for sale
€ million 30 Jun 2010 30 Sep 2009
Discontinued Operation ’Magic Life’ – 122.5Hotel facilities 46.6 –’Jet4You’ 50.8 23.7’Canada Mainstream’ – 34.0Total 97.4 180.2
Non-current financial liabilities decreased by a total of €321.1m to €2,854.0m. Bonds worth €625.0m repayable in May 2011 had to be reclassified to current financial liabilities. Moreover, the floating rate notes repayable in December 2010 now had to be carried under current liabilities at the amount of the liabilities still outstanding (nominal value €455.0m) upon repurchase in the first half of 2009/10 (nominal value €95.0m). In addition, three bonds worth a total of €150.0m, planned to be redeemed in December 2010, now had to be carried as current financial liabilities. TUI Travel PLC issued convertible bonds in October 2009 and April 2010. Further convertible bonds were issued by TUI AG in November 2009. Following deduction of the charge for the conversion right, these bonds had to be recognised as non-current financial liabilities at €934.2m as at 30 June 2010. Facilities newly raised by TUI Travel PLC under the revolving syndicated credit facility amounted to €183.5m as at 30 June 2010.
Current liabilities rose by €1,185.5m to €1,725.2m, primarily due to the reclassifi-cation from non-current liabilities.

40
Changes in Equity
In the period under review, equity declined due to the payment of dividends to non-Group shareholders, above all the dividend paid by TUI Travel PLC on its ordinary shares. In addition, the interest paid on the hybrid capital issued by TUI AG had to be carried as a dividend in accordance with IFRS rules.
Convertible bonds were issued by TUI Travel PLC in October 2009 and April 2010 as well as by TUI AG in November 2009. In accordance with the IFRS rules, the bond components relating to the conversion options had to be classified as equity instruments and carried as equity after deduction of borrowing costs. Overall, the convertible bonds led to an increase in equity of €133.1m.
The goodwill arising from the balance between acquired equity and acquisition costs in acquiring minority interests was eliminated directly against revenue reserves. The acquisition of additional shares in TUI Travel PLC by TUI AG, in par-ticular, resulted in a decrease in equity of €92.3m.
In the framework of long-term incentive programmes, TUI Travel compensates its employees in the form of stock option plans serviced with shares. These stock option plans resulted in an increase in pre-tax equity of €15.9m outside profit or loss in the period under review.
The Group result was negative due to the seasonality in tourism. It was also affected above all by the financial impact of €127.8m from the closure of European airspace due to the volcanic eruption in Iceland in April 2010.
Equity benefited from translation effects caused by the weakening of the Euro, in particular against Sterling, US Dollar and Canadian Dollar, as against 30 September 2009.
The revaluation reserve for cash flow hedges comprised the results of hedges resulting from the effective hedging of future cash flows. In the period under review, these results, which had to be eliminated against equity, totalled €44.6m before taxes, with associated taxes of €-10.4m. Overall, equity thus rose by €34.2m.
The reserve according to IAS 19 comprised profit and losses from changes in actuarial parameters in connection with the measurement of pension obligations and associated fund assets, carried with no effect on results. Due to lower global long-term interest rates and lower fair values of plan assets, pension obligations rose and the value of plan assets declined, in particular in the UK, causing an increase in pension liabilities respectively a decrease in pension assets and there-fore in the charges for the reserve according to IAS 19 outside profit or loss.
Contingent Liabilities
As at 30 June 2010, contingent liabilities amounted to €258.0m (as at 30 September 2009: around €254.7m). Contingent liabilities were carried at the level of estimated settlement as at the date of the statement of financial position. They mainly related to guarantees denominated in US Dollar for the benefit of Hapag-Lloyd AG.
40

41
Other Financial Commitments
Financial commitments from operating rental, lease and charter agreements
€ million 30 Jun 2010 30 Sep 2009
Nominal value 3,202.3 2,900.9Fair value 2,726.9 2,446.0
Financial commitments from operating rental, lease and charter agreements rose by €301.4m to €3,202.3m as against 30 September 2009. This increase included an amount of €140.3m for leasing additional aircraft as well as currency effects caused by the strengthening of US Dollar against the Euro. In addition, financial commitments rose by €84.6m due to the charter commitments for an additional cruise liner and an extension of the contract term for a cruise ship already operated.
Remaining other financial commitments
€ million 30 Jun 2010 30 Sep 2009
Order commitments in respect of capital expenditure 1,978.2 2,518.6Other financial commitments 189.9 555.8Total (nominal value) 2,168.1 3,074.4Fair value 1,912.2 2,619.3
As against 30 September 2009, order commitments in respect of capital expendi-ture, almost exclusively relating to Tourism, decreased by €540.4m to €1,978.2m, above all due to the cancellation of orders for ten B787 aircraft. An opposite effect was mainly driven by the translation effects arising from the strengthening of US Dollar against the Euro.
As at 30 June 2010, the Remaining other financial commitments decreased by €365.9m to €189.9m as against 30 September 2009, above all due to completion of the cash contribution commitment to increase equity in Container Shipping. Unused loan commitments in Tourism also declined.
Notes Interim Report 3rd Quarter 2009/10
42
Notes on the Consolidated Cash Flow Statement
Based on the after-tax Group result, the cash flow from operating activities was established using the indirect method. In the period under review, cash and cash equivalents of the Continuing Operations rose by €228.7m to €1,680.7m.
The inflow of cash from operating activities was €123.6m (previous year: outflow of €361.7m) in the period under review. The considerable rise in the inflow of cash year-on-year was primarily caused by a stronger seasonal increase in advance payments by customers versus the prior year.
The figure for the prior-year comparative period had included an inflow of cash worth €43.0m from operating activities in Container Shipping, sold at the end of March 2009.
The outflow of cash from investing activities totalled €231.1m in the period under review. An outflow of €97.7m arose in connection with the restructuring of the Canadian TUI Travel operations. This item also included the contribution to the capital increase (€123.5m) in Container Shipping. On 31 March 2010, the ‘Albert Ballin’ consortium took over a loan worth €200.0m granted by TUI AG to Con-tainer Shipping, as scheduled.
The cash flow from investing activities also included an outflow of cash for investments in fixed assets in TUI Travel of €183.8m and the hotel companies of €41.9m as well as an inflow of cash of €40.0m from the sale of property.
The inflow of cash from financing activities totalled €298.0m. This inflow was largely attributable to the convertible bonds issued by TUI AG of €211.1m and two convertible bond issues by TUI Travel PLC of €811.4m (each after deduction of borrowing costs). This item also comprised the acquisition of additional shares in TUI Travel PLC by TUI AG (€94.7m). In the first nine months of 2009/10, bonds and financial liabilities worth €573.6m were repaid. Interest payments amounted to €184.8m. Other outflows of cash related to the dividend on TUI AG’s hybrid loan (€25.9m) and the dividends for minority shareholders (€72.5m), in particular in TUI Travel PLC.
In addition, cash and cash equivalents rose by €31.9m due to changes in exchange rates.

43
Segment Indicators
Turnover by divisions and sectors for the period from 1 October 2009 to 30 June 2010
Q3 2009/10 9M 2009/10
€ million External Group Total External Group Total
Tourism 4,019.2 1.9 4,021.1 9,808.5 12.0 9,820.5 TUI Travel 3,890.3 8.5 3,898.8 9,409.5 19.8 9,429.3 TUI Hotels & Resorts 97.3 102.9 200.2 266.7 290.2 556.9 Cruises 31.6 – 31.6 132.3 – 132.3Consolidation – - 109.5 - 109.5 – - 298.0 - 298.0All other segments 15.8 43.5 59.3 45.9 88.1 134.0Consolidation – - 45.4 - 45.4 – - 100.1 - 100.1Continuing Operations 4,035.0 – 4,035.0 9,854.4 – 9,854.4Discontinued Operation – – – – – –
Turnover by divisions and sectors for the period from 1 October 2008 to 30 June 2009
Q3 2008/09 9M 2008/09
€ million External Group Total External Group Total
Tourism 4,155.4 0.9 4,156.3 10,648.5 23.5 10,672.0 TUI Travel 4,004.5 6.9 4,011.4 10,238.2 29.6 10,267.8 TUI Hotels & Resorts 106.3 103.0 209.3 262.6 288.3 550.9 Cruises 44.6 0.8 45.4 147.7 2.7 150.4Consolidation – - 109.8 - 109.8 – - 297.1 - 297.1All other segments 16.9 39.9 56.8 71.0 130.5 201.5Consolidation – - 40.8 - 40.8 – - 154.0 - 154.0Continuing Operations 4,172.3 0.0 4,172.3 10,719.5 – 10,729.5
Discontinued Operation – – – 2,705.2 – 2,705.2
Earnings before interest, taxes and impairments of goodwill by divisions and sectors (EBITA)
€ millionQ3 2009/10 Q3 2008/09
revised9M 2009/10 9M 2008/09
revised
Tourism - 50.3 60.3 - 483.9 - 361.6 TUI Travel - 66.2 51.8 - 498.6 - 387.2 TUI Hotels & Resorts 14.9 12.0 17.8 33.6 Cruises 1.0 - 3.5 - 3.1 - 8.0All other segments 17.8 - 11.7 - 2.5 - 74.8Continuing Operations - 32.5 48.6 - 486.4 - 436.4Discontinued Operation – - 8.1 – 1,002.6Total - 32.5 40.5 - 486.4 566.2
Underlying earnings before interest, taxes and impairments of goodwill by divisions and sectors (Underlying EBITA)
€ millionQ3 2009/10 Q3 2008/09
revised9M 2009/10 9M 2008/09
revised
Tourism 117.4 103.1 - 246.6 - 235.7 TUI Travel 96.9 94.6 - 275.7 - 266.6 TUI Hotels & Resorts 18.3 12.0 31.0 38.9 Cruises 2.2 - 3.5 - 1.9 - 8.0All other segments - 9.0 - 11.7 - 29.3 - 76.6Continuing Operations 108.4 91.4 - 275.9 - 312.3Discontinued Operation – – – - 230.11)
Total 108.4 91.4 - 275.9 - 542.41)
1) Including follow-up effects of IFRS 5: Discontinuation of depreciation/amortisation and the income from the measurement of share-holdings using the at equity method. In order to enhance comparability of underlying EBITA, this earnings effect was included in the adjustments for the Discontinued Operation.
Notes Interim Report 3rd Quarter 2009/10

44
Reconciliation to earnings before taxes of the TUI Group
€ millionQ3 2009/10 Q3 2008/09
revised9M 2009/10 9M 2008/09
revised
EBITA – total - 32.5 40.5 - 486.4 566.2
Result from Container Shipping measured at equity 74.5 - 54.4 65.5 - 54.4
Interest result from the measurement of loans to Container Shipping 8.2 - 371.0 31.1 - 371.0
Interest result and earnings from the valuation of interest hedges from Continuing Operations - 79.4 - 48.0 - 215.7 - 189.7
Interest result from Discontinued Operation – – – - 27.9Impairment of goodwill – – – - 31.1Earnings before taxes on income of TUI Group - 29.2 - 432.9 - 605.5 - 107.9
As against 30 September 2009, assets changed in line with the seasonality in tourism, in particular in the TUI Travel segment. The assets of the other segments remained largely unchanged.
Related Parties
Apart from the subsidiaries included in the consolidated financial statements, TUI AG, in carrying out its ordinary business activities, maintained indirect or direct relationships with related parties. All transactions with related parties were carried out at arm’s length on the basis of international comparable uncontrolled price methods in accordance with IAS 24, as before. The equity stake held by Riu Hotels S.A., listed in the notes on the consolidated financial statements as at 30 September 2009, was retained unamended at the closing date for the interim report. More detailed information on related parties is provided under ‘Other notes’ in the notes on the consolidated financial statements for 2009.

Table of Contents
Interim Report 3rd quarter 2009/10 11 August 2010Annual Press Conference 2009/10 14 December 2010Annual General Meeting 2011 9 February 2011
Imprint
TUI AGKarl-Wiechert-Allee 430625 HanoverGermany
Phone +49.511.566-00Fax +49.511.566-1901E-Mail [email protected] www.tui-group.com
The German version of this interim report is legally binding. The Company cannot be held responsible for any misunderstandings or misinterpretation arising from this translation. Both versions are available on the web: www.tui-group.com
Financial Calendar 2010
2 Economic Situation
2 General Economic Situation
2 Correction of Interim Financial Statements
3 Special Events in the Quarter Under Review
3 Consolidated Turnover and Earnings 4 Development of turnover 4 Development of earnings
6 Development of the Tourism Division 6 TUI Travel 9 TUI Hotels & Resorts 12 Cruises
14 Central Operations
15 Information on Container Shipping
17 Consolidated Earnings
20 Net Assets and Financial Position
22 Other Segment Indicators
23 Prospects
25 Corporate Governance
26 Interim Financial Statements
26 Corrected Profit and Loss Statement 27 Corrected Condensed Statement of Comprehensive Income 28 Corrected Financial Position 29 Corrected Condensed Cash Flow Statement 29 Corrected Condensed Statements of Changes in Equity
30 Notes
30 Correction of Interim Financial Statements 31 Accounting Principles 32 Group of Consolidated Companies 35 Discontinued Operation 37 Notes on the Consolidated Profit
and Loss Statement 39 Notes on the Consolidated Statement
of Financial Position 40 Changes in Equity 40 Contingent Liabilities 41 Other Financial Commitments 42 Notes on the Consolidates Cash Flow Statement 43 Segment Indicators 44 Related Parties
Reservation concerning future-related statementsThe present Interim Report contains various statements relating to TUI’s future development. These statements are based on assumptions and estimates. Although we are convinced that these forward-looking statements are realistic they are not guarantees of future performance since our assumptions involve certain risks and uncertainties that may cause actual results to differ materially from expected results. This may be due to market fluctuations, the development of world market prices for commodities and exchange rates or funda-mental changes in the economic environment. TUI does not intend to and does not undertake any obligation to update or revise any forward-looking statements in order to reflect events or developments after the date of this report.

TUI AGKarl-Wiechert-Allee 430625 HanoverGermany
TUI AG Financial Year 2009/10Corrected Interim Report1 October 2009 – 30 June 2010
Aktiengesellschaft