Tug Pen and Small Vessel Berths ... - East Arm Wharf EIS
40
Report Tug Pen and Small Vessel Berths Dredging Sampling and Analysis Plan 10 FEBRUARY 2014 Prepared for Darwin Port Corporation Port Administration Building Darwin Business Park Berrimah NT 0828 42214008
Transcript of Tug Pen and Small Vessel Berths ... - East Arm Wharf EIS

Report
Tug Pen and Small Vessel Berths
Dredging Sampling and Analysis Plan
10 FEBRUARY 2014
Prepared for
Darwin Port Corporation
Port Administration Building Darwin Business Park Berrimah NT 0828
42214008

Tug Pen and Small Vessel Berths SAP
Project Manager:
…………………………… Karen Telford Senior Environmental Scientist
URS Australia Pty Ltd
Level 3, 93 Mitchell Street Darwin, NT 0801 GPO Box 2005, Darwin NT 0801 Australia T: 61 8 8980 2900 F: 61 8 8941 3920
Principal-In-Charge:
…………………………… Ian Baxter Senior Principal Marine Environmental Scientist
Author:
…………………………… Karen Telford Senior Environmental Scientist
Reviewer:
…………………………… Ian Baxter Senior Principal Marine Environmental Scientist
Date: Reference: Status:
10 February 2014 42214008/TPSAP/0 Final
Document copyright of URS Australia Pty Limited.
This report is submitted on the basis that it remains commercial-in-confidence. The contents of this
report are and remain the intellectual property of URS and are not to be provided or disclosed to third
parties without the prior written consent of URS. No use of the contents, concepts, designs, drawings,
specifications, plans etc. included in this report is permitted unless and until they are the subject of a
written contract between URS Australia and the addressee of this report. URS Australia accepts no
liability of any kind for any unauthorised use of the contents of this report and URS reserves the right
to seek compensation for any such unauthorised use.
Document delivery
URS Australia provides this document in either printed format, electronic format or both. URS
considers the printed version to be binding. The electronic format is provided for the client’s
convenience and URS requests that the client ensures the integrity of this electronic information is
maintained. Storage of this electronic information should at a minimum comply with the requirements
of the Commonwealth Electronic Transactions Act (ETA) 2000.
Where an electronic only version is provided to the client, a signed hard copy of this document is held
on file by URS and a copy will be provided if requested.

Tug Pen and Small Vessel Berths SAP
42214008/TPSAP/0 i
Table of Contents
1 Introduction ............................................................................................................. 1
1.1 Background ...................................................................................................... 1
1.2 Proposed dredging .......................................................................................... 1
1.3 Proposed investigation .................................................................................... 2
1.4 Objectives ......................................................................................................... 5
1.5 SAP review and approval ................................................................................. 5
2 Environmental Setting............................................................................................ 7
2.1 Darwin Harbour ................................................................................................ 7
2.1.1 Physical characteristics .................................................................................................. 7
2.1.2 Land use and contaminant loads ................................................................................... 7
2.1.3 Distribution of contaminants .......................................................................................... 8
2.2 East Arm Wharf ................................................................................................ 8
3 Existing Data ......................................................................................................... 11
3.1 Previous investigations ................................................................................. 11
3.2 Contaminants list ........................................................................................... 12
4 Sampling Locations ............................................................................................. 15
5 Sampling Methods ................................................................................................ 17
5.1 Sterilisation procedures ................................................................................ 17
5.2 Sampling methods ......................................................................................... 17
5.3 Sample handling, preservation and transport .............................................. 17
5.4 Sample numbers ............................................................................................ 19
5.5 Laboratory analysis of samples .................................................................... 19
5.6 Field records ................................................................................................... 20
5.7 Health, safety and environment .................................................................... 20
5.8 Contingency plan ........................................................................................... 21
5.9 Data management and reporting ................................................................... 21
5.10 Sampling and Analysis Plan Report ............................................................. 21
6 References ............................................................................................................ 23
7 Limitations ............................................................................................................ 25

Tug Pen and Small Vessel Berths SAP
Table of Contents
42214008/TPSAP/0
Tables
Table 2-1 Trade through Darwin Port in 2012/2013 .......................................................................... 9
Table 3-1 Sediment Sampling Results from Selected Previous Studies in the East Arm Wharf Area ........................................................................................................................................ 11
Table 3-2 Contaminants List for Sampling in Tug Pen and Small Vessels Berths Dredging Area . 12
Table 5-1 Practical Quantification Limit (PQLs) and Analytical Methods........................................ 18
Figures
Figure 1-1 East Arm Wharf Expansion Project Components ............................................................. 3
Figure 1-2 Location of Proposed Sediment Sampling Program ......................................................... 4
Figure 4-1 Sediment Sampling Locations and GPS Coordinates .................................................... 16
Appendix
Appendix A Excerpt from Darwin East Arm Wharf Near Shore Factual Geotechnical Investigation
Report for the Northern Territory Government, May 2011, by Aurecon Australia Pty
Ltd.
Appendix B Cross reference of Sampling and Analysis Plan to NAGD Appendix B

Tug Pen and Small Vessel Berths SAP
42214008/TPSAP/0 iii
Abbreviations
Abbreviation Description
ANC Acid neutralising capacity
ANZECC Australian and New Zealand Environment Conservation Council
ASS acid sulphate soils
CBD Central Business District
CD Chart Datum
DHAC Darwin Harbour Advisory Committee
DLP (NT former) Department of Lands and Planning
DoE Commonwealth Department of the Environment (formerly DSEWPaC)
DPC Darwin Port Corporation
EAW East Arm Wharf
EIA Environmental Impact Assessment
EIS Environmental Impact Statement
EPBC Environment Protection and Biodiversity Conservation
HSEP Health, Safety and Environment Plan
ISQG – Low Interim Sediment Quality Guidelines – low
LNG liquefied natural gas
MSB Marine Supply Base
MUBF Multi User Barge Ramp Facility
NAGD National Assessment Guidelines for Dredging
NATA National Association of Testing Authorities
NT Northern Territory
NTG Northern Territory Government
PAH Polycyclic aromatic hydrocarbons
PCB Polychlorinated biphenyls
PQL Practical quantification limit
PSD Particle size distribution analyses
PSV Platform support vessel
PWC Power and Water Corporation
QA/QC Quality assurance/quality control
RPD Relative percent difference
RSD Relative standard deviation
SAP Sampling and Analysis Plan
SCr Chromium reducible sulphur
SPOCAS Suspension Peroxide Oxidation Combined Acidity and Sulfate [Suite]
TAA Total actual acidity
TBT Tributyltin
TOC Total Organic Carbon
TPH Total petroleum hydrocarbons
UCL Upper Confidence Limit
URS URS Australia Pty Ltd

Tug Pen and Small Vessel Berths SAP
Abbreviations
42214008/TPSAP/0
Units of Measurement
Abbreviation / Symbol Description
% percent
- minus
> greater than
°C degrees Celsius
x times
bq/kg Becquerel per kilogram
g gram/s
ha hectare/s
kg kilogram/s
km kilometre/s
km2 square kilometre/s
m metre/s
m3 cubic metre/s
mg milligram/s
mg/kg milligram/s per kilogram
ml millilitre/s
t tonne/s

Tug Pen and Small Vessel Berths SAP
42214008/TPSAP/0 1
1
1Introduction
1.1 Background
The Northern Territory Government (NTG) has proposed an expansion of the East Arm Wharf (EAW)
in Darwin Harbour to accommodate the requirements of existing and prospective wharf users. The
major features of the project (refer Figure 1-1) are as follows:
Developing a Marine Supply Base (MSB), primarily to service the existing and developing oil and
gas industries in the Timor Sea, Browse Basin and adjacent areas.
Constructing a Multi User Barge Facility (MUBF) including a barge ramp and hardstand area,
berthing for barges and facilities for loading and unloading.
Development of tug pen and small vessel berths to accommodate tugs, customs boats and other
smaller vessels.
Increased traffic at East Arm is necessitating a greater number of tug boats and other small vessels,
requiring the construction of a dedicated mooring facility suitable for tugs and other small craft. The
facility will be situated on the northern side of the EAW groyne and is within the restricted access area
of the EAW, owned by the Darwin Port Corporation (DPC), with land-based access to the wharf via
Berrimah Road.
The EAW Expansion Project was subject to an Environmental Impact Assessment (EIA) and an
Environmental Impact Statement (EIS) was developed to investigate the potential impacts of the
development on the surrounding marine and terrestrial environments (DLP 2011a; DLP 2011b). The
EIS was submitted to the Northern Territory (NT) Environmental Protection Agency (EPA)1 and the
Department of Environment (DoE)2 for consideration.
The project received approval under the NT Environmental Assessment Act 1982 in December 2011
and conditional approval by DoE under the Environment Protection and Biodiversity Conservation Act
1999 (EPBC Act) in March 2012 in the form of Approval EPBC 2010/5304.
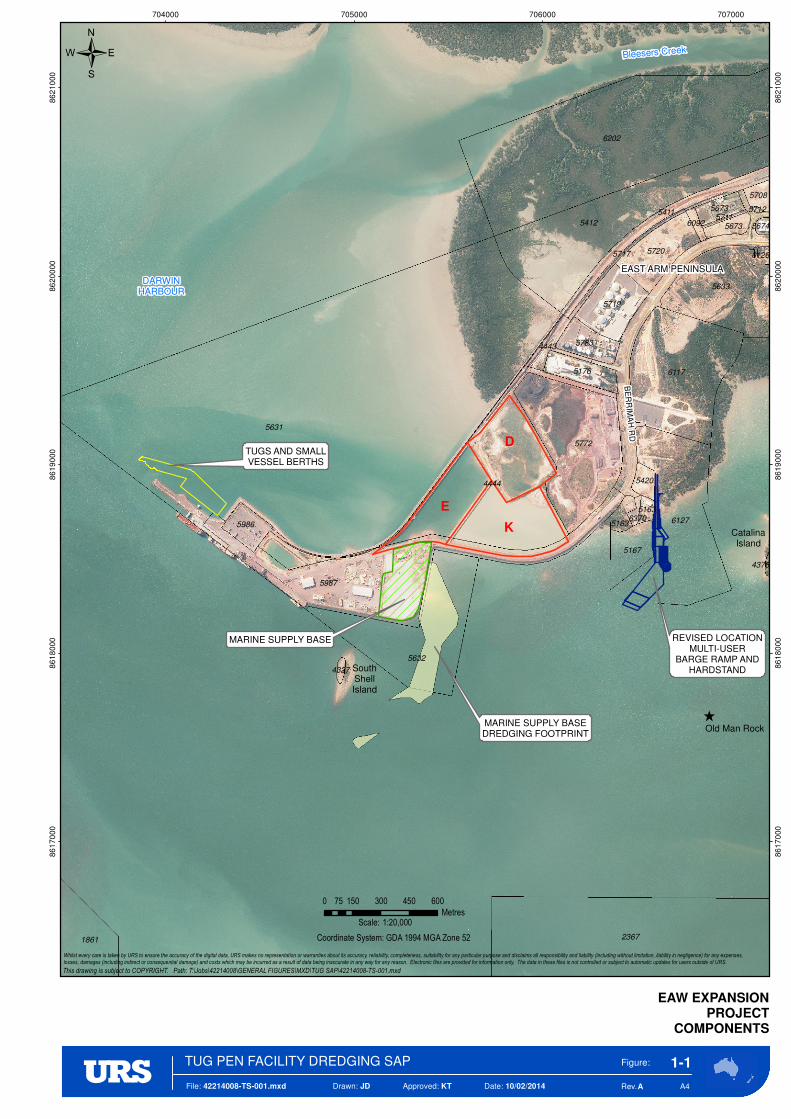
Figure 1-1 displays the East Arm Wharf Expansion components.
This sampling and analysis plan (SAP) has been developed for the tug pen and small vessel berths,
for which design and siting options are still being finalised. The potential dredge footprint used for the
determination of the sampling area in this SAP (as shown in Figure 1-2) has been developed to
ensure that all potential tug pen design and siting options along the northern face of the EAW groyne
are appropriately included in the coverage of sampling (refer Section 1.3 for further details).
The SAP addresses the requirements set out in Conditions 24 and 25 of the Commonwealth project
approval (EPBC 2010/5304) under sections 130(1) and 133 of the EPBC Act.
1.2 Proposed dredging
The bathymetry surrounding the tug pen and small vessel berth location is detailed on Figure 1-2.
The dredge volume proposed within the EIS was 181,000 cubic metres (m3); however current
calculations indicate that this is likely to be significantly reduced to between 30,000 m3 and
115,000 m3. The maximum dredge depth has been reduced from -7 m Chart Datum (CD) to -6 m CD.
Depending on the design configuration selected, the actual dredge footprint may be less than the
concept area included in the EIS.
1 Formerly the Department of Natural Resources, Environment, the Arts and Sport (NRETAS)
2 Formerly Commonwealth Department of Sustainability, Environment, Water, Population and Communities (SEWPaC)
Tug Pen and Small Vessel Berths SAP
1 Introduction
2 42214008/TPSAP/0
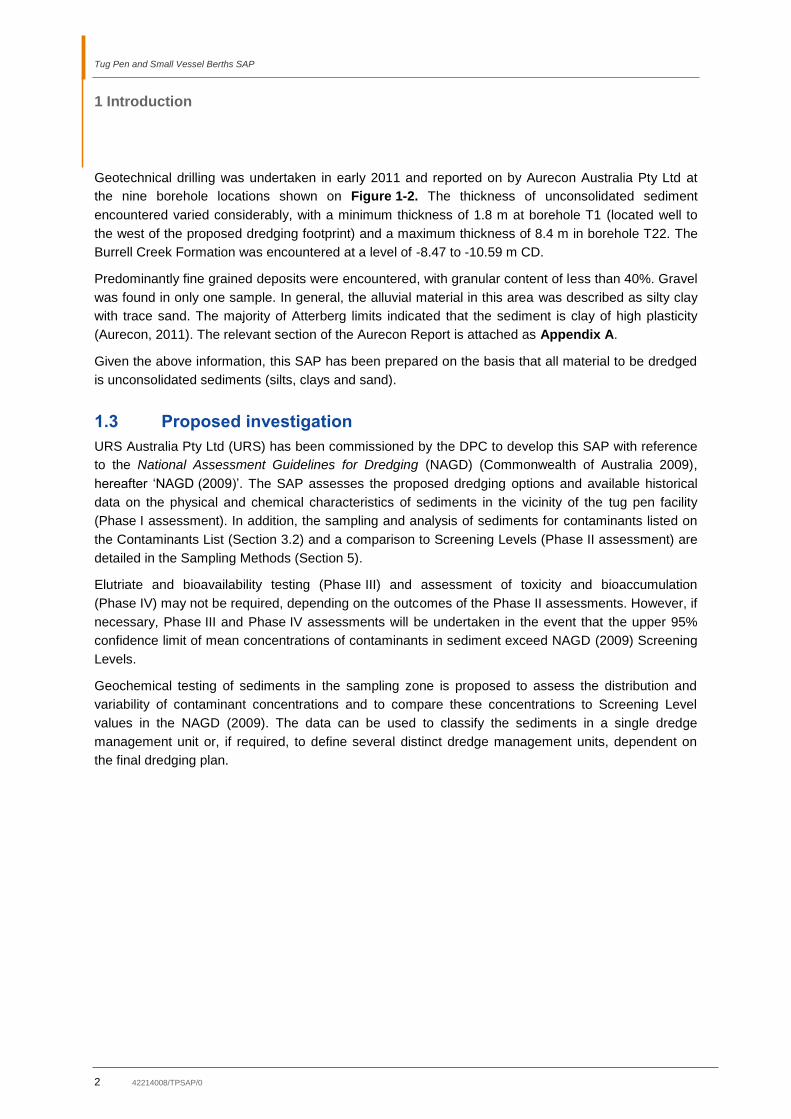
Geotechnical drilling was undertaken in early 2011 and reported on by Aurecon Australia Pty Ltd at
the nine borehole locations shown on Figure 1-2. The thickness of unconsolidated sediment
encountered varied considerably, with a minimum thickness of 1.8 m at borehole T1 (located well to
the west of the proposed dredging footprint) and a maximum thickness of 8.4 m in borehole T22. The
Burrell Creek Formation was encountered at a level of -8.47 to -10.59 m CD.
Predominantly fine grained deposits were encountered, with granular content of less than 40%. Gravel
was found in only one sample. In general, the alluvial material in this area was described as silty clay
with trace sand. The majority of Atterberg limits indicated that the sediment is clay of high plasticity
(Aurecon, 2011). The relevant section of the Aurecon Report is attached as Appendix A.
Given the above information, this SAP has been prepared on the basis that all material to be dredged
is unconsolidated sediments (silts, clays and sand).
1.3 Proposed investigation
URS Australia Pty Ltd (URS) has been commissioned by the DPC to develop this SAP with reference
to the National Assessment Guidelines for Dredging (NAGD) (Commonwealth of Australia 2009),
hereafter ‘NAGD (2009)’. The SAP assesses the proposed dredging options and available historical
data on the physical and chemical characteristics of sediments in the vicinity of the tug pen facility
(Phase I assessment). In addition, the sampling and analysis of sediments for contaminants listed on
the Contaminants List (Section 3.2) and a comparison to Screening Levels (Phase II assessment) are
detailed in the Sampling Methods (Section 5).
Elutriate and bioavailability testing (Phase III) and assessment of toxicity and bioaccumulation
(Phase IV) may not be required, depending on the outcomes of the Phase II assessments. However, if
necessary, Phase III and Phase IV assessments will be undertaken in the event that the upper 95%
confidence limit of mean concentrations of contaminants in sediment exceed NAGD (2009) Screening
Levels.
Geochemical testing of sediments in the sampling zone is proposed to assess the distribution and
variability of contaminant concentrations and to compare these concentrations to Screening Level
values in the NAGD (2009). The data can be used to classify the sediments in a single dredge
management unit or, if required, to define several distinct dredge management units, dependent on
the final dredging plan.
^
5631
6202
2367
4444
5987
5412
6117
6127
5772
5632
5633
1861
5720
5719
5167
5986
5176
5783
5673
5673
5420
5163
5708
5411
4443
5717
5163
6092
6126
5674
6370
4327
5711
4378
5712
BE
RR
IMA
H R
D
704000 705000 706000 707000
86
17
000
86
17
000
86
18
000
86
18
000
86
19
000
86
19
000
86
20
000
86
20
000
86
21
000
86
21
000
Figure:
A4
1-1
EAW EXPANSION
PROJECT
COMPONENTS
Whilst every care is taken by URS to ensure the accuracy of the digital data, URS makes no representation or warranties about its accuracy, reliability, completeness, suitability for any particular purpose and disclaims all responsibility and liability (including without limitation, liability in negligence) for any expenses,losses, damages (including indirect or consequential damage) and costs which may be incurred as a result of data being inaccurate in any way for any reason. Electronic files are provided for information only. The data in these files is not controlled or subject to automatic updates for users outside of URS.
This drawing is subject to COPYRIGHT. Path: T:\Jobs\42214008\GENERAL FIGURES\MXD\TUG SAP\42214008-TS-001.mxd
Rev.A
/
0 150 300 450 60075
Metres
Coordinate System: GDA 1994 MGA Zone 52
File: 42214008-TS-001.mxd Drawn: JD Approved: KT Date: 10/02/2014
TUGS AND SMALLVESSEL BERTHS
DARWINHARBOUR
EAST ARM PENINSULA
MARINE SUPPLY BASEDREDGING FOOTPRINT
REVISED LOCATIONMULTI-USER
BARGE RAMP ANDHARDSTAND
Bleesers Creek
MARINE SUPPLY BASE
Old Man Rock
CatalinaIsland
SouthShellIsland
1:20,000Scale:
TUG PEN FACILITY DREDGING SAP
D
K
E

!
!
!
!
!
!
!
!
!
T7
T6
T4
T3
T1
T25
T22
T14
T13
0
-1
-6
-7
-5
-11
1-9
-8
-12
-3
-4-13
-2
-10
-14
-10.
5
-11.5
0.5
-5.5
-6.5
-9.5
-7.5
-0.5
-12.5
-13.5
-3.5
-2.5
-4.5
2
-8.5
-1.5
-15
-14.5
3
1.5
-16
2.5
-17
-15.5
-18
-19
3.5
-16
.5
-17.5
-18
.5
-20
-13
-14.5
1
-3
-7
-4
-0.5
-6
1.5
-6.5
-14.5
-13.5
-6
1
-3
-14
-7.5
-12
-3.5
- 3. 5
-2.5
-11
-2
-7.5
-4.5
-5. 5
-16.5
-3
0
-5
1
-12.5
-13.5
-3
-2.5
-8 0.5
-7
-0.5
1
-13.5
-3.5
-6.5
-3.5
-6.5
-9
1
-13.5
1
-14
-1.5
-4
2.5
-12
-2.5
-8
-9
-12
0.5
-12
-6
-13
1.5
-14
-9.5
-1.5
-1
-6.5
-8.5
0
-1
-3.5
-8.5
-10
.5
-10.5
-12
-3
-8
-2
-6.5
-9.5
3
0.5
-2
-14
-3
-14
-8.5
0.5
2
-12
-2.5
-13
-12
-7.5
1.5
2
-7.5
1
0.5
-9
-16.5
-6
-8.5
-10
0.5
0.5
-12.5
-12
-14
-2
-3
-9
-6
-1
-1.5
-3
-11.5
-14.5
-5
-17
1.5
2.5
-0. 5
-7
-12.5
-2.5
-2
-14
-8
-4.5
-4.5
-13
-4
-5
-3
-4
-8
1.5
0
-12
1
2
-4
-12.5
-10
-2
-4.5
-7
0.5
-12
-4
703750 704000 704250 704500 704750
86
17
750
86
17
750
86
18
000
86
18
000
86
18
250
86
18
250
86
18
500
86
18
500
86
18
750
86
18
750
86
19
000
86
19
000
86
19
250
86
19
250
Figure:
A4
1-2
LOCATION OF PROPOSED
SEDIMENT SAMPLING PROGRAM
Whilst every care is taken by URS to ensure the accuracy of the digital data, URS makes no representation or warranties about its accuracy, reliability, completeness, suitability for any particular purpose and disclaims all responsibility and liability (including without limitation, liability in negligence) for any expenses,losses, damages (including indirect or consequential damage) and costs which may be incurred as a result of data being inaccurate in any way for any reason. Electronic files are provided for information only. The data in these files is not controlled or subject to automatic updates for users outside of URS.
This drawing is subject to COPYRIGHT. Path: T:\Jobs\42214008\GENERAL FIGURES\MXD\TUG SAP\42214008-TS-002.mxd
Rev.A
/
0 50 100 150 20025
Metres
Coordinate System: GDA 1994 MGA Zone 52
LEGEND
! Boreholes (Aurecon 2011)
Proposed Sampling Zone
Bathymetry mLAT (iXsurvey)
File: 42214008-TS-002.mxd Drawn: JD Approved: JVR Date: 10/02/2014
EAST ARM WHARF
TUG PEN FACILITY DREDGING SAP
SOUTHSHELLISLAND

Tug Pen and Small Vessel Berths SAP
1 Introduction
42214008/TPSAP/0 5
1.4 Objectives
The purpose of this SAP is to describe the location and number of seafloor sediment samples, the
sampling methodology, analytical and sample transport procedures to assess the physical and
chemical characteristics of the sediments proposed to be dredged and to assess their suitability for
disposal.
Specifically, investigations to support the proposed dredging program at EAW have the following
objectives:
Complete a field sampling and analytical program of sediment proposed for dredging in accordance
with guidance provided in the NAGD (2009).
Determine whether the quality and quantity of data gathered are sufficient to adequately
characterise the contamination status of the sediments to assess disposal and re-use options.
Data quality objectives for the program are:
To collect and retain, in accordance with the SAP procedures, the required number of cores and
samples to assess contamination levels in accordance with the NAGD (2009).
To collect and retain, in accordance with the SAP procedures, the required number of quality
assurance/quality control (QA/QC) samples to assess data quality in accordance with the
NAGD (2009).
For analysis of the samples to be undertaken at a National Association of Testing Authorities
(NATA) accredited laboratory in accordance with laboratory QA/QC procedures and NAGD (2009)
analysis procedures.
For the SAP report to undergo independent detail checks and technical reviews before the results
are provided to DoE and utilised in the Water Quality Management Plan for the project, as detailed
in Conditions 26 and 28 of the Commonwealth project approval (EPBC 2010/5304).
1.5 SAP review and approval
This SAP has been reviewed and approved for release to the client by Ian Baxter of URS, who is a
member of the Consultancy Panel for DoE, for whom reviews are undertaken of documents submitted
in support of applications for the disposal of dredged material (under the Environment Protection [Sea
Dumping] Act 1981).
For ease of review of this SAP by the Commonwealth DoE, Appendix B of the SAP details in which
sections of the SAP that the relevant guidance provided in Appendix B of the NAGD (2009) has been
addressed.

Tug Pen and Small Vessel Berths SAP
1 Introduction
6 42214008/TPSAP/0
This page left blank intentionally

Tug Pen and Small Vessel Berths SAP
42214008/TPSAP/0 7
2
2Environmental Setting
2.1 Darwin Harbour
2.1.1 Physical characteristics
Darwin Harbour is a large ria system, or drowned river valley, formed by post-glacial marine flooding
of a dissected plateau. The harbour was formed by rising sea levels about 6000-8000 years ago and
has a surface area variously described as between 500 and 1,000 square kilometres (km2), depending
upon the boundaries applied (e.g. Padovan 2001, Darwin Harbour Advisory Committee [DHAC] 2003;
INPEX 2010; DLP 2011). In its southern and south-eastern portions, the harbour has three main
components: East, West and Middle Arms which merge into a single unit, along with the smaller
Woods Inlet, before opening into Beagle Gulf to the north.
The harbour extends for more than 30 kilometres (km) along this north-north-east – south-south-
westerly oriented axis. The Elizabeth River flows into East Arm, while the Darwin and Blackmore rivers
flow into Middle Arm. During the dry season (May to September) the estuary is typically well mixed,
but freshwater inflow from rivers during the wet season can lead to stratification of salinity in the water
column in the arms of the harbour (Drewry et al. 2010).
The Darwin Harbour catchment is some 2,417 km2, which is relatively small when compared to its
estuary area of some 810 km2 (DHAC 2003; Wolanski et al. 2005). The relatively low catchment to
estuary ratio (when compared to other major Australian estuaries) was considered by DHAC (2003) to
indicate that there is less potential for disturbance from runoff to the estuary than in estuaries with
proportionally larger catchments.
2.1.2 Land use and contaminant loads
DHAC (2003), based on the data of Owen and Meakin (2003), determined that there was a wide
diversity of land uses within the Darwin Harbour region, though almost 70% of the region was
occupied by non-polluting uses (e.g. remnant native vegetation, surface water supply, conservation
areas).
The Elizabeth River has the second largest catchment of the rivers entering Darwin Harbour [the
largest is the Blackmore River that enters Middle Arm (Padovan 2001)]. In the late 1990s, rural land
use accounted for approximately 75% of the catchment area. This is likely to have increased over the
past decade, being primarily comprised of rural residential areas and small-scale horticultural
developments in the upper reaches of the river. Undeveloped land (predominantly mangrove
communities) fringes the river over a distance of some 25 km between the rural land use areas and
East Arm, has the potential to act as a buffer to reduce the amounts of contaminants reaching East
Arm from sources in the upper catchment. Padovan (2001) calculated the mean annual contaminant
loads contributed to the harbour from the Elizabeth River catchment in the mid-1990s to be
69 tonnes (t) of nitrogen, 3.5 t of phosphorous, 70 kilograms (kg) of arsenic, 14 kg of cadmium, 156 kg
of chromium, 373 kg of copper, 132 kg of lead, 138 kg of nickel and 1,638 kg of zinc.
Approximately 6 km upstream of EAW, the Palmerston Wastewater Treatment Plant discharges
treated effluent into Myrmidon Creek, which enters the lower reaches of the Elizabeth River where it
enters East Arm. The mass loadings of the release from the Plant in 2005/06 were 40 t of ammonia,
69 t of Kjeldahl nitrogen and 18 t of phosphorus (Power and Water Corporation [PWC] 2006).
Some 5 km upstream of the tug pen and small vessel berths dredging area is Hudson Creek, which
supports livestock export facilities and other light industrial uses. The Hudson Creek catchment also

Tug Pen and Small Vessel Berths SAP
2 Environmental Setting
8 42214008/TPSAP/0
includes rural and urban land. All of these land uses represent potential sources of contaminants that
may accumulate in the tug pen and small vessel berths dredging area. In the mid-1990s, the mean
annual contaminant loads contributed to the Harbour from the Hudson Creek catchment were
calculated by Padovan (2001) to be 15 t of nitrogen, 3 t of phosphorous, 40 kg of arsenic, 6 kg of
cadmium, 220 kg of chromium, 189 kg of copper, 327 kg of lead, 43 kg of nickel and 1,860 kg of zinc.
The Bleesers Creek catchment, directly to the north-east of the tug pen dredging area, contains a
large motorsport complex, sewage treatment ponds and the Darwin Train Station as well as the
industrial lots located along Berrimah Road, all of which represent potential sources of contaminants
that may accumulate in the tug pen dredging area. The Charles Darwin National Park is located
directly to the north of the tug pen dredging area and is considered an unlikely source of
contamination due to its limited infrastructure.
Based on a number of previous studies (Section 3.1), arsenic is present in the region at
concentrations potentially above screening levels as a result of the local geology, however
bioavailable levels are low (refer Table 3-1).
2.1.3 Distribution of contaminants
Environmental factors that may potentially affect the distribution of contaminants within Darwin
Harbour, and hence could influence the concentrations of contaminants in the sediments of the tug
pen and small vessel berths dredging area, include:
Strong tidal currents that readily mobilise seafloor sediments on flood and ebb tides, especially
during spring tide periods.
Eddies in water flows that enhance the settlement of sediments from the water column in certain
areas.
Wind-driven water circulation that can redistribute large amounts of seafloor sediments, particularly
during tropical storms and cyclones.
Each of these factors would primarily influence the distribution of fine sediment fractions, to which
metals are typically bound at higher densities (Batley 1995).
2.2 East Arm Wharf
EAW is located approximately 4.5 km south east of the Darwin Central Business District (CBD).
Opened in 2000, the existing wharf has a continuous 754 m berth face located parallel to the main
shipping channel, and incorporates a dry bulk materials handling facility featuring a ship loader
designed to load Panamax class vessels and is currently used to export iron ore, manganese, and
copper concentrate. EAW occupies a land area of approximately 18 hectares (ha) of sealed hard
stand surface with 4,000 m² of undercover cargo handling facility, and a further 18 ha of bunded area
for future reclamation. A single rail spur from the Australasia Railway runs over a 16 m wide railway
causeway, linking to three rail lines to the wharf (including a 4 ha intermodal container terminal), with
road access provided over the causeway from Berrimah Road (NTG 2011).
The primary role of EAW is to facilitate the movement of goods via rail, road and shipping to
international markets. EAW currently services vessels handling general cargoes, live cattle exports,
dry bulk imports, containerised / break bulk and specialised heavy lift cargoes, plus offshore rig tender
service vessels (AECOM 2009). It is utilised by oil and gas, mining, agriculture, horticulture, bulk
minerals and construction industries (DPC 2010).

Tug Pen and Small Vessel Berths SAP
2 Environmental Setting
42214008/TPSAP/0 9
The types and tonnages of cargo imported and exported from Darwin Port in 2012/2013 are detailed in
Table 2-1 (DPC 2013). Of note with reference to potential impacts on sediment quality are ores,
minerals, chemicals and petroleum. These have historically influenced the sediment quality in the
EAW area, most notably after copper concentrate spills occurred while loading in 2010 (AIMS 2010).
Table 2-1 Trade through Darwin Port in 2012/2013
Commodity Export tonnage Import tonnage
Beverages 22 4,921
Building supplies 238 47,731
Chemicals 1,780 200,496
Iron ore and concentrates 1,668,432 0
Manganese 888,767 0
Other dry bulk 3,163 232,298
Food Products 18 332
Glass 0 376
Livestock 118,712 0
Livestock feed 13,399 17
Machinery and equipment 4,967 18,072
Metal Products 7,173 49,208
Metal Waste 12,017 28
Motor Vehicles and Parts 403 15,804
Other 45,220 120,960
Paper 575 1,469
Petroleum 35,508 806,483
Timber 14 404
Grand Total 2,800,408 1,498,600

Tug Pen and Small Vessel Berths SAP
2 Environmental Setting
10 42214008/TPSAP/0
This page left blank intentionally

Tug Pen and Small Vessel Berths SAP
42214008/TPSAP/0 11
3
3Existing Data
3.1 Previous investigations
The NAGD (2009) state that existing chemical or toxicity data for the sediments of the area to be
dredged have a maximum currency of five years, where there is no reason to believe that the
contamination status has changed significantly, after which new data are required. The EAW area was
subject to copper concentrate spills in 2010 (AIMS 2010), so in accordance with the guidelines, all
data from 2010 and earlier are to be used for historical comparison only and cannot be used to
characterise the current contaminant status of the sediments to be dredged.
Previous investigations that were conducted in the vicinity of EAW include the following:
URS, 2012, East Arm Wharf Dredging Sampling and Analysis Plan and report, prepared for NTG
Department of Lands and Planning (DLP) in April 2012.
AIMS 2010, Investigation of Copper Concentrate Loadout at East Arm Port: Water and Sediment
Quality, prepared for NTG Department of Natural Resources, Environment, the Arts and Sports,
Darwin, Northern Territory.
URS, 2009. Ichthys Gas Field Development Project: Nearshore Marine Water Quality and
Sediment Study. Prepared for INPEX Browse, Ltd, 11 August 2009.
Fortune, J, 2006. The grainsize and heavy metal content of sediment in Darwin Harbour. Report
No. 14/2006D of the Aquatic Health Unit, Environmental Protection Agency, Department of Natural
Resources, Environment and the Arts, Darwin, Northern Territory.
The findings of the previous investigations will assist in consideration of the potential sources of
contaminants to the EAW area. Selected findings (sediment quality exceedances only) from these
studies are summarised in Table 3-1.
Table 3-1 Sediment Sampling Results from Selected Previous Studies in the East Arm Wharf Area
Study Analyte Screening
Level (mg/kg)
95% UCL Comment
URS 2012 Arsenic 20 42.2 Bioavailability = low
AIMS 2010 Arsenic 20 Not calculated Screening Level exceeded at some
sites near EAW
Copper 270 Not calculated Exceeded at some sites near EAW.
One site exceeded ANZECC
bioavailability criteria.
URS 2009 Arsenic 20 37.2 Bioavailability = low
Chromium 80 45.1 Screening Level exceeded at some
sites near EAW Mercury 0.15 0.018
Nickel 21 5.9
Fortune 2006 Arsenic 20 Not calculated Screening Level exceeded at two
sites near EAW

Tug Pen and Small Vessel Berths SAP
3 Existing Data
12 42214008/TPSAP/0
These studies found that although the NAGD (2009) Screening Levels were exceeded at some
individual sites, the only 95% Upper Confidence Limit (UCL) level to exceed a Screening Level was
arsenic in the URS (2009) study (in which elutriate testing showed that arsenic was present in a form
with only low bioavailability) . Other analytes investigated in these studies did not exceed Screening
Levels at any site. The URS (2012) study results showed a 95% UCL level for arsenic above the
Screening Level but the distribution of arsenic within the sediment profile suggests the elevated levels
are still attributable to the local geology.
3.2 Contaminants list
Taking into consideration port activities, potential catchment inputs and data from previous sediment
sampling programs in East Arm, Table 3-2 presents a list of contaminants which it is considered could
be present at elevated levels in the sediments within the tug pen and small vessel berths dredging
area. In addition to the listed contaminants, samples will also be tested for acid sulfate soils potential,
as required by the conditions of the Commonwealth project approval.
Table 3-2 Contaminants List for Sampling in Tug Pen and Small Vessels Berths Dredging Area
Analytical Parameter Rationale for Analysis
Particle Size Distribution Analysis (PSD) Standard sediment analysis tool.
Total Organic Carbon (TOC) For normalisation of organics
Antimony Potentially found at ore export loading facilities
Aluminium Useful for normalising elements
Arsenic Known to be naturally high background levels
Cadmium Common pollutant in port areas
Chromium Elevated concentrations detected by URS (2009)
Copper AIMS (2010) indicated the presence of elevated
concentrations in port sediments
Iron Exported from EAW
Lead Common pollutant in port areas
Manganese Exported from EAW
Mercury Elevated concentrations detected by URS (2009)
Nickel Elevated concentrations detected by URS (2009)
Silver Common pollutant in port areas
Zinc Common pollutant in port areas
Total polycyclic aromatic hydrocarbons (PAHs) Common pollutant in port areas
Total petroleum hydrocarbons (TPHs) Common pollutant in port areas
Total nitrogen Bleesers Creek and Palmerston wastewater treatment

Tug Pen and Small Vessel Berths SAP
3 Existing Data
42214008/TPSAP/0 13
Analytical Parameter Rationale for Analysis
outfalls located upstream
Total phosphorus Phosphate rock exported from EAW
Tributyltin (TBT) No longer used as an antifoulant, but still potentially present
in port environments.
Radionuclides Uranium and thorium exported from EAW
It should be noted that not all of the “typical sediment contaminants” listed in Table 1 of the
NAGD (2009) appear in Table 3-2 of this SAP. Contaminants for which there are considered to be no
significant sources of input to the tug pen and small vessel berths dredging area (e.g. from imports or
exports, or from the surrounding catchment) have been excluded from Table 3-2. For example, while
organochlorine pesticides (mainly dieldrin) were detected in some samples of Darwin stormwater in
the mid-1990s by Padovan (2001), these pesticides have been progressively phased out over the
subsequent decades. Therefore it is considered that the potential for organochlorine pesticides to be
present in the tug pen and small vessel berths dredging area sediments is sufficiently low to justify
their exclusion from the contaminants list.

Tug Pen and Small Vessel Berths SAP
3 Existing Data
14 42214008/TPSAP/0
This page left blank intentionally

Tug Pen and Small Vessel Berths SAP
42214008/TPSAP/0 15
4
4Sampling Locations
The required number of sample locations, calculated in accordance with Appendix D of the
NAGD (2009), is 19. This was based on the maximum estimated volume of sediment to be dredged
(115,000 m3) derived by the EAW Expansion Project design contractor.
For the purpose of calculating the number of sampling locations:
All of the material to be dredged is assumed to be unconsolidated. The geotechnical survey
information (Appendix A) indicates that the depth of unconsolidated sediments is likely to extend
below the maximum dredging depth across most of the dredging footprint.
All of the material to be dredged is classified (in accordance with the NAGD [2009]) as ‘potentially
contaminated’. As there are no data upon which to classify the sediments as ‘probably clean’ or
‘probably contaminated’ there are no grounds upon which the number of sampling locations can be
halved.
The locations were selected by overlaying a 20.7 m x 20.7 m grid over the dredging area (to provide a
total of 121 cells, more than the 95 cells [5 x 19 sample locations] needed to meet the requirements of
Appendix D of the NAGD [2009]), then generating random numbers to determine the cells within which
samples are to be collected. The sampling locations and coordinates (in geodetic datum GDA94) are
shown in Figure 4-1. An additional 21 locations and coordinates are also shown; these will be
sampled as required in the event that any of the initial 19 locations do not have a surface layer of
unconsolidated sediments.

!
!
!
!!
!
!
!
!
!
!
!
!!
!
!
!
!
!
!
!
!
!
!
!!
!
!
!
!
!
!
!
!
!
!
!
!
!
!9
8
7
6
5 4
3
2
1
40
39
38
37
36
35
34
33
32
31
30
29
28
27
26 25
24
23
22
21
20
19
18
17
16
15
1413
12
11
10
704000 704250
86
18
750
86
18
750
86
19
000
86
19
000
86
19
250
86
19
250
Figure:
A4
4-1
SEDIMENT SAMPLING LOCATIONS
AND GPS COORDINATES
Whilst every care is taken by URS to ensure the accuracy of the digital data, URS makes no representation or warranties about its accuracy, reliability, completeness, suitability for any particular purpose and disclaims all responsibility and liability (including without limitation, liability in negligence) for any expenses,losses, damages (including indirect or consequential damage) and costs which may be incurred as a result of data being inaccurate in any way for any reason. Electronic files are provided for information only. The data in these files is not controlled or subject to automatic updates for users outside of URS.
This drawing is subject to COPYRIGHT. Path: T:\Jobs\42214008\GENERAL FIGURES\MXD\TUG SAP\42214008-TS-003.mxd
Rev.A
/
0 25 50 75 10012.5
Metres
Coordinate System: GDA 1994 MGA Zone 52
LEGEND
! Primary Sample
! Backup Sample
Proposed Sampling Zone
Sampling Grid
File: 42214008-TS-003.mxd Drawn: JD Approved: KT Date: 10/02/2014
EAST ARM WHARF
TUG PEN FACILITY DREDGING SAP
Label Easting Northing
1 704096 8618935
2 704003 8618985
3 703955 8619024
4 704061 8618990
5 704032 8618988
6 703984 8619027
7 704006 8618956
8 704086 8618890
9 704109 8618951
10 704160 8618882
11 704211 8618814
12 704205 8618872
13 704198 8618798
14 704301 8618793
15 704246 8618758
16 704272 8618790
17 704208 8618843
18 704250 8618862
19 704343 8618812
20 704041 8618900
21 704170 8618927
22 704263 8618878
23 704035 8618958
24 704000 8619014
25 704112 8618922
26 704083 8618919
27 703971 8619011
28 704275 8618761
29 704266 8618849
30 704186 8618914
31 704150 8618837
32 704138 8618954
33 704327 8618825
34 704074 8619006
35 704311 8618838
36 704304 8618764
37 704106 8618980
38 704278 8618732
39 704253 8618833
40 704093 8618964

Tug Pen and Small Vessel Berths SAP
42214008/TPSAP/0 17
5
5Sampling Methods
5.1 Sterilisation procedures
Prior to commencement of sampling operations, an area on the vessel will be designated for sample
handling. Potential contaminant sources in the vicinity of this area (e.g. galvanised or oily surfaces)
are to be covered to reduce the potential for sample contamination.
Field personnel will wear sterile disposable nitrile gloves during sampling to minimise the potential for
sample contamination by residues (e.g. hydrocarbons, sunscreen, etc.). Gloves will be changed
between samples. Sterile plastic and stainless steel spatulas will be used where direct contact with the
sediment sample is necessary (e.g. during splitting of the cores): stainless steel will be used for
samples to be analysed for organic compounds, and plastic for samples to be analysed for metals.
Smoking is not permitted in the vicinity of, or upwind from, the designated sample processing area.
Sample processing will be undertaken upwind of generators and any other engines that are unable to
be turned off for safety reasons.
The polycarbonate core tubing to be used for sample collection (see Section 5.2) will be cleaned with
dilute acid, then rinsed with deionised water and a suitable solvent before the commencement of the
sampling program. Sampling equipment will be decontaminated between sites by thorough cleaning in
seawater. If clayey sediments are encountered, then a Decon solution will be used to clean the cores,
with the cores rinsed in seawater prior to use at the next site.
5.2 Sampling methods
All sampling will be undertaken using a vibrocore. This will be installed on a vessel fitted with
appropriate lifting equipment, power generation, deck space, shallow draft, adequate station-holding
capability and other specifications to be finalised by the coring equipment supplier. The equipment will
be manned by suitably qualified and experienced personnel, and the field operations supplemented by
geotechnical staff from the contractor. The cores, with polycarbonate liners, are driven into the seabed
from the vessel, then recovered to the vessel.
Aboard the support vessel, the sediment will be extruded from the core and photographed. The depth
and visual descriptions of the sediment will be recorded, including colour, predominant grain size,
presence of shell fragments and depth of any distinct horizons (changes in colour or grain size).
Composite samples will be taken from every 0.5 m horizon, i.e. 0–0.5 m; 0.5–1.0 m, etc. Any
intermediate horizons of soft sediments >0.5 m in thickness will be sampled separately.
5.3 Sample handling, preservation and transport
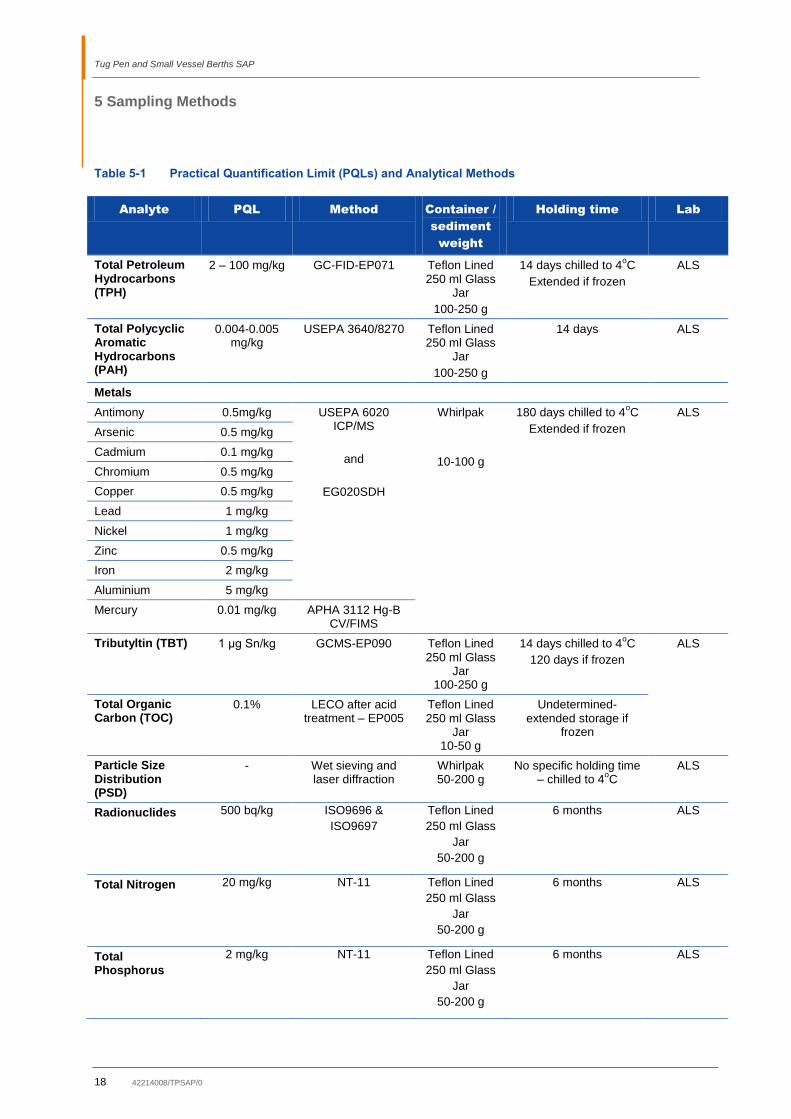
Table 5-1 details the containers, holding times and possible analysing laboratories for each analyte.
Sediment samples will be placed in 250 ml laboratory supplied glass jars (for hydrocarbons and TBT
analyses) and plastic whirlpak bags (for metals, PSD and acid sulfate soils analyses). The use of
plastic, rather than glass, storage containers is recommended for metals, as metals tend to adsorb
onto glass surfaces, potentially leading to underestimates of metal concentrations. An additional
whirlpak of sediment will be retained at each site for archiving purposes.
All samples (whirlpaks and jars) will be placed inside labelled plastic self-seal bags for protection,
stored on ice or refrigerated in the field and frozen at the earliest opportunity. Samples will be
delivered, with accompanying Chain of Custody forms, to Australian Laboratory Services (ALS) in
Darwin. ALS will forward the samples, under appropriate Chain of Custody procedures and
preservation conditions, to their NATA-accredited laboratories in other capital cities.
Tug Pen and Small Vessel Berths SAP
5 Sampling Methods
18 42214008/TPSAP/0
Table 5-1 Practical Quantification Limit (PQLs) and Analytical Methods
Analyte PQL Method Container /
sediment
weight
Holding time Lab
Total Petroleum Hydrocarbons (TPH)
2 – 100 mg/kg GC-FID-EP071 Teflon Lined 250 ml Glass
Jar
100-250 g
14 days chilled to 4oC
Extended if frozen
ALS
Total Polycyclic Aromatic Hydrocarbons (PAH)
0.004-0.005 mg/kg
USEPA 3640/8270 Teflon Lined 250 ml Glass
Jar
100-250 g
14 days ALS
Metals
Antimony 0.5mg/kg USEPA 6020 ICP/MS
and
EG020SDH
Whirlpak
10-100 g
180 days chilled to 4oC
Extended if frozen
ALS
Arsenic 0.5 mg/kg
Cadmium 0.1 mg/kg
Chromium 0.5 mg/kg
Copper 0.5 mg/kg
Lead 1 mg/kg
Nickel 1 mg/kg
Zinc 0.5 mg/kg
Iron 2 mg/kg
Aluminium 5 mg/kg
Mercury 0.01 mg/kg APHA 3112 Hg-B CV/FIMS
Tributyltin (TBT) 1 μg Sn/kg GCMS-EP090 Teflon Lined 250 ml Glass
Jar 100-250 g
14 days chilled to 4oC
120 days if frozen
ALS
Total Organic Carbon (TOC)
0.1% LECO after acid treatment – EP005
Teflon Lined 250 ml Glass
Jar 10-50 g
Undetermined- extended storage if
frozen
Particle Size Distribution (PSD)
- Wet sieving and laser diffraction
Whirlpak 50-200 g
No specific holding time – chilled to 4
oC
ALS
Radionuclides 500 bq/kg ISO9696 &
ISO9697
Teflon Lined
250 ml Glass
Jar
50-200 g
6 months ALS
Total Nitrogen 20 mg/kg NT-11 Teflon Lined
250 ml Glass
Jar
50-200 g
6 months ALS
Total Phosphorus
2 mg/kg NT-11 Teflon Lined
250 ml Glass
Jar
50-200 g
6 months ALS
Tug Pen and Small Vessel Berths SAP
5 Sampling Methods
42214008/TPSAP/0 19
Analyte PQL Method Container /
sediment
weight
Holding time Lab
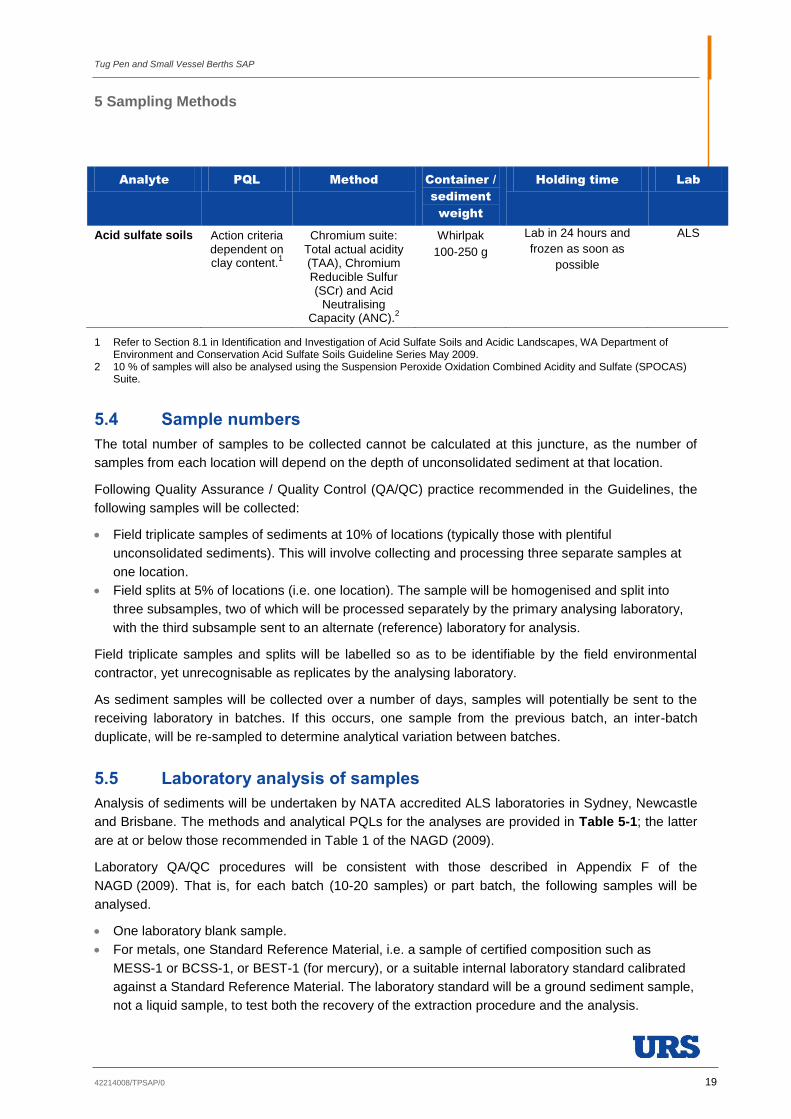
Acid sulfate soils Action criteria dependent on clay content.
1
Chromium suite: Total actual acidity (TAA), Chromium Reducible Sulfur (SCr) and Acid
Neutralising Capacity (ANC).
2
Whirlpak
100-250 g
Lab in 24 hours and
frozen as soon as
possible
ALS
1 Refer to Section 8.1 in Identification and Investigation of Acid Sulfate Soils and Acidic Landscapes, WA Department of Environment and Conservation Acid Sulfate Soils Guideline Series May 2009.
2 10 % of samples will also be analysed using the Suspension Peroxide Oxidation Combined Acidity and Sulfate (SPOCAS) Suite.
5.4 Sample numbers
The total number of samples to be collected cannot be calculated at this juncture, as the number of
samples from each location will depend on the depth of unconsolidated sediment at that location.
Following Quality Assurance / Quality Control (QA/QC) practice recommended in the Guidelines, the
following samples will be collected:
Field triplicate samples of sediments at 10% of locations (typically those with plentiful
unconsolidated sediments). This will involve collecting and processing three separate samples at
one location.
Field splits at 5% of locations (i.e. one location). The sample will be homogenised and split into
three subsamples, two of which will be processed separately by the primary analysing laboratory,
with the third subsample sent to an alternate (reference) laboratory for analysis.
Field triplicate samples and splits will be labelled so as to be identifiable by the field environmental
contractor, yet unrecognisable as replicates by the analysing laboratory.
As sediment samples will be collected over a number of days, samples will potentially be sent to the
receiving laboratory in batches. If this occurs, one sample from the previous batch, an inter-batch
duplicate, will be re-sampled to determine analytical variation between batches.
5.5 Laboratory analysis of samples
Analysis of sediments will be undertaken by NATA accredited ALS laboratories in Sydney, Newcastle
and Brisbane. The methods and analytical PQLs for the analyses are provided in Table 5-1; the latter
are at or below those recommended in Table 1 of the NAGD (2009).
Laboratory QA/QC procedures will be consistent with those described in Appendix F of the
NAGD (2009). That is, for each batch (10-20 samples) or part batch, the following samples will be
analysed.
One laboratory blank sample.
For metals, one Standard Reference Material, i.e. a sample of certified composition such as
MESS-1 or BCSS-1, or BEST-1 (for mercury), or a suitable internal laboratory standard calibrated
against a Standard Reference Material. The laboratory standard will be a ground sediment sample,
not a liquid sample, to test both the recovery of the extraction procedure and the analysis.

Tug Pen and Small Vessel Berths SAP
5 Sampling Methods
20 42214008/TPSAP/0
For organics, one sample spiked with the parameters being determined (or a surrogate spike for
certain organics) at a concentration within the linear range of the method being employed. This will
determine whether the recovery rate of the analytical method is adequate or not (i.e. that all the
chemicals present in the sample are actually being found in the analysis.
One replicate sample to determine the precision of the analysis; the standard deviation and
coefficient of variation will be documented.
Recoveries of surrogate spikes will be documented and daily calibration data reviewed. The laboratory
will review the quality control data and quality assurance documentation and a statement will be made
in their report that the data meet the quality objectives specified by the method for that analysis. These
will be presented in the laboratory analytical report - i.e. the acceptable recovery range for spikes and
Standard Reference Materials and the acceptable range of relative percentage difference (RPD) on
duplicates. All of the quality assurance data (blanks, laboratory duplicates, spikes and Standard
Reference Materials) will be reported with the analytical data for each batch of samples analysed. As
soon as the analyses are completed the results will be emailed to URS for review so that any unusual
values can be queried and, if necessary, reanalysis carried out before the holding time for the samples
has expired.
The laboratory QA/QC procedures will be appropriate for the low concentrations expected in marine
sediments, which are frequently lower than those required for contaminated site investigations. A clear
statement will be made on the Chain of Custody forms accompanying the samples that they are
comprised of marine sediments.
5.6 Field records
Field notes will include the manual recording of field conditions (weather, tides and currents), site
locations, sampling methods, handling and storage methods, field sample numbers, date, time and
identity of sampler.
Field description of sediments will include the physical appearance, texture, colour, and presence of
foreign material, presence of shell fragments and or biota and stratification. Where multiple samples
are collected at a site, notes will be made on the variability between samples. Records will also be
made detailing the unique sample identifier for each sample collected.
Chain of Custody forms accompany all samples to the analysing laboratories. Each sample will appear
as a separate line item on the form, with the required analyses clearly identified. The consignments
will be checked against the Chain of Custody forms by the laboratories and their completeness
confirmed by return e-mail.
5.7 Health, safety and environment
Prior to the start of fieldwork, a scope specific risk-based health, safety and environment plan (HSEP)
will be prepared and reviewed by key project personnel to address potential risks to the health and
safety of project personnel and to their operating environment. Factors specific to East Arm include:
Strong currents
Large tidal variations (potential vessel grounding)
Marine wildlife (e.g. crocodiles, stingers)
Vessel traffic (commercial and recreational)
Tug Pen and Small Vessel Berths SAP
5 Sampling Methods
42214008/TPSAP/0 21
These factors will be considered with reference to both sampling efficiency and potential health and
safety risks. The HSEP will also include issues such as handling and storage of chemicals used in
fieldwork, and management of waste.
Safety planning will include job hazard analyses to identify the personnel and equipment requirements
of all survey tasks, vessel navigation duties and responsibilities, the use of routine and emergency
communication channels, and the development of an Emergency Response Plan to be followed in the
event of a serious accident. On-site vessel inductions and other ‘tool-box’ safety meetings will be
conducted before the start of each sampling task.
5.8 Contingency plan
In the event of adverse weather conditions or critical equipment failure rendering the sampling
programme unsafe, there will be a downtime contingency. If the sampling programme has
commenced, then the survey team will return to shore and assess the likely duration of the adverse
weather conditions or equipment repair/replacement times. Alternative equipment/vessel suppliers will
be identified in Darwin (in addition to the selected contractor) prior to works commencing, so that if
possible, equipment/vessels can be replaced in the event of equipment/vessel issues.
5.9 Data management and reporting
Validation of analytical data will be undertaken as soon as results are received from the analytical
laboratory. The relative standard deviation (RSD) will be determined for field triplicates and duplicates
and the relative percentage difference (RPD) will be determined for laboratory duplicates. In
accordance with the NAGD (2009) laboratory duplicates that have a RPD of greater than ± 35% will be
reanalysed, if possible, prior to the expiry of the analytical holding time. Likewise, field triplicates and
duplicates that have an RSD of greater than ± 50% will be reanalysed. An interpretive quality control
report will be provided by the analysing laboratory, highlighting any outliers to quality control
procedures.
ProUCLT statistical software will be used to analyse the data. The reporting of the field and analytical
data will comprise:
documentation of all field procedures and data including core photographs and logs
data validation
comparison of the 95% Upper Confidence Limit (UCL) of contaminant concentrations in sediment
in the dredge area with NAGD (2009) Screening Levels (as per Appendix A of the NAGD [2009])
mean sediment contaminant concentrations will be compared with background concentrations, if
NAGD (2009) Screening Levels are exceeded.
5.10 Sampling and Analysis Plan Report
A SAP report will be submitted to DoE to comply with Condition 25 of the Commonwealth project
approval (EPBC 2010/5304). The report will be used by the NTG as input into the Water Quality
Management Plan (in accordance with the approval conditions detailed in Section 1.4).
The report will include a description of actual sampling locations and numbers, results including
QA/QC assessment of both field and laboratory data, and an assessment of the results in accordance
with the NAGD (2009). The original laboratory certificates will also be included.
Tug Pen and Small Vessel Berths SAP
5 Sampling Methods
22 42214008/TPSAP/0
This page left blank intentionally
42214008/TPSAP/0 23
6
6References
AIMS 2010, Investigation of Copper Concentrate Loadout at East Arm Port: Water and Sediment
Quality, prepared for Northern Territory Government Department of Natural Resources, Environment,
the Arts and Sports, Darwin, Northern Territory.
AECOM 2009, Notice of intent for the proposed expansion works at East Arm, prepared for the
Northern Territory Department of Planning and Infrastructure. Cited in NTG 2011 East Arm Wharf
Expansion Project, Draft Environmental Impact Statement, Volume 1 of 4 Executive Summary May
2011 Prepared for the Northern Territory Department of Lands and Planning
http://www.nretas.nt.gov.au/environment-protection/assessment/register/eastarm/east_arm_draft_eis
Northern Territory Government
AECOM 2011, Dredge Management Plan East Arm Wharf Expansion Project, prepared for
Department of Lands and Planning, Darwin, Northern Territory.
Aurecon 2011, Darwin East Arm Wharf Nearshore Factual Geotechnical Investigation Report. Report
to NT Department of Land and Planning, Darwin, Northern Territory by Aurecon Australia Pty Ltd,
Darwin.
Aurecon, 2012, Defence Barge Ramp Option 144, Department of Lands and Planning, Report
prepared for Department of Lands, Planning and the Environment, Darwin, Northern Territory by
Aurecon Australia Pty Ltd, Darwin.
Batley, GE 1995, Heavy metals and tributyltin in Australian coastal and estuarine waters, in Zann, L
(ed.), State of the Marine Environment Report for Australia. Technical Annex 2. Department of the
Environment, Sport and Territories, Canberra.
Commonwealth of Australia 2009, National Assessment Guidelines for Dredging, Commonwealth of
Australia, Canberra 2009.
DHAC 2003, Darwin Harbour Regional Plan of Management. Darwin Harbour Advisory Committee.
Department of Infrastructure, Planning and Environment, Darwin.
DHAC 2006, Providing a scientific basis to managing the region’s development: sediment, nutrients,
organic matter and metals input to Darwin Harbour from its catchment, and the ecological impacts on
the Harbour. Ecosystem Research Group, Darwin Harbour Advisory Committee, Darwin, Northern
Territory.
Department of Lands and Planning, 2011, East Arm Wharf Expansion Project Draft Environmental
Impact Statement. Report prepared for Department of Lands and Planning, Darwin, Northern Territory,
for the Commonwealth Government, Canberra, ACT, and the Northern Territory Government, Darwin,
Northern Territory.
Douglas Partners 2010, Report on Previous Geotechnical Information and Suggested Further Work,
Three Proposed Dredge Areas. Report to Department of Construction and Infrastructure by Douglas
Partners Pty Ltd, Darwin.
DPC 2010, East Arm Wharf Facilities Master Plan 2030- Land Use Strategy Brochure DPC, 2010a,
accessed 17 September 2010 at http://www.nt.gov.au/dpa/masterplan/documents/
masterplanbrochure.pdf). Darwin Ports Authority
DPC 2011, Australia’s Northern Gateway of Choice, 2010/11 Annual Report. Darwin Port Corporation,
Darwin, Northern Territory.

Tug Pen and Small Vessel Berths SAP
6 References
24 42214008/TPSAP/0
Drewry, J, Dostine, PL, Fortune, J, Majid, M, Schult, J & Lamche, G 2010, Darwin Harbour Region
Report Cards 2010. Department of Natural Resources, Environment, The Arts and Sport. Report No
25/2010D. Palmerston, NT, Australia.
Fortune, J 2006, The grain size and heavy metal content of sediment in Darwin Harbour.
Environmental Protection Agency, Department of Natural Resources, Environmental and the Arts.
Report No. 14/2006D.
INPEX Browse, Ltd. 2010, Ichthys Gas Field Development Project Draft Environmental Impact
Statement.
NTG 2011, East Arm Wharf Expansion Project, Draft Environmental Impact Statement, Prepared for
the Northern Territory Department of Lands and Planning, April 2011.
http://www.ntepa.nt.gov.au/environmental-
assessments/assessment/register/eastarm/east_arm_draft_eis Northern Territory Government
Owen, G & Meakin, M 2003, Land use mapping of the Northern Territory. Technical Report 02/2003D.
Department of Infrastructure Planning and Environment, Darwin.
Padovan, A 2001, The Quality of Run-Off and Contaminant Loads to Darwin Harbour. Report No.
29/2000D. Resource Management Branch, Natural Resources Division, November 2001.
PWC 2006, Wastewater Treatment, Reuse and Discharge Report 2006. Power and Water
Corporation.
Seas Offshore 2010, Darwin Harbour Vibrocore Sample Acquisition and Analysis Report. Unpublished
report by Seas Offshore Pty Ltd.
URS 2009, Nearshore Marine Water Quality and Sediment Study. In INPEX Browse Ltd 2009 Ichthys
Gas Field Development Project INPEX Document Number C036-AH-REP-0026 Appendix 9.
URS 2012, East Arm Wharf Expansion Project: Sediment Geochemical Investigation. Report prepared
for Department of Lands and Planning, R1646 Rev 0, July 2012.
Wolanski, E, McKinnon, D, Williams, D & Alongi, DM 2005, An estuarine ecohydrology model of
Darwin Harbour, Australia; in Wolanski, E (ed.), The environment in Asia Pacific harbours, pp. 477–
488. Springer, Dordrecht, The Netherlands.
Tug Pen and Small Vessel Berths SAP
42214008/TPSAP/0 25
7
7Limitations
URS Australia Pty Ltd (URS) has prepared this report in accordance with the usual care and
thoroughness of the consulting profession for the use of the NTG and DPC, and only those third
parties who have been authorised in writing by URS to rely on this Report.
It is based on generally accepted practices and standards at the time it was prepared. No other
warranty, expressed or implied, is made as to the professional advice included in this Report.
It is prepared in accordance with the scope of work and for the purpose outlined in Variation 6 dated
4 December 2013 (variation to the contract dated 1st July 2013).
Where this Report indicates that information has been provided to URS by third parties, URS has
made no independent verification of this information except as expressly stated in the Report. URS
assumes no liability for any inaccuracies in or omissions to that information.
This Report was prepared between December 2013 and February 2014, and is based on the
conditions encountered and information reviewed at the time of preparation. URS disclaims
responsibility for any changes that may have occurred after this time.
This Report should be read in full. No responsibility is accepted for use of any part of this report in any
other context or for any other purpose or by third parties. This Report does not purport to give legal
advice. Legal advice can only be given by qualified legal practitioners.
Except as required by law, no third party may use or rely on this Report unless otherwise agreed by
URS in writing. Where such agreement is provided, URS will provide a letter of reliance to the agreed
third party in the form required by URS.
To the extent permitted by law, URS expressly disclaims and excludes liability for any loss, damage,
cost or expenses suffered by any third party relating to or resulting from the use of, or reliance on, any
information contained in this Report. URS does not admit that any action, liability or claim may exist or
be available to any third party.
Except as specifically stated in this section, URS does not authorise the use of this Report by any third
party.
It is the responsibility of third parties to independently make inquiries or seek advice in relation to their
particular requirements and proposed use of the site.

Tug Pen and Small Vessel Berths SAP
7 Limitations
26 42214008/TPSAP/0
This page left blank intentionally
42214008/TPSAP/0
A
Appendix A Excerpt from Darwin East Arm Wharf Near Shore Factual Geotechnical Investigation Report for the Northern Territory Government, May 2011, by Aurecon Australia Pty Ltd, P31-32

42214008/TPSAP/0
This page left blank intentionally

Darwin East Arm Wharf
Project 41840-009 | File Geotechnical Investigation - Final Report Revision 2.doc 6 May 2011 | Revision 2 Aurecon Page 31
7.2.6 Tug, customs and small vessels area (T-Series)
A total of nine boreholes were drilled in this area (see Drawing 41840-SK-091 in Appendix B). The thickness of sediment encountered in this area varied considerably, with a minimum thickness of 1.8 m at borehole T1 and a maximum thickness of 8.4 m in borehole T22 (see Table 7.6). Sketches showing the thickness of sediment and interpolated contours are given in Appendix B. The Burrell Creek Formation was encountered at a level of -8.47 to -10.59 m.
Predominantly fine grained deposits were encountered in this area, with granular content of less than 40%. Gravel was found in only one sample (see Figure 7.6). In general, the alluvial material in this area can be described as silty CLAY with trace sand. The majority of Atterberg limits indicate that the sediment is clay of high plasticity (see Figure 7.7).
Table 7.6 Depth of marine alluvial sediments encountered – T-series boreholes
Borehole Thickness of marine alluvial
sediments (metres)
Maximum depth of marine alluvial
sediments (metres Chart Datum)
Nature of Marine Sediments (Logged
Description)
SPT Results
T1 1.8 -10.59 Sandy clay, silty sand, gravelly sand
SPT “N” = 0 blows (0.0m)
T3 4.55 -10.11 Sandy silt, clayey silt, sandy silty clay
SPT “N” = 0 blows (0.0m)
T4 2.0 -9.21 Clayey silt SPT “N” = 0 blows (0.0m)
T6 2.1 -8.47 Clayey silt SPT “N” = 0 blows (0.0m)
T7 4.5 -8.8 Clayey silt, sandy silt
SPT “N” = 0 blows (0.0m)
T13 4.2 -10.05 Clayey silt, silt, gravel
SPT “N” = 0 blows (0.0m)
SPT “N” = 2 blows (3.0m)
T14 6.0 -9.24 Silty clay, sandy clayey silt, silty sand
SPT “N” = 0 blows (0.0m)
SPT “N” = 0 blows (2.5m)
T22 8.4 -10.11 Clayey silt, silty sand, sandy silt
SPT “N” = 0 blows (0.0m)
SPT “N” = 0 blows (1.5m)
T25 3.1 -9.17 Clayey silt, silty sand, sandy silt
SPT “N” = 0 blows (0.0m)

Darwin East Arm Wharf
Project 41840-009 | File Geotechnical Investigation - Final Report Revision 2.doc 6 May 2011 | Revision 2 Aurecon Page 32
0
.00
2
0.0
06
0.0
2
0.0
75
2.0 2.0 2 20
0
10
20
30
40
50
60
70
80
90
100
Particle Size (mm)
Pe
rce
nta
ge
Pa
ssin
g (
%)
T3 at 2.9m
T6 at 1.4m
T14 at 2.5m
T14 at 4.0m
T14 at 5.3m
T22 at 1.5m
T22 at 5.8m
SILT SAND
Fine Medium Coarse Fine
GRAVEL
CoarseMedium
CLAY
Figure 7.6 Particle size distributions - T-Series boreholes
0
10
20
30
40
50
60
70
0 10 20 30 40 50 60 70 80 90 100 110 120
Liquid Limit (LL)
Pla
stic
ity In
dex
(PI)
T1 @ 0.9-1.0m
T3 @ 2.9-3.0m
T6 @ 1.4-1.5m
T14 @ 2.5-2.95m
T14 @ 4.0-4.55m
T14 @ 5.3-5.33m
T22 @ 1.5-1.95m
T22 @ 4.5-4.95m
T22 @ 5.8-6.0m
Low Plasticity
Intermediate
Plasticity
High
Plasticity
Clay
Silt
Figure 7.7 Atterberg limits - T-Series boreholes
LOBF

42214008/TPSAP/0
B
Appendix B Cross reference of this Sampling and Analysis Plan to NAGD (2009) Appendix B

42214008/TPSAP/0
This page left blank intentionally

42214008/TPSAP/0
NAGD Guidance SAP Section
The objectives of the SAP, including data quality objectives. 1.4
A brief description of the dredging proposal, including the planned dredging area or areas,
the dredging depths, the types of sediments involved and the final volume of material to be
removed (in cubic metres) for sea disposal.
1.2
An evaluation of the history of the dredge area and its catchment, and available data on the
sediments to be dredged.
2.1.2
2.2
3.1
A table showing the amounts to be dredged for each separate dredge area, as well as
differentiating between clean, contaminated and potentially contaminated materials.
(As the dredge footprint is treated as a single area, and all of the material is considered ‘potentially
contaminated’, this is covered in text rather than in a table)
4
The Contaminants List, based on the history of the catchment and any previous sediment
sampling. 3.23.2
Consideration of environmental factors potentially affecting contamination in the sediments
(such as currents, bathymetry, grain-size) or which may limit or hinder the sampling program
(for example depth, currents or waves, rocky bottom, weather, wildlife such as sharks,
crocodiles or stingers, remoteness).
2.1.3
5.7
A rationale for the proposed sampling design, including maps showing the dredging area/s
and the proposed sampling locations. 4
A contingency plan in case of adverse weather or critical failure of equipment. 5.8
The equipment (vessel, sampling, sub-sampling and testing gear, positioning equipment,
sample containers, reports, charts and data forms) and personnel needed to implement the
SAP, and a list of field measurements to be carried out.
5.2
A list of sample numbers, including field replicates and quality assurance samples, the
approximate sampling locations and details of the position-fixing method, the proposed length
of cores and depths of sub-samples from cores.
4
5.2
5.4
Step-by-step procedures for sampling and sub-sampling consistent with Appendix D of the
Guidelines; the volume of sample required for analysis and the types and numbers of
containers; procedures to ensure that samples are not contaminated from pollution sources
on the survey boat.
5.1
5.2
5.3
Step-by-step procedures for sample handling, preservation, storage and QA/QC. 5.3
The laboratories to be used, a list of analyses required, the proposed analytical methods, the
detection limits of the proposed methods, whether the methods will achieve the specified
Practical Quantitation Limits (PQLs) in Table 1 of the Guidelines, laboratory replicates,
certified reference materials, and QA/QC procedures.
5.3
5.5
Procedures for data management, data quality validation and any statistical routines proposed to be
used. 5.9

URS Australia Pty Ltd
Level 3, 93 Mitchell Street
Darwin, NT 0801
GPO Box 2005, Darwin NT 0801
Australia
T: 61 8 8980 2900
F: 61 8 8941 3920
www.ap.urscorp.com