Tufts University · Sustainability Reporting: An analysis of programs and metrics reported by top...
98
Sustainability Reporting: An analysis of programs and metrics reported by top manufacturers in New England A thesis submitted by Michael E. Coty In partial fulfillment of the requirements for the degree of Master of Arts In Urban and Environmental Policy and Planning Tufts University October 2014 © 2014, Michael E. Coty Adviser: Mary Davis Reader: Ann Rappaport
Transcript of Tufts University · Sustainability Reporting: An analysis of programs and metrics reported by top...

Sustainability Reporting:
An analysis of programs and metrics reported by top manufacturers in New England
A thesis submitted by
Michael E. Coty
In partial fulfillment of the requirements for the degree of
Master of Arts
In
Urban and Environmental Policy and Planning
Tufts University October 2014
© 2014, Michael E. Coty
Adviser: Mary Davis Reader: Ann Rappaport
ii
Abstract
Corporations are increasingly adopting sustainable development principles and
expanding sustainability reporting programs to demonstrate value to their
stakeholders. Economic value can be realized by enabling more efficient
production of goods and reputation can be enhanced by reporting environmental
practices. This research utilized content analysis and interviews to evaluate the
extent of sustainability reporting among 47 publicly-traded manufacturers in New
England. The findings indicated that approximately half of the companies
prepared sustainability reports. The majority of reporting organizations had
annual sales revenue over $1 billion and employed more than 1,000 workers. A
total of 139 different environmental metrics were identified among the sampled
sustainability reports and approximately one third of them were verified
externally. The sampled companies utilized numerous reporting mechanisms and
voluntary standards. The wide variety of formats and complexity underscores the
need for standardization. Based on this research, significant opportunities exist to
develop and expand sustainability reporting programs among sampled New
England manufacturers.

iii
Acknowledgements
I would like to thank Mary Davis for her invaluable guidance during this research
and writing process. Through her numerous readings of the material, she
highlighted multiple opportunities to improve the writing and organization of this
document, challenged me to expand on the implications of my research, and most
importantly, provided unending encouragement to complete this project. I would
also like to thank Ann Rappaport for inspiring me to explore how businesses can
participate in solving complex environmental issues, for providing extensive
knowledge on the subject of corporate sustainability, and for a thorough review of
the material. Finally, I would like to thank my wife whose support and
encouragement has been unwavering throughout this process.

iv
Table of Contents
Chapter 1: Introduction ........................................................................................... 1
Chapter 2: Literature Review .................................................................................. 6
2.1 Defining Corporate Sustainability ............................................................ 7
2.2 History of Non-Financial Reporting ........................................................ 9
2.3 Trends in Sustainability Reporting ......................................................... 10
2.4 Rationale for Reporting .......................................................................... 13
2.5 Preparation of Sustainability Reports ..................................................... 20
2.5.1 Report Verification ......................................................................... 27
2.6 Sustainability Indicators and Metrics ..................................................... 30
2.7 Voluntary Standards, Guidelines, Codes of Conduct, and Disclosure
Websites ............................................................................................................ 32
2.7.1 Voluntary Standards........................................................................ 34
2.7.2 Guidelines ....................................................................................... 37
2.7.3 Codes of Conduct ............................................................................ 38
2.7.4 Disclosure Websites ........................................................................ 39
2.8 Summary ................................................................................................ 40
Chapter 3: Methods ............................................................................................... 42
3.1 Content Analysis .................................................................................... 43
3.2 Interviews ............................................................................................... 47

v
Chapter 4: Results ................................................................................................. 49
4.1 Reporting Companies by State ............................................................... 50
4.2 Reporting Company Statistics ................................................................ 53
4.2.1 Company Size ................................................................................. 53
4.2.2 Revenue........................................................................................... 54
4.2.3 Stock Indices ................................................................................... 55
4.2.4 Business to Business vs. Business to Consumer ............................. 56
4.3 Report Characteristics ............................................................................ 56
4.4 Reporting Venues and Certifications ..................................................... 57
4.5 Metrics .................................................................................................... 59
4.6 Interviews ............................................................................................... 60
4.6.1 Sustainability Initiatives.................................................................. 61
4.6.2 Reasons for Not Implementing Sustainability Programs ................ 61
4.6.3 Future Sustainability Programs ....................................................... 62
4.6.4 Sustainability Reporting.................................................................. 63
4.6.5 Stakeholders .................................................................................... 64
4.6.6 Regulatory Compliance .................................................................. 64
4.6.7 Manufacturing and Contract Manufacturers ................................... 65
Chapter 5: Discussion and Recommendations ...................................................... 66
5.1 Company Interviews .............................................................................. 75

vi
Chapter 6: Conclusion........................................................................................... 78
Appendix A Copy of Company Interview Questionnaire ................................... 80
Appendix B Environmental Metrics Identified in Sample Manufacturers’
Sustainability Reports ........................................................................................... 82
Appendix C Summary of Recommendations ..................................................... 86
References ............................................................................................................. 87

vii
Tables
Table 1 – Summary of Sustainability Reporting Organizations ........................... 33
Table 2 - Summary of Manufacturers by State ..................................................... 43
Table 3 - Summary of Data Variables .................................................................. 45
Table 4 - Number of Manufacturers Analyzed by State ....................................... 50
Table 5 - Summary of Company Characteristics and Reporting by State ............ 51
Table 6 - Summary of Report Titles ..................................................................... 57
Table 7 - Summary of Reporting Venues and Certifications ................................ 58
Table 8 - Summary of Top Environmental Metrics .............................................. 59
Figures
Figure 1- Data Collection Process Flow Chart ..................................................... 46
Figure 2- Reporting by No. of Employees ............................................................ 54
Figure 3 - Reporting by Annual Revenue ............................................................. 55

1
Chapter 1: Introduction
In a competitive economy corporations are increasingly adopting sustainable
development principles, often referred to as “sustainability”, and publicly
disclosing these initiatives to demonstrate value to their stakeholders. The United
Nations (UN) Brundtland Commission’s report Our Common Future was
published in 1987 and was a catalyst for increased attention to business’
responsibility to participate in advancing sustainable development. The report
defined sustainable development as “…development that meets the needs of the
present without compromising the ability of future generations to meet their own
needs” (WCED, 1987, p. 41). Companies that subscribe to sustainable
development principles utilize a “triple bottom line”1 approach and consider the
social and environmental impacts of their business decisions in addition to the
economic consequences.
Sustainability reporting describes the process of conveying environmental and
social initiatives to the general public and it is becoming increasingly widespread
throughout the business community (Archel, 2007; Daub, 2007; Roca and Searcy,
2012; Zhang, Rio, Allais, Zwolinski, Carrillo, Roucoules, Mercier-Laurent, and
Buclet, 2013; Schalteggar et al., 2006). There are a number of reporting
guidelines, such as the Global Reporting Initiative (GRI), and voluntary standards
1 The term “triple bottom line” refers to people, planet, and profit.

2
available to companies to monitor, manage, and report their sustainability
initiatives. Guidelines and standards may require documentation of specific
metrics or provide a framework to develop custom environmental management
systems. Due to the existence of numerous guidelines and the voluntary nature of
these programs, a wide variety of detail and complexity can be found among
published sustainability reports (Hahn and Kuhnen, 2013; Zhang et al., 2013).
There are several methods available to convey sustainability measures to the
company’s stakeholders, including consumers, investors, and suppliers.
Businesses can use a formal reporting platform, such as the GRI, develop their
own stand-alone report (based on available information and willingness for public
disclosure), and/or include information in their annual report. Note that these
alternatives are not mutually exclusive. For example, firms may prepare a stand-
alone report that also conforms to the GRI guidelines. Based on interviews
conducted during this research, a number of organizations conduct sustainability
initiatives but choose not to prepare sustainability reports. These companies often
retain information for internal use only, such as for quality control or facility
operation and management purposes.2
The primary rationale for adopting sustainability initiatives is to increase the
value of the organization. Sustainability initiatives provide opportunities for
companies to become more efficient by using less resources and energy, thereby
2 Since this analysis reviews publicly-available sustainability documents, a full discussion of the internal use of this information is outside the scope of this research.

3
contributing positively to the bottom line. Sustainability initiatives also provide
intangible value such as reputation and branding (Archel, 2007; Brown, Jong and
Levy, 2009; Epstein, 2008; Hahn and Kuhnen, 2013; Herzig and Schaltegger,
2011; Orsato, 2009; Wales 2010).
Sustainability programs and reporting are voluntary3 and as such are conducted in
addition to mandated regulatory standards (often described as “beyond
compliance” initiatives). These programs are critical to extend the ability of
regulations to improve worker health and safety and to protect the environment.
For example, voluntary initiatives can reduce greenhouse gas (GHG) emissions
by installing energy efficient appliances and supporting renewable energy
sources. Water use can be improved by installing low-flow appliances and
collecting condensate and rainwater. Lastly, waste can be reduced by
encouraging aggressive recycling and closed loop manufacturing programs in an
attempt to address landfills which are at their capacity.
In addition to improving environmental conditions, sustainability initiatives
provide opportunities for companies to signal their intention to support long-term
social and economic objectives within the community. These initiatives provide
platforms for corporations to offer economic resources and stimulate
3 Although preparation of a sustainability report or presenting sustainability-related information in the annual report is considered voluntary at this time, collection and reporting of specific metrics within the report may be mandated by regulations. For example, in Massachusetts large emitters may be required to measure and report CO2 emissions to regulators.

4
communication between management and the public. In addition, sustainability
reporting promotes transparency between the company and stakeholders, and
ensures the business is held accountable for their activities.
Due to the importance of sustainability to the corporation, community, and the
environment, this research was undertaken to extend the literature on
sustainability reporting and to understand the programs employed by New
England manufacturers. The analysis included a review of 47 publicly-traded
manufacturers in the New England region.
Content analysis was utilized to review publicly-available documents and
company interviews were conducted to provide additional insight to the research.
Note that this analysis focused solely on environmental indicators and their
associated reporting. Manufacturing was selected among industry sectors due to
its intense resource requirements, high energy and water demands, and potential
for significant waste generation. Based on these assumptions, implementing
sustainability initiatives within the manufacturing industry could provide
opportunities to protect natural resources and improve waste management
processes (Gunasekaran and Spalanzani, 2012), as well as mitigate other
environmental impacts.

5
To further understand the extent of sustainability reporting among New England
manufacturers, the following questions were asked:
1. Of the top manufacturing organizations in New England, how many are
producing sustainability reports and what formats do they follow?
2. What environmental metrics and indicators are being monitored by these
organizations?
3. How many of these reports and organizations are verified by external
sources?
4. How does the format and depth of sustainability reporting vary by state,
company size, sales volume, and the firm’s visibility in the marketplace?
Understanding the extent of sustainability reporting in New England provides
valuable insight into the business community’s response to address issues such as
climate change, water scarcity, limited raw materials and resources,
environmental pollution, and surpassed landfill capacities. This information can
be combined with other state and regional sustainability data in order to fully
understand the extent of initiatives currently underway and identify opportunities
to improve or expand existing environmental policies. By summarizing the extent
of sustainability initiatives reported by the top New England manufacturers, this
analysis can provide information to organizations beginning to report their data or
expanding their environmental programs. Companies can learn from other
businesses and compare initiatives to fully understand and develop opportunities
within their organization.

6
Chapter 2: Literature Review
Sustainability reporting is becoming increasingly widespread throughout the
business community (Archel, 2007; Daub, 2007; Roca and Searcy, 2012;
Schalteggar et al., 2006; Zhang et al., 2013) as a means of conveying
environmental data and social initiatives undertaken by an organization.
Sustainability programs are voluntary 4and as such are conducted in addition to
mandated regulatory standards (often described as “beyond compliance”
initiatives). According to Herzig and Schaltegger (2011), “Recent decades have
witnessed an exponential growth in non- or extra-financial reporting such as
environmental, social or sustainability reporting” (p. 151). There are a variety of
methods and venues available to convey sustainability measures to intended
audiences, including consumers, investors and other businesses. Companies can
use a formal reporting platform, such as the GRI, develop their own stand-alone
report (based on available data and willingness to disclose information to the
public), or include material in their annual report.
Based on the literature, a wide variety of detail and complexity can be found
among published sustainability reports (Hahn and Kuhnen, 2013; Zhang et al.,
2013). In addition to the GRI, other possible outlets include the Carbon
Disclosure Project (CDP), the Corporate Register, and the Climate Registry,
4 As described above, select metrics and indicators measured and reported under voluntary sustainability programs could be required by law in some cases.

7
among others. Companies can also signal sustainability by obtaining the
International Organization of Standardization (ISO) 14001 certification, an
internationally-recognized environmental management systems standard.
Firms may choose to certify their report and data using a third party organization
such as the GRI, an industrial trade group, non-governmental organization
(NGO), environmental auditor, or consulting firm. Other companies may
highlight intended adherence to a certain standard without actual verification of
the data. Some organizations produce sustainability reports for internal use only,
such as for quality control, operations improvement, and management training,
while many other firms opt out of sustainability reporting altogether.
As discussed below, reporting can offer attractive economic paybacks to the
company, including intangible benefits such as reputation and branding.
2.1 Defining Corporate Sustainability
From a terminology standpoint, the terms “sustainability”, “corporate
sustainability”, and “sustainable development” can be interpreted and defined
differently by stakeholders (Herzig and Schaltegger, 2011). For example,
Schaltegger et al. (2006) suggests that corporate sustainability requires not only
satisfying today’s investors and employees, but must also consider future
stakeholders as well. Jacobsen (2011) posits that sustainability involves
managing businesses with a long-term horizon and ensuring that resources will be
available indefinitely. Corporate sustainability can be viewed as a management

8
strategy for conducting business and implies that the company’s actions support
long-term sustainable goals within the organization, as well as the development of
the community and economy as a whole (Schaltegger et al., 2006).
One of the key individuals responsible for defining corporate sustainability is
John Elkington. According to Elkington, who coined the term “triple bottom
line” in 1994 (Elkington, 1994, 1998), firms not only need to be profitable but
have a responsibility to their community and the environment. Elkington writes,
“Sustainable development involves the simultaneous pursuit of economic
prosperity, environmental quality, and social equity. Companies aiming for
sustainability need to perform not against a single, financial bottom line but
against the triple bottom line” (Elkington, 1998, p. 397).
In addition to understanding the triple bottom line, researchers have recently
focused on studying the interrelationships between “people, planet and profit”
(Schaltegger et al., 2006). For example, implementing policies to address
environmental concerns, such as waste reduction, also impacts social well-being
by removing pollutants from communities and increases profitability by reducing
disposal costs. After implementing these policies, companies can communicate
these initiatives to their stakeholders and the general public to improve their
reputation in the community.
Along with the multiple interpretations of sustainability, there are several
definitions of sustainability reporting that can be identified in the literature.

9
Arguably one of the most descriptive is provided by the World Business Council
for Sustainable Development (WBCSD). “We define sustainable development
reports as public reports by companies to provide internal and external
stakeholders with a picture of the corporate position and activities on economic,
environmental and social dimensions” (Daub, 2007, p. 76; Roca and Searcy,
2012, p. 105). A simpler version contends that sustainability reporting equates to
publication of data and reports online or in printed format (Schaltegger et al.,
2006).
2.2 History of Non-Financial Reporting
The concept of one dimensional reporting, which is defined as providing either
financial data, discussions of the company’s social impacts, or summarizing
environmental emissions or waste, has been around for some time (Schaltegger et
al., 2006). For example, evidence of corporate financial reporting can be found as
early as the nineteenth century. In the mid-twentieth century, corporate annual
reports often included information related to the community and employee
matters (Herzig and Schaltegger, 2011).
The first exclusive non-financial reporting began in the 1970s as social reporting.
During this time, companies began to report on how their processes and services
impacted communities. Firms also published goals to improve social conditions
related to their business activities (Herzig and Schaltegger, 2011). In 1973, Abt.
Associates in Cambridge, MA produced one of the first non-financial reports with

10
a balance sheet and income statement dedicated to measuring social impacts from
business operations (Epstein, 2008).
Environmental reporting began in the 1980s and often focused on ecological
effectiveness, which is defined by Herzig and Schaltegger (2011) as the total
impact to the environment from a company’s operations. The emergence of two
dimensional reporting began in the mid-1990s. In most cases, the two dimensions
were financial and environmental. However, there was some evidence of
economic and social reporting (Schaltegger et al., 2006) as well. Sustainability,
which focuses on social, environmental and economic aspects of the business,
became the focus of reporting in the mid-1990s. According to Herzig and
Schaltegger (2011), the purpose of the reports was to convey the company’s
initiatives that exemplified sustainable development. In 1999, Shell produced one
of the first stand-alone sustainability reports. It was appropriately titled the
“Triple P-Report” for people, planet and profit (Herzig and Schaltegger, 2011, p.
156).
2.3 Trends in Sustainability Reporting
According to Stubbs et al. (2013), a 2004 report by the United Nations
Environment Programme (UNEP)/SustainAbility calculated a 600% increase in
sustainability reporting in less than a decade. Wales (2010) suggests that
organizations understand the benefits of implementing sustainable business
practices and are seizing the opportunity to adopt these initiatives. The ability to

11
minimize social and environmental costs has also led to increased management of
these activities by corporations, as well as the preparation of greater numbers of
sustainability reports (Epstein, 2008).
Sustainability recognizes that the impacts of businesses affect the environment
and individuals outside the organization, such as nearby residents and the
community. This includes parties without a financial stake in the company.
Corporations can also impact future generations, such as through resource
extraction and waste disposal. According to Schaltegger et al. (2006), these
considerations and discussions are fairly recent in the business and sustainability
realm.
Based on the literature, large, multinational corporations comprise the majority of
reporting companies, especially public organizations (Stubbs, Higgins and Milne,
2003; Marshall and Brown, 2003). However, there are many small and medium-
sized businesses that also impact the environment, especially when the effects of
these companies are viewed as a whole. Since small and medium-sized
businesses represent a significant portion of the national and international
economy, they should be included in the sustainability reporting process (Herzig
and Schaltegger, 2011).
Studies suggest greater visibility, enhanced access to resources, and greater
societal pressure are motives for larger companies to engage in sustainability
reporting. Reviews of companies included in the largest business indices (both in

12
the United States and globally) demonstrate high percentages of reporting. For
example, in 2005, 43 of the firms in the S&P 100 produced sustainability reports,
79% provided information on sustainability on their websites, and 12 reported for
the first time (Epstein, 2008). A review of the S&P 500 companies demonstrates
a significant upward trend in sustainability reporting. In 2011, less than 20% of
all S&P 500 companies reported on their sustainability initiatives. In 2012, the
percentage increased to 53% of all S&P 500 firms. The most recent data for 2013
shows that 72% of all S&P 500 companies now participate in some form of
sustainability reporting (Governance and Accountability Institute, 2014).
Similar results can be found in Fortune Global 250 companies. In 2005, 54% of
these firms produced a separate sustainability report and 20% included a section
on sustainability in their annual report (Epstein, 2008). As of 2011, Stubbs et al.
(2013) reported that 95% of Fortune Global 250 companies were involved in
sustainability reporting. Although a high percentage of companies included in the
major business indices prepare sustainability reports, Stubbs et al., (2013) note
that only 2,000 of the estimated 60,000 multinationals actually produce reports.
In addition to an increase in reporting among large companies, other sustainability
reporting trends include attempts to expand the report’s intended audience,
providing governance details of the organization, reporting data based on
geography (rather than producing one report within a large, multinational
company), and incorporating financial and sustainability data into a single report
(Brown et al., 2009). Ranking and competition between sustainability reports are

13
also becoming more prevalent. Herzig and Schaltegger (2011) posit that ranking
reports will help standardize the reporting process, as well as expand discussions
surrounding the topic. The authors also contend that ranking sustainability
documents provides an opportunity to conduct more extensive research on the
material.
Publishing sustainability reports online is also becoming more common. This
provides an opportunity to increase public access to the data, as well as provide
more information to stakeholders. According to Herzig and Schaltegger (2011),
opportunities to improve communication and promote discussion of sustainability
is greatly enhanced by online reporting.
Although trends indicate an increase in sustainability reporting, critics maintain
that there are still few reporting companies, especially among small and mid-sized
businesses. Other critiques of sustainability reporting include low reporting
quality (Archel, 2007), data problems, low readership, and not enough
quantitative indicators (Brown et al., 2009).
2.4 Rationale for Reporting
According to the literature, there are many reasons for implementing an
environmental sustainability reporting program. These include improving
reputation and branding, increasing company legitimacy, benchmarking against
goals, demonstrating transparency, revealing competitiveness, and encouraging
employees (Hahn and Kuhnen, 2013).

14
Of these, enhancing brand value, especially as compared to competitors, appears
to be the primary purpose of sustainability reporting (Zhang, 2013). The value
can be realized in terms of economic performance, such as additional sales from
customers, increases in employee productivity due to involvement in company
decision-making, or avoidance of environmental penalties and fines. Value can
also be intangible (Orsato, 2009), such as improved company reputation,
branding, and legitimacy. As the name implies, it is difficult to assign a monetary
value to these benefits. However, in some cases organizations attempt to quantify
non-tangible value to justify the costs of implementing these programs. Since
valuation can be challenging, Orsato (2009) argues that the value of sustainability
and environmental programs do not always have to be quantified.
One of the most common examples of both tangible and intangible value in the
literature is competitive advantage. The term competitive advantage was
introduced by Michael Porter in his 1985 book Competitive Advantage: creating
and sustaining superior performance. Competitive advantage is referenced
throughout the literature (Herzig and Schaltegger, 2011; Orsato, 2009) to describe
the value of sustainability reporting. The two foundations of competitive
advantage are a reduction of costs and differentiation from competitors (Orsato,
2009). One approach to differentiate companies is through sustainability
reporting. Sustainability reporting could provide a competitive advantage over
those companies that do not prepare them (Herzig and Schaltegger, 2011).

15
In addition to maintaining a competitive advantage, companies report on their
sustainability initiatives to enhance their reputation. This is one of the most
frequently cited justifications in the literature for explaining why organizations
adopt sustainability reporting practices (see Archel, 2007; Brown et al., 2009;
Epstein, 2008; Hahn and Kuhnen, 2013; Herzig and Schaltegger, 2011; Orsato,
2009; Wales, 2010 and others). In some cases, especially for heavily-scrutinized
companies, sustainability reporting can be primarily about managing reputation
(Orsato, 2009). Business and investor indices that measure corporate legitimacy
demonstrate a clear positive connection between sustainability reporting and
reputation (Orsato, 2009). As an example, Orsato (2009) points to Shell’s use of
sustainability reporting following damaging incidents in Nigeria and with the
Brent Spar oil rig in the North Sea. He suggests that sustainability reporting did
not completely eliminate controversies, but allowed the company to minimize
damage to their reputation.
In line with enhancing reputation, sustainability reporting can also serve to
legitimize businesses or rationalize specific decisions within an organization
(Daub, 2007; Hahn and Kuhnen, 2013; Herzig and Schaltegger, 2011; Marshall
and Brown, 2003). Reporting can also be used to “…gain, maintain and repair
legitimacy” (Herzig and Schaltegger, 2011, p. 152). The overall purpose of
establishing legitimacy is to increase public support for the company’s products,
brand, and image.

16
Risk management is also a highly-referenced motive for sustainability reporting
(Gunasekaran and Spalanzani, 2012; Herzig and Schaltegger, 2011; Orsato, 2009;
Wales, 2010), especially in the energy and oil industries. Orsato (2009) points out
that energy and oil companies budget large sums of money not only to conduct
sustainability programs but to communicate these initiatives to the public. These
organizations are typically high profile companies that operate in sensitive
environmental areas and have significant impacts on natural resources and on
communities.
Companies who prepare sustainability reports can also gain an advantage over
their competitors by measuring and better managing their operations. This can be
an important consideration for companies deciding to implement a sustainability
reporting program. Data collected during reporting can lead to increased energy
efficiency (Gunasekaran and Spalanzani, 2012), reduced water intensity,
decreased waste (Gunasekaran and Spalanzani, 2012), improved resource
allocation (Epstein, 2008), and reduced energy costs (Yudelson, 2010). For
example, by measuring energy costs, companies become aware of the potential to
reduce their electricity charges through the use of newer, more efficient
equipment or alternative utility pricing mechanisms.
In addition to better managing internal operations, the process of identifying
issues, finding solutions, and including employees in the decision-making process
can be beneficial to the company. The increased participation not only identifies
cost saving measures as described above, but motivates workers as well

17
(Schaltegger et al., 2006). Brown et al. (2009) concur that sustainability reporting
engages employees and strengthens their commitment to the company through the
process of inclusion and involvement in company management and operations.
Another important rationale for participating in sustainability reporting is
stakeholder pressure. Companies will often prepare sustainability reports to
satisfy stakeholder demand. Stakeholders can include customers, suppliers,
investors, shareholders, and employees. Other interested parties may also have an
influence on the organization. These include the community, media, the
government, trade associations, and NGOs.
Stubbs et al. (2013) posit that companies will implement sustainability reporting
in an effort to strengthen public relations when pressured by stakeholders and the
media. According to Hahn and Kuehnen (2013) and Stubbs et al. (2013),
stakeholders have a responsibility to pressure companies in order to increase the
number of reporting organizations. However, as noted by Epstein (2008)
organizations respond differently when confronted with stakeholder pressure.
The position and power of the stakeholder is important, and companies respond
favorably to powerful and legitimate stakeholders, as determined by the
organization (Stubbs et al., 2013).
Investors are often well-suited to pressure organizations to include environmental
and social issues with their financial data (Herzig and Schaltegger, 2011), as they
provide economic resources to the company and represent powerful stakeholders.

18
Investors request financial and non-financial information to assist them with
making better decisions about investing in a company (Epstein, 2008). However,
Brown et al. (2009) argues that traditional investors are only concerned with
economic performance. They suggest that environmental and social reporting
may be of little importance to traditional investors.
Investor organizations, such as the Investor Responsibility Research Center, rate
companies based on environmental risk, emissions, fines, and penalties (Bhat,
1996). The Forum for Sustainable and Responsible Investment (US SIF) also
provides information to investors to support companies based on their
environmental and social performance, as well as their governance structure (US
SIF, 2014). Annual reports and sustainability data can also be used to improve
investor relations and demonstrate the company’s ability to achieve a positive
economic return on an investment. Not only is the information itself important,
but the act of transparency also plays an important role in investment decisions.
An openness regarding company information can help reduce risk and uncertainty
for investors. Epstein (2008) explains that communication between a company
and its stakeholders is a critical factor for investors.
There are several other rationales described in the literature for establishing
sustainability reporting programs. These include benefits such as brand
marketing (Marshall and Brown, 2003), business generation (Herzig and
Schaltegger, 2011; Wales, 2010), improved credit (Epstein, 2008), elevated
customer loyalty (Wales, 2010), greater trust (Epstein, 2008), improved business
19
efficiency (Herzig and Schaltegger, 2011), and product innovation (Gunasekaran
and Spalanzani, 2012).
Although there are many positive rationales for sustainability reporting, many
companies still opt out of the process entirely (Stubbs et al., 2013). Stubbs et al.
(2013) conducted a study to understand non-reporting organizations and the
factors that influenced their decisions. The rationales identified for non-reporting
included lack of stakeholder pressure, lack of perceived benefits, concern about
sharing potentially damaging information, and little desire to be identified as a
sustainability leader. Stubbs et al. (2013) found that reporting only occurred in
organizations where it was important to the chief executive officer (CEO) and/or
upper level management. In addition, the management’s view towards
sustainability affected the entire company’s position on the subject (Stubbs et al.,
2013).
In summary, non-reporters felt like implementing sustainability initiatives would
be a good elective endeavor. However, they also believed that it was certainly not
required to operate a successful business (Stubbs et al., 2013). If nobody asks for
the information, non-reporting companies believed there was little incentive to
incorporate sustainability into their organization. However, even among
organizations that chose not to report, many believed sustainability reporting will
be mandated in the future through regulations, or at least will be required to
conduct business due to stakeholder and public expectations (Stubbs et al., 2013).

20
As described above, firms have various reasons for reporting their sustainability
initiatives. These include economic, social, liability, and other influential
pressures (Stubbs et al., 2013). Regardless of their motivation, it is clear that the
demand for companies to report on their sustainability initiatives is increasing
(Epstein, 2008; Marshall and Brown, 2003). Epstein (2008) maintains that not
only have pressures been successful in convincing companies to report on their
sustainability initiatives, but the number of reports as well as the quality of the
content has improved in recent years.
2.5 Preparation of Sustainability Reports
Companies produce stand-alone reports or combine environmental and social data
into their annual report to showcase their sustainability initiatives. Reporting
guidelines, such as the GRI, can influence the content of the reports. Stand-alone
reports generally provide information on the environmental and social aspects of
sustainability within the organization (Herzig and Schaltegger, 2011) and may
include some economic data. The annual report contains mostly financial
information and is considered the main communication tool with investors (Bhat,
1996). The Securities and Exchange Commission (SEC) mandates minimum
content and disclosure requirements for the annual report, and companies have the
option to include additional information as they determine necessary. For
example, companies may include basic information regarding the firm’s social
and environmental initiatives (Bhat, 1996). According to Epstein (2008), the
opening president’s letter of the annual report is a common place for companies to

21
describe their sustainability programs. Stubbs et al. (2013) maintains that changes
to the annual report as mandated by the SEC could be used to expand disclosure
requirements related to social and environmental issues, and would result in
companies incorporating sustainability into their governance structures, as
opposed to simply operations management practices.
The preparation of sustainability reports can be conducted internally by
environmental health and safety officers, sustainability managers, facilities
personnel, or communications departments. In addition, a large number of
organizations hire outside consultants to prepare the reports. Some of the most
common consultants include SustainAbility, AccountAbility, KPMG, Price
Waterhouse Coopers, Ernst and Young, and Deloitte and Touche.
Due to the potential for a variety of preparers, the content and format of
sustainability reports differs widely, as do the titles. For example, reports can be
designated as a “Sustainability Report”, “Corporate Citizenship Report”,
“Sustainable Development Report” or “Corporate Responsibility Report”,
depending on the preparer (Archel, 2007; Hahn and Kuhnen, 2013; Roca and
Searcy, 2012). A number of other naming options exist as well. As in most
cases, companies produce one report for their entire organization. However, it is
important to note that other options exist including reporting by separate company
divisions and facilities, or by geographical location (Epstein, 2008).

22
The process leading up to the reporting can be slow and daunting (Orsato, 2009)
due to the number of stakeholders involved in the process, the decision on what to
measure and report, the identification of employees or contractors needed to
complete the work, and the alignment of the programs with the company’s
mission statement and goals. For example, it took Green Mountain Coffee
Roasters approximately four years to produce their first sustainability report
(Brown et al., 2009) because of the issues noted above.
Prior to reporting, Epstein (2008) maintains that it is critical to carefully consider
the content and intended audience, as well as communication outlets. It is also
important to align programs and reporting with stakeholder expectations,
company goals, and strategic plans (Orsato, 2009). It is not uncommon for
organizations to attempt too many sustainability and reporting initiatives without
focusing their resources accordingly (Orsato, 2009). Materiality is a tool that can
be utilized to assist organizations in determining what to report. According to the
GRI, “Material topics for a reporting organization should include those topics that
have a direct or indirect impact on an organization’s ability to create, preserve or
erode economic, environmental and social value for itself, its stakeholders and
society at large” (GRI, 2014). The process is similar to the system found in
financial reporting (Hsu, Lee and Chao, 2013), and involves a ranking of issues
that are deemed important to the business as well as stakeholders (Wales, 2010).
According to Hsu et al. (2013), the important aspect of materiality is the ability to
focus on specific sustainability initiatives. Due to the large number of programs

23
available, it can be challenging to differentiate between those initiatives that add
value to the organization and those which are unimportant to stakeholders.
Herzig and Schaltegger (2011) also suggest two potential avenues to be used in
concert with one another for determining reporting content, the “Inside-Out” and
“Outside-In” approach (p. 164). The “Inside-Out” method relies on managers to
determine issues and select metrics to benchmark and monitor progress. Herzig
and Schaltegger (2011) explain that programs are implemented to address
environmental concerns, systems are designed to monitor the results, and
companies report the outcome, including future goals. The “Outside-In” approach
allows stakeholders to shape the reporting process (Herzig and Schaltegger,
2011). Critics of this methodology suggest that external parties are often not
privy to adequate internal information and therefore lack capacity to suggest
company improvements (Herzig and Schaltegger, 2011).
After corporations identify programs that match their strategic goals, it is
important to hold off on advertising the initiatives until they are well established.
Epstein (2008) recommends that organizations work on refining their
sustainability goals and improving their economic position prior to attempting to
report their data. In addition, Epstein (2008) suggests that solid internal
monitoring and reporting structures are in place before attempting to publish the
data externally. He further recommends incorporating the use of data and
information that is already available, prior to preparing external reports. Bhat
(1996) describes the process of reporting as determining the information required

24
by stakeholders, establishing systems to monitor achievement of goals, and
determining how to address shortcomings. This process is the same for both
internal and external reporting.
From an internal company perspective, transitioning sustainability and reporting
systems into existing management processes is incredibly challenging
(Schaltegger et al., 2006). This is arguably one of the most critical aspects of
sustainability reporting. In order for programs to be sustainable in the long run,
initiatives must be embedded in the company’s governance structure and
management systems. Programs without clear identification of goals and
responsible persons will not produce long-term commitments to sustainability.
Sustainability programs must identify who is responsible for collecting
measurements and data and describe how the report will be prepared and
distributed.
If the company does not invest the time and resources to select initiatives that
match their goals and embed programs into core management practices,
stakeholders will conclude that the organization is only interested in publicity and
branding. This term is known as greenwashing. To avoid this negative publicity,
companies must be able to describe their internal policies that contribute to
sustainability, address stakeholders’ concerns, and report data externally to the
public (Herzig and Schaltegger, 2011). Similar concerns regarding the
implementation of sustainability programs versus publicity campaigns and
marketing were raised by Epstein (2008).

25
After the initiatives have been selected, it is critical to establish appropriate
reporting boundaries. The purpose of identifying boundaries is to convey the
operations and/or facilities covered by the reporting. The report should note
whether environmental data was collected from all sites or a subset of facilities. It
should also include the time period covered by the reporting. The extent of
company operations should also be discussed and documented. For example, the
report should note whether the data includes all upstream (such as extraction of
raw materials and transportation) and downstream (such as waste disposal)
activities, or simply the actions conducted within the confines of the facility.
When preparing sustainability reports it is important to utilize straightforward,
simple language (Epstein, 2008). Data interpretation can be challenging to the
layperson and it is important to identify the target audience (Herzig and
Schaltegger, 2011). According to Epstein (2008), a survey of stakeholders
indicated that the length of sustainability reports did not matter as long as the
proper content was available. However, respondents were not inclined to read
more than 50 pages of a report regardless of the content. It is also important to
note that two-thirds of the readers acknowledged they would spend 30 minutes or
less reviewing the report. With regard to report length, Epstein (2008) maintains
that the key objective is to ensure that all necessary data has been provided to
stakeholders.
In addition to including pertinent sustainability metrics and data, firms may want
to consider other information such as a discussion of voluntary indicators that

26
could become mandatory regulations in the future, provide an overview of what
the firm’s competitors are reporting, and/or explain why certain information or
data might be absent from the reporting (Epstein, 2008). In summary,
establishing reporting content should be tailored to the individual company and
address their specific needs (Epstein, 2008).
Even if reports are prepared accordingly, Brown et al. (2009) cautions that “report
fatigue” can occur after publishing the initial document. This can lead to low
readership, and more importantly a loss of emphasis on the firm’s sustainability
programs. As discussed above, sustainability initiatives and reporting objectives
must be embedded in the organization’s management and operating systems. Due
to the potential for “report fatigue” among preparers and variable interest among
stakeholders, Brown et al. (2009) posit that organizations might begin reporting
on a biennial basis in the future.
Although companies attempt to produce accurate sustainability data that reflects
their strategic goals and business model, it is important to realize the limitations
of reporting. For example, the geographical and temporal scale of sustainability
can be difficult to address in a corporate context (Herzig and Schaltegger, 2011).
Sustainability reporting can also only be an estimate of a corporation’s progress
towards sustainable development. Archel (2007) argues that a true representation
of sustainable development is incredibly complex and would require a systems-
wide approach that is beyond the scope of most organizations. To accurately

27
determine sustainable development, intricate analysis would have to consider
biodiversity, as well as material flows (Archel, 2007).
As described above, there are many challenges for companies who prepare their
own reports, but there are also many benefits. This is especially true in the
beginning of the process, as initial interest is often high and employees respond
positively to the challenge. The process can strengthen the relationship between
companies and employees and can lead to innovative solutions. Engaging
employees in identifying inefficiencies, finding alternatives, and making decisions
can produce tangible benefits for the company, as well as motivate workers
(Schaltegger et al., 2006). Brown et al. (2009) suggest that internal preparation of
sustainability reports requires significant time and energy, but often yields worthy
information.
2.5.1 Report Verification
Since the majority of sustainability reporting is voluntary, companies can choose
which data to report and what formats to follow (Hahn and Kuhnen, 2013).
However, according to Brown et al. (2009), the ability to choose what to report
and in what format challenges the legitimacy of the system. This lack of
standardization is a significant issue for sustainability reporting programs (Brown
et al., 2009; Epstein, 2008; Herzig and Schaltegger, 2011). It can erode
confidence in companies’ data and present credibility issues for the reporting
process.

28
When companies publish sustainability reports it is critical that they understand
they are building long-term relationships with their stakeholders and focus on
establishing trust and legitimacy. To accomplish this, firms must report both
good and bad news (Epstein, 2008). Schaltegger et al. (2006) argues that firms
frequently present only good information and results, and Daub (2007) notes that
all environmental information in annual reports appears to be positive. This one-
sided presentation can reduce the company’s credibility with stakeholders and the
general public. One of the most important methods to increase legitimacy is
through report verification.
Report verification by external third parties is a critical step in sustainability
reporting to ensure accurate data and content. In addition, verification and
assurance are essential to provide legitimacy to the sustainability reporting
process (Epstein, 2008; Herzig and Schaltegger, 2011; Orsato, 2009; Schaltegger
et al., 2006). In addition to securing legitimacy, there are several other benefits to
report verification. These range from marketing to risk management, checking
systems against current laws, company standardization, and providing feedback
for continuous improvement (Epstein, 2008).
Most sustainability verifications (60%) are completed by large accounting firms
(Epstein, 2008). These companies frequently model the certification based on
financial practices (Brown et al., 2009). In 2005, according to Epstein (2008),
approximately 30% of Fortune Global 250 company sustainability reports were
verified. Research indicates that European companies are more likely to verify

29
their reports. For example, Brown et al. (2009) noted that 45% of reports in
Europe were verified, while only 3% of U.S. companies utilized external
assurance systems. Herzig and Schaltegger (2011) reported similar results. Of
the 100 largest global companies, comprising 22 countries, approximately 45%
issued a sustainability report. Of these, an estimated 39% were verified.
However, for U.S. companies the number of verified reports drops to 14%.
In most cases, corporate environmental sustainability initiatives and associated
verification of reports are voluntary. To date, governments have not intervened in
the process (Brown et al., 2009; Herzig and Schaltegger, 2011). A few exceptions
have been noted, mostly in Europe. Since there are no international reporting
standards and few regulations require comprehensive sustainability reporting,
auditing and verifying sustainability performance and reports is difficult. Current
verification and auditing schemes can include interviewing employees, relying on
external experts, evaluating processes, and confirming key metrics (Epstein,
2008).
According to Orsato (2009), corporations that choose to self-verify without a
sufficient auditing process may risk challenges from their stakeholders. One of
the primary concerns regarding verification is the company’s ability to influence
control over the auditing process (Herzig and Schaltegger, 2011). To address this,
a number of options exist with regard to verification and assurance processes.
Verification can be conducted by NGOs, independent third parties, and
accounting firms. However, the existence of too many assurance organizations

30
also challenges the notion of standardization (Brown et al., 2009). Schaltegger et
al. (2006) and others argue that assurance systems are already in place for
financial reports and could provide a framework for sustainability reporting
verification. Schaltegger et al. (2006) also introduce the concept of a “challenger
report” (p. 314). The purpose of the challenger report is to provide constructive
feedback and identify potential opportunities to improve sustainability programs.
The challenger report can be completed by an independent expert and can
increase the credibility of the sustainability initiatives and reporting. In future
reports, firms can reference the collaboration with an independent expert to
improve the legitimacy of their program (Schaltegger et al., 2006).
2.6 Sustainability Indicators and Metrics
Sustainability metrics, such as energy consumption or GHG emissions, are
indicators that allow a company to measure their environmental impact over a
period of time (Schwarz, Beloff and Beaver, 2002) and convey data to intended
audiences (Marshall and Brown, 2003). The terms metric and indicator are used
interchangeably throughout the literature and in this thesis.
Gunasekaran and Spalanzani (2012) posit that metrics are critical for
implementing and maintaining successful sustainability programs and provide
opportunities to evaluate alternative initiatives. The authors maintain that metrics
are necessary for robust and long-term programs. Jacobsen (2011) also agrees
that indicators must be attached to every sustainability initiative. These indicators

31
provide quantitative data on the company’s sustainability programs and along
with qualitative information offer a detailed picture of the firm’s environmental
and social performance (Roca and Searcy, 2012).
One of the primary purposes of environmental metrics and indicators is to
facilitate benchmarking5. Benchmarking allows companies to establish baselines
and monitor their internal progress over time, as well as enables firms to compare
themselves with other organizations or against an industry standard (Epstein,
2008). The purpose of benchmarking is to demonstrate improvements and
identify whether previous goals were met. The process can also be utilized
internally to compare different sectors or divisions of the company (Herzig and
Schaltegger, 2011). This could help highlight more efficient facilities within an
organization or identify opportunities for lower-performing establishments.
In order to successfully benchmark, sustainability metrics must be standardized.
Companies must select appropriate indicators and commit to measuring the same
metrics over a long period of time. Organizations frequently change their report
format from year to year (Herzig and Schaltegger, 2011) and may alter their
metrics, which makes benchmarking difficult.
Several studies have been conducted to quantify and evaluate sustainability
metrics. For example, Roca and Searcy (2012) conducted an analysis of the 2008
5 Note that a full discussion of benchmarking is outside the scope of this thesis.

32
sustainability reports of 94 Canadian companies. The study included companies
from ten industrial sectors, including mining, oil and gas, banks, forestry, and
steel, among others. Their goal was to summarize and compare terminology and
sustainability initiatives among these organizations. The authors subsequently
identified 585 metrics among the sampled firms (Roca and Searcy, 2012).
Interestingly, there was little repetition of indicators in the sustainability reports.
For example, 324 of the metrics were used only once within the reports, 91 were
included twice, and 40 were mentioned in three of the reports (Roca and Searcy,
2012). These results indicated a significant lack of standardization among the
published reports. Indeed, one of the most fundamental critiques of current
sustainability reporting is the lack of standardized metrics across organizations
(Brown et al., 2009). According to Roca and Searcy (2012), additional research is
needed to understand the types of indicators published in sustainability reports in
order to move towards standardizing metrics.
2.7 Voluntary Standards, Guidelines, Codes of Conduct, and Disclosure Websites
Sustainability reporting can be manifested in a variety of ways. In most cases,
firms decide on their own metrics, programs, and report content. However,
several voluntary standards, guidelines, codes of conduct, and disclosure websites
exist which can strengthen the company’s claims of sustainability and guide their
reporting programs. Details regarding some of the most prominent programs are
discussed below. These are also summarized in Table 1.

33
Table 1 – Summary of Sustainability Reporting Organizations
Organization Type of Reporting
Worldwide No. of Participants
ISO 14001 Voluntary Standard
285,844
The Climate Registry 300
Global Reporting Initiative Guideline 6,123
Corporate Register Disclosure Website
11,215
Carbon Disclosure Project 4,112
The Ceres Principles Code of Conduct 63 Source: ThomasNet (2013), Corporate Register (2014), GRI (2014), CDP (2014), The Climate Registry (2014), and The Ceres Principles (2014)
Although the terms voluntary standards, guidelines, and codes of conduct may
sometimes be used interchangeably, there are subtle differences worth noting.
According to Herzig and Schaltegger (2011), voluntary standards are provided by
standardization bodies, governments, or NGOs. The International Organization of
Standardization is one of the most prominent certifying bodies. Standards often
require annual recertification. Guidelines are non-binding and represent an
opportunity to demonstrate a firm’s commitment to sustainability. They are also
published by governments or NGOs. Guidelines are often based on experience
and can preempt standards or regulations (Herzig and Schaltegger, 2011). The
GRI is one of the most well recognized guidelines in sustainability reporting.
Codes of conduct present opportunities for organizations to voluntarily commit to

34
acts that go beyond regulations (Ceres, 2014). They are established by
organizations that share similar values and typically outline acceptable behaviors.
2.7.1 Voluntary Standards
Two of the most prominent voluntary standards in sustainability are the ISO
14001 and AccountAbility AA1000. The Climate Registry also publishes
voluntary standards related to GHG emission reporting for businesses and
governments. Companies frequently reference The Climate Registry when
describing their GHG emission accounting processes. Following is a brief
description of each of these voluntary standards used in sustainability reporting.
The ISO 14001 voluntary standard is an important environmental management
tool and is referenced throughout the sustainability reporting literature (Daub,
2007; Jacobsen, 2011; Orsato, 2009). Companies are increasingly becoming ISO-
certified since it has become one of the principal international environmental
voluntary standards (Daub, 2007). According to the ISO website, the voluntary
standard provides guidance for implementing environmental programs within a
company or organization.
Rather than mandating specific requirements for a management system, the ISO
14001 voluntary standard solely provides guidance and direction (ISO, 2014) for
the company to choose their own systems. A critical component of the program is
to establish goals, determine appropriate metrics, and monitor progress towards
those objectives. The goal of ISO 14001 is to provide criteria that will reduce

35
environmental impacts and present a long-term vision for the future (Jacobsen,
2011). The ISO 14001 voluntary standard requires audits of the firm’s
environmental management systems, and ISO provides general guidance on
performing an audit, including auditor qualifications.
A detailed framework for verifying GHG emissions was added to the ISO 14001
voluntary standard in 2006 (Epstein, 2008). According to Epstein (2008), the
intent of the GHG verification system was to support standardization of
monitoring and reporting among organizations and to improve the reliability of
results.
Orsato (2009) explains that the benefit of the ISO 14001 certification can be two-
fold. The certification can provide a competitive advantage over rival
organizations that do not have the standard, but it can also expose weaknesses in
facility operations. The identification of these issues can ultimately improve the
company’s bottom line by reducing inefficiencies and waste.
Orsato (2009) believes that the ISO 14001 certification might have more
implications for business-to-business transactions than for consumer-facing
dealings. He points out that the standard has tangible value to suppliers. For
example, more and more large corporations, such as Ford and General Motors, are
requiring suppliers to obtain the certification in order to continue business with
their organizations. According to Orsato (2009), these larger client corporations
prefer their suppliers obtain the ISO certification because it signals they operate

36
under similar best management practices. However, he also challenges whether
ISO 14001 certification is important to the end consumer. As with other
sustainability reporting initiatives, companies that are most visible to the public
and/or utilize significant natural resources have the most to gain from the ISO
certification (Orsato, 2009).
The AccountAbility AA100 standard is also an important sustainability reporting
instrument. It was established in 2003 (Epstein, 2008) by the organization
AccountAbility and provides one of the most frequently referenced standards in
the sustainability reporting literature (see Brown et al., 2009; Epstein, 2008;
Herzig and Schaltegger, 2011; Wales, 2010). The AA1000 standard provides
assurance based on materiality, completeness, and responsiveness (Epstein, 2008).
Epstein (2008) also points out that the AA1000 standard is useful to determine
sustainability goals, identify metrics, and report on progress towards achieving
those objectives. Embedded in the AA1000 standard is also an aspect of
continuous improvement. This is completed by an increasing level of verification
and a required discussion of how the company will meet its more stringent goals
over time (Epstein, 2008).
Lastly, the non-profit Climate Registry provides standards for companies to
conduct GHG reporting. This includes the calculation and validation of GHG
emissions, as well as reporting. The purpose of the Climate Registry is to support
reduction of GHG emissions from businesses and governments, as well as provide
a one-stop repository for reporting (Climate Registry, 2014).

37
2.7.2 Guidelines
The most common global framework for sustainability reporting is the GRI
(Brown et al., 2009; Hahn and Kuhnen, 2013; Roca and Searcy, 2012;
Schaltegger et al., 2006). Although technically a guideline, the GRI is considered
the de-facto standard for sustainability reporting worldwide (Hahn and Kuhnen,
2013; Herzig and Schaltegger, 2011).
The GRI was established in 1997 through a partnership with the Coalition for
Environmentally Responsible Economies (Ceres) and the UNEP (Epstein, 2008;
Orsato, 2009). The original GRI guidelines were subsequently published in 1999
(Hahn and Kuhnen, 2013) and 2000 (Epstein, 2008) and have since undergone
multiple revisions. According to Orsato (2009), the GRI is an independent
international organization that focuses on improving and expanding the use of the
GRI guidelines. The organization, currently headquartered in Amsterdam, relies
on input from a variety of stakeholders to drive and support its mission (Orsato,
2009).
The primary purpose for developing and implementing the GRI was to provide a
single, standardized system to condense the multiple sustainability reporting
formats existing at the time. The intent was to develop a unified system that
would facilitate benchmarking and allow companies and other organizations to
compare or rank themselves (Brown et al., 2009). The secondary intent was to

38
create an environment for discussion and discourse regarding the many
sustainability initiatives undertaken by organizations (Brown et al., 2009).
There are mixed reviews regarding the efficacy of the GRI reporting process. For
example, Brown et al. (2009) suggests that the GRI has not provided the
standardization necessary for reporting that allows companies to compare
themselves and has not resulted in sufficient data quality (Brown et al., 2009).
Although the intention of the GRI was to standardize reporting, companies still
prepare significantly different reports. Additionally, large companies not only
comprise the majority of reporters, but they are mostly responsible for the
oversight and advancement of the GRI guidelines (Brown et al., 2009). Small and
medium-sized companies do not have a strong presence in the GRI system.
The GRI can be credited with increasing discussions surrounding corporate
sustainability, a key mission of the founder (Brown et al., 2009). It would be
difficult to completely dismiss the GRI as ineffective. Herzig and Schaltegger
(2011) maintain that the GRI has been credited with streamlining reporting
systems, and Brown et al. (2009) contend that within a short amount of time the
GRI has been an effective reporting tool on many different levels.
2.7.3 Codes of Conduct
The Ceres Principles represent one of the first established means for sustainability
reporting (Epstein, 2008), and is known as an environmental code of conduct.
The non-profit 501(c)(3) Ceres was established in 1989 following the Exxon

39
Valdez oil spill. According to their website, the Ceres Principles include ten
doctrines to be endorsed by the company. They include “sustainable use of
natural resources”, “reduction and disposal of wastes”, and “energy
conservation”, among others (Ceres, 2014). In addition, companies subscribing to
the Ceres Principles were required to report on their environmental programs on
an annual basis (Orsato, 2009). According to Epstein (2008), the intent of the
Ceres Principles was to develop a standardized method of collecting and sharing
information. Ceres was specifically designed to provide information to the
socially responsible investment community. Ceres and the UNEP subsequently
headed the formation of the GRI (Epstein, 2008).
2.7.4 Disclosure Websites
In addition to adhering to standards, guidelines, and codes of conduct,
organizations can utilize web-based disclosure outlets to convey their
sustainability programs. Two of the most prominent websites include the
Corporate Register and the CDP.
The Corporate Register is a private organization that provides one of the largest
sources of published sustainability reports. Reports can be collected by the
Corporate Register or provided by reporting companies. The online service
provides access to recent and archived company reports. Most of the information
is available on their website at no charge. Other services include benchmarking,
profiling, and announcement of published reports. The intent of the Corporate

40
Register is to provide a centralized location for all sustainability reports and to
promote corporate responsibility on an international scale (Corporate Register,
2014).
The CDP is an international non-profit organization developed to allow
companies and municipalities to report critical environmental data to the public
(CDP, 2014). The CDP makes requests to the largest global companies to share
information on their GHG emissions, energy use, and climate change activities
(CDP, 2014). The complete database is provided for use by all stakeholders,
including investors and municipalities. For example, investors can use the
information to minimize risks related to investments, and cities can identify
opportunities to create more resilient communities.
2.8 Summary
Sustainability reporting provides opportunities for organizations to demonstrate
commitment to environmental and social initiatives. Recent trends indicate a
significant increase in the number of reporting organizations, mostly among larger
corporations. For example, a 2004 report by UNEP/SustainAbility calculated a
600% increase in sustainability reporting in less than a decade (Stubbs et al.,
2013).
According to the literature, there is a wide variety of detail and complexity in
sustainability programs and reporting formats. Determining what to report can be
accomplished through the process of a materiality assessment. Materiality can

41
help identify opportunities to add value to the organization and address those
concerns most important to stakeholders. One of the most critical components of
sustainability reporting is the selection of appropriate metrics. Metrics allow an
organization to benchmark or measure their environmental performance over time
(Schwarz et al., 2002), convey data to stakeholders (Marshall and Brown, 2003),
and evaluate alternative initiatives and programs.
Companies can produce stand-alone reports, as well as provide sustainability-
related data in their annual reports. Reporting guidelines, such as the GRI, can
influence the content of these reports and also provide standardization. Upon
preparation of sustainability reports, independent verification should be
considered to add legitimacy to the process (Epstein, 2008; Herzig and
Schaltegger, 2011; Orsato, 2009; Schaltegger et al., 2006).
In addition to the GRI, there are several other standards, guidelines, and codes of
conduct companies can utilize to guide their sustainability reporting program.
These include ISO 14001, the Climate Registry, and the Ceres Principles, among
others. Websites, such as the Corporate Register and the CDP, assist companies
with the public disclosure of data and reports.

42
Chapter 3: Methods
The goal of this research was to quantify the number of large New England
manufacturers preparing sustainability reports, summarize the report formats,
analyze the environmental metrics presented in the reports, document the number
of verified reports and organizations, and describe how the reporting format and
depth varied by state, company size, sales volume, and the firm’s visibility in the
marketplace.
The companies used in this analysis were selected using LexisNexis Academic, an
online database which allows users to sort businesses by state. The analysis
included a search of all of New England states (Connecticut, Maine,
Massachusetts, New Hampshire, Rhode Island, and Vermont), and was limited to
a subset of companies headquartered within these locations. The analysis
includes only the manufacturing sector. The North American Industry
Classification System (NAICS) codes 31 through 33 comprise the entire
manufacturing industry and were selected using the LexisNexis Academic
database (U.S. Census, 2014).
The original intent of this project was to evaluate the top 10 manufacturers from
each of the New England states. However, after applying the search criteria
described above, four of the states (Maine, New Hampshire, Rhode Island, and
Vermont) had fewer than 10 companies in their respective state. The results for
the number of manufacturers headquartered in each state, as provided by
LexisNexis Academic are presented in Table 2 below.

43
Table 2 - Summary of Manufacturers by State
State No. of Manufacturers Headquartered in State
Connecticut 53 Maine 3 Massachusetts 136 New Hampshire 6 Rhode Island 8 Vermont 3 Source: LexisNexis Academic 2014
Based on these results, all of the companies located in Maine, New Hampshire,
Rhode Island, and Vermont were selected for analysis. The largest 15 companies
from Connecticut and Massachusetts were also chosen, based on the number of
employees.
3.1 Content Analysis
Content analysis is an empirical process of formulating results from data,
material, and other related texts (Krippendorff, 2004). According to Krippendorff
(2004), the results of a study must be replicable in order to be valid. Specifically,
data should provide the same conclusion regardless of the analyst.
After the companies were selected for analysis, an online search was conducted to
establish whether the organizations reported their sustainability initiatives and to
understand the scope of the programs. The online search included company
websites, the independent organization the Corporate Register, the non-profits the

44
CDP, the GRI, the Climate Registry, and Ceres, the International Organization for
Standardization, the CEO-led organization the World Business Council for
Sustainable Development, and government sources such as the SEC and the U.S.
Environmental Protection Agency.
Content analysis was then utilized to review the type of sustainability reports
produced (i.e. stand-alone report or portion of the annual report), the metrics and
indicators used to monitor environmental impacts, and the number of certified
businesses and reports (i.e. GRI or ISO 14001-certified). The data variables
included in the analysis are summarized in Table 3 below.
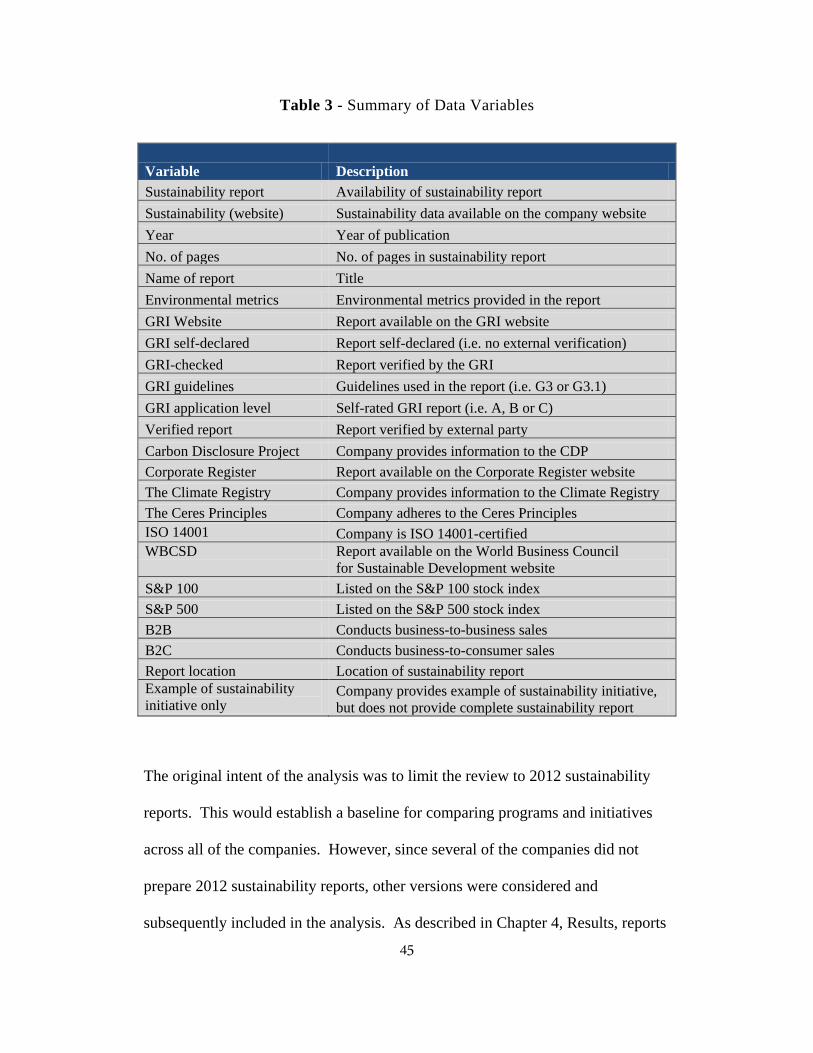
45
Table 3 - Summary of Data Variables
Variable Description Sustainability report Availability of sustainability report Sustainability (website) Sustainability data available on the company website Year Year of publication No. of pages No. of pages in sustainability report Name of report Title Environmental metrics Environmental metrics provided in the report GRI Website Report available on the GRI website GRI self-declared Report self-declared (i.e. no external verification) GRI-checked Report verified by the GRI GRI guidelines Guidelines used in the report (i.e. G3 or G3.1) GRI application level Self-rated GRI report (i.e. A, B or C) Verified report Report verified by external party Carbon Disclosure Project Company provides information to the CDP Corporate Register Report available on the Corporate Register website The Climate Registry Company provides information to the Climate Registry The Ceres Principles Company adheres to the Ceres Principles ISO 14001 Company is ISO 14001-certified WBCSD Report available on the World Business Council
for Sustainable Development website S&P 100 Listed on the S&P 100 stock index S&P 500 Listed on the S&P 500 stock index B2B Conducts business-to-business sales B2C Conducts business-to-consumer sales Report location Location of sustainability report Example of sustainability initiative only
Company provides example of sustainability initiative, but does not provide complete sustainability report
The original intent of the analysis was to limit the review to 2012 sustainability
reports. This would establish a baseline for comparing programs and initiatives
across all of the companies. However, since several of the companies did not
prepare 2012 sustainability reports, other versions were considered and
subsequently included in the analysis. As described in Chapter 4, Results, reports
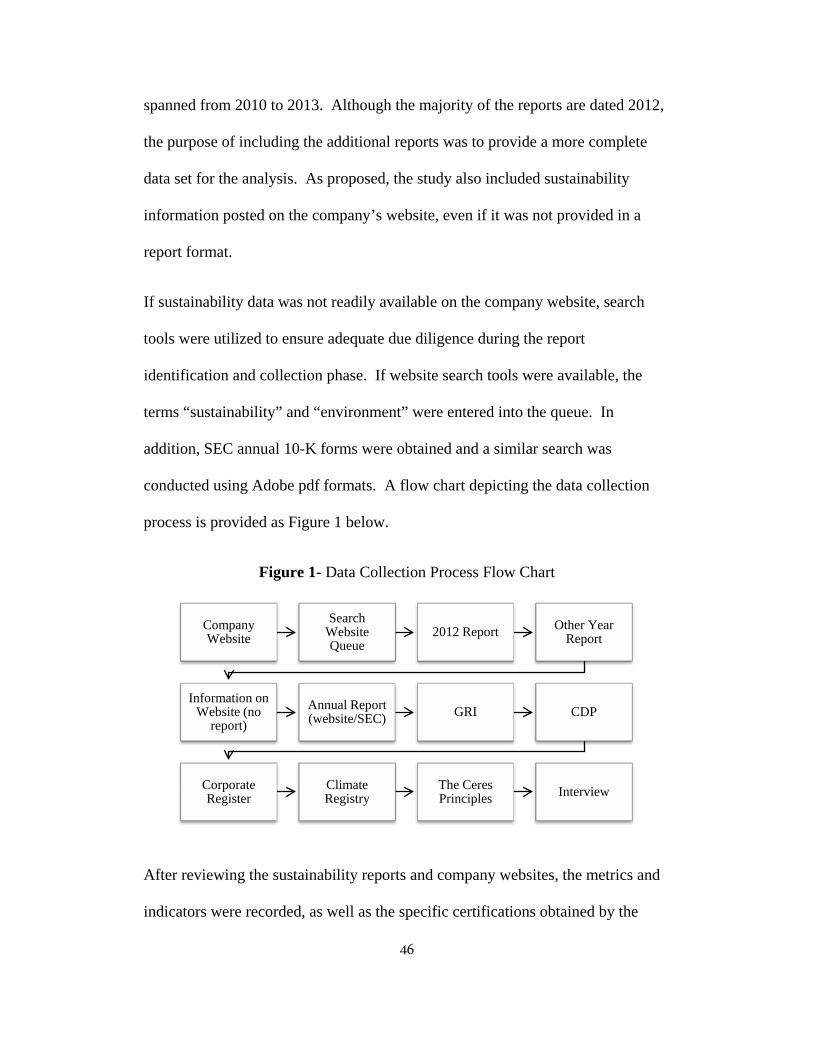
46
spanned from 2010 to 2013. Although the majority of the reports are dated 2012,
the purpose of including the additional reports was to provide a more complete
data set for the analysis. As proposed, the study also included sustainability
information posted on the company’s website, even if it was not provided in a
report format.
If sustainability data was not readily available on the company website, search
tools were utilized to ensure adequate due diligence during the report
identification and collection phase. If website search tools were available, the
terms “sustainability” and “environment” were entered into the queue. In
addition, SEC annual 10-K forms were obtained and a similar search was
conducted using Adobe pdf formats. A flow chart depicting the data collection
process is provided as Figure 1 below.
Figure 1- Data Collection Process Flow Chart
After reviewing the sustainability reports and company websites, the metrics and
indicators were recorded, as well as the specific certifications obtained by the
Company Website
Search Website Queue
2012 Report Other Year Report
Information on Website (no
report) Annual Report (website/SEC) GRI CDP
Corporate Register
Climate Registry
The Ceres Principles Interview

47
business. It was also noted whether the report was verified by a third party. The
results of the analysis are presented in Chapter 4, Results.
3.2 Interviews
In addition to the content analysis, interviews were conducted to ensure thorough
data collection and provide additional insight to the research. According to the
IRB office, no approval or exemption status was necessary based on the type of
questions proposed for the interview. Companies that did not have information
regarding sustainability programs on their websites or other public sources were
identified for interviews.
Selected companies were contacted and an appropriate representative, such as a
compliance or sustainability officer or health and safety professional was
requested for interview. In some cases, correspondence was also conducted via
email. The primary purpose of the interviews was to confirm that sustainability
reporting data was not available for the specific organization. The secondary
intent was to discuss whether the company had internal sustainability programs or
if they would consider reporting in the future. If the company did not have any
sustainability programs, the purpose of the interviews was to discuss whether
stakeholders were asking for these initiatives and to identify obstacles that might
be preventing the start-up of such programs. Based on the potentially sensitive
nature of the discussions, it was decided that the companies and individuals
involved in the interviews would remain anonymous. A complete copy of the
company questionnaire is provided in Appendix A.

48
Both the content analysis and company interviews provided important
information regarding the types of sustainability initiatives existing among the
sampled New England manufacturers, the number of certified businesses and
reports, the metrics and indicators utilized, the scale of adoption, and insight into
companies without sustainability reporting programs. The results of the content
analysis and interviews are included in Chapter 4, Results.

49
Chapter 4: Results
As described in the Methods, a total of 50 New England manufacturers were
originally identified for analysis. During the content analysis, it was necessary to
make a few changes to the sample of companies involved in the study. For
example, one of the organizations originally identified as headquartered in Maine
was actually a Canadian-based company. Therefore, the company was not
included in the analysis. In addition, three organizations (one each from
Massachusetts, Rhode Island, and Vermont) had been subsequently purchased by
another company and were removed from the analysis. To maintain a total of 15
organizations from Massachusetts, the next largest company (based on the
number of employees) was selected using the LexisNexis database. According to
LexisNexis, there were 136 manufacturers headquartered in Massachusetts at the
time of the study. Since all of the manufacturers from Rhode Island and Vermont
were already included in this analysis, no other potential companies could be
added to replace the two firms removed from the analysis. After these
considerations, a total of 47 companies were included in the study. The total
number of organizations analyzed by state is provided in Table 4 below.

50
Table 4 - Number of Manufacturers Analyzed by State
State No. of Manufacturers
Connecticut 15 Maine 2 Massachusetts 15 New Hampshire 6 Rhode Island 7 Vermont 2 Total 47
4.1 Reporting Companies by State
As described in detail below, the company’s size and sales revenue were relevant
to participation in sustainability reporting for the sample of large New England
manufacturers. Following is a state-by-state description of company profiles and
the number of organizations reporting their environmental initiatives. Table 5
summarizes the median sales and number of employees for manufacturers by
state, as well as the number and percentage of companies preparing sustainability
reports.

51
Table 5 - Summary of Company Characteristics and Reporting by State
State Median Sales (USD)
Median No. Employees
No. Reporting
% Reporting
Connecticut 4,292,065,000 14,300 8 53 Massachusetts 2,701,142,000 6,850 12 80 Vermont 1,932,249,000 2,965 2 100 Maine 649,363,970 2,713 0 0 Rhode Island 180,508,000 1,030 2 29 New Hampshire 21,089,500 139 0 0 Total 2,400,000,000 5,900 24 51 Source: LexisNexis Academic 2014
The median sales revenue of the sample companies headquartered in Connecticut
was over $4.2 billion and the median number of employees was 14,300, which is
the highest of the New England states. Based on the analysis, approximately 53%
of the study companies in Connecticut produced sustainability reports. The
Massachusetts sample companies had the second highest median sales revenue
and number of employees by state with approximately $2.7 billion in sales and
6,850 employees. Approximately 80% of the sample companies headquartered in
Massachusetts produced sustainability reports. Both of the sample companies
from Vermont participated in sustainability reporting. One organization had sales
revenue of $3.8 billion and had 5,800 employees. The other company had sales
revenue of $5.3 million and had 130 employees.

52
None of the sample companies headquartered in Maine participated in
sustainability reporting. One organization had sales revenue of $1.3 billion and
had 5,400 employees. The other sample company had sales revenue of $5.4
million and had 25 employees. Approximately 29% of the sample companies
headquartered in Rhode Island produced sustainability reports. The median sales
revenue was $180,508,000 and the median number of employees was 1,030.
Three sample organizations had sales over $1 billion and four companies had
greater than 1,000 employees.
None of the sample companies headquartered in New Hampshire produced
sustainability reports. All six of the sample companies had annual sales of less
than $1 billion each. The median sales revenue in New Hampshire was $21.1
million. Two of the New Hampshire sample companies had greater than 1,000
employees. The median number of employees was 139.
In summary, based on the content analysis, a total of 24 sample companies
(approximately 51% of all companies) prepared publicly-available sustainability
reports. In addition to the reporting companies, an additional seven organizations
(approximately 15% of all companies) provided an example of a sustainability
initiative undertaken by their companies either on their website or in their annual
report. The initiatives provided examples of how the company was
accomplishing a specific sustainability goal, such as the amount of energy saved
from installing LED lighting. However, aside from the specific initiative, no

53
other metrics or indicators were located for these seven organizations and no
sustainability report was provided.
Companies in Connecticut, Massachusetts, and Vermont produced the majority of
the sustainability reports (approximately 92%) in this analysis. Companies in
these states also had the greatest median sales revenue and the highest number of
employees. The median sales revenue among study companies in all of these
three states was over $1 billion and the median number of employees was greater
than 1,000. The companies with the least amount of reporting (Maine, New
Hampshire, and Rhode Island) all had median sales revenue below $1 billion.
Note that none of the study companies in Maine or New Hampshire prepared
sustainability reports.
4.2 Reporting Company Statistics
4.2.1 Company Size
Companies in this analysis ranged in size from 2 to 212,000 employees. The
median size was 5,900 employees. With the exception of one company, only
organizations with greater than 1,000 employees produced a sustainability report.
The single reporting company with fewer than 1,000 employees was a small
Vermont-based business-to-consumer (B2C) organization, Seventh Generation.
Based on their website and stated mission to consider the next seven generations,
sustainability could be considered critical to their brand and identity. A figure

54
indicating the percentage of reporting companies based on the number of
employees is included in Figure 2 below.
Figure 2- Reporting by No. of Employees
4.2.2 Revenue
Annual sales revenue ranged from $42,254 to $57.7 billion. The median was $2.4
billion. All seven companies with annual revenue greater than $10 billion
produced sustainability reports. Approximately 68% of the companies with
annual revenue greater than $1 billion produced sustainability reports.
Alternatively, thirteen organizations had less than $1 billion in annual revenue.
Of these companies, only one (Seventh Generation) produced a sustainability
report. A figure displaying the percentage of reporting companies based on 2012
annual sales revenue is included as Figure 3 below.
11%
56% 54%
33%
90%
0%
25%
50%
75%
100%
<1,000 1,000-5,000 5,000-10,000 10,000-25,000 >25,000
Perc
enta
ge o
f Rep
ortin
g
No. of Employees

55
Figure 3 - Reporting by Annual Revenue
4.2.3 Stock Indices
Seventeen of the organizations in this analysis were part of the Standard and
Poor’s (S&P) 500 stock market index. Three of these companies were also part of
the S&P 100. All of the S&P 100 companies produced sustainability reports.
Sixteen of the seventeen companies (approximately 94%) listed on the S&P 500
produced sustainability reports. The number of reporting companies in this
analysis is well above average for S&P 500 listed firms, which was only 53% in
2012 (Governance and Accountability Institute, 2014). However, it is important
to note that this analysis only includes manufacturers, and the S&P 100 and 500
indices include companies from all industries.
8%
25%
69% 71%
100%
0%
25%
50%
75%
100%
<1 1-1.5 1.5-4 4-10 >10
Perc
enta
ge o
f Rep
ortin
g
Annual Sales Revenue (billions)

56
4.2.4 Business to Business vs. Business to Consumer
The majority of the companies in this analysis (approximately 77%) could be
described as business-to-business (B2B) firms. These organizations sell products
and services to other companies. Approximately 15% are B2C and market goods
and services directly to consumers. The remaining 8% could be considered both
B2B and B2C. Companies were identified as B2B or B2C based on a review of
their website and the products and services provided by the organization. Of the
B2C firms, approximately 71% produced sustainability reports. Of the B2B
companies, approximately 50% produced sustainability reports. Of the
companies identified as both B2B and B2C, approximately 50% produced
sustainability reports.
4.3 Report Characteristics
The majority of the reports (approximately 92%) were stand-alone sustainability
reports. Only two of the documents were combined annual and sustainability
reports. In one case, a company provided both a “Report on Global Citizenship”
and an “Environment, Health and Safety Report”. Relevant data for this project
was obtained from both of these documents. The titles and names of the
sustainability reports varied among corporations. A list of the report titles is
provided in Table 6 below. Reports ranged from three to 147 pages in length.
The median length was 75 pages. A total of 16 reports were dated 2012. Seven
of the reports were utilized from other years, ranging from 2010 to 2013. The
reports for these years were utilized only when a 2012 version was not available.

57
One company provided 2012 data and metrics on their website, but did not
produce a report.
Table 6 - Summary of Report Titles
Report Title No. of Reports
Sustainability Report 8 Corporate Responsibility Report 4 Corporate Social Responsibility Report 2 Corporate Citizenship Report 2 Corporate Social Responsibility Annual Report 1 Annual Report 1 Corporate Consciousness Report 1 Global Sustainability Report 1 Annual Report Financial and Corporate Responsibility Performance 1 Report on Global Citizenship, Environment, Health and Safety Report 1 Sustainable Development Report 1
4.4 Reporting Venues and Certifications
Content analysis was utilized to identify the most prominent reporting venues for
sustainability programs, as well as the percent of certified reports. Based on this
analysis, the most commonly used websites were the Corporate Register, the GRI,
and the CDP. A summary of these findings is provided in Table 7 below. Of the
24 sustainability reports found in this analysis, the majority (approximately 92%)
could be located on the Corporate Register website.
Approximately 75% of the reporting organizations in this analysis utilized the
GRI website as a reporting venue at one point in time. The availability of reports
was not always consistent from year to year. Approximately 54% of the reporting

58
organizations utilized the CDP website as a tool to report their sustainability
metrics and data, and approximately 8% subscribed to the Ceres Principles. Of
the 24 reports analyzed, 33% were verified by the GRI or other third-party
certifying organization.
In addition to evaluating sustainability reporting venues, this analysis considered
the extent of ISO 14001-certified organizations. A total of 32% of the
organizations included in this analysis were ISO 14001-certified. In some cases,
only a limited number of facilities were certified within an organization.
However, for this analysis companies were considered ISO-certified if any of
their facilities had obtained the certification.
Table 7 - Summary of Reporting Venues and Certifications
Reporting Platform/Certification No. of Companies
% of Companies
Corporate Register 22 92 Global Reporting Initiative 18 75 Carbon Disclosure Project 13 54 ISO 14001 15 326 The Ceres Principles 2 8 The Climate Registry 0 0
6 Note that 32% of all 47 companies analyzed were ISO 14001-certified. The remaining percentages in Table 7 are based on the number of reporting organizations in the study. In this analysis, there were 24 organizations that prepared a sustainability report.

59
4.5 Metrics
Based on the content analysis, a total of 139 environmental metrics and indicators
were identified in the reviewed sustainability reports. Of these, a total of 66 were
used in only one report, and 22 indicators were found in only two documents. A
complete list of the metrics and the number of times used in the sustainability
reports is included in Appendix B. Of the 139 metrics, a total of 31 were GRI-
specific indicators. Metrics that were identified in at least ten sustainability
reports are summarized in Table 8 below. Of these 11 most commonly used
metrics, five are GRI indicators from the GRI Guidelines.
Table 8 - Summary of Top Environmental Metrics
Environmental Metric GRI Index
No. of Reports
% of Reports
Total GHG emissions by weight EN16 17 71 Total water use
13 54
Scope 1 GHG emissions
11 46 Scope 2 GHG emissions
11 46
Solid waste recycled
11 46 Total energy consumption
10 42
Energy intensity
10 42 Direct energy consumption by primary source EN3 10 42 Indirect energy consumption by primary source EN4 10 42 Energy saved due to conservation and efficiencies EN5 10 42 Initiatives to mitigate environmental impact of products and services, extent of mitigation
EN26 10 42
As shown in Table 8, GHG emission reporting is the most common metric among
the reviewed sustainability reports and appears in approximately 71% of reports.

60
Total water use is the second most frequently-used environmental indicator and
was found in approximately 54% of the reports. Scope 1 and 2 emissions and
solid waste recycled are utilized in almost half of the reports (approximately
46%), and the remaining six indicators appear in approximately 42% of the
reports.7
4.6 Interviews
Based on the results of the content analysis, a total of 23 companies were
identified for phone interviews due to the absence of web-based information.
This represented approximately 49% of all of the companies included in this
study. The companies were contacted to determine if they had sustainability
programs or reporting systems in place, or were considering implementing these
initiatives in the future. The information was also used to add depth of
understanding surrounding the lack of sustainability reporting among the largest
New England manufacturers. The interviews were conducted between May 28
and August 5, 2014.
A total of three attempts were made to speak with appropriate representatives who
could discuss sustainability initiatives within their organizations. A combination
of email and phone calls were utilized to locate the representatives. The response
rate for the request for information regarding the company’s sustainability
7 Note that these percentages are based on the number of reporting organizations, not the entire sample population.

61
programs was approximately 65%. This included information provided by the
receptionist, sales staff, and facilities personnel, among others. Five in-depth
interviews were conducted with environmental professionals within the
organizations.
4.6.1 Sustainability Initiatives
Of the interviewed companies that provided information, approximately 33% had
some form of sustainability initiative in place. In most cases, however, the
company did not officially consider the activity a sustainability initiative. The
activities were completed simply because they saved money or were considered
an industry standard. As explained by one interviewee, there was no company-
wide mandate to implement sustainability programs. The initiatives included
recycling, minimization and proper disposal of waste, utilization of
environmentally friendly materials for manufacturing, reduction of waste
transported to landfills, and continuous improvement processes related to
environmental management systems.
4.6.2 Reasons for Not Implementing Sustainability Programs
When asked if the company lacked resources to implement a sustainability
program, one interviewee responded that it was not a question of resources, it was
a lack of a dedicated role or responsibility. He further noted that there was no
incentive for an employee to take on additional responsibilities outside his or her
assigned role. The majority of the companies interviewed were B2B
62
organizations. Several interviewees pointed out that sustainability appeared to be
more important for B2C companies, where products were directly marketed to the
end consumer. Furthermore, one of the interviewees suggested that larger
companies (unlike his business) were more likely to have sustainability programs
since they encountered more pressure from stakeholders.
Two of the companies shared that they were much more concerned about
financial stability and performance than sustainability programs, and one of these
specifically pointed out that their investors were only interested in financial
performance.
4.6.3 Future Sustainability Programs
Two of the organizations indicated that they were currently working on instituting
a sustainability program within their organization. A third company reported that
they were taking a close look at their green initiatives currently underway and
evaluating how they might fit into a sustainability program. This interviewee
indicated that the company was planning to start meeting this year to consider
where they were currently, and where they want to be in the future. The
company stated that they do not want to implement sustainability programs
simply because everybody else is doing it. That being said, the company was
looking to start recording and reporting data internally to help evaluate where they
were with compliance and sustainability initiatives. A fourth company was in the
process of looking at their long-term strategic goals and would consider whether
sustainability fit into their business plan.

63
4.6.4 Sustainability Reporting
Based on the outcome of the interviews, only one company participated in
sustainability reporting. The firm provided responses to the CDP however they
did not prepare a sustainability report. In addition, five of the companies
interviewed provided an example of a sustainability initiative on their website or
in the annual report. Of the companies interviewed, one indicated that they will
be reporting sustainability data in the future, and that they were considering using
the GRI or CDP as a reporting platform. Another organization indicated that it
reported data to an industry-specific organization. However, this information was
not available to the public. Another organization reported that they were going to
begin recording data internally to help them assess how their current green
initiatives could be leveraged to create a sustainability program. A fourth firm
mentioned that the level of reporting and transparency was to be determined,
based on senior management and the direction of the CEO. A fifth company
indicated that they were looking to expand the scope of their internal reporting
across their various manufacturing locations. The firm was also working to
evaluate and report on the environmental impact of activities that occurred
upstream of their manufacturing operations. For example, the company was
concerned with the impacts of transportation of raw materials to their
manufacturing facility. Lastly, one interviewee indicated that their organization
had no sustainability reporting planned for the future.

64
4.6.5 Stakeholders
During the interviews, there was lack of consensus on the importance of
sustainability programs to investors. One company shared that their investors
were only interested in financial performance. Another firm indicated that they
have had investor inquiries regarding their sustainability program. Overall, there
appeared to be at least some interest from stakeholders. One company mentioned
that their European customers have been asking for their sustainability programs.
One of the organizations provided materials and components to other firms within
the supply chain. They indicated that they were receiving pressure from their
clients, often larger companies, to implement sustainability programs within their
organization. Specifically, their clients were looking for environmental
management programs (such as ISO-certifications) and continuous improvement
policies rather than explicit metrics or sustainability programs.
4.6.6 Regulatory Compliance
During the in-depth interviews, three of the four companies discussed that they
were more focused on evaluating their regulatory compliance than implementing
voluntary sustainability measures. The representatives indicated that their first
responsibility was to ensure the company was in compliance with the law,
including environmental health and safety regulations. In most cases,
sustainability programs were considered beyond compliance initiatives to be
considered only as additional time and resources permitted. One interviewee

65
pointed to the increasing regulations for sustainability programs in Europe. The
representative indicated that some companies expect these regulations could also
be implemented in the U.S.
4.6.7 Manufacturing and Contract Manufacturers
Approximately 42% of the companies contacted indicated that their
manufacturing and production occurred overseas. Several interviewees noted the
small number of staff located within their U.S. offices. In most cases, domestic
staff was limited to financial, sales, and investor relations personnel. None of
these organizations appeared to have an environmental group or related
professional working within their company. When asked if they would consider
pressuring their contract manufacturers to implement sustainability programs, one
company responded that they were more concerned with sustaining their own
company. The majority of interviewees were quick to suggest they had no ability
to influence their contractors. Furthermore, since their production occurred
overseas, these companies saw no reason to have an in-house sustainability
program.
One organization indicated that it had decentralized operations, meaning that all
of the smaller companies within the firm had a significant amount of autonomy.
These smaller companies had the freedom to operate their businesses as they saw
fit, including whether or not they adopted sustainability programs.

66
Chapter 5: Discussion and Recommendations
Sustainability and associated reporting of environmental and social indicators are
increasing among corporations. Sustainability initiatives can provide
opportunities for companies to become more efficient, use less resources,
minimize environmental impacts, and increase competitiveness. Reporting
provides an opportunity for companies to communicate these initiatives to
stakeholders and the public, thereby improving reputation and branding.
Due to the value of the material published in sustainability reports and a desire to
summarize and understand these documents, several studies (see Cowan, Dopart,
Ferracini, Sahmel, Merryman, Gaffney and Paustenbach, 2010; Leszcynska,
2012; Marshall and Brown, 2003; Roca and Searcy, 2012) have been conducted
of company reports. However, compared to the extensive literature on corporate
sustainability reporting, empirical studies represent only a fraction of the available
information. This thesis was completed to contribute to the comparatively limited
number of empirical studies, and to investigate the prevalence of sustainability
reporting among top New England manufacturers. This chapter provides a
discussion of the findings, as well as several recommendations to increase the use
of sustainability reporting. A table summarizing the recommendations is
provided in Appendix C.
Previous studies mentioned above provide analysis of company reports on a
national and international scale. However, this thesis drills down beyond the
national scale to provide analysis of companies’ sustainability initiatives at the

67
state and regional levels. In the future, additional research could drill down even
further to the municipal level to understand what local companies are reporting
with regards to environmental metrics.
Previous sustainability reporting research (see Cowan et al., 2010; Marshall and
Brown, 2003; Roca and Searcy, 2012) is primarily limited to stand-alone reports.
This research includes an analysis of annual reports, company websites, and
numerous public disclosure databases, in addition to stand-alone reports. Only
one other analysis identified during the literature review8, collected reporting data
from public databases.
During the review of the literature, several studies (see Gunasekaran and
Spalanzani, 2010; Roca and Searcy, 2012) posited that additional research is
needed to fully understand what companies are measuring and reporting. Based
on the database of metrics included in this thesis, it is anticipated that this analysis
will provide an understanding of topics material to corporations and will
contribute to the research of sustainability indicators.
This thesis included analysis of 47 top manufacturers in New England. The
manufacturing sector was selected due to its intense resource requirements, high
energy and water demands, and potential for significant waste generation. Based
on these assumptions, implementing sustainability initiatives within the
8 The analysis was conducted by Leszczynska (2012) and included a review of unspecified databases.

68
manufacturing industry could provide additional means to protect natural
resources and improve waste management systems, among other positive
environmental benefits.
The results of the analysis indicated that 24 of the 47 manufacturers
(approximately 51%) prepared sustainability reports between 2010 and 2013. An
additional seven organizations (approximately 15%) provided examples of
sustainability initiatives on their websites or in their annual reports without
committing to a full reporting program. This last finding could indicate
companies’ awareness of the importance of sustainability reporting and may
signal a commitment to full sustainability reporting programs in the future. In
summary, organizations were at various stages of reporting, from providing
examples of sustainability initiatives (such as installing LED lighting), to
comprehensive sustainability programs with report verification and auditing
systems. Based on these results, additional research could be conducted to
understand how to encourage other New England manufacturers to measure and
report environmental indicators.
Based on the literature, large, multinational corporations comprise the majority of
reporting organizations (Marshall and Brown, 2003; Stubbs et al., 2013). This
research is consistent with the literature in that 77% of reporters in this analysis
were large business-to-business organizations. Specifically, the median sales
revenue of the corporations was $2.4 billion and the number of employees was

69
5,900. With the exception of one company, all reporting organizations had annual
sales revenue over $1 billion and employed more than 1,000 employees.
Based on these results, there is a clear need to consider alternatives to expand
sustainability programs and reporting to small and medium-sized manufacturers
in the New England region. Interviews and additional research could be
conducted to understand challenges specifically facing small businesses and the
adoption of sustainability reporting practices within these organizations.
Information could also be collected to understand how information sharing might
be utilized by companies to expand the process of reporting. For example,
information sharing programs are utilized by municipalities and could provide a
model for understanding sustainability initiatives underway at other organizations.
The U.S. Conference of Mayors Climate Protection Center is an example of a
successful organization that supports municipal leaders in their effort to reduce
GHG emissions and provides opportunities for information sharing. Similar
centers could be established to promote relationships between governments and
corporations and could educate small business owners on the tools necessary for
reporting, as well as the potential fiscal and branding opportunities of corporate
sustainability reporting programs.
Approximately 36% of the New England companies included in this analysis
were listed on the S&P 500 stock index. Of these, approximately 94% prepared
sustainability reports. According to data provided by the Governance and
Accountability Institute (2014), approximately 53% of all S&P 500 companies

70
prepared sustainability reports in 2012 (including all industry sectors). Based on
this information, the number of New England-based S&P 500 manufacturers
disclosing sustainability-related information is significantly greater than the
overall S&P 500 index. Due to their intense use of resources and potential for
generating large volumes of waste and emissions, large manufacturers are often
heavily scrutinized by stakeholders and the general public. To address this issue,
large manufacturers may seek to counter negative images by preparing
sustainability reports to demonstrate their commitment to the environment. This
could help explain the large discrepancy between the numbers of New England
manufacturers reporting as compared to the overall S&P 500 index.
The New England states with the greatest percentage of sustainability reporting in
this analysis included Vermont, Massachusetts, and Connecticut. Over half of the
manufacturers sampled in each of these states published sustainability reports.
Approximately one-third of the sampled companies in Rhode Island prepared
sustainability reports, and none of the sampled businesses in Maine or New
Hampshire published reports. As noted in the literature and corroborated with
this research, the lack of sustainability reporting in these states may be related to
the size and sales revenue of the manufacturers located in these states. This
suggests that Maine and New Hampshire policy makers and government might
facilitate reporting by partnering with businesses to provide opportunities for
these companies to participate in sustainability reporting. This is especially true
for small and medium-sized businesses that are mostly absent from reporting.

71
The majority of the sustainability reports in this analysis (approximately 92%)
were stand-alone documents. Two reports were combined annual and
sustainability reports. One organization provided sustainability data on their
website in lieu of a stand-alone or annual report. The reports varied considerably
in language, length, and use of environmental indicators. For example, a total of
139 environmental metrics were identified among 24 sustainability reports. Roca
and Searcy (2012) found similar results in terms of the lack of reporting
standardization during an analysis of 94 Canadian companies. Their analysis
revealed a total of 585 different metrics9 were utilized by companies in their
sustainability reporting (Roca and Searcy, 2012). The wide range of indicators in
this thesis and Roca and Searcy’s analysis mirror the results of the literature
which conclude that standardization of metrics and indicators represents one of
the greatest challenges to reporting (see Brown et al., 2009). Standardization is
necessary to benchmark against goals, compare results across companies or
geographical boundaries, and permit auditors to verify report contents. Already
accepted as the de-facto standard for sustainability reporting (Hahn and Kuhnen,
2013; Herzig and Schaltegger, 2011), the GRI provides some level of
standardization and should be expanded throughout the business community.
Based on this analysis, approximately 33% of the sustainability reports were
verified by an external certification body such as the GRI or the private
9 Note that Roca and Searcy’s analysis included social and economic indicators in addition to environmental metrics. This thesis included analysis of environmental metrics only.

72
accounting firm Trucost. According to the literature, external verification in the
U.S. is remarkably low with estimates ranging from 3% (Brown et al., 2009) to
14% (Herzig and Schaltegger, 2011). Based on this data, the number of verified
reports prepared by New England manufacturers is significantly above the
national average. Although this finding is encouraging, it is still critical to expand
the number of verified reports since the process of assurance provides legitimacy
to sustainability reporting programs (Epstein, 2008; Herzig and Schaltegger,
2011; Schaltegger et al., 2006).
To increase report verification, organizations such as the GRI could require that
all companies provide external assurance of their report and content after a
predetermined number of years of following their guidelines. For example, a
grace period of one to two years could be provided to encourage companies to
report and allow them time to solidify their environmental management systems.
Following the grace period, all companies would be required to verify their report
and contents.
The most common environmental indicator among reports was total GHG
emissions, monitored by approximately 71% of the reporting companies (see
Table 8). Total water use was the second most common indicator, with
approximately 54% of the reporting companies providing this information. Scope
one and two emissions and solid waste recycling were measured by
approximately 46% of the reporting companies. Interestingly, Cowan et al.
(2010) conducted an analysis of sustainability reports from the five largest U.S.

73
companies10 from each industrial sector and found fairly similar results. Their
results indicated GHG emissions were reported by 69% of the companies and
water use was measured by 61% of the firms. A striking difference in the results
however is that the top metric identified by Cowan et al.’s research was energy
consumption, reported by 72% of the companies. Only 42% of firms studied in
this thesis reported energy consumption. As noted by Cowan et al. (2010), it is
not surprising that most of the companies in their analysis reported energy
consumption. By measuring energy, firms can benchmark and begin to reduce
their consumption which can have substantial financial benefits, as well as reduce
uncertainties surrounding fossil fuel availability. Based on these results,
significant opportunities likely exist to expand the number of New England
manufacturers measuring energy consumption within their facilities.
An analysis of sustainability reports, including environmental indicators, was also
conducted by Leszczynkska (2012)11. The study included a review of
multinational corporations between 2005 and 2010. The results also indicated
that energy, water consumption, and CO2 emissions were the most common
metrics provided in the reports.
10 The 130 companies were based on the Forbes Global 2000 list through 2009. The Forbes Global 2000 list includes an annual ranking of the world’s largest public companies based on sales, profitability, value, and assets (Cowan et al., 2010). The rankings began in 2004. 11 This study included a review of 29 sustainability reports prepared by multinational corporations during the years 2005 and 2010. The primary purpose of the study was to evaluate trends in report quality, complexity, and stakeholder value between 2005 and 2010. The reports were specifically collected from international companies.
74
As discussed above, the most common metric reported by New England
manufacturers in this study was GHG emissions. A potential explanation for this
result could be due to the GHG reporting required in some jurisdictions. For
example, large emitters in Massachusetts are required to report GHG emissions to
the Massachusetts Department of Environmental Protection on an annual basis
(MassDEP, 2014). Companies not currently mandated to report under state
regulations might also consider implementing GHG reporting programs to
preempt future potential regulations. In addition, companies may understand the
potential impacts of climate change on their business operations and recognize
their responsibility to reduce GHG emissions.
The majority of sustainability reports (approximately 92%) in this study could be
found on the independent Corporate Register website. Approximately 75% of the
reports were available on the GRI website, however only 44% of these were
verified GRI reports. The remaining reports were non-GRI, self-declared, or
GRI-referenced documents. A total of 54% of the reporting companies utilized
the CDP to post environmental sustainability-related data. Of the 47 companies
analyzed, approximately 32% were ISO 14001-certified.12. Cowan et al. (2010)
found the same results during their analysis of sustainability programs. Their
research also showed that 32% of the 130 U.S. companies analyzed were ISO
12 In this thesis, companies were considered ISO 14001-certified if any of their facilities had obtained the designation. In some cases, not all facilities within an organization were ISO 14001-certified. It is not uncommon for companies to quantify how many of their facilities are ISO 14001-certified.

75
14001-certified.13 Although the number of New England manufacturers with the
ISO 14001 designation was comparable to the findings by Cowan et al. (2010),
expansion of the ISO 14001 standard would likely be beneficial to these
organizations. For example, the ISO 14001 standard requires corporations to
develop an environmental management system and focuses on continuous
improvement processes. Due to the customization of the standard14, the ISO
14001 program can help businesses become more efficient and reduce liabilities
associated with environmental externalities. According to the literature, the ISO
14001 standard is also increasingly becoming a necessity to conduct business, as
large companies are requiring their suppliers to obtain the certification. This will
be an important consideration for New England manufacturers going forward to
ensure they remain competitive in the global economy.
5.1 Company Interviews
After completion of the content analysis, 23 companies (approximately 49%)
were identified for phone interviews. Companies were contacted when no
information could be located regarding sustainability programs within their
organization. The response rate from the interviews was approximately 65%. Of
13 Cowan et al.’s (2010) research does not specify whether companies were considered ISO 14001-certified if any of their facilities had obtained the standard, or if all locations were required to have the standard to be considered ISO 14001-certified. 14 Although the ISO 14001 standard allows for customization of environmental management systems, reporting standardization could be accomplished through mandating specific methodology and reporting requirements. A full discussion of this standard is outside the scope of this research.

76
these companies, approximately 33% had some form of sustainability initiative in
place. Two of the companies indicated that they were in the process of
implementing a sustainability program, and two other firms were taking a close
look to consider whether such initiatives would align with their business model.
One organization reported data to the CDP but did not produce a sustainability
report. In summary, firms were at various stages of reporting including collecting
data internally, reporting to industry-specific organizations or the CDP, or
preparing to report in the future.
Approximately 42% of the companies interviewed indicated that their production
and manufacturing occurred overseas. In several cases, domestic staff was
limited to sales and investor relations personnel. During the interviews, overseas
manufacturing was a frequent response to explain the lack of sustainability
reporting within their organization. This suggests that opportunities exist for
manufacturers and buyers to work with their suppliers and contractors to establish
sustainability reporting guidelines. Suppliers with robust environmental and
sustainability programs minimize risk to their organizations (see Gunasekaran and
Spalanzani, 2012; Herzig and Schaltegger, 2011; Orsato, 2009; Wales, 2010), as
well as to their buyers. For example, sustainability guidelines can ensure
suppliers and contractors are using resources in a sustainable manner and can
reduce the likelihood of environmental fines, penalties, or supply disruptions.
During the interviews, there was mixed consensus on the importance of
sustainability reporting to stakeholders. Some of the companies reported interest

77
from stakeholders, and others maintained that financial performance was the only
driver within their organization. Brown et al. (2009) corroborates the latter view.
However, other researchers suggest that sustainability reporting promotes
transparency, which is critical to investors (see Epstein, 2008; Herzig and
Schaltegger, 2011). Additional research could be conducted to fully understand
the value of sustainability reporting to stakeholders, including investors and
consumers.

78
Chapter 6: Conclusion
Corporations are increasingly adopting sustainable development principles, often
referred to as “sustainability”, and reporting these initiatives to the public to add
economic and reputational value to their organization. Due to the importance of
sustainability to the corporation, community, and the environment, this research
was undertaken to extend the literature on sustainability reporting and to
understand the programs employed by top New England manufacturers.
Content analysis and interviews were utilized to review 47 publicly-traded
manufacturers in the New England region. The findings indicated that
approximately half of the companies prepared sustainability reports. The majority
of reporting organizations had annual sales revenue over $1 billion and employed
more than 1,000 workers. A total of 139 different environmental metrics were
utilized, and approximately one third of the reports were verified by an external
source. Numerous reporting mechanisms and voluntary standards, such as the
GRI, ISO 14001, and the CDP were employed by organizations.
The wide variety of formats and complexity found during this research
underscores the need for report standardization and increased verification.
Opportunities also exist to develop and expand sustainability reporting programs
among New England manufacturers. The prevalence of large organizations
indicates that specific consideration should be given to smaller companies, who
are mostly absent from the sustainability reporting process.

79
Understanding the extent of sustainability reporting in New England provides
valuable information as to what companies are disclosing. This data could
influence policies to address issues such as climate change, water scarcity, finite
materials and resources, environmental pollution, and surpassed landfill
capacities. By summarizing the extent of sustainability initiatives underway
among top manufacturers, this analysis provides information to organizations
beginning to report their data or looking to expand their environmental programs.
Companies can learn from other businesses and compare their initiatives to fully
understand and develop opportunities within their organization and community.

80
Appendix A Copy of Company Interview Questionnaire
Date _________________________ Time ______________
Company Name _________________________________________
Representative __________________________________________
Title __________________________________________________
Direct Phone No. ________________________________________
Interview Questions
Does your organization have any environmental sustainability programs? Yes No
If yes, complete the following:
Are they in-house programs, or do you report data externally?
__________________________________________________________________
What type of in-house programs do you have?
__________________________________________________________________
__________________________________________________________________
What metrics and indicators are utilized to measure your environmental impact?
__________________________________________________________________
__________________________________________________________________
Do you have plans to report the data externally in the future?
__________________________________________________________________
__________________________________________________________________
Do you have any publicly-available sustainability reports for 2012?
__________________________________________________________________
What type of reports are they (stand-alone, GRI, annual 10-K, etc.)?
__________________________________________________________________
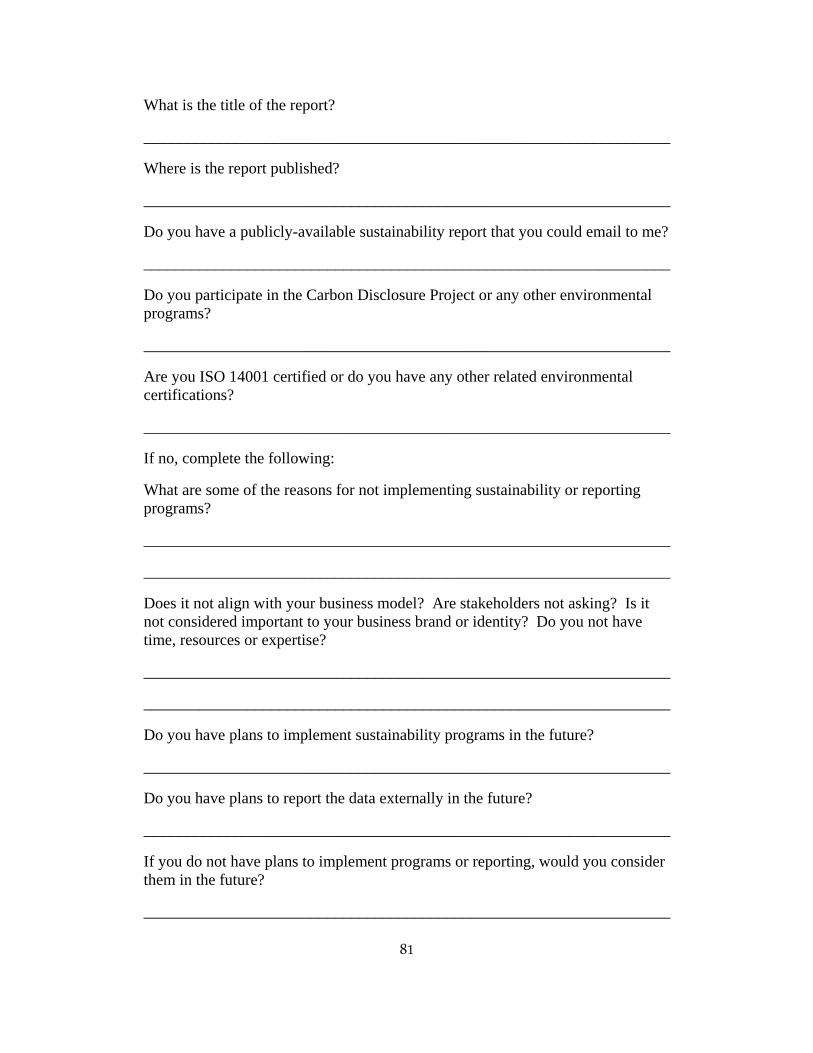
81
What is the title of the report?
__________________________________________________________________
Where is the report published?
__________________________________________________________________
Do you have a publicly-available sustainability report that you could email to me?
__________________________________________________________________
Do you participate in the Carbon Disclosure Project or any other environmental programs?
__________________________________________________________________
Are you ISO 14001 certified or do you have any other related environmental certifications?
__________________________________________________________________
If no, complete the following:
What are some of the reasons for not implementing sustainability or reporting programs?
__________________________________________________________________
__________________________________________________________________
Does it not align with your business model? Are stakeholders not asking? Is it not considered important to your business brand or identity? Do you not have time, resources or expertise?
__________________________________________________________________
__________________________________________________________________
Do you have plans to implement sustainability programs in the future?
__________________________________________________________________
Do you have plans to report the data externally in the future?
__________________________________________________________________
If you do not have plans to implement programs or reporting, would you consider them in the future?
__________________________________________________________________

82
Appendix B Environmental Metrics Identified in Sample Manufacturers’ Sustainability Reports
Environmental Metric GRI
Index No. of
Reports Emissions Total GHG by weight EN16 17 Scope 1 11 Scope 2 11 Initiatives to reduce GHG, reductions achieved EN18 9 GHG intensity 9 Scope 3 7 Other relevant indirect GHG by weight EN17 6 NOx, SOx, and other significant emissions EN20 3 Ozone-depleting substances EN19 3 GHG from suppliers 3 GHG from air travel 3 Direct GHG 2 Indirect GHG 2 Emissions from data centers 2 VOC emissions 2 Reportable toxic releases and transfers 2 Annual emissions growth 1 Percent GHG offset 1 GHG per value chain 1 CO2 avoided through waste reduction 1 CO2 reductions through RECs 1 Percent reduction emissions 1 Non-VOC emissions 1 Percent reduction in reportable releases 1 Relative carbon impact of value chain 1 Hazardous air pollutants (HAPs) 1 Non-GHG emissions 1 Sources of GHG emissions 1 GHG emissions by source (Scope 1 and 2) 1 GHG emissions by business unit (Scope 1 and 2) 1 Total emissions avoided 1 Water Total water use 13 Water intensity 7 Water withdrawal by source EN8 7

83
Percentage, volume of recycled water EN10 6 Water sources significantly affected by withdrawal of water EN9 3 Water bodies significantly affected by organization discharge, runoff EN25 3 Total water discharge EN21 2 Wastewater discharge 1 Wastewater discharge intensity 1 Volume water to sanitary sewer 1 Wastewater destination 1 No. of facilities in water stressed regions 1 Waste Solid waste recycled 11 Total waste by type and disposal method EN22 9 Solid waste 9 Hazardous waste 9 Waste diverted from landfill 6 Hazardous waste intensity 5 Solid waste to landfill 4 Weight of transported hazardous waste, percentage transported internationally EN24 3 Waste intensity 3 Zero waste to landfill sites 3 Non-hazardous waste intensity 2 Solid waste to landfill intensity 2 Solid waste incinerated 2 Solid waste to energy 2 Solid waste composted 2 Non-hazardous waste management method 2 Process waste 2 Hazardous waste management method 2 Hazardous, biohazardous, biological waste 1 Non-hazardous waste 1 Annual waste recycled, MTCE avoided 1 Eco-responsible E waste 1 Electrical equip. refurbished, reused, recycled 1 Non-trash recycling (e waste, metals, batteries, lamps) 1 Waste oil 1 E waste diverted from landfill 1 Cafeteria waste composted 1 Destination of returned products 1 E waste recycled 1 E waste disposition 1 Waste remanufactured, reused, recycled 1

84
Management of reported toxic chemicals 1 Non-recycled industrial process waste 1 Percent waste reduction relative to targets 1 Energy Total energy 10 Energy intensity 10 Direct energy by source EN3 10 Indirect energy by source EN4 10 Energy saved due to conservation EN5 10 Energy conservation initiatives, reductions achieved EN6 8 Total electricity 6 Initiatives to reduce indirect energy, reductions achieved EN7 5 Direct energy 4 Indirect energy 4 Total natural gas 3 Renewable energy credits (RECs) (kWh, MWh) 3 Electricity intensity 2 Percent renewable energy 2 Energy efficiency savings (kWh) 2 Energy reduction - data centers 2 Total fuel 1 Total scope 1 consumption 1 Total scope 2 consumption 1 Total scope 1 and 2 consumption 1 Dollars saved due to conservation 1 Renewable energy - percent total energy intensity 1 Percent electricity - RECs 1 Percent of energy offset 1 Green power (bought or generated) 1 Energy for stationary combustion 1 Energy for mobile combustion 1 Percent energy efficiency performance relative to targets 1 Percent reduction in energy consumption 1 Other Initiatives to mitigate environmental impact, extent of mitigation EN26 11 Percent products sold, packaging materials reclaimed by category EN27 7 Value of environmental fines (USD) EN28 7 Total number of spills and volume EN23 7 Significant environmental impacts from transporting goods, products EN29 4 Total environmental protection expenditures EN30 4 Spent on remediation (dollars) 2 No. of green buildings 2

85
Percentage of eco-friendly procurement 2 Percent recycling content in packaging 2 Fleet fuel efficiency 1 Percentage of eco-office supplies 1 Percentage reduction of small dollar orders 1 Percent recycled paper use 1 Cutting oils purchased 1 Risk-weighted environmental index 1 Hours travel time, gasoline, GHG emissions avoided 1 Savings from sustainable productivity (dollars) 1 Global climate protection goals EN10 1 Total area mined, disturbed, restored 1 Percentage of office personnel commuting via mass transit 1 Packaging size and weight reductions 1 Biodiversity Location, size, land in, or adjacent to protected area EN11 5 Significant impacts on biodiversity EN12 4 Habitats protected or restored EN13 4 Strategies for managing impacts on biodiversity EN14 3 No. of IUCN red list, national conservation species EN15 1 Materials Materials by weight/volume EN1 4 Percent materials used that are recycled inputs EN2 3 Material processed and recycled from returned products 1 Material processed and reused 1 Suppliers Percent of suppliers audited by third party 3 Percent of high risk suppliers audited 1 Percent suppliers meeting EH&S 1

86
Appendix C Summary of Recommendations
Recommendations
1. Conduct research to understand sustainability reporting among businesses on a
municipal level. 2. Conduct additional research to develop and expand sustainability reporting programs
among New England manufacturers.
3. Conduct research to understand how education and training might be utilized to expand the number of reporting organizations.
4. Explore opportunities for information sharing between companies.
5. Conduct research to understand challenges facing small businesses and the implementation of sustainability reporting programs.
6. Explore opportunities for Maine and New Hampshire business associations and policy makers to assist with providing sustainability reporting information to manufacturers.
7. Expand use of the GRI as method for increasing standardization.
8. Increase use of third party verification to increase legitimacy of reporting programs.
9. Implement policy within GRI to require verification after set number of years of reporting.
10. Increase number of New England manufacturers measuring and reporting energy consumption.
11. Conduct research to expand number of ISO 14001-certified New England manufacturers.
12. Establish programs for buyers and suppliers to establish sustainability reporting guidelines.
13. Provide education for compliance professionals on the opportunities surrounding sustainability and associated reporting.
14. Conduct additional research to understand the value of reporting to investors, consumers, and other stakeholders.

87
References
AccountAbility. About Us. Retrieved April 7, 2014 from http://www.accountability.org/
AccountAbility. AA1000 Assurance Standard (2008). Retrieved April 7, 2014 from http://www.accountability.org/standards/aa1000as/index.html
Aras, G., & Crowther, D. (2009). Corporate sustainability reporting: A study in disingenuity? Journal of Business Ethics, 87, 279-288.
Archel, P., Fernandez, M., & Larrinaga, C. (2008). The organizational and operational boundaries of triple bottom line reporting: A survey. Environmental Management, 41, 106-117.
Azapagic, A., & Perdan, S. (2000). Indicators of sustainable development for industry: A general framework. Process Safety and Environmental Protection, 78(4), 243-261.
Berthelot, S., Coulmont, M., & Serret, V. (2012). Do investors value sustainability reports? A Canadian study. Corporate Social Responsibility and Environmental Management, 19(6), 355-363.
Bhat, V. (1996). The green corporation: The next competitive advantage. Westport, CT: Quorum Books.
Boerner, Hank (June 3, 2014). Flash Report: 72% of S&P 500 Companies Now Publishing Sustainability/Responsibility Reports. Retrieved from http://ga-institute.com/Sustainability-Update/2014/06/03/flash-report-72-of-sp-500-companies-now-publishing-sustainability-responsibility-reports/
Brown, H. S., de Jong, M., & Lessidrenska, T. (2009). The rise of the global reporting initiative: A case of institutional entrepreneurship. Environmental Politics, 18(2), 182-200.
Brown, H. S., de Jong, M., & Levy, D. L. (2009). Building institutions based on information disclosure: Lessons from GRI's sustainability reporting. Journal of Cleaner Production, 17(6), 571-580.
Carbon Disclosure Project. Reports and Data. Retrieved May 13, 2014 from https://www.cdp.net/en-US/Results/Pages/overview.aspx
Ceres Principles information. Retrieved July 31, 2014 from http://www.ceres.org/about-us/our-history/ceres-principles
Ceres Principles member director. Retrieved July 31, 2014 from http://www.ceres.org/company-network/company-directory
The Climate Registry. List of members. Retrieved May 13, 2014 from http://www.theclimateregistry.org/members/

88
The Climate Registry. About. Retrieved July 24, 2014 from http://www.theclimateregistry.org/about/
Colicchia, C., Marchet, G., Melacini, M., & Perotti, S. (2013). Building environmental sustainability: Empirical evidence from logistics service providers. Journal of Cleaner Production, 59, 197-209.
Corporate Register. Retrieved April 9 and May 13, 2014 from http://www.corporateregister.com/
Cowan, D. M., Dopart, P., Ferracini, T., Sahmel, J., Merryman, K., Gaffney, S., & Paustenbach, D. J. (2010). A cross-sectional analysis of reported corporate environmental sustainability practices. Regulatory Toxicology and Pharmacology, 58(3), 524-538.
Daub, C. (2007). Assessing the quality of sustainability reporting: An alternative methodological approach. Journal of Cleaner Production, 15(1), 75-85.
Deegan, C., & Gordon, B. (1996). A study of the environmental disclosure practices of Australian corporations. Accounting and Business Research, 26(3), 187-199.
The Economist (November 17, 2009). Triple bottom line. It consists of three Ps: profit, people and planet. Retrieved April 9, 2014 from http://www.economist.com/node/14301663
Elkington, J. (1998). Cannibals with forks: The triple bottom line of 21st century business. Gabriola Island, BC; Stony Creek, CT: New Society Publishers.
Elkington, J. (1994). Towards the sustainable corporation - win-win-win business strategies for sustainable development. California Management Review, 36(2), 90-100.
Epstein, M. J. (2008). Making sustainability work: Best practices in managing and measuring corporate social, environmental and economic impacts (1st ed.). Sheffield, UK: Greenleaf Pub.; San Francisco: Berrett-Koehler Publishers.
Global Reporting Initiative. Sustainability Disclosure Database. Retrieved April 8 and May 13, 2014 from http://database.globalreporting.org/
Global Reporting Initiative. Materiality in the context of the GRI reporting framework. Retrieved April 18, 2014 from
https://www.globalreporting.org/reporting/G3andg3-1/guidelines-online/TechnicalProtocol/Pages/MaterialityInTheContextOfTheGRIReportingFramework.aspx

89
Global Reporting Initiative. An introduction to G4: The next generation of sustainability reporting. Retrieved April 18, 2014 from https://www.globalreporting.org/reporting/g4/Pages/default.aspx and https://www.globalreporting.org/resourcelibrary/GRI-An-introduction-to-G4.pdf
Global Reporting Initiative (2000-2006). Sustainability Reporting Guidelines. Retrieved June 20, 2014 from https://www.globalreporting.org/resourcelibrary/G3-Guidelines-Incl-Technical-Protocol.pdf
Gunasekaran, A., & Spalanzani, A. (2012). Sustainability of manufacturing and services: Investigations for research and applications. International Journal of Production Economics, 140, 35-47.
Hahn, R., & Kuhnen, M. (2013). Determinants of sustainability reporting: A review of results, trends, theory, and opportunities in an expanding field of research. Journal of Cleaner Production, 59, 5-21.
Herzig, C., & Schaltegger, S. (2011). In Godemann J. M.,G. (Ed.), Corporate sustainability reporting. Dordrecht, Netherlands: Springer.
Jacobsen, J. (2011). Sustainable business and industry: Designing and operating for social and environmental responsibility. Milwaukee, Wis.: ASQ Quality Press.
Krippendorff, K. (2004). Content analysis: An introduction to its methodology (2nd ed.). Thousand Oaks, Calif.: Sage.
Lamberton, G. (2005). Sustainability accounting - A brief history and conceptual framework. Accounting Forum, 29(1), 7-26.
Leszczynska, A. (2012). Toward shareholders’ value: an analysis of sustainability reports. Industrial Management + Data Systems, 112.6, 911-928.
Lewis, Michael. (May 1, 2013). Companies Increasingly Go Green, but ISO 14001 Certification Lags in U.S. Retrieved May 13, 2014 from http://news.thomasnet.com/IMT/2013/05/01/companies-increasingly-go-green-but-iso-14001-certification-in-u-s-lags/
Lozano, R., & Huisingh, D. (2011). Inter-linking issues and dimensions in sustainability reporting. Journal of Cleaner Production, 19(2–3), 99-107.
Manetti, G., & Becatti, L. (2009). Assurance services for sustainability reports: Standards and empirical evidence. Journal of Business Ethics, 87, 289-298.
Marimon, F., Alonso-Almeida, M. d. M., Rodríguez, M. d. P., & Cortez Alejandro, K. A. (2012). The worldwide diffusion of the global reporting initiative: What is the point? Journal of Cleaner Production, 33(0), 132-144.

90
Marshall, R. Scott, & Brown, D. (2003). Corporate environmental reporting: What's in a metric? Business Strategy and the Environment, 12(2), 87-106.
Massachusetts Department of Environmental Protection (2014). Facilities required to report greenhouse gas emissions. Retrieved September 26, 2014 from http://www.mass.gov/eea/agencies/massdep/climate-energy/climate/approvals/facilities-required-to-report-greenhouse-gas-emissions.html
Moneva, J. M., Archel, P., & Correa, C. (2006). GRI and the camouflaging of corporate unsustainability. Accounting Forum, 30(2), 121-137.
Orsato, R. J. (2009). Sustainability strategies: When does it pay to be green? Basingstoke; New York: Palgrave Macmillan.
Park, J., & Brorson, T. (2005). Experiences of and views on third-party assurance of corporate environmental and sustainability reports. Journal of Cleaner Production, 13(10–11), 1095-1106.
Porter, M. E. (1985). Competitive advantage: Creating and sustaining superior performance. New York: Free Press.
Roca, L. C., & Searcy, C. (2012). An analysis of indicators disclosed in corporate sustainability reports. Journal of Cleaner Production, 20(1), 103-118.
Schaltegger, S., Bennett, M., & Burritt, R. (2006). Sustainability accounting and reporting. Dordrecht: Springer.
Schwarz, J., Beloff, B., & Beaver, E. (2002). Use sustainability metrics to guide decision-making. Chemical Engineering Progress, 98(7), 58-63.
Stubbs, W., Higgins, C., & Milne, M. (2013). Why do companies not produce sustainability reports? Business Strategy and the Environment, 22(7), 456-470.
US SIF (2014). The Forum for Sustainable and Responsible Investment. About Us. Retrieved September 24, 2014 from http://www.ussif.org/about
Wales, A., Gorman, M., & Hope, D. (2010). Big business, big responsibilities: From villains to visionaries: How companies are tackling the world's greatest challenges. Houndmills; New York: Palgrave Macmillan.
World Business Council on Sustainable Development. Membership Directory. Retrieved May 13, 2014 from http://www.wbcsd.org/member-reporting/membersustainabilityreporting.aspx
World Commission on Environment and Development. (1987). Our common future. Oxford; New York: Oxford University Press.

91
Wubben, E. F. M., & Belgian-Dutch Association for Institutional and Political Economy. (2000). The dynamics of the eco-efficient economy: Environmental regulation and competitive advantage. Cheltenham England; Northampton, MA: E. Elgar.
Yudelson, J. (2010). Greening Existing Buildings. New York: McGraw-Hill.
Zhang, F., Rio, M., Allais, R., Zwolinski, P., Carrillo, T. R., Roucoules, L., Mercier-Laurent, E. & Buclet, N. (2013). Toward an systemic navigation framework to integrate sustainable development into the company. Journal of Cleaner Production, 54, 199-214.