TSYS 2017 Canadian Consumer Payment Study...2017 CANADIAN CONSUMER PAYMENT STUDY 4 INTRODUCTION...
48
2017 Canadian Consumer Payment Study The results of our fourth annual study reveal how consumers pay, along with additional payment insights.
Transcript of TSYS 2017 Canadian Consumer Payment Study...2017 CANADIAN CONSUMER PAYMENT STUDY 4 INTRODUCTION...

2017 Canadian Consumer Payment Study
The results of our fourth annual study reveal how consumers pay, along with additional payment insights.

Table of Contents
359 10 13 19
21 23 25
28 35 37
43 43
46 46
Introduction
Key Insights
Findings & Insights
Payment Types
Payment Preferences
P-to-P Payments/Payments to Individuals
Contactless
Actions Taken in the Last Year
Most Attractive Card Features and Details on Rewards
Mobile Phone Usage and Preferences
Artificial Intelligence
Financial Institution/Issuer Questions About Marketing, Communication and Special Offers
Conclusion
Implications for Issuers
Appendix
Respondent Demographics
2017 CANADIAN CONSUMER PAYMENT STUDY 2
FINDINGS & INSIGHTS

2017 CANADIAN CONSUMER PAYMENT STUDY 3
INTRODUCTION
The results of our fourth annual
Canadian Consumer Payment Study are
enclosed. It’s been another exciting year
in the financial services and payments
industries, with mobile continuing to grow,
increased use of P2P services, continued
innovation in customer servicing and
the overall customer experience, and a
wider introduction of artificial intelligence
(AI) devices. Many of these trends are
expected to continue.

2017 CANADIAN CONSUMER PAYMENT STUDY 4
INTRODUCTION
Despite all of the new technologies and ways to pay, credit, debit and cash, once again, remain consumers’ primary ways to pay. Similar to the last couple of years, credit came out on top when the survey respondents were asked: “in general, what payment form would you say is your preferred type to use when you have a choice?” This reflects the continued use of credit by Canadians, whose household debt “is now at a high of 167.3% of disposable income” (Household Debt Hits Fresh Record, Financial Post, 3/15/2017-Q4 2016, Statistics Canada). “That means that Canadians owe $1.67 for every dollar of disposable income.”
This year, we surveyed more than 1,500 consumers. We required each of the survey respondents to be over 18 years of age, to have at least one credit card and one debit card, and not to work for a financial institution.
We also took steps to ensure that the respondents covered a diverse demographic, including gender and age. In addition to questions about payment types and preferences, card features, mobile usage and questions surrounding interactions with the consumers’ financial institutions, we added new questions regarding contactless payments, reloadable prepaid cards, P2P and AI devices. Many other questions were left unchanged or were kept very similar to prior years to enable us to note trends.
We are pleased to provide you with this information and hope you find it both of interest and useful to you as you execute on existing strategies/plans and chart the course on new ones.

52017 CANADIAN CONSUMER PAYMENT STUDY
Key Insights

2017 CANADIAN CONSUMER PAYMENT STUDY 6
KEY INSIGHTS
2Specialized offerings facilitating payments to individuals, often referred to as P2P payments, have continued to grow. Historically, payments between individuals have been made overwhelmingly by cash, with the use of cheques as the second most preferred way to pay. The wide availability of Interac’s e-Transfer system in Canada has increased the knowledge that there are other ways to facilitate these types of payments. In addition to asking about the preferred payment form for paying individuals, we also asked several specific questions this year about P2P services. Forty-eight percent of our respondents indicated they used a P2P service during the last year.
1Credit cards, for the 3rd year in a row, were selected as the “most preferred payment form.”The percentage of our respondents who selected debit as their most preferred payment form increased this year and remains in a strong second place. Cash as the third most preferred payment form has remained steady the last three years, with more than 10 percent of respondents selecting that option. Although household debt in Canada is at an all-time high, from a payment perspective, we saw several categories where debit gained ground on credit this year. Consumers frequently use debit cards to manage their budgets, and for everyday spend transactions, and we saw an increase in that use this year. Regardless of which overall preferred payment form was selected, you’ll see in the attached that consumers once again took advantage of multiple payment options and multiple channels depending upon the type of purchase and activity.
Seven insights from our study:

2017 CANADIAN CONSUMER PAYMENT STUDY 7
KEY INSIGHTS
4The contactless feature on their cards is well known by Canadians and many consumers are very comfortable using the feature.Several of our clients were interested in knowing if consumers were aware of the contactless feature on their cards and how comfortable they were using it. We asked a series of new questions this year to obtain those results. Eighty-nine percent of our respondents indicated they were aware of the ability to make in-store purchases by tapping their card versus inserting it. Seventy-nine percent of those who were aware of the contactless feature indicated they have actually used the option. Good news not just for contactless transactions, but also for the future of mobile payments.
3“Mobile first” is becoming a key strategy with many issuers ― particularly with new product offerings and customer service options. Although mobile payments are growing somewhat slower than other mobile activities, more than half of our respondents believe that over the next two years, at least 25 percent of their in-store purchases will be made using a mobile phone. Less than five percent of our respondents have actually loaded a debit and/or credit card onto a mobile wallet, but clearly they see themselves paying that way in the future. Consumers have embraced using their mobile phone for other financial activities. Forty-four percent of our respondents utilize their financial institutions’ mobile app more than once a month.
5Rewards continue to be a powerful incentive and were once again ranked as the most attractive card feature on consumers’ most preferred credit card.Eighty-seven percent of the respondents indicated rewards were important when deciding which payment form to use. Real-time rewards (being able to use rewards immediately) were ranked very high on the feature list for deciding which card to use.

2017 CANADIAN CONSUMER PAYMENT STUDY 8
KEY INSIGHTS
6Consumers once again indicated they value the relationship they have with their financial institution, with 45 percent indicating that it is important to have all of their financial products with the same banking institution/provider.Seventy-five percent of the consumers we surveyed were either somewhat interested or very interested in receiving coupons/special offers from their financial institution, with a desired frequency of once a month. Email remained the most preferred channel for receiving communications and most of our respondents want to call customer service if they have an issue with one of their payment cards. We were somewhat surprised to find a fairly high propensity in the 18-24 age grouping for those who want to walk into a branch to solve an issue (it was still their second choice, with their first choice being to call into customer service). Perhaps this is due to their having less familiarity with payment cards and financial services overall.
7The use of artificial intelligence devices (such as Amazon’s Echo/Alexa) is still somewhat in the early stages, with only 16 percent of our respondents indicating they currently have such a device. Most that have the devices use them primarily for questions and answers; news and information; and music and entertainment. Thirty-seven percent of those that have a device indicated they would use it to make purchases or payments. The other individuals are not quite ready to use the devices for payments and one of the respondents wrote-in that it would be “scary” to do so. It will be interesting to see how this market grows — particularly with the planned introduction of additional devices and services within the next year.

92017 CANADIAN CONSUMER PAYMENT STUDY
Findings & Insights

2017 CANADIAN CONSUMER PAYMENT STUDY 10
FINDINGS & INSIGHTS
NUMBER OF DEBIT AND CREDIT CARDS
Similar to previous years, one of the questions we asked was how many debit and credit cards our respondents have. The overall trend remained constant, although the number who has more than one credit card has increased slightly (63 percent in 2017, compared with 61 percent in 2016). This is consistent with the continued credit growth in Canada and makes it more important than ever that issuers understand what causes consumers to use one card over another. The percentage of consumers who have only one debit card is high (68 percent) and has remained steady year-to-year.
Payment Types
Exhibit 1:Number of Debit and Credit Cards
0% 80%40% 60%20%
One
Two
Three
Four or more2%
5%
26%
68%
13%
18%
32%
37%
Debit cardCredit card

2017 CANADIAN CONSUMER PAYMENT STUDY 11
FINDINGS & INSIGHTS
OTHER PAYMENT TYPES
PayPal continues to be the number one electronic payment type consumers own, following credit and debit cards. This year, 65 percent of our respondents indicated they have a PayPal account, compared to 59 percent last year. Exhibit 2 contains information on the other payment types owned.
RELOADABLE PREPAID CARDS
Although the number of respondents who indicated they have a reloadable prepaid card continues to be low, there are active industry discussions about the reloadable prepaid card market in Canada. We asked several new questions about reloadable prepaid cards in our study this year. Interestingly, although seven
percent of our respondents indicated they had a MC/Visabranded prepaid card, when asked as part of the overall payment ownership question, only one percent indicated they had a reloadable prepaid card when we asked a question specific to reloadable prepaid cards. Whether the addition of the word “reloadable” to the new question caused some confusion or there is general confusion about prepaid cards is unclear.
The first new question we asked was if they would be interested in obtaining and using a reloadable prepaid card which can be used anywhere that Visa, Mastercard or American Express are accepted. Exhibit 3 includes the responses, which show fairly strong interest. Thirty-seven percent indicated they would be interested and another 35 percent were unsure. Good news for those looking at prepaid card programs.
Exhibit 3:Interest in Obtaining a Reloadable Prepaid Card
Exhibit 2:Other Payment Types Owned
1%Already
have one
37%Yes
27%No
35%Unsure
0% 80%40% 60%20%
PayPal
Store credit card
Limited line credit card for
online shopping
MC/Visa- branded
prepaid card
Store debit card
Virtual currency account
65%
19%
7%
7%
4%
2%

2017 CANADIAN CONSUMER PAYMENT STUDY 12
FINDINGS & INSIGHTS
We then delved a little deeper and asked them for what specific purpose they’d use a prepaid card. We only posed this question to those who either already had a card or answered "yes," they’d be interested in obtaining one. We provided a list of purposes where they could check all that applied and we also offered the ability for them to check other and include write-in responses. Exhibit 4 contains the responses, with online purchases and travel the overwhelming favorites.
Exhibit 4:Purposes to Use Prepaid Cards
Exhibit 5:Importance of Multi-Currency for Prepaid Card
Finally, we asked how important multi-currency as a feature is to a prepaid card, and described that as the ability to pay in the currency of the country where you are using the card. Exhibit 5 reflects the results. Thirty-four percent said it was very important and another 54 percent said it was somewhat important. Not surprising, given the 51 percent who stated they’d use a prepaid card for travel.
12%Not at allimportant
54%Somewhatimportant
34%Very
important
0% 100%40% 60% 80%20%
Online purchases
Travel
To provide funds for my child
Instead of a banking account
For my small business
Other
81%
51%
19%
17%
7%
3%

2017 CANADIAN CONSUMER PAYMENT STUDY 13
FINDINGS & INSIGHTS
Payment PreferencesOVERALL PAYMENT PREFERENCE
Credit once again showed its strength as a preferred payment method, by being the top choice of consumers when asked the question “in general, what payment form would you say is your preferred type to use when you have a choice?” Forty-four percent selected credit, followed by 38 percent who selected debit. Cash, although it decreased slightly from last year, continued to be a strong third choice at 13 percent, reflecting, once again, that cash continues to be resilient. Consumers continue to appreciate its anonymous feature and wide ranging acceptance.
Exhibit 6:Most Preferred Payment Type
0% 60%40%20%
2015
2016
2017
46%
34%
14%
47%
33%
15%
44%
38%
13%
Debit card CashCredit card

2017 CANADIAN CONSUMER PAYMENT STUDY 14
FINDINGS & INSIGHTS
We were interested in seeing what differences in preferred payment type might exist by age and income. The tables shown as Exhibits 7 and 8 reflect that breakdown.
Credit was strong across all age groups and was the preferred payment type in all but one of the six age groupings. Not surprisingly, the 18-24 year old group preferred debit cards when given a choice. This age group is typically just starting to build up their credit history and has lower lines of
credit available to them. The 18-24 year old group also showed the highest percentage of cash as the preferred payment type.
When we looked at household incomes, credit cards were the preferred payment choice by those with household incomes greater than $50K. Again, this is consistent with what we would have expected, given the increased availability of credit to those with higher incomes.
Exhibit 7:Preferred Payment Type by Age
Exhibit 8:Preferred Payment Type by Household Income
Credit card
18 - 24 25 - 34 35 - 44 45 - 54 55 - 64 65 or olderMost PreferredPayment Type
Age range
Debit card
Cash
31%
48%
17%
45%
42%
10%
44%
41%
10%
47%
33%
16%
44%
38%
15%
49%
34%
11%
Credit card
Less than $25,000
$25,000 - $49,999
$50,000 - $74,999
$75,000 - $99,999
$100,000 - $149,999
$150,000 or more
Most PreferredPayment Type
Total household income for 2016 before taxes
Debit card
Cash
30%
47%
13%
37%
42%
16%
42%
39%
16%
51%
35%
11%
57%
31%
9%
60%
33%
3%

2017 CANADIAN CONSUMER PAYMENT STUDY 15
FINDINGS & INSIGHTS
PREFERENCE BY STORE TYPE
When we looked at the responses to preferences by store type, we found a couple of changes from prior years. This year, we saw a relative tie between credit and debit for grocery/supermarket transactions and a tie between
Exhibit 9:Preference by Store Type
0% 60%40%20% 50%30%10%
Department store
Discount store
Gas station
Supermarket
51%
36%
7%
25%
33%
33%
48%
32%
9%
43%
43%
11%
Debit CashCredit
debit and cash for discount store transactions. Both of those categories reflected different trends than we observed in prior years and showed an increase in the preference of using debit in both categories. Exhibit 9 depicts the complete responses for store types.

2017 CANADIAN CONSUMER PAYMENT STUDY 16
FINDINGS & INSIGHTS
PREFERENCE BY RESTAURANT TYPE
Debit overtook cash as the preferred method of payment at fast food restaurants this year. In prior years, cash has been the top vote getter. It would be interesting to know if the growth of contactless payments in Canada has contributed to this. You’ll find more about contactless payment responses on page 21. Cash continued to be the most
Exhibit 10:Preference by Restaurant Type
0% 60%40%20% 50%30%10%
Dine-in restaurant
Fast food restaurant
Coffee shop
47%
37%
12%
28%
36%
32%
20%
25%
46%
Debit CashCredit
preferred way to pay at coffee shops, while credit was again selected as the most preferred way to pay at dine-in restaurants. Debit came in as a much closer second choice in both categories (coffee shops and dine-in restaurants) this year. Exhibit 10 includes the details for preferred payment options at restaurants.

2017 CANADIAN CONSUMER PAYMENT STUDY 17
FINDINGS & INSIGHTS
PREFERENCE BY BILL PAYMENT
Credit remained the top payment option for paying both one-time and recurring bills, as shown in Exhibit 11. However, similar to other trends we’ve seen this year, debit was stronger in both of these categories than what we saw last year. “Other” took the third position, and is likely due to online bill payment services available at financial institutions.
PREFERENCE BY ONLINE CATEGORIES
Very little has changed in the online categories of shopping and travel. Credit continues to dominate, as it has for all the years of our studies. For online shopping, PayPal remains the second preference, but trails credit significantly. A large percentage (30 percent) selected "N/A" again this year for travel, likely due to the fact they don’t use online travel sites (or even travel at all). The preference for using credit for online purchases continues to reflect consumers’ security concerns when doing business online and the preference to use “someone else’s money” at locations where they perceive there could be a problem. Exhibit 12 includes the details for the online categories.
Exhibit 11:Preference by Bill Payment
Exhibit 12:Preference by Online Categories
0% 50%40%20% 30%10%
Paying bills - recurring
Paying bills - one time
34%
25%
22%
36%
26%
17%
Debit OtherCredit
0% 70%40% 50% 60%20% 30%10%
Online travel
Online shopping
60%
4%
3%
30%
61%
5%
21%
7%
Debit PayPalCredit
N/A
2017 CANADIAN CONSUMER PAYMENT STUDY 18
FINDINGS & INSIGHTS
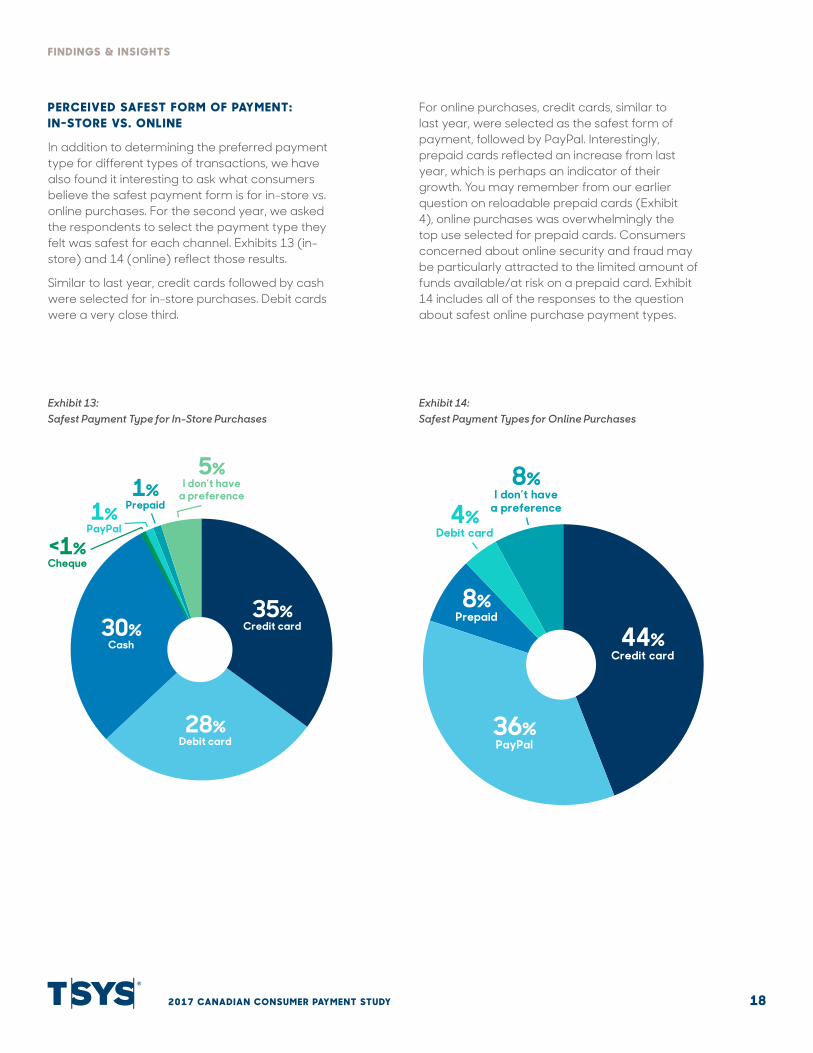
PERCEIVED SAFEST FORM OF PAYMENT: IN-STORE VS. ONLINE
In addition to determining the preferred payment type for different types of transactions, we have also found it interesting to ask what consumers believe the safest payment form is for in-store vs. online purchases. For the second year, we asked the respondents to select the payment type they felt was safest for each channel. Exhibits 13 (in-store) and 14 (online) reflect those results.
Similar to last year, credit cards followed by cash were selected for in-store purchases. Debit cards were a very close third.
For online purchases, credit cards, similar to last year, were selected as the safest form of payment, followed by PayPal. Interestingly, prepaid cards reflected an increase from last year, which is perhaps an indicator of their growth. You may remember from our earlier question on reloadable prepaid cards (Exhibit 4), online purchases was overwhelmingly the top use selected for prepaid cards. Consumers concerned about online security and fraud may be particularly attracted to the limited amount of funds available/at risk on a prepaid card. Exhibit 14 includes all of the responses to the question about safest online purchase payment types.
Exhibit 13:Safest Payment Type for In-Store Purchases
Exhibit 14:Safest Payment Types for Online Purchases
1%Prepaid1%
PayPal
<1%Cheque
5%I don’t have
a preference
35%Credit card
28%Debit card
30%Cash
4%Debit card
8%I don’t have
a preference
44%Credit card
36%PayPal
8%Prepaid

2017 CANADIAN CONSUMER PAYMENT STUDY 19
FINDINGS & INSIGHTS
P2P Payments/Payments to IndividualsThis year, in addition to asking which payment form consumers preferred to use to pay individuals, we expanded our questions to include a couple of questions specific to P2P services. The availability of these services is growing, particularly with the wide availability of Interac’s e-Transfer service in Canada.
The first question, the results of which are shown in Exhibit 15, is one we’ve asked in prior years around the preferred payment form for payments to individuals. We haven’t said much
about cheques until now. Cheques remain one of the preferred payment forms for this particular category (although not the top choice). Cash continues to dominate with 48 percent of the respondents selecting cash as their preferred method of payment. This is slightly down from last year’s 53 percent. Clearly, a lot of opportunity exists to increase the use of electronic payments in this particular category.
Exhibit 15:Preferred Payment Form to Pay Individuals
48% 12%Cash Cheque Debit
10%

2017 CANADIAN CONSUMER PAYMENT STUDY 20
FINDINGS & INSIGHTS
This year, in addition to finding out their preferred form of payment when paying individuals, we also asked two questions specific to P2P services. First, we described what P2P services are (P2P services allow you to transfer funds from your bank account to another individual's account via the internet or a mobile phone, using the recipient's account number, email address or phone number [e.g., Interac e-Transfer]). We asked the respondents if they had used a P2P service, were
aware of them, or were not aware of them. A significant number, 48 percent, indicated they have used a P2P service. Exhibit 16 shows the complete response.
We then asked those who had either not used the service or had never heard about P2P payments, how likely they would be to use it over the next year. Only 13 percent indicated they would be likely or very likely to use such a service.
Exhibit 16:Use of P2P
0% 60%40%20% 50%30%10%
Yes, I have used P2P payments
No, but I was aware of
this method
I have never heard of P2P
payments
48%
31%
21%

2017 CANADIAN CONSUMER PAYMENT STUDY 21
FINDINGS & INSIGHTS
ContactlessAnother series of questions new to this year’s study involved the contactless feature on cards. Several of our issuers were interested in knowing if: consumers were aware of the feature; if they’d used the feature; and, if not, why not. The survey results follow.
Exhibit 17 shows the number of consumers aware of the contactless feature on their card. We asked them if they are aware that their credit/debit card has a contactless feature that enables them to make in-store purchases by tapping their card versus inserting it into the merchant terminal. Good news here, in that 89 percent of consumers responded that they are aware of this feature.
Exhibit 17:Awareness of the 'Contactless' Feature
89%Yes
11%No

2017 CANADIAN CONSUMER PAYMENT STUDY 22
FINDINGS & INSIGHTS
The final question was only asked of those who indicated they were aware of the contactless feature on their card but had not made a purchase using it. We asked why not and provided choices of: “I am not comfortable tapping;” “it’s just as easy to insert my card;" or “other.” We also provided them the ability to write-in a response.
Fifty-two percent stated they were not comfortable tapping, while 34 percent stated that it’s just as easy to insert their card. The remainder responded other and a couple of the more interesting write-in responses follow:
Exhibit 18:Made a Purchase Using the 'Tap' Feature
0% 100%40% 80%60%20% 90%30% 70%50%10%
Yes
No
79%
21%
“I don’t believe tapping is secure.”
“I’m afraid if I lose my card the person that finds it will just tap
all my money away.”
“If I never use it and someone else does, it is a flag to the bank that I
haven’t made that purchase.”

2017 CANADIAN CONSUMER PAYMENT STUDY 23
FINDINGS & INSIGHTS
Actions Taken in the Last YearSimilar to previous years, we asked the survey respondents “for each of the following statements, please indicate whether or not you took this action in the last year.” For 2017, we changed the format of the question slightly. Rather than having the respondents check all that apply, we asked them to indicate “yes” or “no” to each question. We found that forcing a response to each selection increased the overall percentages;
Exhibit 19:Actions Taken in the Last Year
however it did not significantly change the ranking of those actions “most taken.” We also added a couple of new options this year (I paid down debt; I began saving more). The table on Exhibit 19 shows the results for this year and prior years. The most significant change in ranking was noted with P2P services. We attribute this to the growth of the availability of Interac’s e-Transfer and other services.
I made a purchase using a credit card I have on file with the online retailer I shop with most often
I paid down debt
I began saving more
I sent money to another person utilizing a person-to-person service such as Interac e-Transfer
I registered my credit card with the online retailer I shop with most often
I opened an account with PayPal to make online or in-store purchases
I opened a new credit card to take advantage of the rewards being offered
A merchant or individual used a mobile phone or tablet to accept my payments
2014
41%
N/A
N/A
20%
26%
22%
22%
8%
2015
48%
N/A
N/A
23%
31%
28%
16%
7%
2016
41%
N/A
N/A
24%
28%
24%
14%
8%
2017
64%
59%
57%
48%
44%
33%
24%
22%

2017 CANADIAN CONSUMER PAYMENT STUDY 24
FINDINGS & INSIGHTS
We also asked the respondents if they changed the way they paid during the last year. The format of this question was also changed to require a yes/no response. The results to that question are shown on Exhibit 20.
Not surprising, given the continued growth in online shopping and consumers strong use
of PayPal in that channel, the largest positive response was “used PayPal more often.” Good news for mobile: 16 percent of the respondents indicated they made purchases using a mobile app during the last year. You’ll find more specifics about the use of mobile on page 28.
Exhibit 20:Changes in How Paid During Last Year
0% 50%30% 40%10% 20%
Used PayPal more often
Made purchases using a
mobile app
Using payment cards less due to
data breaches
Closed accounts
Added more credit cards to
my mobile wallet
Added a prepaid card to my
mobile wallet
Added more debit cards to my
mobile wallet
Used digital/virtual
currency
40%
16%
14%
12%
10%
8%
8%
7%

2017 CANADIAN CONSUMER PAYMENT STUDY 25
FINDINGS & INSIGHTS
Most Attractive Card Features and Details on RewardsRewards topped the list again this year for being the most attractive feature on our respondents’ preferred credit card. Finance charge/interest rate placed second in the rankings, with card brand and customer service tied for third. Similar to a couple of other questions, we changed the required response this year so that the respondents had to answer "yes" or "no" to each feature as a response to the question: “If you have multiple credit cards, which features cause you to use one card more than another?” This resulted in higher overall percentages, however, the ranking of the first two (rewards, followed by finance charge/interest rate) did not change from prior years. Customer service moved up to tie with card brand for the third position in the rankings. Additional details may be found in Exhibit 21.
Exhibit 21:Attractiveness of Credit Card Features
0% 100%60% 80%20% 40%
Type of rewards
Finance charge/interest rate
Customer service provided
Card brand
Payment options/
flexibility
Balance transfer options
Mobile capabilities
Card design
87%
57%
52%
52%
46%
28%
23%
13%

2017 CANADIAN CONSUMER PAYMENT STUDY 26
FINDINGS & INSIGHTS
We expanded on the previous question and asked the consumers to indicate, for a variety of features, how important each is in deciding to use one payment card over another (credit, debit, prepaid). Similar to the question asking about rankings for credit cards only, rewards-type features ranked the highest.
Exhibit 22 includes a three-year comparison of the various features consumers said were very
or extremely important. The respondents were provided a seven-point scale, with very and extremely important in the top two spots. The trends are very similar for the three-year time horizon. Real-time rewards continue to be the most important feature and are increasing in popularity. In addition, similar to what we have found with a couple of the other questions, P2P features are also growing in popularity.
Exhibit 22:Importance of Certain Features When Deciding Which Card to Use
0% 40%20% 30%10%
Cash back discounts credited immediately to
your account
Use your card's loyalty/rewards points
immediately
Obtain dynamic credit score
Mobile phone alerts each time a purchase is made
Transfer money to another person online or
via mobile phone app
Multiuse card, such as credit and transit, debit
and loyalty
Turn your card on and off based on time of day,
transaction amount, store or location
Mobile phone app that classifies your purchases
for budgeting
Use your phone to make a purchase
35%33%
32%
32%32%
30%
22%24%
20%
20%18%
15%
19%18%
14%
17%18%
16%
18%18%
15%
9%11%
10%
9%11%
9%
20162015 2017

2017 CANADIAN CONSUMER PAYMENT STUDY 27
FINDINGS & INSIGHTS
We then asked specifically about rewards. Sixty-five percent of the respondents indicated they have a loyalty/rewards program attached to their most preferred payment type. We then asked the respondents who have rewards how often they redeem their reward points and for what type of reward. The responses may be found in Exhibit 23. For those rewards which are redeemed a few
times a year or more, gift cards, merchandise and cash back were relatively tied from a category standpoint. Travel and experiences were redeemed less frequently, which is not a surprise given the higher dollar value for those categories. Experiences also ranked the highest in the “never redeem my rewards” category.
Exhibit 23:How Frequently Rewards are Redeemed
0% 80%40% 60% 70%20% 30% 50%10%
Never
Once a year or less
A few times a year
More than once a month
About once a month
74%
50%
42%
40%
35%
13%
34%
25%
25%
33%
9%
13%
24%
23%
19%
3%
2%
6%
8%
9%
2%
1%
3%
3%
5%
TravelExperiences Gift cards Merchandise Cash back

2017 CANADIAN CONSUMER PAYMENT STUDY 28
FINDINGS & INSIGHTS
Mobile Phone Usage and PreferencesThe importance of mobile continues to grow. Many companies, including financial institutions and card issuers, have adopted a “mobile first” strategy. Mobile activity and usage has expanded well beyond early adopters at this point, particularly for shopping, self-service and communications. Mobile payments are growing; however, to-date, other services related to financial services and card issuance have gained more traction than payments themselves.
In addition to looking at the overall responses to our mobile questions, we also looked at the breakdown on age and income on many of them. Not surprisingly, there was a marked difference in the interest level for mobile payment options between those in the four categories under age 55 and those in the two categories 55 and older. Income levels did not have as marked a difference to the responses.
Although consumers are embracing mobile in increasing numbers, when asked, almost 65 percent of consumers indicated that having the ability to pay using their phone or wearable device was not important to their decision when shopping for a new card. Is this perhaps because they assume the capability will be there when they are interested in taking advantage of using the feature? Last year, 70 percent indicated it wasn’t important to their decision. Similar to our other categories of questions, we asked several of the same questions we have in years past in order to track trends. We also added some new questions — particularly surrounding the use of 'in- app' payments.

2017 CANADIAN CONSUMER PAYMENT STUDY 29
FINDINGS & INSIGHTS
INTEREST IN VARIOUS MOBILE PHONE FEATURES
First, we asked consumers to rank their interest level in certain mobile features if they were available on their mobile phone. Once again, similar to what we found last year, they were generally more interested in all the features, but the overall stack rankings remained about the same. Exhibit 24 shows a three-year comparison of the percentages for each feature where the
item was ranked as very or extremely interesting to our respondents. Survey respondents could select from a seven-point scale, with very and extremely interested the sixth and seventh options. There was a significant increase in interest level with “use your phone to immediately stop a transaction that was not made by you,” which took the top spot. Consumers could also note which feature they already use. You’ll see those responses broken out in Exhibit 25.
Exhibit 24:Desired Mobile Phone Features
0% 60%40%20% 30% 50%10%
Use your phone to immediately stop a transaction that was
not made by you
Instantly view transactions made with your debit or credit cards
Keep all your loyalty/rewards cards on your phone so you
can present the right one when checking out
Transfer money to another person, such as a family
member or friend
The ability to use your phone to turn your payment card on or off
to prevent unauthorized use based on various criteria
Use a mobile app to change the PIN on your
debit or credit card
Receive instant offers and promotions for the store
you are visiting
Store your government issued identification, such as a
driver's license, on your phone
Use your phone instead of a payment card to make
purchases in store
Use a wearable device, such as a smart watch, to
make a payment
29%37%
48%
25%28%
32%
21%23%
27%
17%20%
27%
19%24%
26%
13%16%
20%
17%14%
19%
12%13%
18%
14%15%15%
11%10%
11%
20162015 2017

2017 CANADIAN CONSUMER PAYMENT STUDY 30
FINDINGS & INSIGHTS
As mentioned previously, we decided to look at what percentage of consumers already use the features. We found relatively light adoption to-date. You’ll see in Exhibit 25 that P2P was the most used at nine percent.
Exhibit 25:Mobile Features Consumers Already Use
0% 10%
Transfer money to another person, such as a family
member or friend
Instantly view transactions made with your debit or credit cards
Receive instant offers and promotions for the store you are
visiting
Keep all your loyalty/rewards cards on your phone so you can
present the right one when checking out
Use your phone instead of a payment card to make
purchases in store
Store your government issued identification, such as a driver's
license, on your phone
The ability to use your phone to turn your payment card on or off to
prevent unauthorized use based on various criteria
Use your phone to immediately stop a transaction that was
not made by you
Use a mobile app to change the PIN on your debit or credit card
Use a wearable device, such as a smart watch, to make a payment
9%
5%
4%
2%
2%
2%
1%
1%
1%
1%

2017 CANADIAN CONSUMER PAYMENT STUDY 31
FINDINGS & INSIGHTS
IN-APP MOBILE PAYMENTS
This year we added a couple of questions to differentiate general mobile payments from 'in-app' mobile payments. We described in-app mobile payments:
In-app mobile payments are purchases made using a merchant app which has been downloaded to a smartphone or tablet where a payment mechanism (credit card, debit card, chequing account) has also been added. These payments, made by accessing the app and selecting how to pay, can be used for both online and in-store purchases.
We then asked the respondents if they were familiar with using merchant apps to pay for goods and services and you’ll see in Exhibit 26 that 47 percent indicated they were familiar with the process.
Following that question, we asked those who were familiar with the ability to use merchant apps to pay for goods and services if they had made an actual purchase using an app. Twenty-seven percent indicated they have made an online purchase using an app and 18 percent stated they have made an in-store purchase using the app. The remaining 55 percent have not made any purchases using a merchant’s mobile app.
Exhibit 26:Familiarity with Using Merchant Apps to Pay for Goods and Services
47%Yes
53%No

2017 CANADIAN CONSUMER PAYMENT STUDY 32
FINDINGS & INSIGHTS
LIKELIHOOD OF LOADING CREDIT/DEBIT CARD ONTO A MOBILE PHONE/WALLET
One of the data points we found interesting this year is that, although less than five percent of our respondents indicated they have loaded a debit and/or credit card onto a mobile phone/wallet, half of our respondents believe that over the next two years, at least 25 percent of their in-store purchases will be made using a mobile phone. Clearly, although they don’t do it today — many consumers believe this is how they will pay in the future. Additional information on these questions follows.
Exhibits 27 and 28 show the likelihood of consumers loading their debit card (Exhibit 27) and credit card (Exhibit 28) into a mobile phone or wallet. The percentage of those who have indicated they have already loaded their card — either debit or credit — is still relatively low. Although the percentage of those who now say they’d “never” load a card has come down quite a bit from last year — the shift has been into the not likely or neutral categories vs. the likely or definitely.
Exhibit 27:Likelihood of Loading Debit Card into a Mobile Phone or Wallet
Exhibit 28:Likelihood of Loading Credit Card into a Mobile Phone or Wallet
0% 50%40%20% 30%10%
Never
Not likely
Neutral
Likely
Definitely
Already loaded
34%
42%
28%
22%
18%
16%
4%
2%
4%
6%
13%
12%
20172016
0% 50%40%20% 30%10%
Never
Not likely
Neutral
Likely
Definitely
Already loaded
33%
41%
26%
21%
18%
15%
5%
3%
5%
6%
14%
14%
20172016

2017 CANADIAN CONSUMER PAYMENT STUDY 33
FINDINGS & INSIGHTS
PERCENT OF PURCHASES EXPECTED TO BE COMPLETED USING MOBILE PHONE
We were interested to learn what consumers believe about how they'll pay in the future. We added the following new question this year:
“Over the next two years, if the merchant/shop offers it, what percentage of your in-store purchases made with your phone will replace your use of physical, plastic credit and Interac/debit cards?”
As you’ll see in Exhibit 29, 50 percent of our respondents believe that over the next two years, 25 percent or more of their purchases will be made using a mobile phone vs. physical card. Although they may not have already loaded their debit and/or credit card into a mobile wallet, clearly they believe the industry is moving towards mobile payments.
PREFERRED SOURCE FOR MOBILE PAYMENT APP
There have been several articles in the news about different types of mobile payment apps, including mobile payment apps managed by financial institutions and others managed by phone or operating system providers. We were interested to learn consumers’ views on whose mobile payment app they would most trust to safeguard their personal and financial information. Given that some of the current solutions are from mobile device and operating system providers, as well as online retailers, it was interesting to see that consumers surveyed overwhelmingly selected their financial institution.Exhibit 30 contains additional information on the responses.
Exhibit 29:Percentage of In-Store Purchases Which Will be Made Using Phone
Exhibit 30:Most Trusted Source for Mobile Payment App
50%0% of
purchases
20%25% of
purchases
17%50% of
purchases
10%75% of
purchases
3%100% of
purchases
0% 60%20% 40%
My primary financial
institution
I am not interested in a
mobile app
Mobile device manufacturer
Payment network/brand
Mobile network operator
Mobile device operating
system provider
Online retailer
Department store/warehouse
club
48%
36%
7%
3%
2%
2%
1%
1%

2017 CANADIAN CONSUMER PAYMENT STUDY 34
FINDINGS & INSIGHTS
COMFORT LEVEL WITH VARIOUS FORMS OF MOBILE AUTHENTICATION
Various mobile authentication methods ― existing and new ― continue to be talked about in the news. This year we again asked consumers to indicate their comfort level with various forms of mobile authentication. We included the most commonly used and/or discussed: passcode, fingerprint, camera and voice recognition. The traditional passcode method continues to rank first, but it is closely followed by fingerprint. This is not surprising given several device manufacturers’ options to use fingerprints as security on their devices. Voice recognition was again ranked the lowest of the four options.
Voice recognition is increasingly being used in several channels, including artificial intelligence devices and with customer service areas. We did not include the 2016 percentages by way of comparison. Last year, we posed the question to only those who were the most “tech savvy” and this year, we wanted the broad base of responses. Directionally, the rankings were the same for the two years, although the actual percentages were higher last year, given the nature of the audience which was asked the question. The percentages in Exhibit 31 reflect those who ranked their comfort level with the authentication method either a four- or five- on a five-point scale.
Exhibit 31:Comfort Level with Various Forms of Mobile Authentication
Passcode Fingerprint Voice recognition
Camera60% 50% 28% 21%

2017 CANADIAN CONSUMER PAYMENT STUDY 35
FINDINGS & INSIGHTS
Artificial IntelligenceOne of our other new sections this year covers artificial intelligence (AI) devices. With all of the discussion in the payment and other industries about the growing use of AI, we wanted to understand how comfortable consumers are with using AI to make purchases/payments. We asked a series of four questions on this topic.
Exhibit 32 indicates those that currently have an AI device, such as Amazon’s Echo/Alexa, etc. Sixteen percent of our respondents indicated they currently have a device.
Exhibit 32:Have an Artificial Intelligence Device
16%Yes
84%No

2017 CANADIAN CONSUMER PAYMENT STUDY 36
FINDINGS & INSIGHTS
We asked those who responded that they own a device, how they use it. Those responses can be found on Exhibit 33. “Questions and answers” leads the list, followed by news and information and music and entertainment.
We then asked this same group (those that currently have a device) if they’d use it to make purchases or payments. Thirty-seven percent indicated they would, while the remaining 63 percent stated they would not.
Finally, we asked those who stated they would not use their AI device to make purchases or payment, why not. Fifty-six percent sited security concerns while 35 percent indicated it was easier to pay the way they do currently. Those who selected “other” had some interesting write-in responses, including one person who indicated it was “scary” and another who wrote: “Every new form of payment is another opportunity to be hacked, in the case of body ID, quite literally.”
Exhibit 33:For What the AI Device Is Used
0% 70%60%20% 40% 50%10% 30%
Questions and answers
News and information
Fun and games (e.g., jokes,
Jeopardy, etc.)
Music and entertainment
To make lists
To shop/purchase items
(e.g. Amazon)
Smart home (e.g. lights,
thermostat, TV, etc.)
Help around the house (e.g. timers and alarms, etc.)
60%
46%
43%
34%
31%
28%
22%
21%

2017 CANADIAN CONSUMER PAYMENT STUDY 37
FINDINGS & INSIGHTS
Financial Institution/Issuer Questions About Marketing, Communication and OffersOur last series of questions revolved around the financial institutions/issuers themselves. The questions ranged from: the importance of having all accounts at the same financial institution; to preferred methods of communication; to interest levels for receiving coupons and offers. The answers to these questions and more follow.
IMPORTANCE OF HAVING YOUR ACCOUNTS WITH THE SAME FINANCIAL INSTITUTION
For the second year in a row we asked: “how important is it to have all your financial products with the same banking institution/provider?” Exhibit 34 shows the results, which were consistent with last year. Forty-five (45) percent of survey respondents, compared with 44 percent last year, answered that question as important or very important. That is good news for those focused on cross-sales to existing customers.
Exhibit 34:Importance of Having Accounts with Same FI
0% 40%20% 30%10%
Not at all important
Not important
Neutral
Important
Very important
9%
18%
28%
14%
31%
7%
19%
30%
13%
31%
20172016

2017 CANADIAN CONSUMER PAYMENT STUDY 38
FINDINGS & INSIGHTS
METHOD OF INTERACTING WITH YOUR BANK/ACCESSING ACCOUNT INFORMATION
Although we didn’t delve into banking account access to a great extent, we thought it would be interesting to determine what method (and how often) consumers are interacting with their financial institutions. Mobile use is growing to the extent that many new offerings are being launched with a “mobile-first” approach. We thought it would be interesting to see, in addition to the questions we asked specifically about payments, what channels are being used the most for other activities. Exhibit 35 includes those channels where the survey respondents indicated they are interacting with their bank more than once a month. They could check all that applied
and most access their bank through multiple channels. You’ll note that PC/internet banking is still high on the list, but the growth of the use of mobile apps and internet smartphones or tablets are both approaching the 50 percent mark.
The percent of branch use is fairly high and we wondered how different this would look by age group. While we found that those who stated they visited a branch daily or a few times a week were primarily in the over 65 category, we didn’t find as wide a variance as we expected between the age groups for those visiting a branch once a month or a few times a month. Mobile app usage was definitely higher (and more frequent) with the younger age groups.
Exhibit 35:Method of Interacting With Your Bank or Accessing Bank Information (If More than Once a Month)
0% 100%80%60%20% 40% 90%70%50%10% 30%
PC (e.g. internet banking)
ABM
Internet smartphone
or tablet
Walk into a branch
Mobile app
Calling customer
support
82%
81%
63%
48%
44%
20%

2017 CANADIAN CONSUMER PAYMENT STUDY 39
FINDINGS & INSIGHTS
PREFERRED CHANNEL FOR RECEIVING COMMUNICATIONS
For the third year, we asked respondents to select their preferred channel when receiving various types of communication from their financial institution. The responses were very similar to the past two years, with a continued preference for email and continued growth in the use of text. Exhibit 36 shows the overall preferences by type of communication and the preferred channel.
Exhibit 36:Preferred Channel for Receiving Communications from Your FI
Marketing/special offers
Availability of new products
Change in terms of your account (e.g., interest rate, fees, etc.)
Potential unauthorized use of your account
Significant change to your account (e.g., address change, new card request, etc.)
Purchase transactions
Do not send Mail Email
26%
21%
6%
17%
16%
31%
51%
56%
53%
5%
5%
13%
6%
15%
15%
32%
47%
54%
Phone / text
2%
2%
5%
23%
12%
8%
Phone call
1%
2%
4%
27%
16%
3%
Social media
2%
2%
1%
0%
1%
1%
Mobile alert
1%
1%
1%
7%
4%
6%
2017 CANADIAN CONSUMER PAYMENT STUDY 40
FINDINGS & INSIGHTS
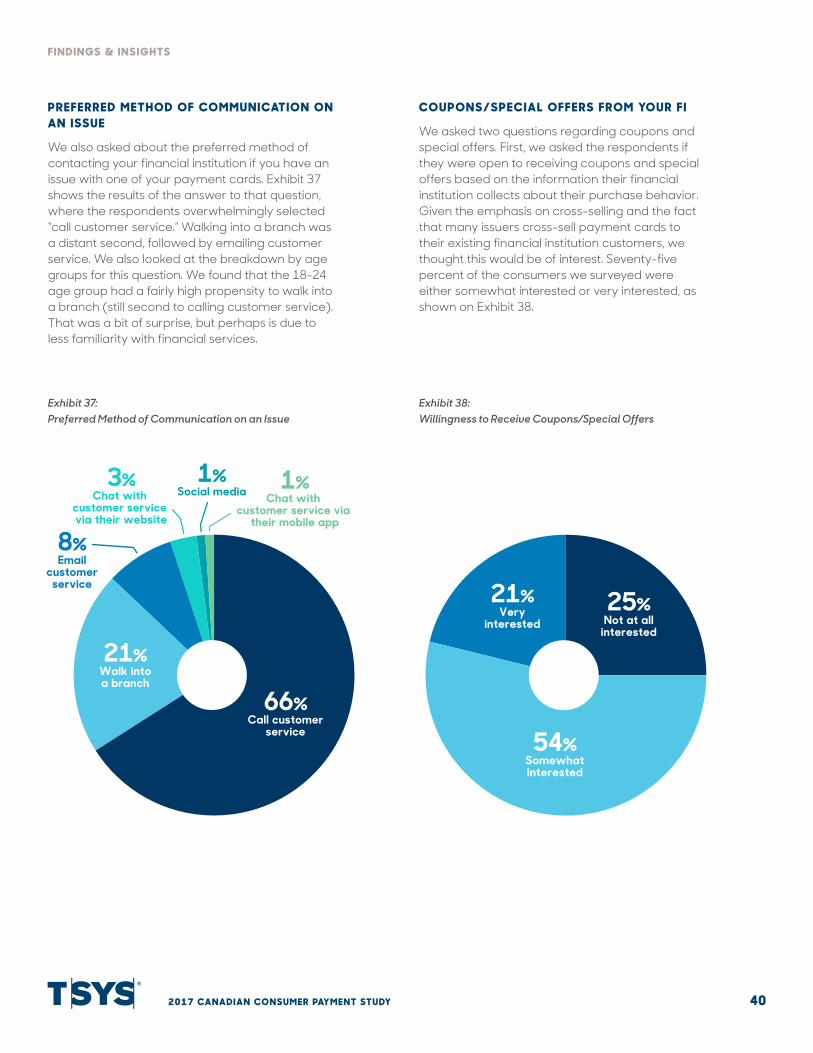
PREFERRED METHOD OF COMMUNICATION ON AN ISSUE
We also asked about the preferred method of contacting your financial institution if you have an issue with one of your payment cards. Exhibit 37 shows the results of the answer to that question, where the respondents overwhelmingly selected “call customer service.” Walking into a branch was a distant second, followed by emailing customer service. We also looked at the breakdown by age groups for this question. We found that the 18-24 age group had a fairly high propensity to walk into a branch (still second to calling customer service). That was a bit of surprise, but perhaps is due to less familiarity with financial services.
COUPONS/SPECIAL OFFERS FROM YOUR FI
We asked two questions regarding coupons and special offers. First, we asked the respondents if they were open to receiving coupons and special offers based on the information their financial institution collects about their purchase behavior. Given the emphasis on cross-selling and the fact that many issuers cross-sell payment cards to their existing financial institution customers, we thought this would be of interest. Seventy-five percent of the consumers we surveyed were either somewhat interested or very interested, as shown on Exhibit 38.
Exhibit 37:Preferred Method of Communication on an Issue
Exhibit 38:Willingness to Receive Coupons/Special Offers
66%Call customer
service
21%Walk intoa branch
8%Email
customerservice
1%Social media 1%
Chat with customer service via
their mobile app
3%Chat with
customer service via their website
54%Somewhatinterested
21%Very
interested25%
Not at allinterested

2017 CANADIAN CONSUMER PAYMENT STUDY 41
FINDINGS & INSIGHTS
For those respondents who indicated they were very interested or somewhat interested in receiving offers, we then asked how often they would like to receive them. We compared the data points from the last three years and the responses were very similar with once a
Exhibit 39:Frequency of Receiving Coupons/Special Offers
0% 60%40%20% 50%30%10%
Once a week
Once a month
Once a year
I want the ability to decide how often
Never
14%
15%
13%
43%
43%
51%
7%
7%
9%
23%
21%
22%
13%
14%
5%
2016 20172015
month being the most preferred timeframe. The percentage that said “never” was significantly lower this year, since this year we only asked the subset who had stated they were open to receiving offers.

2017 CANADIAN CONSUMER PAYMENT STUDY 42
FINDINGS & INSIGHTS
PAPER STATEMENTS
With the continued emphasis on cost and moving communications from paper to electronic channels, we thought it important to ask about paper statements, and compared this year’s answers to last year’s. Fifty-six percent of our respondents have asked their bank to stop sending paper statements, compared with 53 percent last year.
We added a follow-up question this year. We asked those who answered no what has prevented them from turning off their paper statements. We provided two options as well as an 'other' category and we also allowed write-in responses. Sixty-eight percent stated they want
Exhibit 40:Have You Asked Your Bank to Stop Sending You Paper Statements
Exhibit 41:Interest in Other New Products/Services
to have a physical record and 25 percent stated they hadn’t taken the time to do so. The write-in responses ranged from: “my spouse wants the paper” to “I do not support putting postal workers out of work by moving to electronic delivery of statements.”
INTEREST IN NEW PRODUCTS
The last question we asked in this area, also new this year, was what new products/services were they interested in their financial institution offering. We provided them with answer options and also allowed for write-in responses. Exhibit 41 depicts the breakdown of the responses. Both identity theft protection and credit scores/ratings ranked fairly high.
0% 70%60%20% 40% 50%10% 30%
Identity theft protection
Credit score/rating
Something else
Nothing
59%
47%
29%
1%
Yes
No
Unsure
2016 2017
53%
43%
4%
56%
40%
4%

2017 CANADIAN CONSUMER PAYMENT STUDY 43
CONCLUSION
IMPLICATIONS FOR ISSUERS
Consumers, particularly those under
the age of 65, have embraced using
mobile devices to manage their day-to-
day activities. They are also adopting
new ways to pay, particularly in areas
such as e-commerce and payments to
individuals (P2P). However, as much as
things change, others stay the same.
Our respondents showed that while they
are embracing the new — they are also
still very comfortable with many of the
existing practices. A consistent consumer
experience across multiple channels,
combined with real-time offerings, self-
service control features, rewards and
ease of use all remain strong influencers.

2017 CANADIAN CONSUMER PAYMENT STUDY 44
CONCLUSION
Multiple Ways to Pay: It’s Not Out with the Old . . . Yet The top three ways to pay: credit, debit and cash, have remained constant over the last four years of our study. Cash continues to be resilient, with more than 10 percent of our respondents selecting that option as their most preferred way to pay. We found an overall increase in debit use this year, although credit retained the top spot. We also found, once again, that consumers often use different payment types depending upon the type of purchase and whether or not the purchase was made in-store or online. There was a notable increase in the use of P2P in this year’s study, attributed to consumers’ knowledge and use of Interac’s e-Transfer service which many of the Canadian banks offer. The ever-changing landscape makes understanding the market and consumers’ preferences (the well-established and the early indicators) more important than ever.
Omnichannel Usage: And The Importance of Integrating Easily Consumers continually demonstrate that new channels don’t necessarily replace existing channels, but rather can frequently add to the ways in which they interact. Forty-four percent of our survey respondents now use a mobile app to access their bank information once a month or more. However, more than fifty percent of our respondents still use PCs and also go into the branch once a month. The importance of making the same information available across the growing number of channels – and keeping that information updated - is critical. Many throughout the payments industry are focused on modernizing technologies and increasing the use of technology which facilitates easy integration across channels. Ensuring consumers have a consistent experience and are able to use multiple channels seamlessly are now minimum requirements. These new technologies also facilitate the introduction of new products and services more quickly, which is also more important than ever with the current pace of innovation.
'Mobile First': But How Quickly Will Mobile Payments Take Off?There is no question that consumers have embraced mobile use and it has become an integral part of daily life. Consumers have also embraced this digitalization for their financial services’ activities — particularly those related to information and servicing. The use of merchant-specific apps and/or websites for shopping and related payments has also grown. To-date, the use of mobile

2017 CANADIAN CONSUMER PAYMENT STUDY 45
FINDINGS & INSIGHTS
wallets for in-store payments has not exploded to the levels predicted. However, all indications are that the timing may now be right for this to occur. Canadian consumers have clearly gotten comfortable with the use of the contactless/tap feature on their cards and they themselves predict that over 25 percent of their in-store purchases will be made using a mobile device over the next two years. It will be interesting to see if this proves the case. Regardless of the growth trajectory of mobile payments, it is clearly important to continue to expand mobile capabilities to ensure consumers are able to conduct the business they want using their mobile devices.
Security/Safety Continue to be Important to Many
Similar to previous years, many consumers continue to have some level of concern about security. This appears across many areas, but particularly when we ask about new payment offerings and online activity. The industry remains focused on the security aspects of both existing payment offerings and new ones. These security considerations, combined with the service received, likely factored into the number of consumers who believe it is important to have all of their financial products with the same financial institution (45 percent of our respondents). Our respondents ranked features which contribute to fraud prevention (e.g., immediately stop a transaction not made by you; instantly view transactions; use your phone to turn your payment card on/off to prevent unauthorized use, etc.) higher than others (see Exhibit 24). Several of the write-in comments we received specifically addressed security (“Every new form of payment is another opportunity to be hacked . . .”). Issuers who incorporate features which either increase the security of the payment method or add to consumers’ ability to manage risk, will likely benefit. In some cases, even increased education on the security and control features which already exist on the account may be beneficial.
Anything, Anytime, Anywhere: Communications, Servicing, Payments and RewardsConsumers expect and demand access to anything at anytime and anywhere. This demand has no boundaries, but rather affects how consumers communicate (one-way and two-way), how they purchase and pay, how they give and get information and also how they earn and redeem rewards. Consumers want control, as evidenced by the types of mobile features for which they expressed interest, and they want this control and access real-time. Our study also showed that consumers want real-time rewards and the ability to immediately access those benefits they’ve accumulated. With all of the choices consumers have for buying and paying — it’s more important than ever that issuers provide these services to their consumers . . . what they want, how they want it and when they want it.

2017 CANADIAN CONSUMER PAYMENT STUDY 46
APPENDIX
Respondent Demographics
Exhibit 42: Gender
Exhibit 44: Age
49%Male
51%Female
17%25-34
12%18-24
16%35-4418%
45-54
17%55-64
21%65 or older
Exhibit 43: Education 3%
Some secondary/high school
2%Prefer not to answer
21%Some university -
no degree
25%Graduated secondary/high school
13%Post graduate
degree
36%Graduateduniversity
(2- or 4- year)
Exhibit 45: Employment Status
8%Self-employed or
small business owner
6%Homemaker
5%Student
5%Unemployed
53%Employed full-or part-time
23%Retired

2017 CANADIAN CONSUMER PAYMENT STUDY 47
APPENDIX
Exhibit 47: Type of Devices Owned
0% 60%20% 40%
An Android-based smartphone
A tablet
A basic voice and text messaging
cell phone
An Apple iPhone
Do not own a mobile device of
any type
A ‘wearable’ device, (e.g. smart watch,
fitness band, activity tracker, etc.)
A BlackBerry® smartphone
Another type of smartphone
A Microsoft®-based smartphone
44%
38%
35%
13%
7%
7%
4%
2%
2%
Exhibit 46: Household Income
22%$50,000-$74,999
16%$75,000-$99,999
5%$150,000
or more
8%Prefer notto answer
11%Less than$25,000
23%$25,000-$49,999
15%$100,000-$149,999

ABOUT TSYS
TSYS® (NYSE: TSS) unlocks opportunities in payments
for payment providers, businesses and consumers.
Our headquarters are in Columbus, Georgia, USA, and
we operate in more than 80 countries with local offices
across the Americas, EMEA and Asia-Pacific.
We provide seamless, secure and innovative solutions across the
payments spectrum — from issuer processing and merchant
acquiring to prepaid program management — delivered through
partnership and expertise. We succeed because we put people,
and their needs, at the heart of every decision. It’s an approach
we call "People-Centered Payments®."
Our industry is changing every day — and we’re leading the
way towards the payments of tomorrow. We routinely post all
important information on our website. For more, visit us at tsys.com.
CALL US:
Africa +27 21 5566392
Asia-Pacific +603 2173 6800
Commonwealth of Independent States +7 496 287 3800
Europe +44 (0) 1904 562000
India & Southeast Asia +911204191000
Middle East +971 (4) 391 2823
North & Central America, Mexico & the Caribbean +1.706.644.3819
South America +1.706.644.3819
©2017 Total System Services, Inc.® All rights reserved worldwide. Total System Services, Inc. and TSYS® are federally registered service marks of Total System Services, Inc. in the United States. Total System Services, Inc. and its affiliates own a number of service marks that are registered in the United States and in other countries. All other products and company names are trademarks of their respective companies. (08/2017)
To learn more: contact 1.706.649.2307 or email [email protected].
twitter.com/tsys_tss
facebook.com/tsys1
linkedin.com/company/tsys
![PAYMENT METHODS FOR CONSUMER-TO- CONSUMER ONLINE … · 2001] PAYMENT METHODS 3 because it never takes possession of either the goods or the payment.7 Thus eBay characterizes itself](https://static.fdocuments.net/doc/165x107/5f757b3d7c1fea448175a70b/payment-methods-for-consumer-to-consumer-online-2001-payment-methods-3-because.jpg)