TSX : KXS RICHARD MONKMAN, CFO JOHN SICARD, CPO April 2015.
17
TSX : KXS RICHARD MONKMAN, CFO JOHN SICARD, CPO April 2015
-
Upload
patience-bishop -
Category
Documents
-
view
216 -
download
2
Transcript of TSX : KXS RICHARD MONKMAN, CFO JOHN SICARD, CPO April 2015.

TSX : KXS
RICHARD MONKMAN, CFO
JOHN SICARD, CPOApril 2015
2
Forward Looking StatementsForward-Looking Information
This document contains forward-looking statements within the meaning of applicable Canadian securities legislation. In some cases, these forward-looking statements can be identified by words or phrases such as “may”, “will”, “expect”, “anticipate”, “aim”, “estimate”, “intend”, “plan”, “seek”, “believe”, “potential”, “continue”, “is/are likely to” or the negative of these terms, or other similar expressions intended to identify forward-looking statements. We have based these forward-looking statements on our current expectations and projections about future events and financial trends that we believe may affect our financial condition, results of operations, business strategy and financial needs.
These forward-looking statements include, among other things, statements relating to: our expectations regarding our revenue, expenses and operations; our plans for and timing of expansion of our solutions and services; our future growth plans; the acceptance by our customers and the marketplace of new technologies and solutions; our ability to attract new customers and develop and maintain existing customers; our expectations with respect to advancement in our technologies; our competitive position and our expectations regarding competition; and anticipated trends and challenges in our business and the markets in which we operate.
Forward-looking statements are based on certain assumptions and analysis made by us in light of our experience and perception of historical trends, current conditions and expected future developments and other factors we believe are appropriate, and are subject to risks and uncertainties. Although we believe that the assumptions underlying these statements are reasonable, they may prove to be incorrect. There can be no assurance that such statements will prove to be accurate, as actual results and future events could differ materially from those anticipated in such statements. Given these risks, uncertainties and assumptions, you should not place undue reliance on these forward-looking statements. These statements are provided to assist external stakeholders in understanding Kinaxis’ expectations as of the date of this document and may not be appropriate for other purposes.
Whether actual results, performance or achievements will conform to our expectations and predictions is subject to a number of known and unknown risks, uncertainties, assumptions and other factors, including those identified on page 3 of our Management’s Discussion and Analysis for the third quarter ended September 30, 2014, and in our other public disclosure documents, which are available under our profile on SEDAR (www.sedar.com). Although the forward-looking statements contained in this document are based upon what our management believes are reasonable assumptions, these risks, uncertainties, assumptions and other factors could cause our actual results, performance, achievements and experience to differ materially from our expectations, future results, performances or achievements expressed or implied by the forward-looking statements. The forward-looking statements made in this document relate only to events or information as of the date of this document is made and are expressly qualified in their entirety by this cautionary statement. Except as required by law, we do not assume any obligation to update or revise any forward-looking statements, whether as a result of new information, future event or otherwise, after the date on which the statements are made or to reflect the occurrence of unanticipated events.
Non-IFRS Measures
This document makes reference to certain non-IFRS measures, specifically Adjusted EBITDA. These non-IFRS measures are not recognized measures under IFRS and do not have a standardized meaning prescribed by IFRS, and are therefore unlikely to be comparable to similar measures presented by other companies. Rather, these measures are provided as additional information to complement the IFRS measures by providing further understanding of our results of operations from management’s perspective. Accordingly, they should not be considered in isolation or as a substitute for analysis of our financial information reported under IFRS. We use Adjusted EBITDA to provide investors with supplemental measures of our operating performance and thus highlight trends in our core business that may not otherwise be apparent when relying solely on IFRS financial measures. We also believe that securities analysts, investors and other interested parties frequently use non-IFRS measures in the evaluation of issuers. Our management also uses non-IFRS measures in order to facilitate operating performance comparisons from period to period, prepare annual operating budgets and assess our ability to meet our capital expenditure and working capital requirements.
Adjusted EBITDA is not a recognized, defined or standardized measure under IFRS. Our definition of Adjusted EBITDA will likely differ from that used by other companies (including our peers) and therefore comparability may be limited. Non-IFRS measures should not be considered a substitute for or in isolation from measures prepared in accordance with IFRS. Investors are encouraged to review our financial statements and disclosures in their entirety and are cautioned not to put undue reliance on non-IFRS measures and view them in conjunction with the most comparable IFRS financial measures.
For a reconciliation of Adjusted EBITDA to the most comparable IFRS financial measure please see page 7 of our Management’s Discussion and Analysis for the fourth quarter ended December 31, 2014:
• Under our profile on SEDAR (www.sedar.com)
All amounts are in United States dollars, unless otherwise indicated.
3
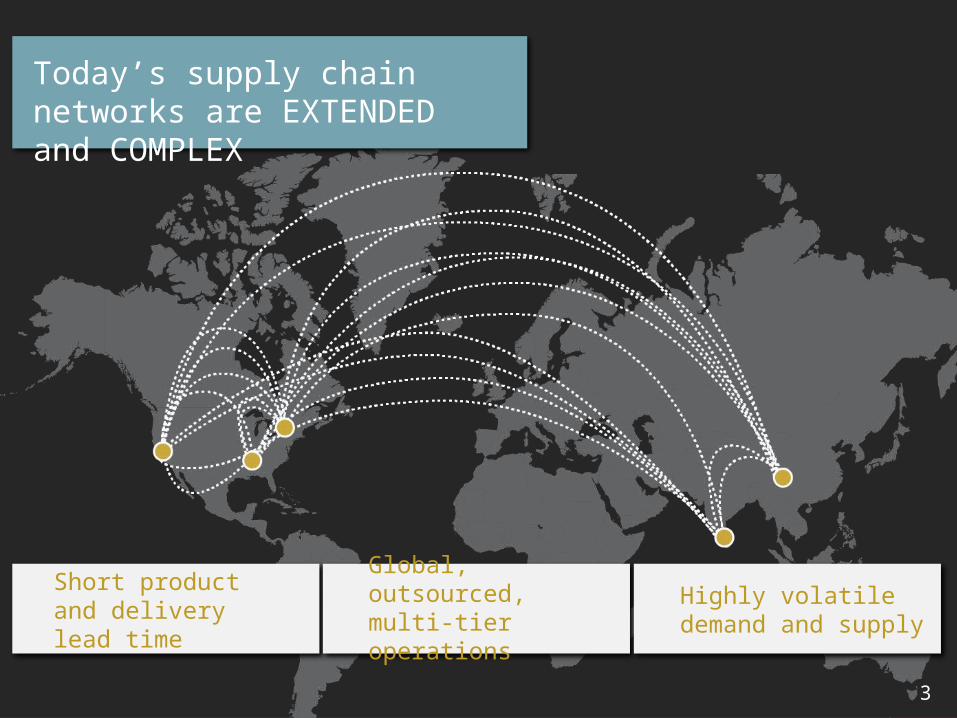
Today’s supply chain networks are EXTENDED and COMPLEX
Global, outsourced, multi-tier operations
Highly volatile demand and supply
Short product and delivery lead time
3
4
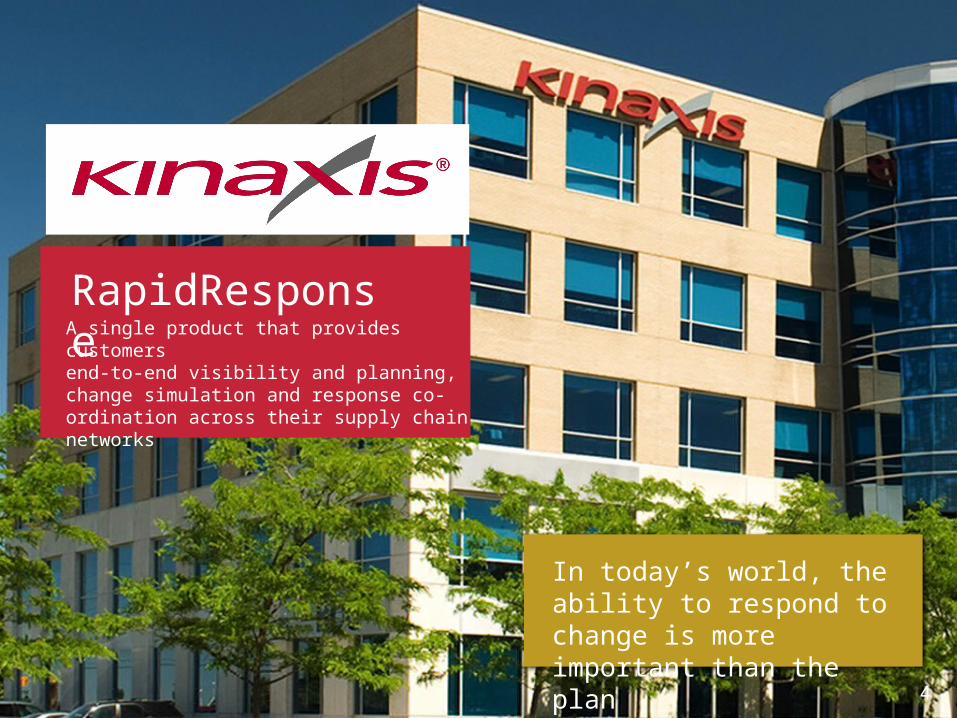
RapidResponseA single product that provides customers end-to-end visibility and planning, change simulation and response co-ordination across their supply chain networks
In today’s world, the ability to respond to change is more important than the plan
4
5
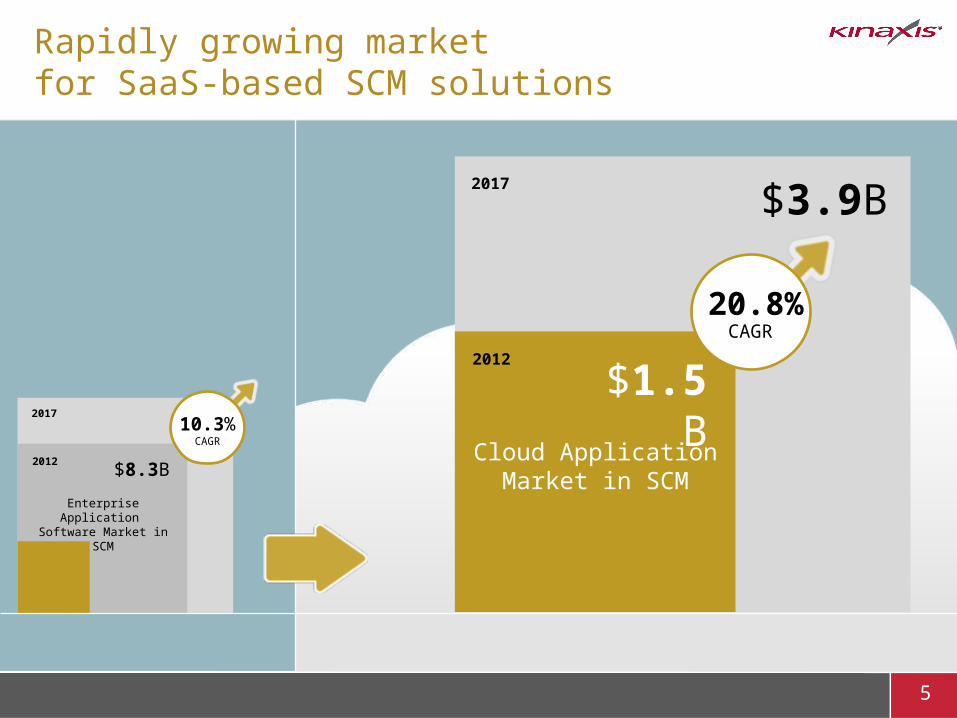
Rapidly growing market for SaaS-based SCM solutions
2012
2017
$8.3B
Enterprise Application Software Market in SCM
2012
2017
$3.9B
Cloud ApplicationMarket in SCM
$1.5B
20.8%CAGR
10.3%CAGR
6
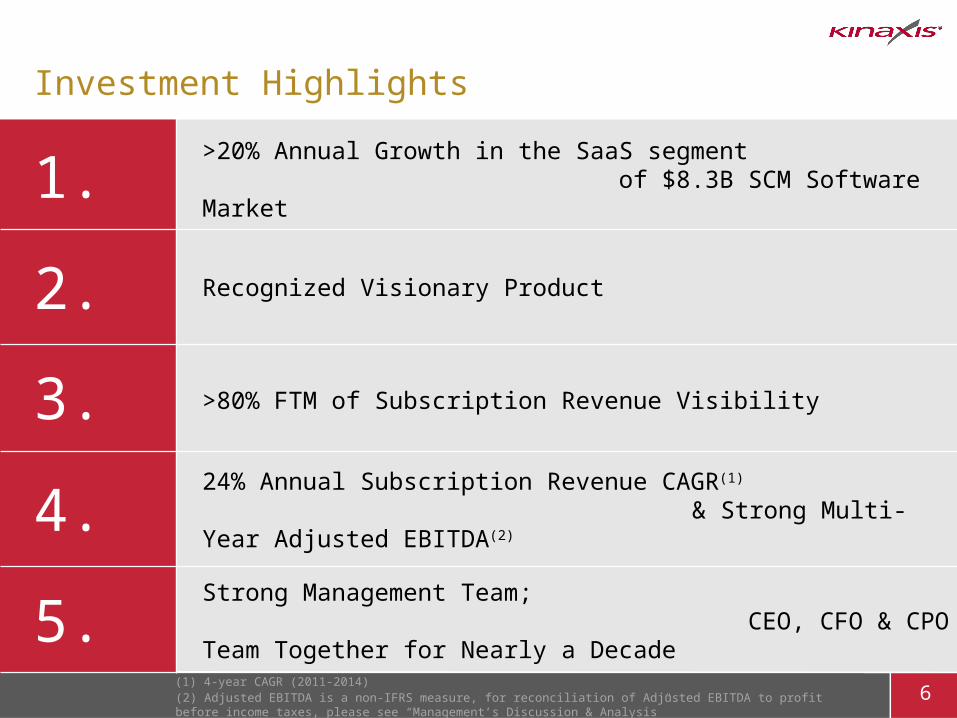
Investment Highlights
>20% Annual Growth in the SaaS segment of $8.3B SCM Software Market1.
2.
3.
4.
5.
Recognized Visionary Product
>80% FTM of Subscription Revenue Visibility
24% Annual Subscription Revenue CAGR(1)
& Strong Multi-Year Adjusted EBITDA(2)
Strong Management Team; CEO, CFO & CPO Team Together for Nearly a Decade
(1) 4-year CAGR (2011-2014)(2) Adjusted EBITDA is a non-IFRS measure, for reconciliation of Adjusted EBITDA to profit before income taxes, please see “Management’s Discussion & Analysis”
7
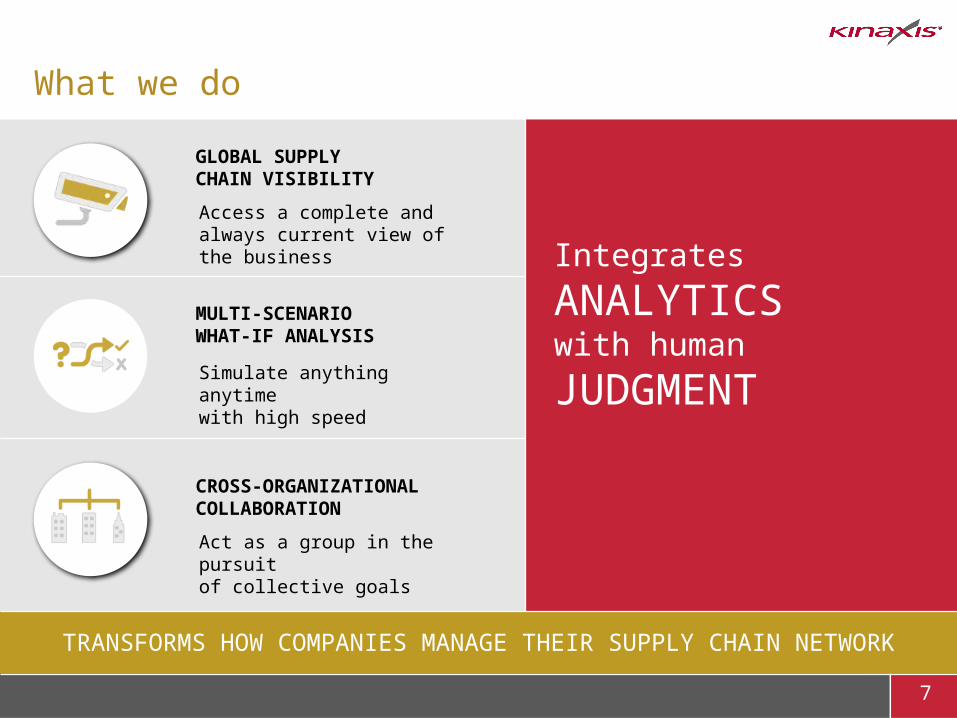
What we do
GLOBAL SUPPLYCHAIN VISIBILITY
Access a complete and always current view of the business
MULTI-SCENARIO WHAT-IF ANALYSIS
Simulate anything anytime with high speed
CROSS-ORGANIZATIONAL COLLABORATION
Act as a group in the pursuit of collective goals
Integrates
ANALYTICSwith human
JUDGMENT
TRANSFORMS HOW COMPANIES MANAGE THEIR SUPPLY CHAIN NETWORK
8
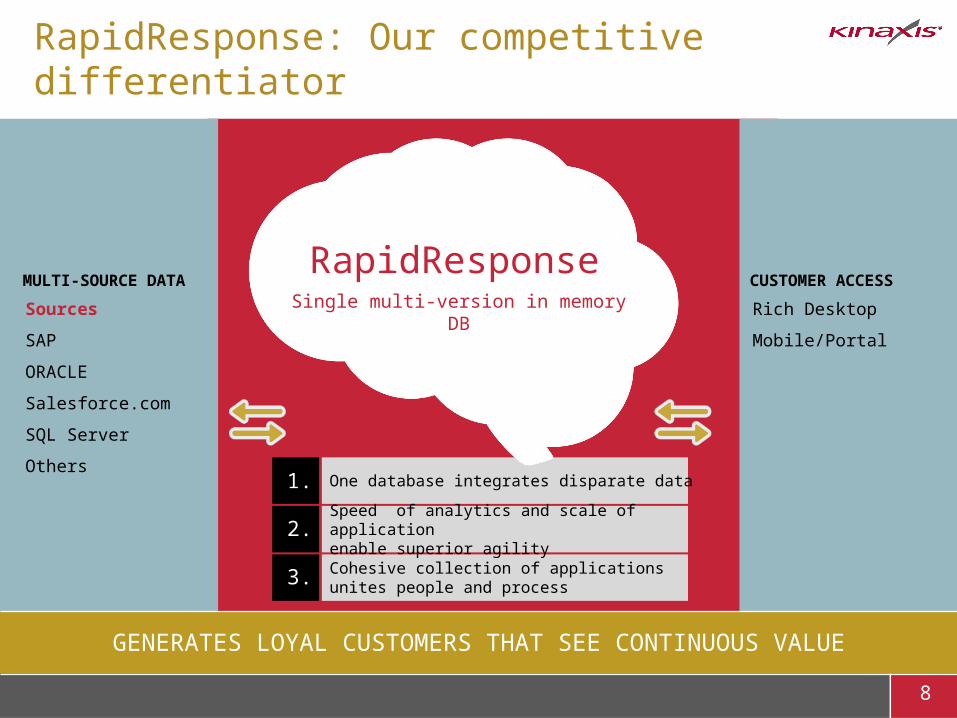
RapidResponse: Our competitive differentiator
GENERATES LOYAL CUSTOMERS THAT SEE CONTINUOUS VALUE
MULTI-SOURCE DATA CUSTOMER ACCESS
Rich Desktop
Mobile/Portal
Sources
SAP
ORACLE
Salesforce.com
SQL Server
Others1.
2.
3.
One database integrates disparate data
Speed of analytics and scale of application enable superior agility
Cohesive collection of applicationsunites people and process
RapidResponseSingle multi-version in memory DB
9
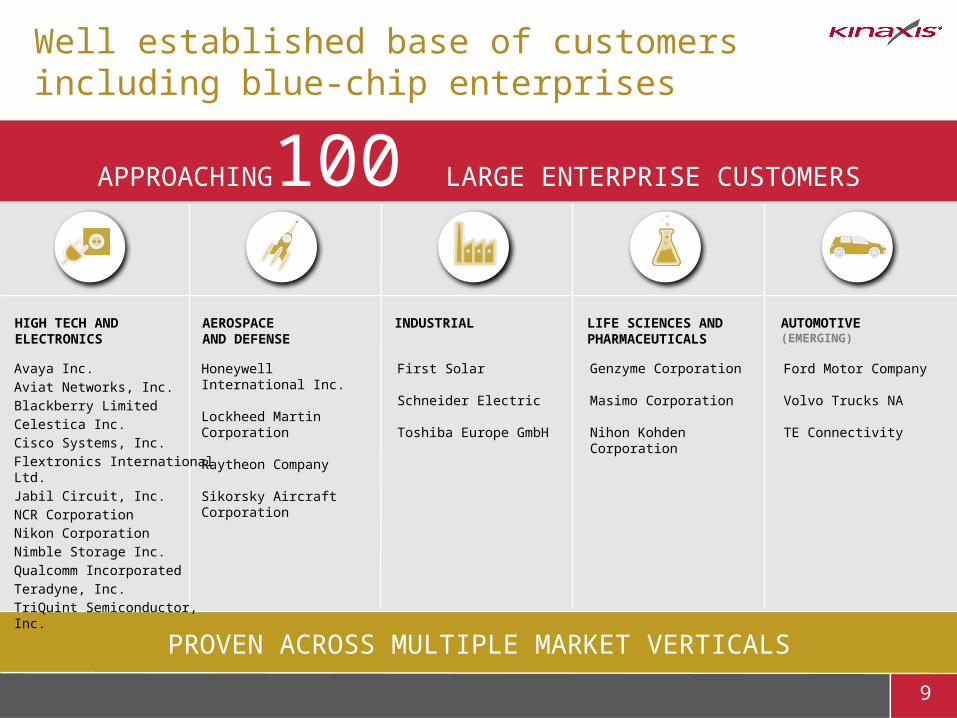
Well established base of customersincluding blue-chip enterprises
PROVEN ACROSS MULTIPLE MARKET VERTICALS
HIGH TECH AND ELECTRONICS
AEROSPACE AND DEFENSE
INDUSTRIAL LIFE SCIENCES AND PHARMACEUTICALS
Honeywell International Inc.
Lockheed Martin Corporation
Raytheon Company
Sikorsky Aircraft Corporation
First Solar
Schneider Electric
Toshiba Europe GmbH
Genzyme Corporation
Masimo Corporation
Nihon Kohden Corporation
APPROACHING100 LARGE ENTERPRISE CUSTOMERS
AUTOMOTIVE (EMERGING)
Ford Motor Company
Volvo Trucks NA
TE Connectivity
Avaya Inc.
Aviat Networks, Inc.
Blackberry Limited
Celestica Inc.
Cisco Systems, Inc.
Flextronics International Ltd.
Jabil Circuit, Inc.
NCR Corporation
Nikon Corporation
Nimble Storage Inc.
Qualcomm Incorporated
Teradyne, Inc.
TriQuint Semiconductor, Inc.
10
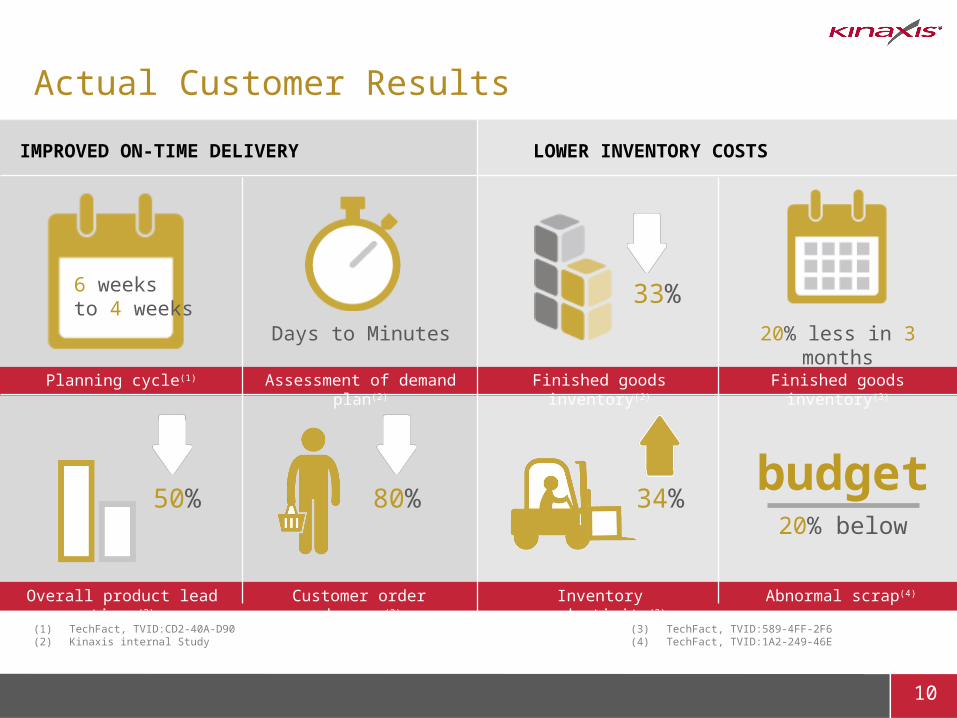
Actual Customer Results
IMPROVED ON-TIME DELIVERY LOWER INVENTORY COSTS
Overall product lead times(2)
Assessment of demand plan(2)
Customer order changes(2)
Finished goods inventory(2)
Abnormal scrap(4)
Finished goods inventory(3)
Inventory productivity(2)
6 weeks to 4 weeks
Days to Minutes
33%
20% less in 3 months
50% 80% 34%budget
20% below
(1) TechFact, TVID:CD2-40A-D90(2) Kinaxis internal Study
(3) TechFact, TVID:589-4FF-2F6(4) TechFact, TVID:1A2-249-46E
Planning cycle(1)

11
Plan Respond

12
Strong track record of revenue and adjusted EBITDA
HIGH LEVEL OF REVENUE VISIBILITY
2011 2012 2013 2011 2012 2013
Q4
2013
Q4
2014
Q42
013
Q4
2014
38.0
46.7
60.8
26.6
33.1
40.0
16.318.8
9.1
11.3
3.8
4.4
23%CAGR
24%CAGR
US Dollars (Millions)
REVENUE ADJUSTED EBITDA(1)SUBSCRIPTION REVENUE
2011
12.4
33%
2012
9.6
21%
2014
16.1
23%
(1) Adjusted EBITDA is a non-IFRS measure, for reconciliation of Adjusted EBITDA to profit before income taxes, please see “Management’s Discussion & Analysis”
12.6
9.9
13.3
10.1
27%QoQ
2014
70.1
2014
51.1
13.9
10.9
2013
15.0
25%
28%YoY
Q1
2013
Q2
2013
Q3
2013
Q4
2013
Q1
2014
Q2
2014
Q3
2014
Q4
2014
13
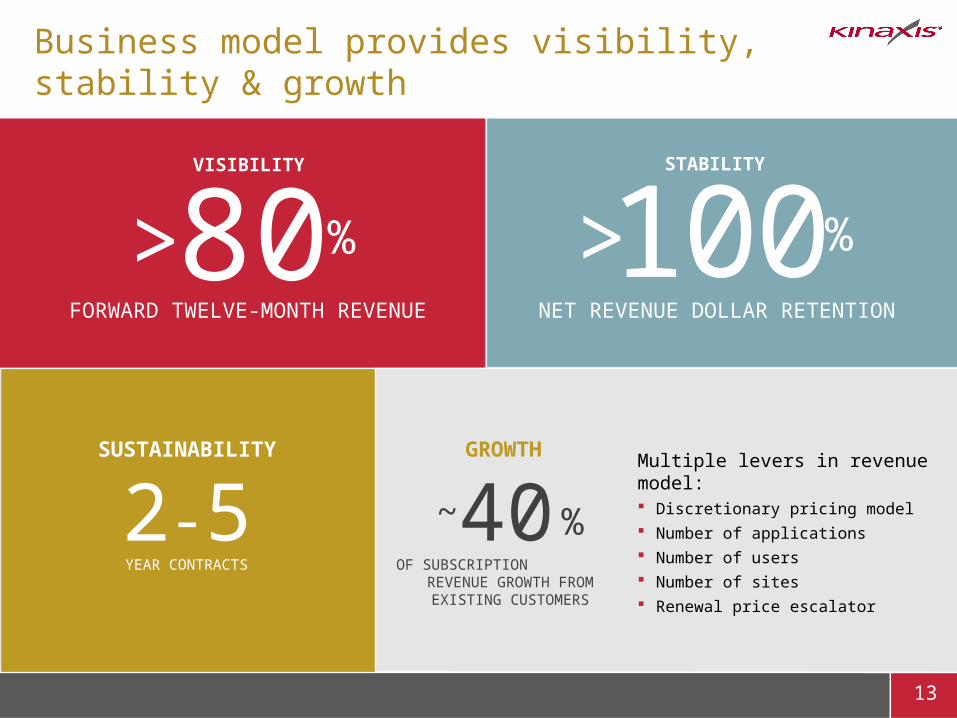
Business model provides visibility, stability & growth
NET REVENUE DOLLAR RETENTION
2-5
100> %
YEAR CONTRACTS
STABILITY
GROWTH
OF SUBSCRIPTION REVENUE GROWTH FROM
EXISTING CUSTOMERS
40 %
Multiple levers in revenue model: Discretionary pricing model Number of applications Number of users Number of sites Renewal price escalator
SUSTAINABILITY
FORWARD TWELVE-MONTH REVENUE
80> %
VISIBILITY
~
14
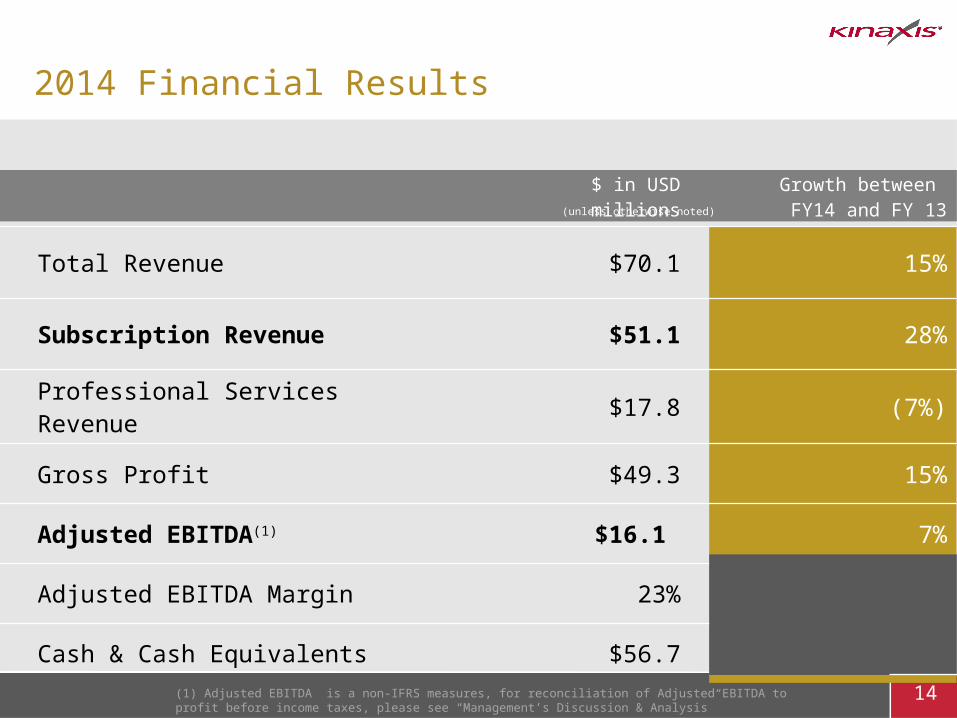
2014 Financial Results
$ in USD millionsGrowth between FY14 and FY 13
Total Revenue $70.1 15%
Subscription Revenue $51.1 28%
Professional Services Revenue $17.8 (7%)
Gross Profit $49.3 15%
Adjusted EBITDA(1) $16.1 7%
Adjusted EBITDA Margin 23%
Cash & Cash Equivalents $56.7
(unless otherwise noted)
(1) Adjusted EBITDA is a non-IFRS measures, for reconciliation of Adjusted EBITDA to profit before income taxes, please see “Management’s Discussion & Analysis”
15
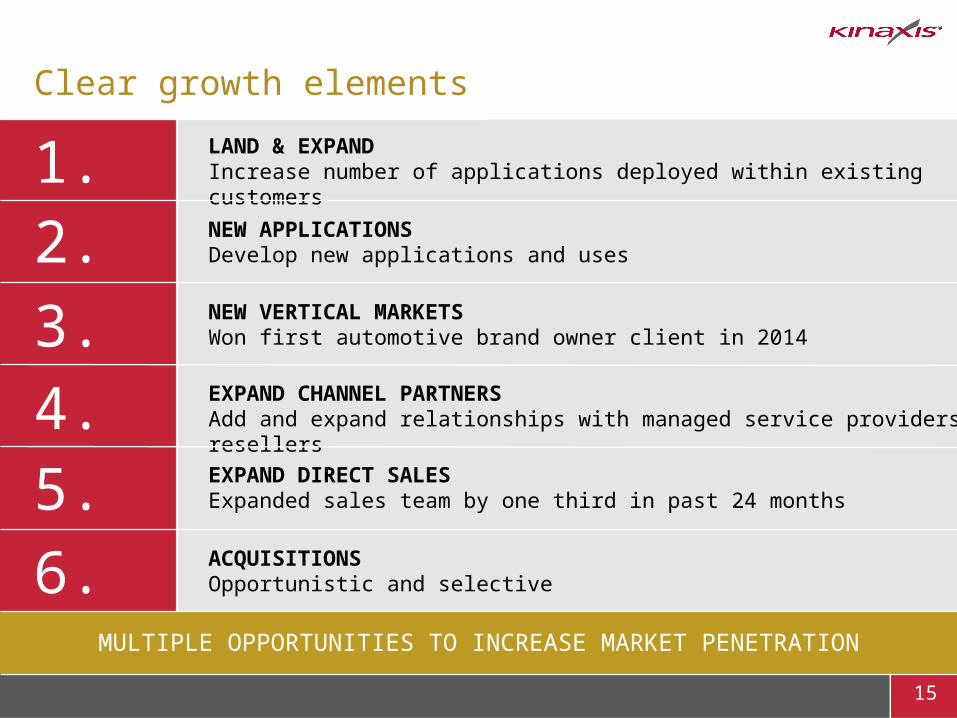
Clear growth elements
LAND & EXPANDIncrease number of applications deployed within existing customers
MULTIPLE OPPORTUNITIES TO INCREASE MARKET PENETRATION
1.2.
3.
4.5.
NEW APPLICATIONSDevelop new applications and uses
NEW VERTICAL MARKETSWon first automotive brand owner client in 2014
EXPAND CHANNEL PARTNERSAdd and expand relationships with managed service providers and resellers
EXPAND DIRECT SALESExpanded sales team by one third in past 24 months
6. ACQUISITIONSOpportunistic and selective
16
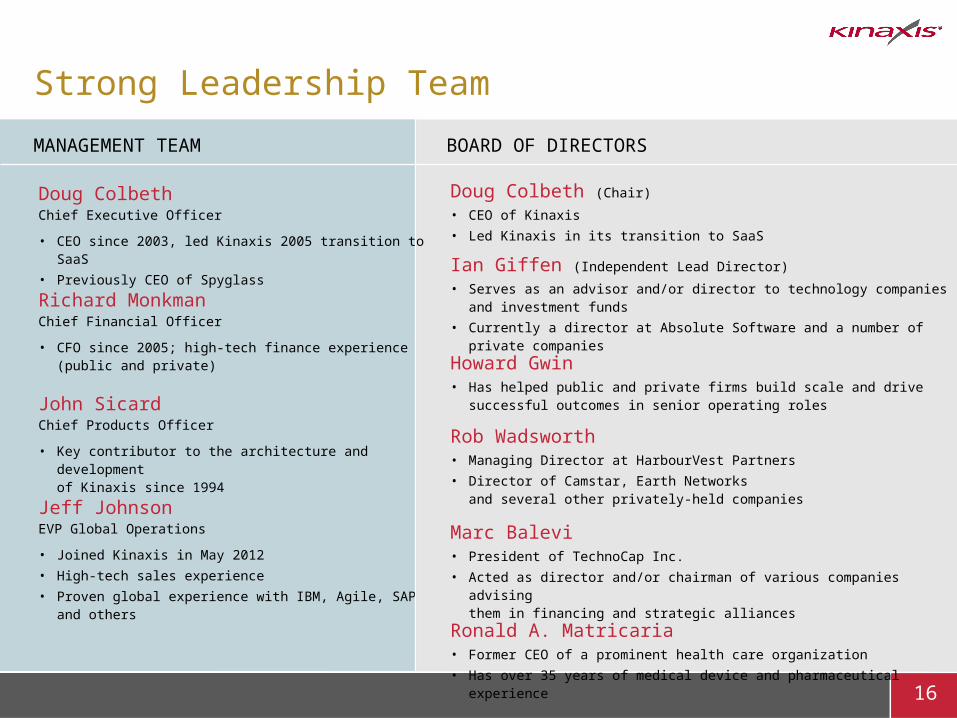
Strong Leadership Team
MANAGEMENT TEAM BOARD OF DIRECTORS
Doug Colbeth Chief Executive Officer
• CEO since 2003, led Kinaxis 2005 transition to SaaS• Previously CEO of Spyglass
Richard Monkman Chief Financial Officer
• CFO since 2005; high-tech finance experience (public and private)
John Sicard Chief Products Officer
• Key contributor to the architecture and development of Kinaxis since 1994
Jeff Johnson EVP Global Operations
• Joined Kinaxis in May 2012• High-tech sales experience• Proven global experience with IBM, Agile, SAP
and others
Doug Colbeth (Chair)• CEO of Kinaxis• Led Kinaxis in its transition to SaaS
Ian Giffen (Independent Lead Director)• Serves as an advisor and/or director to technology companies
and investment funds• Currently a director at Absolute Software and a number of private companies
Howard Gwin• Has helped public and private firms build scale and drive
successful outcomes in senior operating roles
Rob Wadsworth• Managing Director at HarbourVest Partners• Director of Camstar, Earth Networks
and several other privately-held companies
Marc Balevi• President of TechnoCap Inc.• Acted as director and/or chairman of various companies advising
them in financing and strategic alliances
Ronald A. Matricaria • Former CEO of a prominent health care organization• Has over 35 years of medical device and pharmaceutical experience
TSX : KXS
RICHARD MONKMAN, CFO
JOHN SICARD, CPOApril 2015