Tsunami damage to coastal defences and buildings in … · Department of Civil Engineering/Cabot...
35
Bull Earthquake Eng DOI 10.1007/s10518-012-9348-9 ORIGINAL RESEARCH PAPER Tsunami damage to coastal defences and buildings in the March 11th 2011 M w 9.0 Great East Japan earthquake and tsunami Stuart Fraser · Alison Raby · Antonios Pomonis · Katsuichiro Goda · Siau Chen Chian · Joshua Macabuag · Mark Offord · Keiko Saito · Peter Sammonds Received: 8 September 2011 / Accepted: 8 March 2012 © Springer Science+Business Media B.V. 2012 Abstract On March 11th 2011 a M w 9.0 mega-thrust interface subduction earthquake, the Great East Japan Earthquake, occurred 130 km off the northeast coast of Japan in the Pacific Ocean at the Japan Trench, triggering tsunami which caused damage along 600 km of coastline. Observations of damage to buildings (including vertical evacuation facilities) and coastal defences in T¯ ohoku are presented following investigation by the Earthquake Engi- neering Field Investigation Team (EEFIT) at 10 locations in Iwate and Miyagi Prefectures. Observations are presented in the context of the coastal setting and tsunami characteris- tics experienced at each location. Damage surveys were carried out in Kamaishi City and Kesennuma City using a damage scale for reinforced concrete (RC), timber and steel frame S. Fraser (B ) Massey University/GNS Science Joint Centre for Disaster Research, Massey University Wellington Campus, P.O. Box 756, Wellington, New Zealand e-mail: [email protected] A. Raby School of Marine Science and Engineering, Plymouth University, Plymouth, UK A. Pomonis · K. Saito Cambridge Architectural Research Limited, Cambridge, UK K. Goda Department of Civil Engineering/Cabot Research Institute, University of Bristol, Bristol, UK S. C. Chian Department of Engineering, University of Cambridge, Cambridge, UK J. Macabuag Building Design Partnership, London, UK M. Offord Sellafield Ltd, Warrington, UK P. Sammonds Institute for Risk & Disaster Reduction, University College of London, London, UK 123
Transcript of Tsunami damage to coastal defences and buildings in … · Department of Civil Engineering/Cabot...

Bull Earthquake EngDOI 10.1007/s10518-012-9348-9
ORIGINAL RESEARCH PAPER
Tsunami damage to coastal defences and buildings in theMarch 11th 2011 Mw9.0 Great East Japan earthquakeand tsunami
Stuart Fraser · Alison Raby · Antonios Pomonis ·Katsuichiro Goda · Siau Chen Chian ·Joshua Macabuag · Mark Offord · Keiko Saito ·Peter Sammonds
Received: 8 September 2011 / Accepted: 8 March 2012© Springer Science+Business Media B.V. 2012
Abstract On March 11th 2011 a Mw9.0 mega-thrust interface subduction earthquake,the Great East Japan Earthquake, occurred 130 km off the northeast coast of Japan in thePacific Ocean at the Japan Trench, triggering tsunami which caused damage along 600 km ofcoastline. Observations of damage to buildings (including vertical evacuation facilities) andcoastal defences in Tohoku are presented following investigation by the Earthquake Engi-neering Field Investigation Team (EEFIT) at 10 locations in Iwate and Miyagi Prefectures.Observations are presented in the context of the coastal setting and tsunami characteris-tics experienced at each location. Damage surveys were carried out in Kamaishi City andKesennuma City using a damage scale for reinforced concrete (RC), timber and steel frame
S. Fraser (B)Massey University/GNS Science Joint Centre for Disaster Research, Massey University WellingtonCampus, P.O. Box 756, Wellington, New Zealande-mail: [email protected]
A. RabySchool of Marine Science and Engineering, Plymouth University, Plymouth, UK
A. Pomonis · K. SaitoCambridge Architectural Research Limited, Cambridge, UK
K. GodaDepartment of Civil Engineering/Cabot Research Institute, University of Bristol, Bristol, UK
S. C. ChianDepartment of Engineering, University of Cambridge, Cambridge, UK
J. MacabuagBuilding Design Partnership, London, UK
M. OffordSellafield Ltd, Warrington, UK
P. SammondsInstitute for Risk & Disaster Reduction, University College of London, London, UK
123

Bull Earthquake Eng
buildings adapted from an earlier EEFIT tsunami damage scale. Observations show thatmany sea walls and breakwaters were overtopped, overturned, or broken up, but providedsome degree of protection. We show the extreme variability of damage in a local area dueto inundation depth, flow direction, velocity variations and sheltering. Survival of many RCshear wall structures shows their high potential to withstand local earthquake and significanttsunami inundation but further research is required into mitigation of scour, liquefaction,debris impact, and the prevention of overturning failure. Damage to steel and timber build-ings are also discussed. These observations are intended to contribute to mitigation of futureearthquake and tsunami damage by highlighting the key features which influence damagelevel and local variability of damage sustained by urban coastal infrastructure when subjectedto extreme tsunami inundation depths.
Keywords Great East Japan tsunami · Vertical evacuation · Field observations ·Tsunami fragility · Flow velocity estimates · Damage scale
1 Introduction
On March 11th 2011 at 14:46 local time (05:46 GMT), a Mw9.0 mega-thrust interface sub-duction earthquake, officially named as the Great East Japan earthquake, occurred 130 kmoff the northeast coast of Japan in the Pacific Ocean at the Japan Trench, triggering tsunamithat caused damage along a 600 km stretch of coastline in the Tohoku region. Coupled co-seismic rupture (lasting approximately 5 min) of several major fault segments in an area ofprior slip deficit resulted in a large fault plane 400–500 km in length by 100–200 km inwidth (Geo-Spatial Information Authority of Japan 2011a; Shao et al. 2011). The ruptureprocess resulted in significant deformation of the sea bed over a large area, which generatedthe tsunami. This deformation occurred as close as 70 km to the Tohoku coastline, leading torelatively short tsunami arrival times in the three worst-affected prefectures: Iwate, Miyagi,and Fukushima.Tide gauge records show that the first small tsunami waves with amplitudes of tens
of centimetres arrived at the coastline within 10 min of the earthquake (Okumura 2011),while the most damaging waves arrived after only 25 min in some locations in Iwate Pre-fecture. Maximum run-up of 40.545 m was recorded at Omoe Aneyoshi in Miyako City(The 2011 Tohoku Earthquake Tsunami Joint Survey Group 2011), while inundation heightsof between 5 and 15 m occurred in many locations. At Onagawa Town, Miyagi Prefec-ture, the tsunami had a maximum inundation height of 18.4 m (Takahashi et al. 2011a)and resulted in overturning of reinforced concrete (RC) buildings, discussed in Sect. 6.6.Over 1 million buildings suffered earthquake or tsunami damage and as of the same date19,185 people are confirmed dead or remain missing (National Police Agency of Japan2012).Coastal populations of Tohoku were among the best prepared in the world with respect
to tsunami, with extensive sea defences (including sea walls and breakwaters constructedspecifically for protection against tsunami), comprehensive earthquake and tsunami warningsystems, evacuation planning and public education. With wave heights sufficient to overtopand breach coastal defences, the tsunami caused extensive damage to residential areas, com-mercial and industrial facilities, agricultural land and infrastructure. Evacuation plans andplacement of tsunami mitigation infrastructure (defences, evacuation structures) had beendeveloped according to expected tsunami scenarios and previous events; however, in manyareas the expected inundation height and extent were exceeded in this event.
123

Bull Earthquake Eng
Fig. 1 Locations of tsunami damage investigations carried out by EEFIT, with an indication of the extent ofplains and rias coastline
A post-tsunami field mission was conducted by the authors representing the EarthquakeEngineering Field Investigation Team (EEFIT) of the Institution of Structural Engineers(IStructE) between May 28th and June 3rd 2011 in Iwate and Miyagi Prefectures. Our inves-tigations covered the coastline between Taro Town in the north and Yamamoto Town in thesouth (Fig. 1), while observations of ground shaking damage (Goda et al. 2012) also incorpo-rated inland areas. The full mission field report (EEFIT 2011) presents comprehensive fieldinvestigation results from all locations visited and includes observations on ground shaking,tsunami damage, and emergency response and recovery.The mission was conducted as early as possible following the event, considering requests
from host-country organisations that international reconnaissance teams wait until adequatetransport, accommodation and fuel supplies became available to support investigations. Thedelay ensured our investigation did not impede the emergency response and was intended tominimise any additional burden placed on host researchers. The authors recognise that dueto the delayed reconnaissance, a large degree of debris clean-up and demolition had occurredin the three months between March 11th and our field mission. Despite this impressive pro-gress, at the time of our visit there remained substantial amounts of in-situ debris and largenumbers of buildings unaffected by post-event activity, which warranted our investigation
123

Bull Earthquake Eng
and presentation of observations. We make no assumptions of building damage or tsunamicharacteristics where it was apparent that post-event debris clearance had taken place.Post-event damage observations such as those presented here are vital to record and
understand the performance of defence infrastructure and buildings for loss estimation anddevelopment of effective mitigation strategies. Inundation depth and velocity data must becollected in the field to aid validation of numerical tsunami inundation modelling, and thesedata combined associated assessments of damage are used in establishing tsunami fragilitycurves, such as in the methods applied by Koshimura et al. (2009). The objective of our fieldmission was to record and present such observations to supplement findings by Japanese andinternational researchers, and contributed to the already existing body of data on tsunamifragility in Japan (e.g. Hatori 1984 and Shuto et al. 1986, in Shuto 1993). Primary fieldobservations presented in this paper, notably building damage surveys relating inundationdepth to damage level enabled us to refine the EEFIT tsunami damage scale for reinforcedconstruction (EEFIT 2006) and propose new damage scales for steel frame and timber framebuildings for use in damage assessment following future events (Tables 3, 4, 5).Thepaper provides anoverviewof theMarch11th tsunami, its severity and effects (Sect. 2),
and a brief comparisonwith previous tsunami in Tohoku (Sect. 3). Section 4 describes coastaldefences in place in the Tohoku region, while Sect. 5 briefly discusses the provision of verti-cal evacuation structures in this region and their efficacy onMarch 11th. EEFIT observationsare then discussed for 10 locations (ordered from north to south) in Sect. 6, where we presentdetails of 2 building damage surveys, 3 updated tsunami damage scales (revised scale forRC, new scales for steel and timber frame buildings) and further interpretation of our obser-vations. In order to place the damage in context with the characteristics and severity of theevent, damage observations of defences and buildings in each location are preceded by a shortdescription of the location and summary of casualty figures. A summary of observations isprovided in Sect. 7, with conclusions on the use of such information in enhancing tsunamimitigation strategies in the future.
2 The Great East Japan tsunami of March 11th 2011
Following the occurrence of theMw9.0 earthquake at 14:46, wave heights of 6.7 m (recordedat 15:12, 18 km off Kamaishi) and 5.6 m (at 15:14, off the coast of Rikuzentakata) weredetected by offshore GPS tsunami monitoring buoys (Fujita 2011). Considering the effectsof shoaling as the wave enters shallow water, this suggested that the tsunami wave heightcould be up to 10 m once it reached the shoreline. Within 10 min of the earthquake the initialwaves, only tens of centimetres in height, had reached 3 tide gauges between Choshi, IbarakiPrefecture andMiyako, Iwate Prefecture (Okumura 2011).More significant waves exceeding3 m in height began to reach the coast from about 25 min after the earthquake (e.g. OfunatoCity, IOC/UNESCO 2011). The tsunami caused damage along 600 km of coastline, withestimates of area inundated between 400 and 500 km2 (300 km2 of this in Miyagi Prefecture)and affecting some urban areas particularly badly—Ishinomaki City and Yamamoto Townboth suffered inundation of 46% of their total area (CEDMHA 2011).The east coast of the Tohoku region comprises two very different forms which signifi-
cantly affected tsunami inundation extent and run-up: rias to the north of Ishinomaki Bay,and plains to the south (Fig. 1). The rias are drowned river valleys, open to the sea andcharacterised by a jagged-shaped coastline; neighbouring rias are separated by steep ridgesthat extend inland. In rias, the shape of the valley slows and constrains the incoming wave,amplifying the wave height and leading to significant run-up; inundation extent is limited by
123

Bull Earthquake Eng
Fig. 2 Schematic diagram defining tsunami terminology used in this paper (after Port and Airport ResearchInstitute 2011)
steep topography except where tsunami propagates up a river valley or channel. In contrast,the coastal plains are extensive areas of flat land often used for agriculture, and experiencedsubstantially lower run-up values but greater inundation extent (up to 7 km in this event; Geo-Spatial Information Authority of Japan 2011b), as there is less steep topography to restricttsunami flow. Tsunami terminology used in this paper is defined in Fig. 2.The location of greatest run-up and inundation height occurred in the rias: the maximum
recorded value of tsunami inundation height was 40.545 m at Omoe Aneyoshi (The 2011Tohoku Earthquake Tsunami Joint Survey Group 2011). This exceeds the previous highestever recorded wave height in Japan, of 38.2 m at Ryori Bay, Iwate Prefecture in 1896 (UnitedStates Geological Survey 2011). Additional observations of inundation height greater than 30m were recorded to the north of Taro Town, in Miyako City. Elsewhere in the rias coastline,inundation height of around 10 m was common and our surveys in Kamaishi City showedinundation heights of 7.0 to 9.0 m (Sect. 6.2). Inundation height of 9.5 m was measuredin the inner port area of Ofunato City and in Onagawa Town, inundation height of 14.8 mwas measured in the port area and 18.4 m immediately to the west of the port (Takahashiet al. 2011a). The coastal plains experienced inundation heights of 4.1–5 m in the port ofIshinomaki City, 7.3–8.0 m in Sendai Port and 9.7 m at Arahama Beach. Inundation heightwas 5.7 m at Sendai Airport terminal (Port and Airport Research Institute 2011).
3 Comparison of tsunami with past significant events
There have been several previous catastrophic tsunami in the Tohoku region. The Sanrikucoast (roughly corresponding to the extent of the rias, north of Ishinomaki City) has sufferedrepeated damage, particularly from the local 1896 Meiji-Sanriku (22,000 deaths; Tanakaet al. 2008), 1933 Showa-Sanriku (3,064 deaths; Takata 2009) earthquakes and the distal1960 Chilean earthquake (142 deaths; Takata 2009). During each of these events, Iwate Pre-fecture experienced tsunami heights exceeding 10m, and the 1896 eventwas comparablewiththe 2011 event (Earthquake Research Institute 2011). Minor damage was recorded in Otsuchiand Kuwagasaki (near Miyako City) due to the 1700 Cascadia event (Atwater et al. 2005).Further south in Miyagi Prefecture, however, previous tsunami have previously resulted
in inundation heights <5 m and further south from Sendai, generally <2 m (Watanabe 1998).
123

Bull Earthquake Eng
Therefore, in Miyagi and Fukushima Prefectures, inundation heights of 4–7 m (and greater)experienced on March 11th 2011 far exceeded experience of the last 120 years. However,tsunami further back in history are believed to have occurred with tsunami heights similarto the Great East Japan tsunami. In the 1611 Keicho earthquake, which caused fatalitiesestimated up to 5,000 mostly due to tsunami (Utsu 2002), a 6–8 m high wave devastated theSendai Plain. Satake et al. (2008) modelled the 869 Jogan earthquake and tsunami, gener-ating estimates of inundation extent of 1–3 km inland on the Sendai and Ishinomaki Plains,and 1.5–2 km inland further south in Fukushima Prefecture. These are comparable to, orexceed the inundation of the Great East Japan tsunami. It is possible that the 869 earth-quake had a similar location and magnitude to the March 11th earthquake (Simons et al.2011).
4 Coastal defences in Japan
Japan has a very high proportion of coastline to unit area of land and has relied heav-ily on a limited amount of flat coastal land for development, with 75% of its assets inthe 10% of the total land area that is flat coastal plain (Kokusai Kogyo Group 2011). Inthe region affected by the Great East Japan tsunami, four cities are classified as ‘majorports’ (Miyako, Kamaishi, Ofunato, and Ishinomaki) and Sendai-Shiogama as one of Japan’s23 ‘specially designated major ports’ serving international marine networks. The ports arecentres of production and import/export, passenger transport hubs, and provide businessactivities, housing and recreation and as a result, tsunami damage to ports has a knock-on effect beyond the immediate location. In addition to this importance of coastal landand facilities, the frequent occurrence of typhoons, storm surges and tsunami led to thedevelopment in Japan of some of the most extensive coastal defences in the world. Typicalcoastal structures of jetties, groynes, and breakwaters (both detached and submerged) maybe seen along the coastline, in addition to significant land reclamation projects. Tsunami-specific breakwaters and walls have been built along vulnerable coastlines, often at thoselocations badly affected by previous events, such as Taro Town, Kamaishi City and OfunatoCity.On March 11th a total of 8,500 m of breakwaters collapsed (Yagyu 2011), including
the newly-completed tsunami breakwater in Kamaishi City designed to withstand a tsunamiof 5–6 m. Many coastal protection structures along the Sanriku coast were designed basedupon the Meiji Sanriku tsunami, which was considerably smaller than the Great East Japan2011 event. As a result they were not effective in stopping the waves from overtopping, andin many situations suffered catastrophic failure. Takahashi et al. (2011b) suggested that infuture, rather than building even bigger structures, coastal defences should remain of similarsize, but with special attention given to their stability in order that they survive even a hugetsunami despite being overtopped. The rationale for this is that a defence that is overtoppedbut survives is better than no defence at all. The observed performance of individual defencestructures is described in Sect. 6.
5 Vertical evacuation structures
Japan has over 70,000 designated tsunami evacuation sites (The Japan Times 2011), com-prised of areas of land or buildings either located on high ground or considered far enoughinland to avoid inundation. Other buildings are designated as vertical evacuation structures,
123

Bull Earthquake Eng
Table 1 Number of peoplesurviving on the upper storeys ofbuildings in 5 municipalities onthe Sendai Plains (Iwate NichiNichi Shinbun 2011)
District Survivors onupper storeys
Number ofevacuationfacilities
Sendai City 2,139 4
Natori City 3,285 5
Iwanuma City 2,095 5
Watari 2,102 5
Yamamoto Town 91 1
located in the expected tsunami inundation zone but designated according to governmentguidelines (Cabinet Office Government of Japan 2005) to withstand tsunami loading andto have enough vertical height to provide safe refuge above estimated tsunami inundationlevel. Observations from theMarch 11th 2011 tsunami have shown the importance of verticalevacuation structures in providing refuge in the inundation zone.At least 9,700 people in 5 towns in the Sendai Plain survived the tsunami by evacuating to
the upper storeys of RC buildings (Table 1; Iwate Nichi Nichi Shinbun 2011). Loss of life wassignificantly reduced in Natori City and Iwanuma City through the use of vertical evacuationstructures, while in areas such as Yamamoto Town there was a lack of suitable structures onthe coastal plain. In Yamamoto Town, only 1% of residents living in the inundation zonewere able to survive by entering such a building as opposed to 27% in Natori City, 26% inIwanuma City, 15% inWatari and 8% in coastal areas of Sendai City. An absence of verticalevacuation facilities was apparent in the tsunami affected wards of Sendai—Wakabayashi-kuand Miyagino-ku.EEFIT observations of vertical evacuation structures in the tsunami affected areas sug-
gest inconsistencies between municipalities in the planning and designation of evacuationstructures. Designated vertical evacuation structures performed well structurally (observeddamagewas generally limited to scour, debris strike, glazing and contents damage). However,additional research shows that many of these structures were close to being overtopped inthis event, and that there are many issues around the provision of welfare and access whichmust be improved in future (Fraser et al. 2012). In addition to the tsunami and earthquakeimpacts on such structures, concurrent or subsequent fire is a significant hazard that mustbe considered to ensure safety of evacuees taking refuge. Some evacuation centres, such asKadonowaki School in Ishinomaki City, were affected by fire which spread as burning debrisor spilled fuel floated on the water surface.
6 Field observations of tsunami damage
This section describes observations made at 10 locations investigated during the EEFIT mis-sion. For each location fatality rates are quoted; the full figures and data sources are presentedin Table 2 for comparison between locations. Damage levels referred to in this section relateto the EEFIT tsunami damage scales adapted from that used by EEFIT (2006). These scalesrange fromD0 (no damage) to D4 (collapse) according to descriptions of damage, occupancysuitability, and level of required repair for timber frame, steel frame and RC buildings. Theindividual scales are presented in Tables 3, 4 and 5 and are proposed for use in future post-tsunami damage surveys. These scales are demonstrated in our Kamaishi and Kesennumadamage surveys.
123

Bull Earthquake Eng
Table 2 Death toll and fatality rate at locations visited by EEFIT during the reconnaissance
Location Coordinates Casualties asof August 25th(Fire andDisasterManagementAgency ofJapan 2011)
Fatality rate Proportion ofpopulation livingin inundation zone(JapaneseMinistry ofInternal AffairsandCommunications2011) (%)
As a proportion oftotal citypopulation (%)
As a proportion ofpeople living inthe inundationzone (Geo-SpatialInformationAuthority of Japan2011b) (%)
KamaishiCity
39◦ 16′32.77′′N,141◦ 53′8.63′′E
883 dead,299missing
3.0 9.0 33
OfunatoCity
39◦ 4′54.80′′N,141◦ 42′30.79′′ E
336 dead,116missing
1.1 2.5 47
KesennumaCity
38◦ 54′29.02′′N,141◦ 34′11.98′′ E
1,007 dead,399missing
1.9 3.5 55
Minami-SanrikuTown
38◦ 40′38.46′′N,141◦ 26′46.93′′ E
551 dead,437missing
5.7 6.9 82
OnagawaTown
38◦ 26′43.64′′N,141◦ 26′39.80′′ E
547 dead,414missing
9.6 11.9 80
IshinomakiCity
38◦ 26′3.55′′ N,141◦ 18′9.68′′ E
3,158 dead,849missing
2.5 3.6 69
Wakabay-ashi-ku
38◦ 14′39.08′′N,140◦ 54′2.56 E
* July 8th,375dead, 28missing
0.3 4.3 7
Natori City 38◦ 10′17.49 N,140◦ 53′30.69 E
911 dead,76missing
1.4 8.1 17
YamamotoTown
37◦ 57′45.31′′N,140◦ 52′39.29′′E
670 dead,and 22missing
4.1 7.7 54
* This is the latest available data at ward resolution.
6.1 Taro Town, Iwate Prefecture
Taro Town is situated in an east-facing bay where two rivers flow from the north and westand is confined by steep hills. Sea walls designed for tsunami and standing 10 m highdominate the landscape of Taro, with an original wall and two new sections forming 4divided areas of the town, connected by tsunami gates. The concrete blocks of the newest
123

Bull Earthquake Eng
Table 3 EEFIT tsunami damage scale for RC frame or RC shear wall buildings of EMS-98 structural vulner-ability class D and E, i.e. moderate and high earthquake resistant design respectively, of up to 6 storeys height(adapted from EEFIT 2006)
Damage level Description
No damage (D0) No visible damage to the structure observed during thesurvey. Suitable for immediate occupancy
Light damage (D1) Flood damage to contents. Some non-structural (fittings,windows) damage. Damage is minor and repairable.Suitable for immediate occupancy
Moderate damage (D2) Out-of-plane failure or collapse of parts of or wholesections of masonry infill walls and windows atground storey. Repairable damage from debris impactto structural members (columns, beams, walls). Nostructural member failure. Scouring at corners of thestructures leaving foundations partly exposed butrepairable by backfilling. Unsuitable for immediateoccupancy but suitable after light repair
Heavy damage (D3) The structure stands but is severely damaged. Infillpanels above the 1st storey have been damaged orhave failed. Structural and non-structural membershave been damaged. Failure of a few structuralmembers which are not critical to structure stability(e.g. failure of infill concrete walls). Roofs aredamaged and have to be totally replaced or repaired.Significant scouring at corners of the structuresleaving foundations exposed, with minor repairabletilting. Structure requires extensive repair and isunsuitable for immediate occupancy
Collapse (D4) Partial or total collapse of the building. Collapse of largesections of foundations or structure due to heavyscouring or debris impact. Excessive foundationsettlement and tilting beyond repair. Damage to thestructure cannot be repaired and must be demolished
section of wall contained sand infill and were apparently constructed without reinforcementor interlocking blocks. As a result, they were almost all toppled from their positions andthe only parts of this section of wall left standing were some buttress supports and blocksaround the gates. The breakwater at the mouth of the bay showed signs of severe dam-age, while the sluice gates on the river were undamaged. The mean value of the inunda-tion depth and run-up height measurements was 21.47 m (The 2011 Tohoku EarthquakeTsunami Joint Survey Group 2011). In front of the tsunami walls (along the quay), onlytwo buildings survived: an RC frame building with significant tsunami damage to thelower 4 storeys and a steel-frame building whose structure appeared to be intact despiteremoval of cladding. Between the new and old sections of wall the village was completelydestroyed and only two buildings remained standing at the time of EEFIT survey (May31st). A 7-storey steel-frame hotel had sustained damage up to the 4th storey, with clad-ding entirely removed at the lowest 2 storeys. One storey of an RC structure remainedstanding but its additional storeys of timber construction had been washed away. The tsu-nami overtopped all sections of wall and most timber structures had been washed off theirfoundations even behind the oldest section (furthest inland) wall. Significant amounts ofdebris had been washed into this area and became trapped behind the walls as watersreceded.
123
Bull Earthquake Eng
Table 4 EEFIT tsunami damage scale for timber frame buildings of EMS-98 structural vulnerability class D
Damage level Description
No damage (D0) No visible damage to the structure observed during thesurvey. Suitable for immediate occupancy
Light damage (D1) Flood damage to contents. Some damage to the exteriorof the building’s cladding above foundation level andwindows/fittings at ground-floor level. Damage isminor and repairable. Suitable for immediateoccupancy
Moderate damage (D2) Ground-floor cladding has been destroyed partially butstructure is standing and may be reoccupied aftersubstantial repairs. Contents and fittings in theground-floor level will need to be replaced. Notsuitable for immediate occupancy, but in most casesdamage is repairable
Heavy damage (D3) Ground-floor cladding has been destroyed, and theremay be some damage to cladding at the 2nd storey.The load-bearing timber frame has been damaged bywater flow or debris impact, but the building is stillstanding. In many cases these buildings will have tobe demolished, as damage to the timber structure istoo extensive. Not suitable for occupancy
Collapse (D4) The building has extensive structural damage due toflow or debris impact, has collapsed partially ortotally, or has been washed away. The building willrequire demolition if still standing. Tsunami flow inthese buildings is usually above 3 m (measured fromground-floor level)
6.2 Kamaishi City, Iwate Prefecture
Kamaishi City is situated in an east-facing bay, with urban development concentrated alonga river valley 1.1 km wide at the port and bounded by steep hills to the north and south.Approximately 33% of Kamaishi’s population lived in the inundation zone, and the citysuffered 9% fatality rate within the inundated zone (Geo-Spatial Information Authority ofJapan 2011b; Japanese Ministry of Internal Affairs and Communications 2011).The tsunami on March 11th overturned the north section (990 m in length) of the newly-
completed offshore breakwater and although the south section (670 m in length) survivedmostly intact, it was left inclined (Yagyu 2011). The Port and Airport Research Institute(PARI) (Fujita 2011) ran numerical simulations which estimated that the tsunami heightwas 10.8 m on the offshore face but only 2.6 m on the onshore side. This difference inwater depth created a large hydrostatic force on the wall and along with water flowingthrough gaps between blocks of the breakwater causing scour, led to collapse of the wall(Kazama 2011). Despite the fact that the breakwaters were severely damaged, it is esti-mated that the breakwater reduced the height of the tsunami by 40% (from 13.7 to 8 m),delayed the tsunami arrival time onshore by 6 min allowing more time for evacuation, andreduced run-up from (a simulated height of) 20.2 m to the observed 10 m (Kazama 2011).Analysis of inundation and run-up heights by Mori et al. (2011) supports these simulationresults.EEFIT carried out a building damage survey on May 31st 2011 along 1 km of a road at
an elevation of <5m above mean sea level, comprising 2- to 3-storey mixed-use commercial
123

Bull Earthquake Eng
Table 5 EEFIT tsunami damage scale for steel frame buildings of EMS-98 structural vulnerability class E
Damage level Description
No damage (D0) No visible damage to the structure observed during thesurvey. Suitable for immediate occupancy
Light damage (D1) Flood damage to contents. Some non-structural (fittings,windows) damage. Damage isminor and repairable. Suit-able for immediate occupancy
Moderate damage (D2) Out-of-plane failure or collapse of parts of or whole sec-tions of infill walls, cladding and windows at ground sto-rey. Repairable damage from debris impact to structuralmembers (steel columns and beams). No structural mem-ber failure. Scouring at corners of the structuresmay leavefoundations partly exposed but repairable by backfilling.Unsuitable for immediate occupancy but suitable afterrepair
Heavy damage (D3) The steel frame is still standing, structural columns andbeams are in their pre-tsunami position despite somedamage due to pressure or debris impact, damming. Non-structural steel members may be buckled or fractured.The interior of the building and the cladding have beendestroyed,washed-away, at 2nd storey or above. Scouringat corners of the structures may leave foundations partlyexposed but repairable by backfilling. The building maybe re-occupied after reconstruction of all the non-struc-tural elements and fittings
Collapse (D4) The building has partially or totally collapsed due todebris impact or debris damming effects. Multiple struc-tural columns are buckled or fractured and cannot bereplaced without loss of stability, even though the build-ing is still standing. Building will have to be demolished
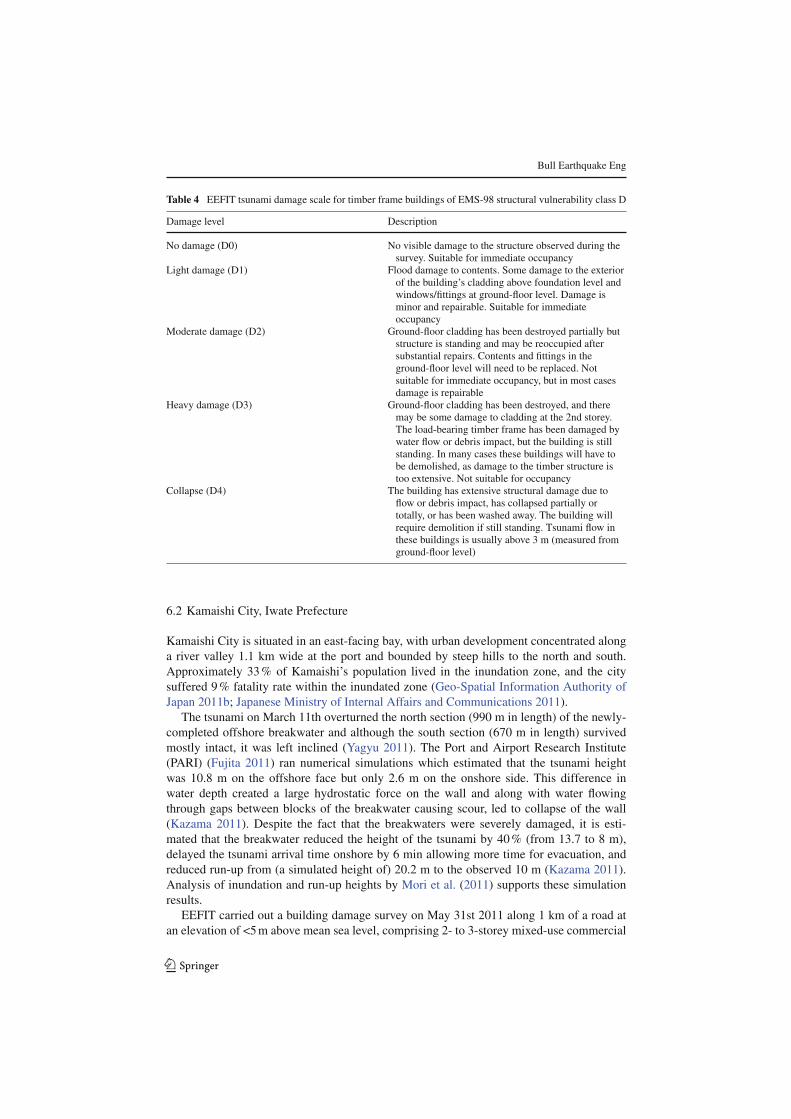
and residential buildings and a few commercial buildings of over 5 storeys. Land-use sea-ward of the survey area was industrial, including the large Nippon Steel Factory. Inun-dation depth of 8 m was recorded by EEFIT at the eastern end of the survey, decreasinggradually to around 2 m at the western end where the river flows towards the north-east(Fig. 3). The survey included 154 buildings (51% steel frame, 32% timber frame, 15% RC,2% unconfirmed steel frame or RC). Examples of buildings at different levels of damageas observed in our tsunami damage survey in Kamaishi City at each level are shown inFig. 4.Observed failure modes included (i) out-of-plane failure of infill walls and panel walls in
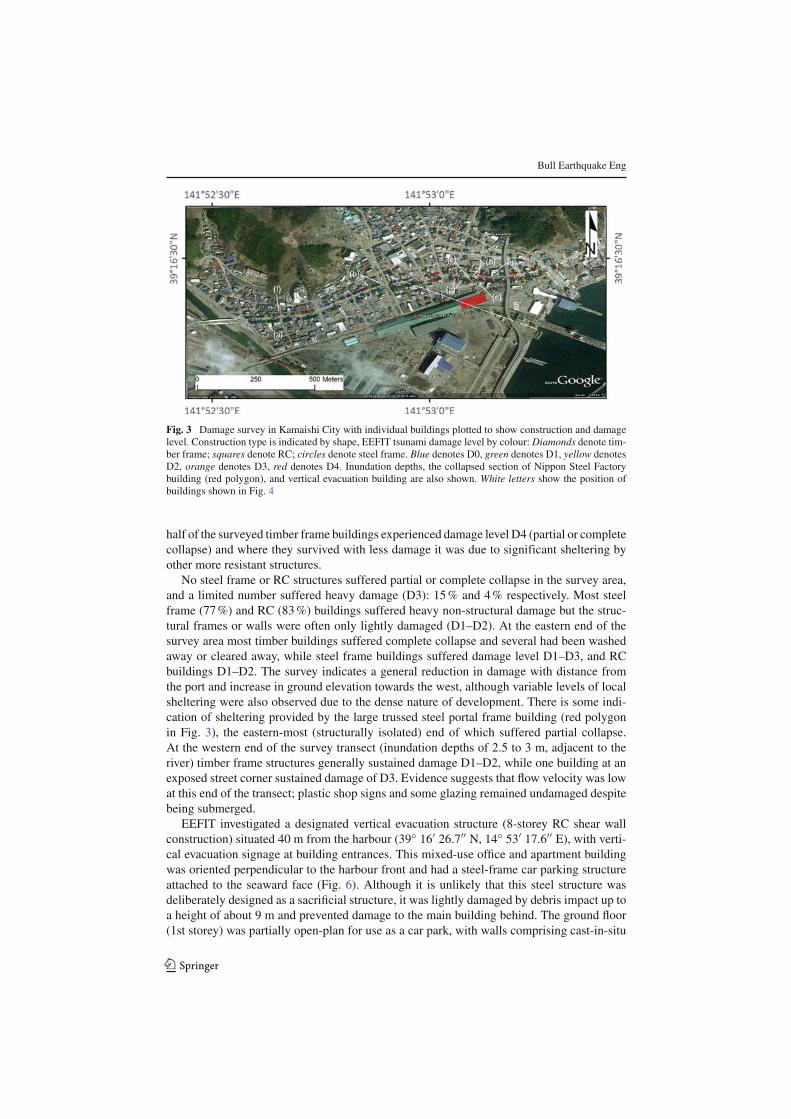
all construction types but particularly steel frame structures; (ii) debris impact damage (fromminor damage of exterior cladding to major damage of non-structural components of steelframes); (iii) extensive glazing damage at ground-floor level, some damage to 1st and 2ndstorey glazing; and (iv) soft-storey failure of several timber structures (Fig. 5).Regarding the observed soft-storey failure, short period component ground motions
recorded at K-NET station IWT007, 1.5 kmwest of Kamaishi port, were of sufficiently mag-nitude and duration to cause deformation in these structures, indicating that the soft-storeyfailure of some 2-storey timber frame buildings could be due to ground shaking. However,in areas that were not inundated, timber buildings performed well with respect to groundshaking. This suggests that, in this case, this style of failure may be due to tsunami loadingrather than ground shaking, despite the apparent sheltering of these timber buildings. Over
123
Bull Earthquake Eng
Fig. 3 Damage survey in Kamaishi City with individual buildings plotted to show construction and damagelevel. Construction type is indicated by shape, EEFIT tsunami damage level by colour: Diamonds denote tim-ber frame; squares denote RC; circles denote steel frame. Blue denotes D0, green denotes D1, yellow denotesD2, orange denotes D3, red denotes D4. Inundation depths, the collapsed section of Nippon Steel Factorybuilding (red polygon), and vertical evacuation building are also shown. White letters show the position ofbuildings shown in Fig. 4
half of the surveyed timber frame buildings experienced damage level D4 (partial or completecollapse) and where they survived with less damage it was due to significant sheltering byother more resistant structures.No steel frame or RC structures suffered partial or complete collapse in the survey area,
and a limited number suffered heavy damage (D3): 15% and 4% respectively. Most steelframe (77%) and RC (83%) buildings suffered heavy non-structural damage but the struc-tural frames or walls were often only lightly damaged (D1–D2). At the eastern end of thesurvey area most timber buildings suffered complete collapse and several had been washedaway or cleared away, while steel frame buildings suffered damage level D1–D3, and RCbuildings D1–D2. The survey indicates a general reduction in damage with distance fromthe port and increase in ground elevation towards the west, although variable levels of localsheltering were also observed due to the dense nature of development. There is some indi-cation of sheltering provided by the large trussed steel portal frame building (red polygonin Fig. 3), the eastern-most (structurally isolated) end of which suffered partial collapse.At the western end of the survey transect (inundation depths of 2.5 to 3 m, adjacent to theriver) timber frame structures generally sustained damage D1–D2, while one building at anexposed street corner sustained damage of D3. Evidence suggests that flow velocity was lowat this end of the transect; plastic shop signs and some glazing remained undamaged despitebeing submerged.EEFIT investigated a designated vertical evacuation structure (8-storey RC shear wall
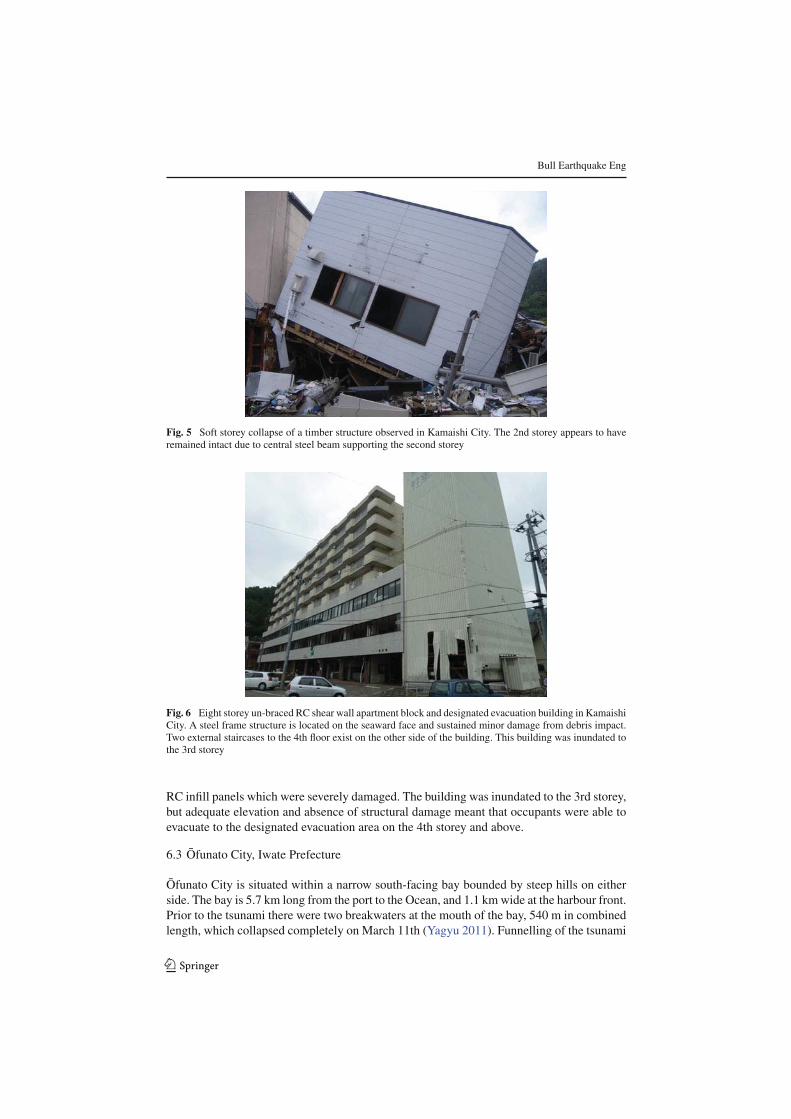
construction) situated 40 m from the harbour (39◦ 16′ 26.7′′ N, 14◦ 53′ 17.6′′ E), with verti-cal evacuation signage at building entrances. This mixed-use office and apartment buildingwas oriented perpendicular to the harbour front and had a steel-frame car parking structureattached to the seaward face (Fig. 6). Although it is unlikely that this steel structure wasdeliberately designed as a sacrificial structure, it was lightly damaged by debris impact up toa height of about 9 m and prevented damage to the main building behind. The ground floor(1st storey) was partially open-plan for use as a car park, with walls comprising cast-in-situ
123

Bull Earthquake Eng
Fig. 4 Photographs of structures surveyed in Kamaishi City, providing examples of the EEFIT tsunami dam-age scale applied for different structure types: a Timber frame structure, observed damage level D1; b Steelframe, D1; c Steel frame, D2; d RC shear wall, D2; e Steel frame, D3; f Timber frame, D3; g Timber frame,D4; h Timber frame, D4. The position of each photograph is indicated on Fig. 3 by the photograph letter
123
Bull Earthquake Eng
Fig. 5 Soft storey collapse of a timber structure observed in Kamaishi City. The 2nd storey appears to haveremained intact due to central steel beam supporting the second storey
Fig. 6 Eight storey un-braced RC shear wall apartment block and designated evacuation building in KamaishiCity. A steel frame structure is located on the seaward face and sustained minor damage from debris impact.Two external staircases to the 4th floor exist on the other side of the building. This building was inundated tothe 3rd storey
RC infill panels which were severely damaged. The building was inundated to the 3rd storey,but adequate elevation and absence of structural damage meant that occupants were able toevacuate to the designated evacuation area on the 4th storey and above.
6.3 Ofunato City, Iwate Prefecture
Ofunato City is situated within a narrow south-facing bay bounded by steep hills on eitherside. The bay is 5.7 km long from the port to the Ocean, and 1.1 kmwide at the harbour front.Prior to the tsunami there were two breakwaters at the mouth of the bay, 540 m in combinedlength, which collapsed completely on March 11th (Yagyu 2011). Funnelling of the tsunami
123

Bull Earthquake Eng
Fig. 7 Apartment building of RC shear wall construction in Ofunato City. Seaward side of the building isshown. Inundation reached the ceiling of the 3rd floor, but the structure remained intact. This landward sideof the building was sheltered from debris impact during the tsunami return flow
wave contributed to a wave height measured at 11.8 m at the harbour. The fatality rate (2.5%of the population living in the inundated area, Table 2) was among the lowest in the riascoastline, despite almost half of the population living in the area inundated, and was simi-lar to that of Miyako (3% of population living in inundated area; Geo-Spatial InformationAuthority of Japan 2011b; JapaneseMinistry of Internal Affairs and Communications 2011).From the tide gauge record obtained in the port, initial tsunami arrival at Ofunato City
occurred 25 min after the earthquake and took just 6 min to reach a height of 8 m, at whichpoint the gauge stopped recording (IOC/UNESCO 2011). There was a drawdown phase ofthe sea here prior to the tsunami arrival, and the 1st tsunami wave was the highest. Thecity experienced 0.78 m co-seismic subsidence (Geo-Spatial Information Authority of Japan2011c), resulting in frequent flooding since the event.Following the 1960 Chilean tsunami, when inundation depths of 5.6 m occurred in
Ofunato, some residents reconstructed their homes as 3-storey RC structures in the belief thatthese would survive future tsunami. However, on March 11th the tsunami inundated manyof these buildings up to the roof level. There was almost total collapse of timber buildingsin the area investigated. Many steel frame and RC buildings remained structurally intact butin the case of the steel buildings there was heavy damage to non-structural elements such asremoval of cladding, consistent with observations elsewhere.EEFIT inspected a 3-storey RC shear wall apartment building (39◦ 3′ 49.09′′ N, 141◦ 43′
12.74′′ E; Fig. 7). Maximum water levels reached the top of the 3rd storey level and possiblyovertopped the building. The structure remained intact as it avoided major debris impact,despite its proximity to the sea and its relatively exposed position. Many windows in thisbuilding remain unbroken and water marks in line with the top of the window openings wereseen in all rooms on the top storey, suggesting air void formation in the building. A distinctwater mark with a well-defined upper limit and deposition of sediment below on the inlandside of the building suggests a sustained period of standing water before recession of floodwaters slow enough to deposit sediment during recession. During the return flow this buildingwas sheltered by a 3-storey RC shear wall apartment building on its inland side, which hadsustained damage from debris impact.
123
Bull Earthquake Eng
6.4 Kesennuma City, Miyagi Prefecture
Kesennuma City is situated in a long, 1 km wide south-facing bay with most development onthe west side and at the northern head of the bay. The bay appears somewhat sheltered fromthe Ocean by Oshima Island and headland to the east. The tsunami at Kesennuma flowednorth up the bay, arrived at the harbour as a fast-flowing rising tide (Japan Coast Guard 2011)and overtopped harbour walls and river defences. Significant damage was sustained alongthe western shore of the bay (on the eastern side of the river) and in the northern area ofthe city at the head of the bay. Inundation height measurements of 7–8 m were recorded byEEFIT at approximately 500 m inland in the survey area at the head of the bay. KesennumaCity was severely affected by fire which appears to have started at the marine oil terminal inthe south of the city and spread extensively on floating debris. At the time of our visit, therewere damaged fuel tanks and burned propane cylinders among the debris. Although therewere many casualties in Kesennuma, this translates to relatively low a fatality rate of 3.5%of the population in the inundated zone (see Table 2).An extensive area of damage was surveyed in the northern part of Kesennuma City from
450 m inland to 1.1 km inland (Fig. 8). Flooding associated with 0.74 m of co-seismic sub-sidence (Geo-Spatial Information Authority of Japan 2011c) prevented closer access to theshoreline. Timber frame structures suffered heavy damage to collapse (90% sustained dam-age level D4), 60% of steel frame structures registered moderate to heavy damage (D2–D3),and 78% of the surveyed RC structures sustained light damage (D1). A large number of tim-ber frame buildings had been washed away or destroyed by fire and the building footprintswere not visible during the survey. Field observations have therefore been augmented withbuilding footprint data to estimate the total original number of buildings. Steel frame andRC buildings remain standing in areas most affected by fire, therefore all buildings identifiedfrom the GSI building footprints with no corresponding surveyed building are assumed to betimber frame, damage level D4 (collapse).Highly variable damage was induced by flows of similar depths in this survey area.
Although many timber frame structures are in a state of partial or complete collapse, therewere a significant number which remained standing (with damage level D1–D3) in flows of5–7 m depth, which is inconsistent with the 2 m wash-away threshold for Japanese timberhouses observed in the 1960 Chilean tsunami (Sasaki 1960, in Shuto 1993). A compre-hensive report into building damage from all affected areas by the Japanese Ministry ofLand Infrastructure Transport and Tourism (2011) (MLIT) shows a clear threshold for heavydamage or collapse to buildings at around 2.0 m: at 1.0–1.5 m inundation height, only 9%of buildings were washed away or rendered unrepairable, while this increases to 31% at1.5–2.0 m. At 2.0–2.5 m 66% of buildings were washed away or not repairable. The incon-sistency between this and the EEFIT survey highlights the importance of local effects oninfluencing damage levels to individual buildings.A number of timber frame dwellings constructed with an RC ground-floor structure
(Fig. 9), or on artificially raised land were present in the surveyed area. The impact of raisingresidential timber frame buildings was generally positive, with the majority sustaining lightto moderate damage depending on tsunami inundation depth or debris impact, as opposedto suffering heavy damage or collapse when built on concrete ring foundations just aboveground level.Embankments provided a large degree of protection to some parts of the survey area: the
railway running north is situated on an embankment approximately 4 m high, and Highway4 (traversing the northern valley) is situated on a 6 m high embankment. No scour or slopefailure was observed at these embankments and in both cases tsunami damage to buildings
123

Bull Earthquake Eng
Fig. 8 Damage survey in Kesennuma City with individual buildings plotted to show construction and damagelevel. Diamonds denote timber frame construction, squares denote RC, circles denote steel frame. Damagelevel is indicated by colour—Blue D0, green D1, yellow D2, orange D3, red D4. Inundation depths, heavilyfire damaged areas (orange outline) and subsided area (blue outline) are also shown. The subsided area wasflooded at the time of survey. Inset shows survey location in the context of Kesennuma Bay
behind the embankments was substantially lower than in front. Damage was not entirely pre-vented north of the Highway 4 embankment, as the tsunami flowed along a road which runsnorth under the highway. The railway embankment, although overtopped, blocked floatingdebris and prevented fire spreading to structures west of the railway. Tsunami impact west ofthe railway was limited to flood-damaged contents in modern timber dwellings. Clearly, theimpact of embankments was entirely related to their position and height relative to tsunamiinundation depth; however, these observations provide evidence that in low to moderate
123

Bull Earthquake Eng
Fig. 9 An example of a timber frame dwelling constructed with an RC ground floor structure. The main houseis 3 m above ground level, 780 m inland and 60 m from the river. Despite inundation depth of approximately6 m in this area, the house had sustained very little non-structural damage
inundation depths, placement of infrastructure on embankments can limit damage to bothinfrastructure and structures in the lee of the embankment.
6.5 Minami-Sanriku Town, Miyagi Prefecture
Minami-Sanriku Town is in a south-east facing bay at the junction of 3 river valleys(Fig. 10). The bay is broad, the mouth measuring 1.7 km across with little narrow-ing to the harbour front (1.1 km across) and further inland, where urban developmentextends to 1.5 km inland up the rivers. Despite less opportunity for wave amplifica-tion in this bay compared with some of the more narrow rias, tsunami height at theshore was estimated at 16 m (Take and Yamaya 2011) and observed by EEFIT to beat least 11 m at Shizugawa Hospital, 300 m inland. Inundation heights and inunda-tion extent here far exceeded those experienced during the 1960 Chile event, or thatexpected from the anticipated offshore Miyagi-ken-oki earthquake (around M 7.4 withrecurrence interval of <40 years). More than 82% of the town’s population residedwithin the area that was inundated and the fatality rate in this area was 6.9% (Table 2;Geo-Spatial Information Authority of Japan 2011b; Japanese Ministry of Internal Affairsand Communications 2011).The coastal defences in this town consisted of a sea wall and two flood gates across the
two river channels; the concrete pillars of these gates remain standing although the attachedsteel operating components were washed away. Long sections of the tsunami wall collapsedand evidence of inadequate interlocking of adjacent blocks in the concrete sea walls wasobserved, with the blocks relying on self-weight for stability.Steel frame buildings sustained heavy damage and EEFIT observed collapse of several
2- to 3-storey RC buildings from debris impact and significant scour. The 3-storey steel frameCrisisManagement Department (CMD) building (38◦40′ 40.06′′ N, 141◦ 26′ 46.82′′ E; 470mfrom the harbour front) remained standing with heavy damage after being inundated to itsroof at 10 m above ground level (Fig. 11).
123

Bull Earthquake Eng
Fig. 10 Satellite image showing Minami-Sanriku town in its coastal situation. Key buildings discussed inthe text are marked: Crisis Management Department, Shizugawa Hospital and Matsubara community housingapartment block, also designated as a vertical evacuation building
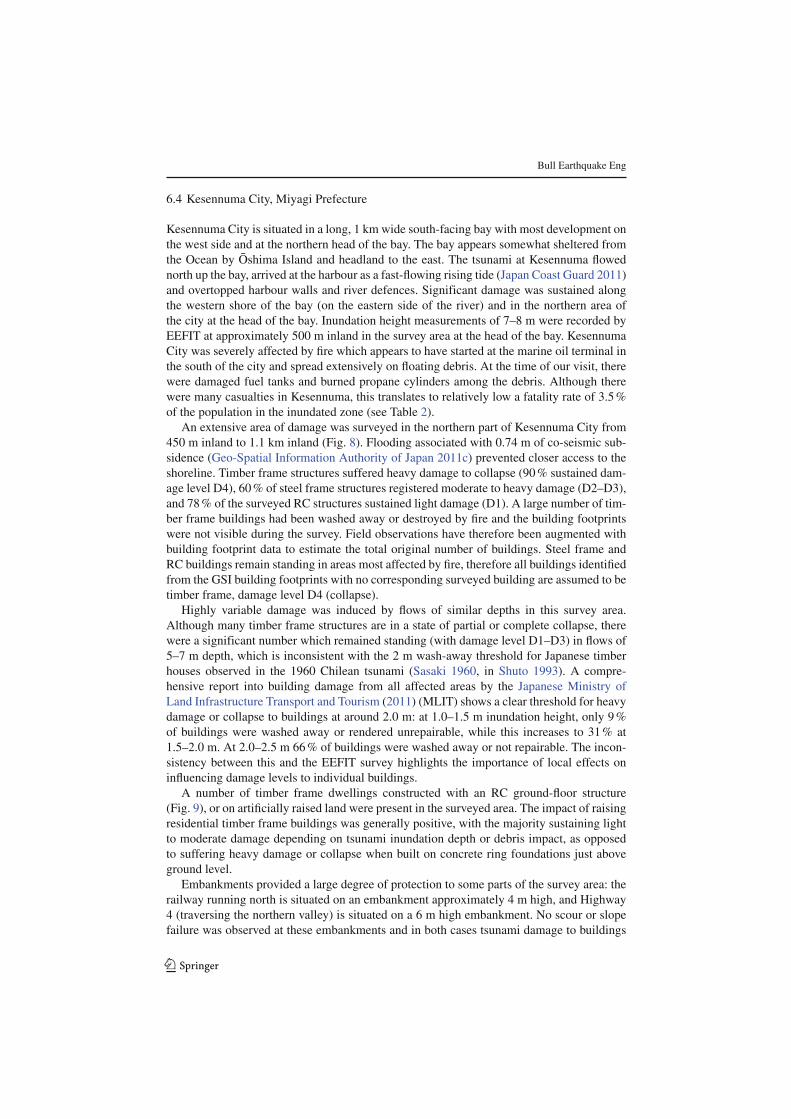
Several large RC buildings, including vertical evacuation structures, survived but sus-tained moderate to heavy damage. In the area up to 500 m from the port front, almostall timber frame structures suffered collapse and many steel frame and RC structures sus-tained moderate to heavy damage (D2–D3). Several RC structures within 300 m of thecoast suffered collapse due to extensive scour and/or debris strike (Fig. 12). The 4-storeyRC Matsubara community housing apartment block at the harbour front (38◦ 40′ 25.10′′N, 141◦ 26′ 42.93′′ E; Fig. 13), constructed in 2007, was designated for vertical evacu-ation. The structure was built parallel to the harbour front in the longitudinal direction,which did not appear to have affected its structural performance despite inundation to the4th storey and scour of the piled foundations to at least 2 m below previous ground level.The building was protected on the seaward side by a sea wall, which failed during the tsu-nami return flow; directly in front of this building this wall remained intact, but had failedwhere it was not sheltered in the return flow. Shizugawa Hospital (38◦ 40′ 34.44′′ N, 141◦26′ 44.99′′ E; Fig. 14) is a 4-storey RC shear wall construction with steel bracing, andshowed significant non-structural damage from debris impact including parts of the steelbracing.
123

Bull Earthquake Eng
Fig. 11 The 3-storey steel frame Crisis Management Department (CMD) building, located 470 m from theharbour front. This building was inundated to the roof (at 10 m elevation above ground level) and sustainedloss of all cladding although the structure remains standing. Damage to this building and the deaths of CMDstaff resulted in the loss of crisis management facilities and expertise in the immediate aftermath of the tsunami
6.6 Onagawa Town, Miyagi Prefecture
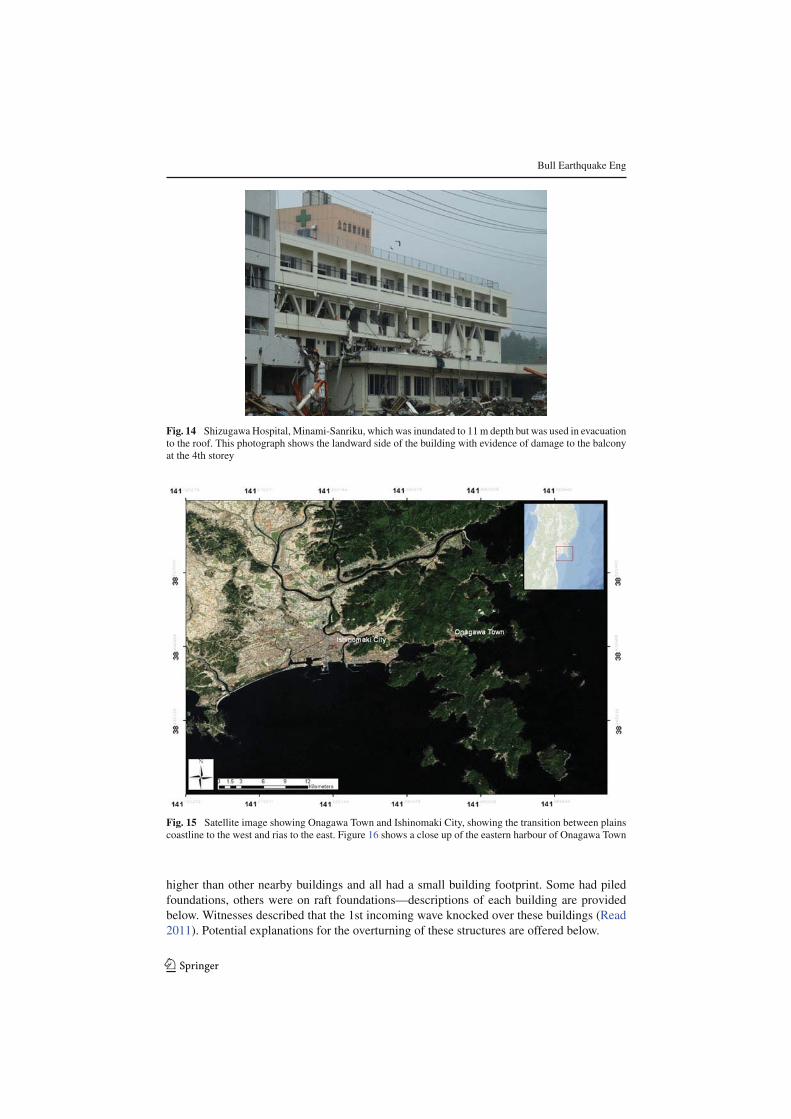
Onagawa Town is situated in a narrow valley exposed to the Ocean to the east, with an estuaryat the western end of the valley (Fig. 15). Maximum inundation depths here exceeded 16 mdue to flow from the east. The town suffered a high fatality rate (11.9% of the populationliving in the inundated zone, see Table 2), which was greater than the rate in Minami-Sanrikufor a similar level of population in the inundated area, and similar magnitude of tsunami inun-dation height. These figures suggest important differences in evacuation response betweenthese towns.The ground-floor of the hospital, 145 m inland from the harbour (38◦ 26′ 36.17′′ N, 141◦
26′ 43.19′′ E), was inundated despite being located on a hill 16 m above the harbour. Inun-dation was sufficient to float cars in the hospital car park (also at 16 m elevation), whilevehicles had been deposited on rooftops of two 3-storey buildings in the low-lying main areaof the town. Onagawa Town had two breakwaters situated 1 mile east of the harbour at themouth of the bay, each 300 m long with a maximum depth of 28 m and a 150 m gap between,constructed following the 1960 Chile tsunami (Noh 1966); post-tsunami aerial photographsindicate that the breakwaters were destroyed by the tsunami and only a few caissons remain
123

Bull Earthquake Eng
Fig. 12 RC building in Shiomi-cho, Minami-Sanriku, 100m from the sea (38◦ 40′ 29.10′′ N, 141◦ 26′ 44.96′′E) showing collapse of upper storeys. Several other RC buildings in the immediate vicinity of this buildinghad suffered collapse with evidence of severe scour and debris impact
Fig. 13 TheMatsubara apartment block and designated vertical evacuation building inMinami-Sanriku. Thisphotograph shows the landward side of the building with scour of at least 2 m at it northern end (a similaramount of scour was also observed at the southern end). Observations of this side of the building show littlestructural damage despite 16 m inundation height
visible above water level on the south section. In the urban area up to 400 m inland, timberbuildings had all collapsed (D4) and most steel frame buildings suffered moderate to severedamage and collapse (D2–D4). Many RC buildings sustained moderate damage (D2), and afew were severely damaged (D4) through overturning.Onagawa Town provided some of the most unexpected observations of this event: 5 RC
shear wall buildings and 1 steel frame building, all of 2- to 3-storeys height, were overturnedand moved from their original positions during the tsunami (movement indicated by arrowsin Fig. 16). This type of failure had not been previously observed for RC shear wall or steelframe buildings subject to tsunami loading. The aspect ratio of these buildings may have been
123
Bull Earthquake Eng
Fig. 14 ShizugawaHospital, Minami-Sanriku, which was inundated to 11m depth but was used in evacuationto the roof. This photograph shows the landward side of the building with evidence of damage to the balconyat the 4th storey
Fig. 15 Satellite image showing Onagawa Town and Ishinomaki City, showing the transition between plainscoastline to the west and rias to the east. Figure 16 shows a close up of the eastern harbour of Onagawa Town
higher than other nearby buildings and all had a small building footprint. Some had piledfoundations, others were on raft foundations—descriptions of each building are providedbelow. Witnesses described that the 1st incoming wave knocked over these buildings (Read2011). Potential explanations for the overturning of these structures are offered below.
123

Bull Earthquake Eng
Fig. 16 Satellite image of the harbour in Onagawa Town, indicating the (i) final locations of overturned RCand steel frame buildings (blue points, marked with building tag A–E) as observed by EEFIT; (ii) the track ofbuilding movement from the original position indicated by arrows (Tokimatsu et al. 2011); and (iii) positionsof two velocity estimations made for return flow velocity using video footage
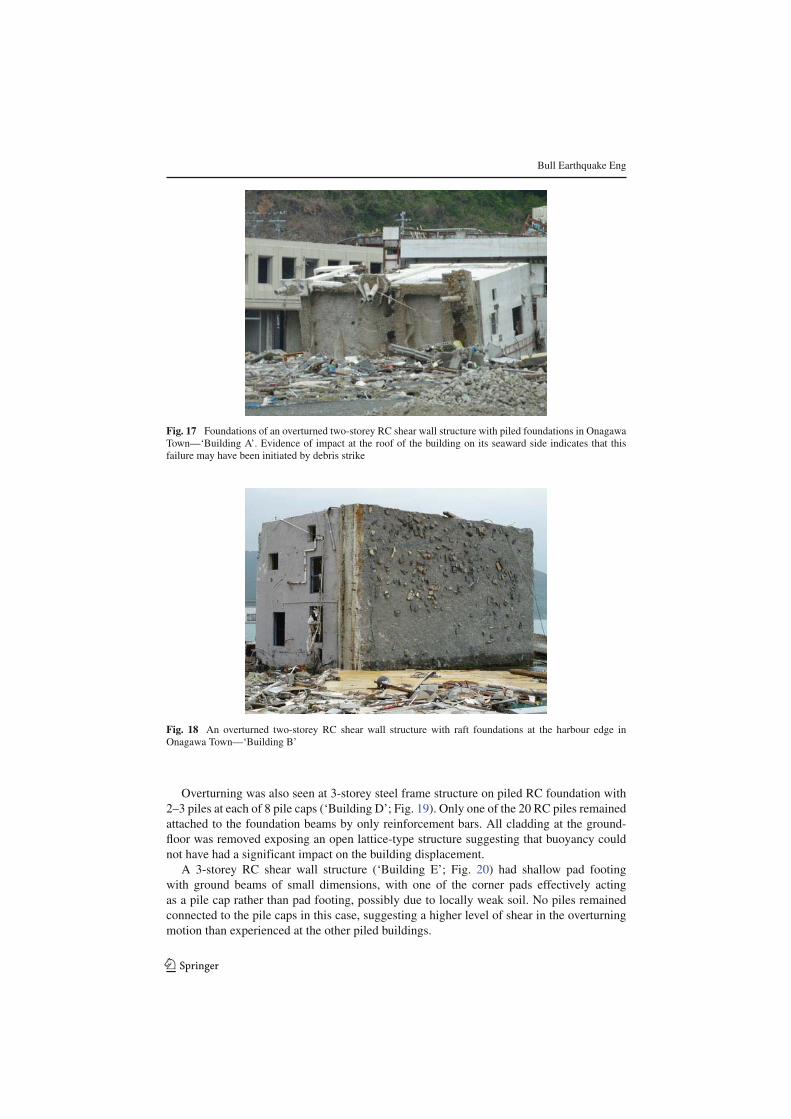
A 2-storey RC shear wall office building with piled foundations was overturned landwardduring tsunami inflow (‘Building A’; Fig. 17). The structure had one pile at each corner, andthree closely spaced piles at each of the central pile caps. The rebar in each pile did not extendvery far down the pile and they appeared quite lightly reinforced at the top, suggesting theywere designed only for shear, rather than also for tension. The uppermost (originally seaward)piles remained connected to the pile cap and were relatively straight, suggesting that they hadbeen pulled out of the ground and then failed in tension. In contrast, the bottom (originallylandward) piles were sheared off closer to the foundation and were all bent downwards; thissuggests the lateral forces imparted by tsunami flowwere concentrated on the landward piles,which became the pivot point in the overturning motion. Overturning in this case may havebeen initiated by debris strike, evidence of which was observed at the top of the structure.The final location of a 2-storey RC shear wall structure with raft foundation (‘Building
B’; Fig. 18) implied the building overturned seaward, however, it is expected that the initialfailure was landward (consistent with other structures) and the building had then been movedduring tsunami return flow to its final position. The raft foundation of this structure wasinadequate for resisting the effects of scour and the lateral forces imparted by tsunami flow.A 3-storey hotel (with 4th storey appendage) of RC shear wall construction (‘Building
C’), on raft foundation with evidence of a failed pile was moved approximately 30 m fromits original position (Shuto 2011) until it rested against the steep reinforced wall of the hillwhere the hospital is situated. This building had been removed by the time of our visit toallow free flow of traffic.
123
Bull Earthquake Eng
Fig. 17 Foundations of an overturned two-storey RC shear wall structure with piled foundations in OnagawaTown—‘Building A’. Evidence of impact at the roof of the building on its seaward side indicates that thisfailure may have been initiated by debris strike
Fig. 18 An overturned two-storey RC shear wall structure with raft foundations at the harbour edge inOnagawa Town—‘Building B’
Overturning was also seen at 3-storey steel frame structure on piled RC foundation with2–3 piles at each of 8 pile caps (‘Building D’; Fig. 19). Only one of the 20 RC piles remainedattached to the foundation beams by only reinforcement bars. All cladding at the ground-floor was removed exposing an open lattice-type structure suggesting that buoyancy couldnot have had a significant impact on the building displacement.A 3-storey RC shear wall structure (‘Building E’; Fig. 20) had shallow pad footing
with ground beams of small dimensions, with one of the corner pads effectively actingas a pile cap rather than pad footing, possibly due to locally weak soil. No piles remainedconnected to the pile caps in this case, suggesting a higher level of shear in the overturningmotion than experienced at the other piled buildings.
123

Bull Earthquake Eng
Fig. 19 An overturned 3-storey steel frame building (‘Building D’) on piled RC foundation with evidence ofdebris impact on the (originally) seaward face of the building. This photograph was taken from a neighbouringbuilding during tsunami inundation, courtesy of Miyagi Prefectural Office
Fig. 20 A 2-storey RC shear wall structure with shallow pad footing foundation (‘Building E’). Evidence ofsmall piles on at least one of the corner columns can be seen, but no piles remained attached at the time of ourvisit. The building has also sustained out-of-plane failure of an infill wall at the ground floor
Although any evidence of liquefaction had been washed away in the tsunami, this mayhave also contributed by loosening the soil around piles prior to the overturning motion. Dur-ing liquefaction soil shear strength is decreased, thereby decreasing shaft resistance betweenthe pile face and the soil around it. This would allow greater lateral movement of the pileswhile in the ground, and enable the piles to be extracted more easily from the ground whenthe building was subjected to uplift or lateral forces (due to tsunami flow or debris impact),
123

Bull Earthquake Eng
which were significant in Onagawa due to the extreme inundation depth. Similar overturningfailures of RC buildings were observed in at least one case in Otsuchi (Chock 2011) andMiyako City.Despite extreme hydrodynamic forces in this area, many buildings survived due to dense
urban development affording a certain degree of sheltering. A 4-storey harbour-front com-plex of 2 buildings suffered extensive glazing damage, limited damage to masonry cladding,and the loss of an elevated walkway that connected the buildings. Smaller buildings in the leeof these substantial structures were sheltered on the inflow of tsunami, and remain standingdespite sustaining heavy non-structural damage on the return flow. While observations fromOnagawa and many other sites in this and previous extreme tsunami events (EEFIT 2006;Borrero 2005) showed that RC structures are effective in withstanding tsunami loading, it isnow clear that there are additional failure modes to consider in their resistance to tsunamiloads in high velocity flows exceeding 15mdepth. This has vital implications for the selectionof appropriate RC structures to use in vertical evacuation strategies.
6.7 Ishinomaki City, Miyagi Prefecture
Ishinomaki is the 2nd-largest city in Miyagi Prefecture and has approximately 12 km ofsouth-facing coastline (Fig. 15), much of which is dedicated to warehouses and industrialsites associated with the fishing port and commercial port. Inland of the ports, the denselybuilt-up urban area extends 4.8 km inland at it furthest point; the 400 m closest to the har-bour is commercial and industrial land use, with residential and smaller commercial landuse further inland. The death toll in Ishinomaki City was the highest of all tsunami affectedcities and towns and as of August 25th 2011, stood at 3,158 dead and 849 missing (Fireand Disaster Management Agency of Japan 2011). This was a relatively low fatality rate of3.6% relative to the population living within the inundated area, when compared to otherlocations which also had 70–80% of the population was living in the inundated area (i.e.Rikuzentakata, Otsuchi, Onagawa, and Minami-Sanriku).Inundation simulations based on a Miyagi-ken-oki earthquake of JMA magnitude 8.0
multiple source zone rupture estimated that 164 peoplewould be killed in Ishinomaki (MiyagiPrefectural Government 2004). Maximum estimated inundation height from the subsequenttsunami was 3 m along the port front, and 1 m at a distance of 500 m inland. Our surveysshowed that the inundation height on March 11th was at least 4 m at several locations over470 m inland, while measurements by The 2011 Tohoku Earthquake Tsunami Joint SurveyGroup (2011) indicate tsunami height at the Ishinomaki fishing port was around 4 timeshigher than the above modelled estimates.Aerial photographs show that themajority of structures remained standing in the inundated
area of Ishinomaki City, although therewere some areas of almost entire destruction observedaround the mouth of the Old Kitakami River where significant co-seismic subsidence of up to0.78 m occurred (Geo-Spatial Information Authority of Japan 2011c). Flooding of subsidedland adjacent to the river mouth and along the port front now occurs at high tide. There wasevidence of fire damage in this area, with Kadonowaki School building showing significantexternal fire damage.General observations of damage levels were made along two transects in the eastern part
of the city. The survey indicated no structural damage at distances greater than 850 m inland,although there was evidence of motor vehicle floatation at this distance. During this rapidsurvey, timber frame buildings showed extremely variable damage, from light damage tocollapse (D1–D4). Steel frame buildings showed light to heavy damage (D1–D3), while RCbuildings showed light to moderate damage (D1–D2). At 420 m inland a lorry had been
123

Bull Earthquake Eng
deposited on the 1st storey roof of a residential building, but despite the 3 m inundationdepth, several adjacent timber frame houses remained standing with light damage (D1), sug-gesting low flow velocity. In the immediate vicinity of these houses, heavy damage to a steelframe building, moderate damage to RC buildings and collapse of other timber structuresshows high local variability of tsunami damage. Observations of damage at the port frontincluded impact of large debris, causing significant bending of the structural columns of alarge 1-storey steel frame warehouse.
6.8 Sendai City coastal areas, Miyagi Prefecture
Sendai City is divided into 5 wards, including Miyagino-ku and Wakabayashi-ku which arecoastal, and Taihaku-ku which spreads across the whole of the southern part of the city withits borders reaching up to 3 km inland from the shore. In Miyagino-ku and Wakabayashi-ku630 people died. The dense urban area of the city is over 4 km inland and the city centre is12 km from the coast; the majority of land between the coast and the Tohoku Expressway,which dissects the eastern part of the city from north to south, is agricultural land. Inundationreached up to 5.7 km inland in Wakabayashi-ku and up to 7.5 km where the tsunami flowedup the Natori River at the southern limits of the city.EEFIT investigated damage to residential properties in the Arahama District of
Wakabayashi-ku, which suffered severe damage and a fatality rate of 4.29% from the tsu-nami. The coastline is east-facing with localised use of 6 offshore breakwaters; the maindefence being concrete block revetments along Arahama Beach. A pine forest immediatelyinland of the revetments provided additional protection. The flat low-lying terrain contributedto inundation of up to 5 km inland.The concrete defences at Arahama Beach had failed in several places and the sand infill
had been washed out (Fig. 21), while concrete blocks had been removed and washed up to100 m landward into the coastal pine forest. Many residential properties of timber frame con-struction suffered complete collapse or had been demolished by the time of our investigation.Significant scour of the sandy soil (old beach deposits) on the seaward side of buildings hadcaused tilting and exposure of foundations in some buildings. Out-of-plane failure of infill
Fig. 21 Failure of a concrete block revetment at Arahama Beach. Sand fill had been washed out of therevetment, causing collapse of the concrete blocks and pathway along the crest of the defence
123
Bull Earthquake Eng
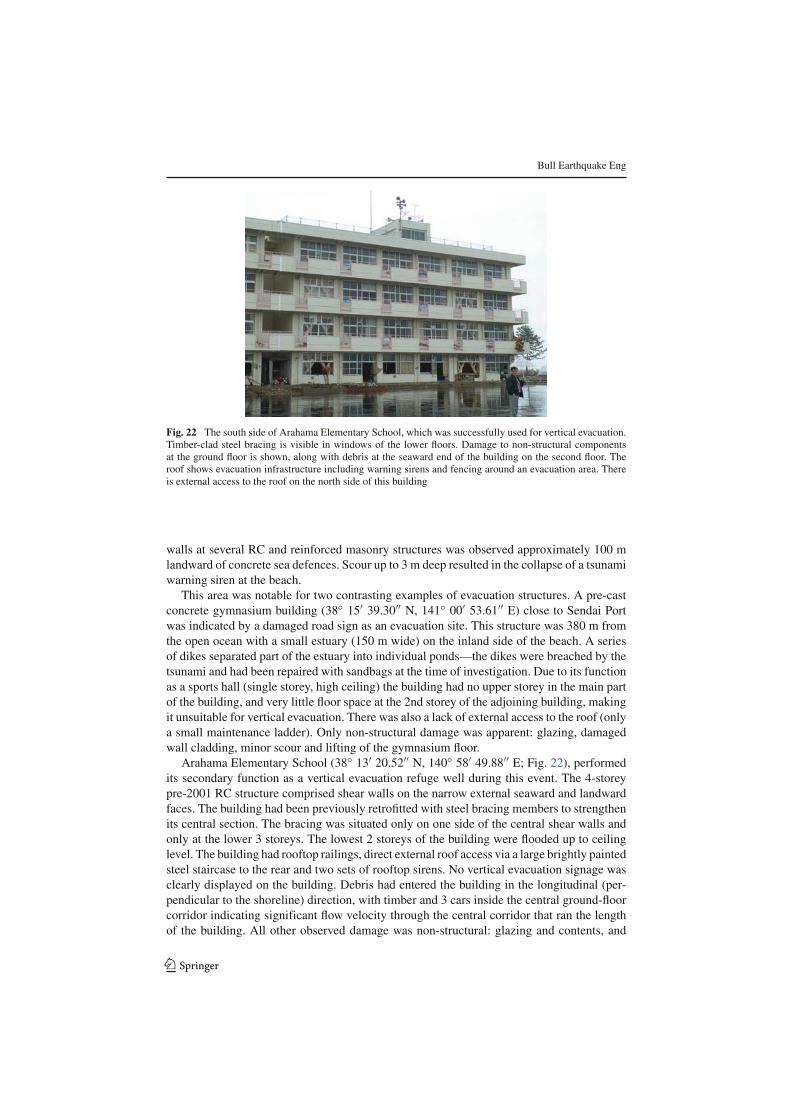
Fig. 22 The south side of Arahama Elementary School, which was successfully used for vertical evacuation.Timber-clad steel bracing is visible in windows of the lower floors. Damage to non-structural componentsat the ground floor is shown, along with debris at the seaward end of the building on the second floor. Theroof shows evacuation infrastructure including warning sirens and fencing around an evacuation area. Thereis external access to the roof on the north side of this building
walls at several RC and reinforced masonry structures was observed approximately 100 mlandward of concrete sea defences. Scour up to 3 m deep resulted in the collapse of a tsunamiwarning siren at the beach.This area was notable for two contrasting examples of evacuation structures. A pre-cast
concrete gymnasium building (38◦ 15′ 39.30′′ N, 141◦ 00′ 53.61′′ E) close to Sendai Portwas indicated by a damaged road sign as an evacuation site. This structure was 380 m fromthe open ocean with a small estuary (150 m wide) on the inland side of the beach. A seriesof dikes separated part of the estuary into individual ponds—the dikes were breached by thetsunami and had been repaired with sandbags at the time of investigation. Due to its functionas a sports hall (single storey, high ceiling) the building had no upper storey in the main partof the building, and very little floor space at the 2nd storey of the adjoining building, makingit unsuitable for vertical evacuation. There was also a lack of external access to the roof (onlya small maintenance ladder). Only non-structural damage was apparent: glazing, damagedwall cladding, minor scour and lifting of the gymnasium floor.Arahama Elementary School (38◦ 13′ 20.52′′ N, 140◦ 58′ 49.88′′ E; Fig. 22), performed
its secondary function as a vertical evacuation refuge well during this event. The 4-storeypre-2001 RC structure comprised shear walls on the narrow external seaward and landwardfaces. The building had been previously retrofitted with steel bracing members to strengthenits central section. The bracing was situated only on one side of the central shear walls andonly at the lower 3 storeys. The lowest 2 storeys of the building were flooded up to ceilinglevel. The building had rooftop railings, direct external roof access via a large brightly paintedsteel staircase to the rear and two sets of rooftop sirens. No vertical evacuation signage wasclearly displayed on the building. Debris had entered the building in the longitudinal (per-pendicular to the shoreline) direction, with timber and 3 cars inside the central ground-floorcorridor indicating significant flow velocity through the central corridor that ran the lengthof the building. All other observed damage was non-structural: glazing and contents, and
123

Bull Earthquake Eng
Fig. 23 Post-tsunami aerial photograph of Yuriage District, Natori City, showing almost complete destructionof this residential area, although the part of Yuriage adjacent to the river embankment (northern edge of thisimage) sustained less damage
small debris strike at the seaward end. A successful evacuation was carried out at this site:380 people survived by evacuating to the roof (Iwate Nichi Nichi Shinbun 2011).
6.9 Natori City, Miyagi Prefecture
Natori City is located on the Sendai Plains and is predominantly low-lying flat agriculturalland, with 2 main population centres—the main city situated at least 5 km inland and YuriageDistrict at the coast, adjacent to the mouth of the Natori River (Fig. 23). Coastal defence inYuriage comprised pine coastal forest with concrete harbour walls at the Yuriage Port (38◦10′ 21.63′′ N, 140◦ 57′ 23.51′′ E). The tsunami arrived in Yuriage approximately 65 min afterthe earthquake and inundated up to 5.2 km inland, close to the embankments of the TohokuExpressway, where floating and burning wooden houses, cars, boats and other debris weredeposited. Natori City officials advised EEFIT that Yuriage sustained a greater number ofcasualties than seaward of Sendai Airport, further south. The fatality rate was high comparedto other areas (8.1%), and as was the case in many other areas in this event, predominantcasualties were people over 65 years of age (Fire and Disaster Management Agency of Japan2011).Almost all timber frame residential buildings in Yuriage sustained complete collapse (D4).
Steel and RC structures sustained damage ranging from light (D1) to collapse (D4). The RCport building sustained out-of-plane failure of all hollow concrete block masonry infill wallsand partial collapse, and the wharf itself suffered significant scour and partial collapse. Themajority of reinforcement in the concrete block infill walls was un-deformed rebar. Con-sistent failure direction of columns immediately inland of the port structure indicates flow
123
Bull Earthquake Eng
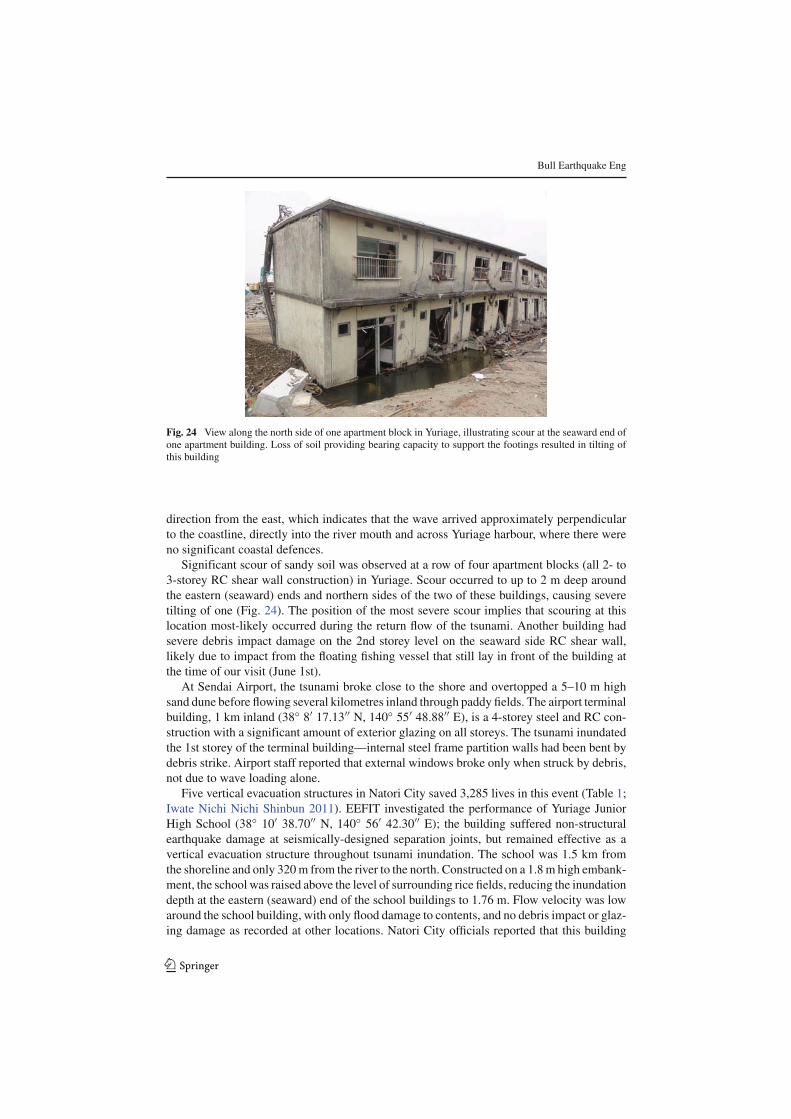
Fig. 24 View along the north side of one apartment block in Yuriage, illustrating scour at the seaward end ofone apartment building. Loss of soil providing bearing capacity to support the footings resulted in tilting ofthis building
direction from the east, which indicates that the wave arrived approximately perpendicularto the coastline, directly into the river mouth and across Yuriage harbour, where there wereno significant coastal defences.Significant scour of sandy soil was observed at a row of four apartment blocks (all 2- to
3-storey RC shear wall construction) in Yuriage. Scour occurred to up to 2 m deep aroundthe eastern (seaward) ends and northern sides of the two of these buildings, causing severetilting of one (Fig. 24). The position of the most severe scour implies that scouring at thislocation most-likely occurred during the return flow of the tsunami. Another building hadsevere debris impact damage on the 2nd storey level on the seaward side RC shear wall,likely due to impact from the floating fishing vessel that still lay in front of the building atthe time of our visit (June 1st).At Sendai Airport, the tsunami broke close to the shore and overtopped a 5–10 m high
sand dune before flowing several kilometres inland through paddy fields. The airport terminalbuilding, 1 km inland (38◦ 8′ 17.13′′ N, 140◦ 55′ 48.88′′ E), is a 4-storey steel and RC con-struction with a significant amount of exterior glazing on all storeys. The tsunami inundatedthe 1st storey of the terminal building—internal steel frame partition walls had been bent bydebris strike. Airport staff reported that external windows broke only when struck by debris,not due to wave loading alone.Five vertical evacuation structures in Natori City saved 3,285 lives in this event (Table 1;
Iwate Nichi Nichi Shinbun 2011). EEFIT investigated the performance of Yuriage JuniorHigh School (38◦ 10′ 38.70′′ N, 140◦ 56′ 42.30′′ E); the building suffered non-structuralearthquake damage at seismically-designed separation joints, but remained effective as avertical evacuation structure throughout tsunami inundation. The school was 1.5 km fromthe shoreline and only 320m from the river to the north. Constructed on a 1.8m high embank-ment, the school was raised above the level of surrounding rice fields, reducing the inundationdepth at the eastern (seaward) end of the school buildings to 1.76 m. Flow velocity was lowaround the school building, with only flood damage to contents, and no debris impact or glaz-ing damage as recorded at other locations. Natori City officials reported that this building
123

Bull Earthquake Eng
Fig. 25 A steel frame agricultural building located 1 km inland at Yamamoto Town, Miyagi Prefecture. Atree trunk, apparently from the damaged coastal pine forest, struck a structural column on the south-east (sea-ward) corner of the building, buckling the structural and non-structural members. Tsunami flow has removedcladding to a height of over 4 m
provided refuge to approximately 800 people who had to remain there for 2 days followingthe tsunami.
6.10 Yamamoto Town, Miyagi Prefecture
Yamamoto Town has very similar low-lying topography to theYuriage andArahama districts,and suffered a similar fatality rate (7.7%) as Natori City. The beach had large periodically-placed groynes and a concrete block revetment, with pine coastal forest immediately inland.Both sides of the revetment comprised a concrete lattice in-filled with concrete blocks andnatural vegetation. The revetment had a sand core and a concrete and bitumen pathway alongits crest. The groynes were constructed of slim concrete armour units aligned with the slopeand appeared largely intact. At several locations along the revetment, there were breaks in thereinforced lattice and most of the concrete blocks were missing. Scour on the leeside was amain cause of embankment failure. Pine trees of the coastal forest were largely destroyed bythe tsunami: they had bent over and trunks were snapped very close to the base. The coastalforest provided substantial amounts of debris which was seen to cause structural damage toa steel frame agricultural building located 1 km inland (37◦ 57′ 26.39′′ N, 140◦ 54′ 18.44′′ E;Fig. 25). This building was struck during tsunami inflow by a tree trunk which bent structuralmembers.
7 Summary and conclusions
The Mw9.0 Great East Japan earthquake and tsunami of March 11th 2011 caused exten-sive damage along the Tohoku coastline, damaging coastal defence structures and hundredsof thousands of buildings. The affected region had an extensive array of coastal defencesof all types—some specifically designed to mitigate tsunami damage. This event rigor-ously tested these defences, and where they failed to protect the coastal communities it
123

Bull Earthquake Eng
was primarily because the wave heights experienced in this event far exceeded the designvalues, which were based on the expected Miyagi-ken-oki event or inundation levels expe-rienced in the 1896, 1933 and 1960 tsunami. Sea walls and breakwaters were overtopped,overturned, or broken up by hydrostatic and hydrodynamic forces and scour on a large scale,but did provide some degree of protection despite this damage. Trees (from the coastalprotection forest) and concrete blocks (from coastal revetments) proved to be damagingdebris sources, contributing to structural damage and collapse of buildings in several loca-tions.Numerous evacuation refuges and other critical infrastructure (such as hospitals, crisis
management and police headquarters) were inundated in this event resulting in significantloss of life. Estimation of tsunami hazard in this region had been underestimated, and manyevacuation centres were inundated. The network of vertical evacuation structures should beexpanded for use in future events, particularly in the Sendai Plains where there is no accessto high ground. Further work is required in future to ensure refuges are properly designatedin terms of location and structural suitability; both of these issues are a product of adequatehazard estimation and mapping.EEFIT tsunami observations show that damage can be extremely variable in a local area
and it is clear that inundation depth, direction of flow, local flow velocity variations, shel-tering during the inflow and return flow, and debris entrainment must all be considered fora complete assessment of tsunami fragility. RC shear wall structures are again confirmed asable to withstand tsunami loading and should form the primary construction type for criticalinfrastructure in tsunami risk areas, but further research is required into mitigation of scour,liquefaction, debris impact, and the prevention of overturning failure as these features causedfailure of RC buildings in several observed cases.Our surveys show that the structure of steel frame buildings often remain standing fol-
lowing a tsunami but significant damage to non-structural components, primarily removalof cladding, renders this type of structure unsuitable for use as critical infrastructure.Debris impact is a key factor in structural damage of steel frame structures—while tsu-nami flow alone is shown to cause significant non-structural damage, it is debris impactwhich most often caused heavy damage to the structural members and collapse of the build-ing.Our surveys have suggested that significant local variability in damage, even to timber
frame structures, occurs due to local flow characteristics and that many timber frame build-ings can survive in areas experiencing low flow velocity, however, there remains no doubt thattimber frame buildings generally cannot withstand tsunami flow forces, particularly in thenear shore area. Raising timber structures on RC open-structure ground-floors can mitigatedamage in inundation depths of up to 6 m, as observed in Kesennuma City. This should bea consideration in reconstruction of residential areas as long as potential soft-storey effectsduring ground shaking are adequately addressed, and where it is appropriate to the level oftsunami hazard.As a result of our observations and damage surveys in Tohoku, EEFIT have further devel-
oped separate tsunami damage scales for timber, steel frame and RC buildings. These scaleshave been demonstrated in this paper, and provide a consistent basis for completion of futurepost-tsunami damage assessments, enabling comparison of damage across different areasand events.
Acknowledgments This EEFIT mission was organised and co-ordinated by the Institution of StructuralEngineers. The mission was funded by EPSRC grant (EP/I01778X/1), Aon Benfield, Cambridge ArchitecturalResearch Ltd., Global Earthquake Model, Institution of Civil Engineers (QUEST Travel Award), Sasakawa
123

Bull Earthquake Eng
Foundation, Sellafield Ltd., and Willis Research Network. The authors would like to acknowledge generoussupport while on the field mission from Eri Gavanski, Maki Koyama, Hitomi Murakami, and many otherindividuals, institutions and organisations.
References
Atwater BF, Muumi-Rokkaku S, Satake K, Tsuji Y, Ueda K, Yamaguchi DK (2005) The orphan tsunami of1700. Japanese clues to a parent earthquake in North America. University of Washington Press, Seattle,p. 133
Borrero JC (2005) Field survey of Northern Sumatra and Banda Aceh, Indonesia after the sunami and earth-quake of 26 December 2004. Seismol Res Lett 76(3):312–320. doi:10.1785/?gssrl.76.3.312
Cabinet Office Government of Japan (2005) Guidelines pertaining to vertical evacuation building. Tokyo.Retrieved from http://www.bousai.go.jp/oshirase/h17/tsunami_hinan.html
CEDMHA (2011) Japan earthquake and tsunami updateWednesday, March 30, 2011. Hawaii, p. 47. Retrievedfrom http://www.coe-dmha.org/Research/ResearchInfoMgmt/Japan/Japan03302011.pdf
Chock G (2011) More evidence of overwhelmed seawalls. ASCE Japan Tsunami Reconnaissance Team—Day 3. Retrieved 30 June 2011, from http://www.asce.org/PPLContent.aspx?id=12884906357
EEFIT (2006) The Indian Ocean tsunami of 26 December 2004: mission findings in Sri Lanka and Thailand,vol 44. London, pp 1–180
EEFIT (2011) The Mw9.0 Tohoku earthquake and tsunami of 11th March 2011—a field report by EEFIT.London, UK
Earthquake Research Institute (2011) Tsunami survey. Retrieved 27 July 2011, from http://outreach.eri.u-tokyo.ac.jp/eqvolc/201103_T?hoku/eng/
Fire and Disaster Management Agency of Japan (2011) Report 137 on the effects of the March 11, 2011 GreatTohoku earthquake. Retrieved 29 August 2011, from http://www.fdma.go.jp/bn/2011/detail/691.html
Fraser S, Leonard G, Murakami H, Matsuo I (2012) Tsunami evacuation: lessons from the Great East Japanearthquake and tsunami of March 11th 2011. GNS science report, Lower Hutt, New Zealand (in press)
Fujita T (2011)Tsunami impactingEastern Japan andpreparedness for extraordinary natural disaster. Retrieved27 July 2011, from http://www.pari.go.jp/files/items/3459/File/2011052327IAPH.pdf
Geo-Spatial Information Authority of Japan (2011a) Crustal deformation and fault model obtained from GE-ONET data analysis. Retrieved 30 June 2011, from http://www.gsi.go.jp/cais/topic110313-index-e.html
Geo-Spatial Information Authority of Japan (2011b) Inundation extent maps. Retrieved 27 July 2011, fromhttp://www.gsi.go.jp/kikaku/kikaku60003.html
Geo-Spatial Information Authority of Japan (2011c) Year 2011 (2011) due to earthquake subsidence inves-tigation northeastern Pacific Ocean off the coast. Retrieved 20 July 2011, from http://www.gsi.go.jp/sokuchikijun/sokuchikijun40003.html
Goda K, Pomonis A, Chian SC, Offord M, Saito K, Sammonds P (2012) Ground motion characteristics andshaking damage of the 11th March 2011 Mw9.0 Tohoku earthquake (in review)
Hatori T (1984) On the damage to houses due to tsunamis. Bull Earthq Res Inst 59:433–439 (in Japanese)IwateNichiNichi Shinbun (2011) 10,000 People survive after evacuating to a (designated evacuation) building.
Ichinoseki, Japan, p 7, 30 May 2011IOC/UNESCO (2011) IOC/UNESCO Bulletin No. 8, As of 23 March 2011. Retrieved from http://www.
eqclearinghouse.org/2011-03-11-sendai/files/2011/03/No.-8-IOC-UNESCO-Bulletin-23-Mar.pdfJapan Coast Guard (2011) Raw footage released by the Japan coast guard of the tsunami and fires in Kesen-
numa. Retrieved 31 August 2011, from https://picasaweb.google.com/lh/photo/cNrrglyXPo5W6-6l4ysuvl6-HV4XK8khGfVE4K2xJdY?feat=embedwebsite
Japanese Ministry of Internal Affairs and Communications (2011) Estimation of the population in the tsu-nami inundation zone, by municipality (analysis by the Geographical Information Authority of Japan).Retrieved 4 August 2011, from http://www.stat.go.jp/info/shinsai/zuhyou/sinsui.xls
Japanese Ministry of Land Infrastructure Transport and Tourism (2011) Status survey results affected by theearthquake East (first report). Retrieved from http://www.mlit.go.jp/common/000162533.pdf
Kazama M (2011) The 2011 off the Pacific Coast of Tohoku earthquake—after two months. In: 14th Asianregional conference on soil mechanics and geotechnical engineering. Hong Kong. Retrieved from http://www.jiban.or.jp/file/file/kazama520e2.pdf
Kokusai Kogyo Group (2011) Characteristics of Japan’s DRR: a perspective from the spatial informationsector. UN ISDR, Third session of the Global Platform for disaster risk reduction. Geneva, Switzerland
Koshimura S, Namegaya Y, Yanagisawa H (2009) Tsunami ragility—a newmeasure to identify tsunami dam-age. J Disaster Res 4(6):479–480
123

Bull Earthquake Eng
Miyagi Prefectural Government (2004) Summary of the third survey in Miyagi Prefecture earthquake dam-age estimation. Retrieved 20 July 2011, from http://www.pref.miyagi.jp/kikitaisaku/jishin_chishiki/3higaishin/index.htm
Mori N, Takahashi T, Yasuda T, Yanagisawa H (2011) Survey of 2011 Tohoku earthquake tsunami inundationand run-up. Geophys Res Lett 38:L00G14. doi:10.1029/2011GL049210
National Police Agency of Japan (2012) Damage situation and police countermeasures associated with 2011Tohoku district-off the Pacific Ocean earthquake, January 31, 2012. Retrieved from http://www.npa.go.jp/archive/keibi/biki/higaijokyo_e.pdf
Noh T (1966) Sanriku Coast prepared for Tsunami—a preliminary report on men’s defense against naturaldisaster. Sci Rep Tohoku Univ 7th Ser Geogr 15(1):1–24
Okumura K (2011) Interplate megathrust earthquakes and tsunamis along Japan Trench offshore NortheastJapan. Hiroshima University, Japan. Retrieved from http://www.homeofgeography.org/uk/news_2011/jogan_e.pdf
Port andAirport Research Institute (2011) Executive summary of urgent field survey of earthquake and tsunamidisasters. Retrieved 27 July 2011, from http://www.pari.go.jp/en/eq2011/20110325.html
Read R (2011, April 17) Japan’s 60-foot tsunami overturned four-story concrete building, shattering safetyand engineering strategies. The Oregonian. Retrieved from http://www.oregonlive.com/today/index.ssf/2011/04/surveying_what_survived_the_quake_and_tsunami_--_and_what_didnt_oregonian_in_japan.html
Sasaki S (1960) The Chilean earthquake tsunami. In: Proceedings of the 7th Japanese conference on coastalengineering, pp 275–287
Satake K, Namegaya Y, Yamaki S (2008) Numerical simulation of the AD 869 Jogan tsunami in Ishinomakiand Sendai plains. Annu Rep Active Fault Paleoearthq Res 8:71–89
Shao G, Li X, Ji C, Maeda T (2011) Focal mechanism and slip history of 2011 Mw 9.1 off the Pacificcoast of Tohoku earthquake, constrained with teleseismic body and surface waves. Earth Planets Space63(7):559–564. Retrieved from http://www.geol.ucsb.edu/faculty/ji/big_earthquakes/2011/03/0311/paper.pdf
Shuto N (1993) Tsunami intensity and disasters. In: Tinti S (ed) Tsunamis in the world. 15th Internationaltsunami symposium, 1991. Kluwer Academic Publishers, Dordrecht, pp 197–216
Shuto N (2011) Onagwa Memorial Park. ITIC Tsunami Bulletin Board. Retrieved from http://infolist.nws.noaa.gov
Shuto N et al (1986) A study of damage to houses by the Nihon-Chubu earthquake tsunami. In: Proceedingsof the JSCE 41st annual meeting, pp 533–534 (in Japanese)
SimonsM,Minson SE, Sladen A, Ortega F, Jiang J, Owen SE,Meng L et al (2011) The 2011magnitude 90 To-hoku-Oki earthquake: Mosaicking the Megathrust from Seconds to Centuries. Science 332(6036):1421–1425. Retrieved from http://www.sciencemag.org/content/332/6036/1421/F1.expansion.html
Takahashi S, Toda K, Kikuchi Y, Sugano T, Kuriyama Y, Yamazaki H, Nagao T et al (2011a) Urgent surveyfor 2011 Great East Japan earthquake and tsunami disaster in ports and coasts, p 110. Retrieved fromhttp://www.pari.go.jp/files/3642/1049951767.pdf
Takahashi S, Kuriyama Y, Tomita T, Kawai Y, Arikawa T, Tatsumi D, Negi T (2011b) Urgent survey for 2011Great East Japan earthquake and tsunami disaster in ports and coasts (English summary) (p 9). Retrievedfrom http://www.pari.go.jp/en/files/3653/460607839.pdf
Takata N (2009) Tsunami disaster reduction in Japanese ports and harbors. In: Proceedings of the 6th interna-tional workshop on coastal disaster prevention. Bangkok, p 93
Take Y, Yamaya R (2011) Reconnaissance report (19) on Minami-Sanriku-cho, Miyagi prefecture, April 20,2011
Tanaka S, Kuribayashi D, Istiyanto D (2008) Report on “UN/ISDR Comprehensive Tsunami Disaster Preven-tion Training Course” (p. 53). Retrieved from http://www.preventionweb.net/files/9285_isdrtsunamieng.pdf
The 2011 Tohoku Earthquake Tsunami Joint Survey Group (2011) The 2011 off the Pacific coast of Tohokuearthquake tsunami information—field survey results. Coastal Engineering Committee of the Japan Soci-ety of Civil Engineers. Retrieved 18 November 2011, from http://www.coastal.jp/tsunami2011/index.php?Fieldsurveyresults
The Japan Times (2011) Tsunami hit more than 100 designated evacuation sites. Kyodo, 14 April 2011.Retrieved from http://www.japantimes.co.jp/text/nn20110414a4.html
Tokimatsu K, Tamura S, Suzuki H, Katsumata K (2011) Quick report on geotechnical problems in the 2011Tohoku Pacific Ocean Earthquake. Tokyo, pp 21–47
United States Geological Survey (2011) Pre-tsunami Japan: 2010 Ryori, Iwate Prefecture. Retrieved 27 July2011, from http://walrus.wr.usgs.gov/tsunami/japan/ryori.html
123

Bull Earthquake Eng
Utsu T (2002) A list of deadly earthquakes in the World: 1500–2000. In: Lee WK, Kanamori H, Jennings PC,Kisslinger C (eds) International handbook of earthquake and engineering seismology part A. AcademicPress, San Diego, pp 691–717
Watanabe H (1998) Inventory of Japanese damaging tsunamis, 2nd edn. Tokyo University Press, TokyoYagyu T (2011) Thank you very much for your messages of sympathy regarding the Great East Japan earth-
quake of March 11, 2011—a message from the secretary of PIANC Japan. Sailing ahead (PIANC E-Newsletter), 8. Retrieved from http://www.pianc.org/downloads/sailingahead/SailingAheadApril2011/JapanEarthquake.pdf
123