![The Antiproliferative Effect of Cyclodipeptides from ...suppressor signals such as PI3K, Akt, Ras, Raf, TRK, NF1, LKN1, PTEN, p53, and TSC1 and TSC2 have largely involved [16,17].](https://static.fdocuments.net/doc/165x107/5e6f16bf38db12762825828e/the-antiproliferative-effect-of-cyclodipeptides-from-suppressor-signals-such.jpg)
Tsc1 and tsc2 regulate arginine uptake and metabolism in Schizosaccharomyces pombe
33
Tsc1 + and tsc2 + regulate arginine uptake and metabolism in Schizosaccharomyces pombe Marjon van Slegtenhorst, Erikka Carr, Radka Stoyanova, Warren Kruger and Elizabeth Petri Henske Department of Medical Oncology, Fox Chase Cancer Center, Philadelphia, PA 19111 Correspondence: Elizabeth Petri Henske or Marjon van Slegtenhorst Fox Chase Cancer Center 333 Cottman Avenue Philadelphia, PA 19111 Tel: 215 728 2428; Fax: 215 214 1623 Email: [email protected] Email: [email protected] Running Title: Regulation of arginine by tsc1 + and tsc2 + in S. pombe JBC Papers in Press. Published on January 12, 2004 as Manuscript M313874200 Copyright 2004 by The American Society for Biochemistry and Molecular Biology, Inc. by guest on January 22, 2019 http://www.jbc.org/ Downloaded from
Transcript of Tsc1 and tsc2 regulate arginine uptake and metabolism in Schizosaccharomyces pombe

Tsc1+ and tsc2+ regulate arginine uptake and metabolism in
Schizosaccharomyces pombe
Marjon van Slegtenhorst, Erikka Carr, Radka Stoyanova, Warren Kruger and
Elizabeth Petri Henske
Department of Medical Oncology, Fox Chase Cancer Center, Philadelphia, PA 19111
Correspondence:
Elizabeth Petri Henske or
Marjon van Slegtenhorst
Fox Chase Cancer Center
333 Cottman Avenue
Philadelphia, PA 19111
Tel: 215 728 2428; Fax: 215 214 1623
Email: [email protected]
Email: [email protected]
Running Title: Regulation of arginine by tsc1+ and tsc2+ in S. pombe
JBC Papers in Press. Published on January 12, 2004 as Manuscript M313874200
Copyright 2004 by The American Society for Biochemistry and Molecular Biology, Inc.
by guest on January 22, 2019http://w
ww
.jbc.org/D
ownloaded from
2
SUMMARY
Mutations in either TSC1 or TSC2 cause tuberous sclerosis complex, an autosomal
dominant disorder characterized by seizures, mental retardation, and benign tumors of the skin,
brain, heart and kidneys. Homologs for the TSC1 and TSC2 genes have been identified in mouse,
rat, Fugu, Drosophila and in the yeast Schizosaccharomyces pombe. Here we show that S. pombe
lacking tsc1+ or tsc2+ have similar phenotypes, including decreased arginine uptake, decreased
expression of three amino acid permeases, and low intracellular levels of four members of the
arginine biosynthesis pathway. Recently, the small GTPase Rheb was identified as a target of
tuberin’s GTPase activating domain in mammalian cells and in Drosophila. We show that the
defect in arginine uptake in cells lacking tsc2+ is rescued by expression of a dominant negative
form of rhb1+, the Rheb homolog in S. pombe, but not by expressing wild-type rhb1+. Expression
of the tsc2+ gene with a patient-derived mutation within the GAP domain did not rescue the
arginine uptake defect in tsc2+ mutant yeast. Taken together, these findings support a model in
which arginine uptake is regulated through tsc1+, tsc2+ and rhb1+ in S. pombe and also suggest a
role for the Tsc1 and Tsc2 proteins in amino acid biosynthesis and sensing.
by guest on January 22, 2019http://w
ww
.jbc.org/D
ownloaded from

3
INTRODUCTION
Tuberous sclerosis complex (TSC) is a tumor suppressor syndrome that is characterized
by the development of a variety of benign tumors (hamartomas) and severe neurological
problems, including seizures, mental retardation, and autism. TSC is caused by mutations in
either TSC1 (1) or TSC2 (2). Hamartin, the TSC1 gene product and tuberin, the TSC2 gene
product are known to interact (3,4) and to function in a complex. Tuberin has a highly conserved
GTPase activating protein (GAP) domain with activity for Rheb1 (ras homolog enriched in
brain) (5-11), a small GTPase that may be involved in nutrient signaling and cell cycle regulation
(12).
Studies in Drosophila and mammalian systems have shown that the hamartin-tuberin
complex negatively regulates p70S6 kinase (pS6K) within the PI3K signaling pathway (13,14).
The regulation of pS6K is mediated by Rheb and by the target of rapamycin (TOR), which are
components in pathways that control cell size by integrating mitogenic signals and nutrient
availability with protein synthesis (11,13,15-18). Both hamartin and tuberin are regulated by
phosphorylation. Hamartin is phosphorylated by cyclin dependent kinase CDK1 (19) and tuberin
is a substrate for Akt (protein kinase B) (14,20,21), p38-activated kinase MK2 (22) and the
AMP-activated protein kinase (AMPK) (23).
Schizosaccharomyces pombe (S. pombe) contains genes with significant similarity to
TSC1 and TSC2, which were named tsc1+ and tsc2+ (24). The GAP domain of tuberin is
particularly highly conserved with 39% identity. In addition to TSC1 and TSC2 homologs, S.
pombe also has a Rheb homolog, rhb1+. Loss of rhb1+ in S. pombe results in growth arrest,
similar to that caused by nitrogen starvation (25), and loss of farnesylation of the Rhb1 protein
has been postulated to regulate arginine uptake in S. pombe (26).
by guest on January 22, 2019http://w
ww
.jbc.org/D
ownloaded from

4
Recently S. pombe strains lacking tsc1+ (∆tsc1) or tsc2+ (∆tsc2) were shown to have
abnormal localization of the amino acid permease c359.03+, suggesting that the S. pombe Tsc1-
Tsc2 protein complex regulates protein trafficking (24). Here we report for the first time that
∆tsc1 and ∆tsc1 have a defect in arginine uptake, which is regulated through rhb1+ in S. pombe,
providing evidence that TSC-Rheb signaling is conserved in S. pombe. A mutation in the GAP
domain of tsc2+ at a site corresponding to a patient-derived missense mutation could not rescue
the uptake defects, strengthening the relationship of the S. pombe model to human TSC. The
transcriptional expression profile and intracellular amino acid levels associated with ∆tsc1 and
∆tsc2 overlapped extensively, suggesting similar roles for tsc1+ and tsc2+ in S. pombe. These
findings support S. pombe as a model for TSC and indicate that the S. pombe Tsc1 and Tsc2
proteins play central roles in amino acid biosynthesis and sensing.
1The abbreviations used are: TSC, tuberous sclerosis complex; GAP, GTPase activating domain;
TOR, target of rapamycin; Rheb, ras homolog enriched in brain; S. pombe, Schizosaccharomyces
pombe; EMM, essential minimal medium; YES, yeast extract medium with supplements
by guest on January 22, 2019http://w
ww
.jbc.org/D
ownloaded from

5
EXPERIMENTAL PROCEDURES
Yeast Strains, Media and Growth Conditions. The yeast strains used in this study are listed in
Table 1. CHP428 and CHP429 were constructed by Charlie Hoffman (Boston College) and were
a gift from Janet Leatherwood (Stony Brook). Wild-type strain 972 (27) and ura4-D18 (28) were
gifts from J. Bähler (Sanger Institute). S. pombe cells were grown in essential minimal medium
(EMM; Qbiogene, Carlsbad, CA) or yeast extract complete medium with 50 µg/ml of uracil,
histidine, adenine and leucine (YES) at 30°C unless otherwise stated. Transformations were
performed with Frozen-EZ Yeast Transformation II kit (Zymo Research, Orange, CA).
Construction of tsc1+ and tsc2+ Deficient Strains. Tsc1+ and tsc2+ deficient strains were
constructed with the PCR one-step homologous recombination method (29). The kanamycin
cassette was amplified from plasmid pFA6a-kanMX6 (gift from J. Bähler, Sanger Institute) using
primers with 75 extra bases corresponding to sequences immediately upstream of the start codon
of the tsc genes and primers whose gene specific portions correspond to sequences 75 bases
downstream of the gene. For gene disruption of tsc1+, the entire open reading frame was deleted
from the genome of the haploid strain CHP429 (h-, leu1-32, ura4-D18, ade6-216, his7-366) and
replaced by the kanamycin cassette to create MVS5. We will refer to ∆tsc1 with this genotype as
F15∆tsc1. ∆tsc2 was constructed using identical strategy and resulted in MVS6, which will be
referred to as F15∆tsc2 in figures and text. Correct integration of the kanamycin cassette into the
yeast genome was confirmed by PCR over the integration site, Southern blotting and sequencing.
Subsequently, F15∆tsc1 and F15∆tsc2 were crossed into the ura4-D18 strain to generate MVS3
(ura4∆tsc1) and MVS4 (ura4∆tsc2) and into 972 wild-type to generate MVS1 (972∆tsc1) and
MVS2 (972∆tsc2) using random spore analysis on selective plates.
by guest on January 22, 2019http://w
ww
.jbc.org/D
ownloaded from

6
Construction of Plasmids. Tsc1 and Tsc2 expression constructs were generated by a PCR
cloning approach. The tsc1+ and tsc2+ genes were amplified from the cosmids c23F3 and
c630C13 (gift from J. Bähler, Sanger Institute) using primers with SalI restriction sites and
cloned into the pREP4X expression vector (ATCC). The Rhb1 expression construct was
generated by PCR of full-length rhb1+ from total cDNA using primers with SalI and XmaI and
cloned into pREP4X. After sequence verification, tsc1+, tsc2+ and rhb1+ were inserted in-frame
into the HA-tagged pSLF173/273/373 series with different nmt (no message in thiamin)
promoter strength (ATCC). The GAP (Tsc2-N1292K) and the Rhb dominant negative (Rhb-
D60K) mutations were introduced into the pSLF373 constructs using site-directed mutagenesis
(Stratagene, La Jolla, CA). All constructs were verified by sequencing.
Expression Profiling. Yeast were grown overnight in EMM to early log phase (OD595=0.2-0.3)
and total RNA was isolated by phenol extraction and purified using RNeasy (Qiagen, Valencia,
CA). Total RNA of three independent biological samples was pooled (10 µg of each sample),
reverse transcribed into cDNA and labeled with Cy3 and Cy5 (Amersham Biosciences,
Piscataway, NJ). Hybridizations were carried out overnight at 42°C. The slides were scanned
with a GMS 428 Scanner (Affymetrix, Santa Clara, CA) and spot quantification was performed
with the ImaGene software (BioDiscovery, Marina del Rey, CA). Each of the 4976 S. pombe
genes was present in duplicate on each slide, and the experiments were repeated using opposite
labels (dye-flip), resulting in a total of four measurements for each gene per sample. Genes were
considered expressed when all four measurements exceeded a threshold of 3.5x above the
background. A linear regression normalization was applied to the data (30) and fold changes
were calculated. Genes were grouped and annotated on the basis of predicted function in the
Proteome Knowledge Library (Incyte, Beverly, MA).
by guest on January 22, 2019http://w
ww
.jbc.org/D
ownloaded from
7
Western Blot Analysis. Yeast were grown to midlog phase (OD595=0.4-0.6) and washed once in
ice-cold buffer containing 50mM Tris-HCl pH 7.5, 25mM NaCl, and 0.1mM phenylmethyl-
sulfonyl fluoride. Cells were lysed in the same buffer with 0.5 mm glass beads in a BeadBeater
(Biospec Products, Bartlesville, OK). 20 µg of each sample was run on 4-20% SDS-Page gel
(Bio-Rad, Hercules, CA) and transferred to Nitrocellulose using standard methods. The
immobilized proteins were detected using enhanced chemiluminescence (Amersham
Biosciences, Piscataway, NJ). Antibodies used were anti-HA (Roche Applied Science,
Indianapolis, IN) and monoclonal TAT1 for S. pombe tubulin (gift from K. Gull, University of
Manchester).
Northern Blot Analysis. Ten micrograms of total RNA was run on a 1% formaldehyde gel at
60V for 4 hours and transferred to Nylon membrane overnight in 20X SSC. Probes for p7G5.06+,
c869.10+, isp5+ and gpd3+ were PCR amplified from cDNA, cleaned over 0.8% agarose gel and
labeled with α32P-dCTP (Perkin Elmer, Wellesley, MA) using standard methods. Hybridizations
were performed in rapid hybridization buffer (Amersham Biosciences, Piscataway, NJ).
Canavanine Sensitivity. Cells were grown overnight to midlog phase (OD595=0.4-0.6) and
OD595 was adjusted to 0.4 (10,000 cells/µl). 4 µl of 1X, 10X and 100X dilutions was spotted
onto EMM as a growth control, or EMM containing canavanine (60 µg/ml) (Sigma, St. Louis,
MO) and incubated for three days at 30˚C.
Arginine Uptake Assays. Arginine uptake assays were performed in triplicate as described by
Urano et al. (31), with minor modifications. Cells were grown in EMM minimal medium with no
supplements to midlog phase. One µCi of L-[3H]-arginine (40-70 Ci/mmol) (Perkin Elmer,
Wellesley, MA) and 100µM of non-radioactive arginine (Sigma, St. Louis, MO) were added to
25,000 cells in 600 µl of EMM. 200 µl aliquots were removed at 0 and 10 minutes, injected into
5 ml of deionized water, and immediately subjected to vacuum manifold filtration. Cells were
by guest on January 22, 2019http://w
ww
.jbc.org/D
ownloaded from

8
collected on Whatman glass microfiber filters, washed twice, and dried. 3H-arginine was
measured by scintillation counting.
Measurements of Intracellular Amino Acid Pools. Protein extracts were prepared as described
under Western blot analysis, quantified using the Bradford assay (Bio-Rad, Hercules, CA), and
diluted to 1 µg/µl. Proteins were precipitated by treatment of 100µl of sample with 100µl of 10%
5-sulphosalicylic acid at 4˚C for 1 hour. The pH of the supernatant was adjusted to 2.2 with 3M
LiOH. 100 µl of sample was injected into the Biochrom 30 amino acid analyzer (Biochrom,
Cambridge, UK) including a 10 nM standard amino acid mixture (Sigma, St. Louis, MO).
by guest on January 22, 2019http://w
ww
.jbc.org/D
ownloaded from
9
RESULTS
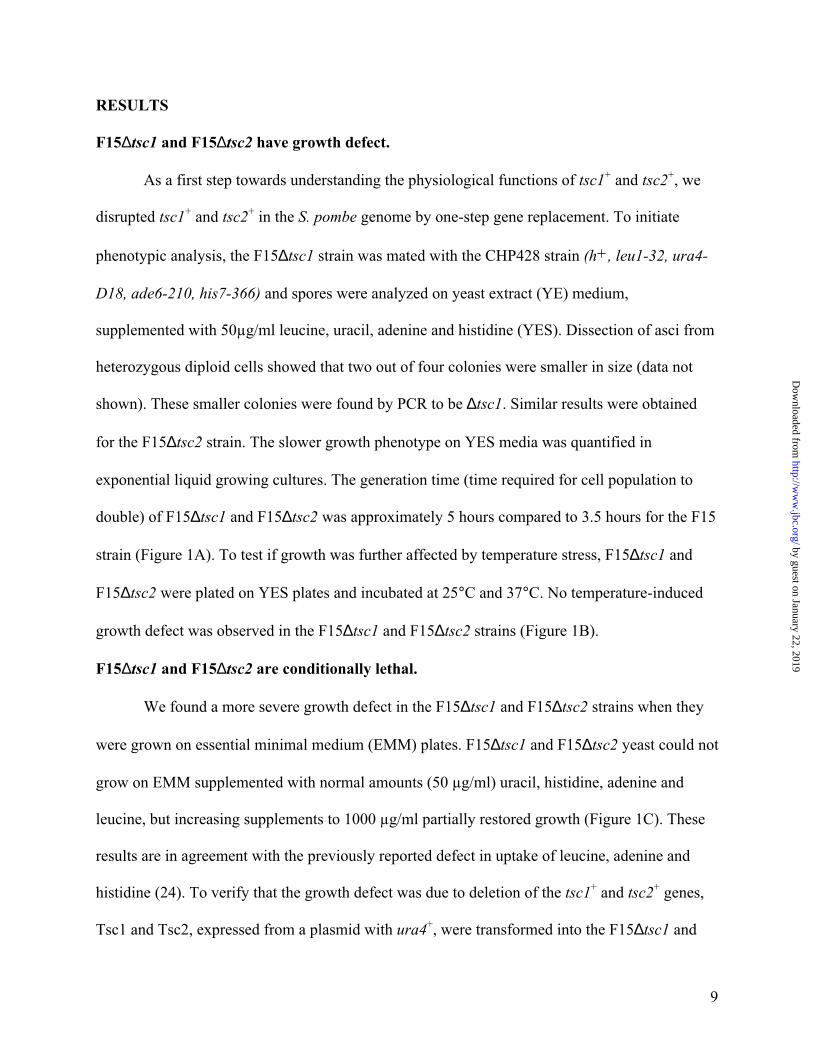
F15∆tsc1 and F15∆tsc2 have growth defect.
As a first step towards understanding the physiological functions of tsc1+ and tsc2+, we
disrupted tsc1+ and tsc2+ in the S. pombe genome by one-step gene replacement. To initiate
phenotypic analysis, the F15∆tsc1 strain was mated with the CHP428 strain (h+, leu1-32, ura4-
D18, ade6-210, his7-366) and spores were analyzed on yeast extract (YE) medium,
supplemented with 50µg/ml leucine, uracil, adenine and histidine (YES). Dissection of asci from
heterozygous diploid cells showed that two out of four colonies were smaller in size (data not
shown). These smaller colonies were found by PCR to be ∆tsc1. Similar results were obtained
for the F15∆tsc2 strain. The slower growth phenotype on YES media was quantified in
exponential liquid growing cultures. The generation time (time required for cell population to
double) of F15∆tsc1 and F15∆tsc2 was approximately 5 hours compared to 3.5 hours for the F15
strain (Figure 1A). To test if growth was further affected by temperature stress, F15∆tsc1 and
F15∆tsc2 were plated on YES plates and incubated at 25°C and 37°C. No temperature-induced
growth defect was observed in the F15∆tsc1 and F15∆tsc2 strains (Figure 1B).
F15∆tsc1 and F15∆tsc2 are conditionally lethal.
We found a more severe growth defect in the F15∆tsc1 and F15∆tsc2 strains when they
were grown on essential minimal medium (EMM) plates. F15∆tsc1 and F15∆tsc2 yeast could not
grow on EMM supplemented with normal amounts (50 µg/ml) uracil, histidine, adenine and
leucine, but increasing supplements to 1000 µg/ml partially restored growth (Figure 1C). These
results are in agreement with the previously reported defect in uptake of leucine, adenine and
histidine (24). To verify that the growth defect was due to deletion of the tsc1+ and tsc2+ genes,
Tsc1 and Tsc2, expressed from a plasmid with ura4+, were transformed into the F15∆tsc1 and
by guest on January 22, 2019http://w
ww
.jbc.org/D
ownloaded from

10
F15∆tsc2 strains and were plated on EMM without uracil. Expression of Tsc1 restored growth in
F15∆tsc1 yeast, but failed to rescue F15∆tsc2, while Tsc2 expressed restored growth in
F15∆tsc2, but not in F15∆tsc1 (Figure 1D).
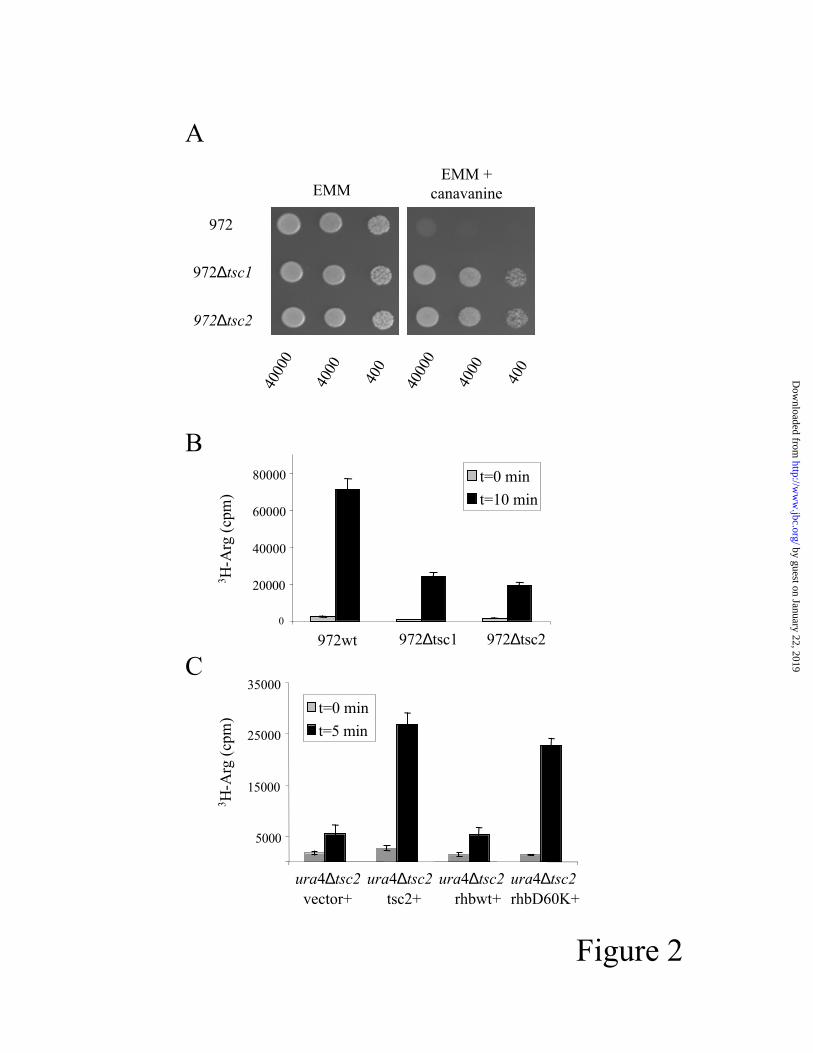
972∆tsc1 and 972∆tsc2 have a defect in arginine uptake.
Previously, Rhb1 was shown to regulate arginine uptake in S. pombe (26), prompting us
to determine whether Tsc1 and Tsc2 also regulate arginine uptake. Since F15∆tsc1 and F15∆tsc2
have a growth defect, we crossed ∆tsc1 and ∆tsc2 into the 972 background. This strain does not
require amino acid supplements and 972∆tsc1 and 972∆tsc2 did not show a growth defect on
EMM. We found that 972∆tsc1 and 972∆tsc2 are resistant to 60 µg/ml canavanine, a toxic
analog of arginine (Figure 2A). This dose of canavanine was toxic to the wild-type 972 strain.
To determine whether the canavanine resistance was due to decreased uptake, the uptake of 3H-
arginine was measured. After 10 minutes, arginine uptake was approximately 3.5-fold less in the
972∆tsc1 and 972∆tsc1 strains compared to wild-type 972 (Figure 2B), indicating that the
canavanine resistance is due to decreased uptake.
Dominant negative Rhb1 can rescue the arginine uptake in ura4∆tsc2.
A recent screen in S. pombe identified a dominant negative Rhb1 mutation, Rhb1-D60K,
that is unable to bind GTP or GDP (32). We generated this mutation in the pSLF373-ura4+
expression vector and crossed ∆tsc2 into the ura4-D18 strain to allow selection for cells
expressing from the pSLF373-ura4+ plasmid. We found that the decreased arginine uptake in
∆tsc2 was restored by expression of Rhb1-D60K, but not by wild-type Rhb1 (Figure 2C),
suggesting that arginine uptake is regulated through Tsc1, Tsc2 and Rhb1 in S. pombe.
by guest on January 22, 2019http://w
ww
.jbc.org/D
ownloaded from

11
A missense mutation in the GAP domain of tsc2+ does not rescue the conditional lethality or
arginine uptake in ∆tsc2.
The Tsc2 GAP domain in S. pombe is 39% identical to the GAP domain in human
tuberin, and the conserved residues include the sites of 3 patient-derived TSC2 missense
mutations (Figure 3A). To determine whether these residues are crucial for the function of Tsc2
in S. pombe, we constructed one of them, Tsc2-N1292K, which corresponds with N1643K in
human, in the HA-tagged pSLF373-ura4+ expression vector. Western blot analysis showed
protein expression for both Tsc2 and Tsc2-N1292K (Figure 3B). Next, the Tsc2 and Tsc2-
N1292K expression constructs were transformed into F15∆tsc2 and cells were plated on EMM
plates without uracil, but with 50 µg/ml leucine, adenine and histidine. The wild-type Tsc2
expression construct restored growth, but no growth was detected when the Tsc2-N1292K
mutation was expressed (Figure 3C). We next asked whether re-introducing Tsc2-N1292K could
revert the canavanine resistance in the ura4∆tsc2 strain. Wild-type Tsc2 restored the canavanine
sensitivity, while Tsc2-N1292K did not (Figure 3D). The decreased arginine uptake was
similarly rescued by wild-type Tsc2 but not by Tsc2-N1292K (Figure 3E). These results suggest
that the function of Tsc2 in regulating arginine uptake requires the GAP domain, and support the
use of S. pombe as a model system for human TSC.
∆tsc1 and ∆tsc2 show a significant overlap in expression profile.
To elucidate the mechanism through which tsc1+ and tsc2+ regulate amino acid uptake,
we compared the expression profile of 972∆tsc1 and 972∆tsc2. Total RNA was isolated from
972, 972∆tsc1 and 972∆tsc2 yeast, labeled, and hybridized to cDNA arrays (Eurogentec,
Belgium). The expression profile of 972∆tsc1 was compared to 972 on two separate arrays,
including a dye-flip experiment. The 972-972∆tsc2 comparison was completed using the same
design. Since all four arrays showed a linear relation between cy3 and cy5, a linear regression
by guest on January 22, 2019http://w
ww
.jbc.org/D
ownloaded from

12
normalization was applied to the data (30). In addition, as shown in Figure 4A, the dye-flip
experiment for ∆tsc1 was highly correlated. The expression data was also validated by the
absence of tsc1+ expression in the ∆tsc1 and absence of tsc2+ in the ∆tsc2 arrays, serving as
internal controls.
There was a high degree of overlap in expression profile between 972∆tsc1 and
972∆tsc2. In total 14 genes were downregulated at least 1.5 fold and 26 genes were upregulated
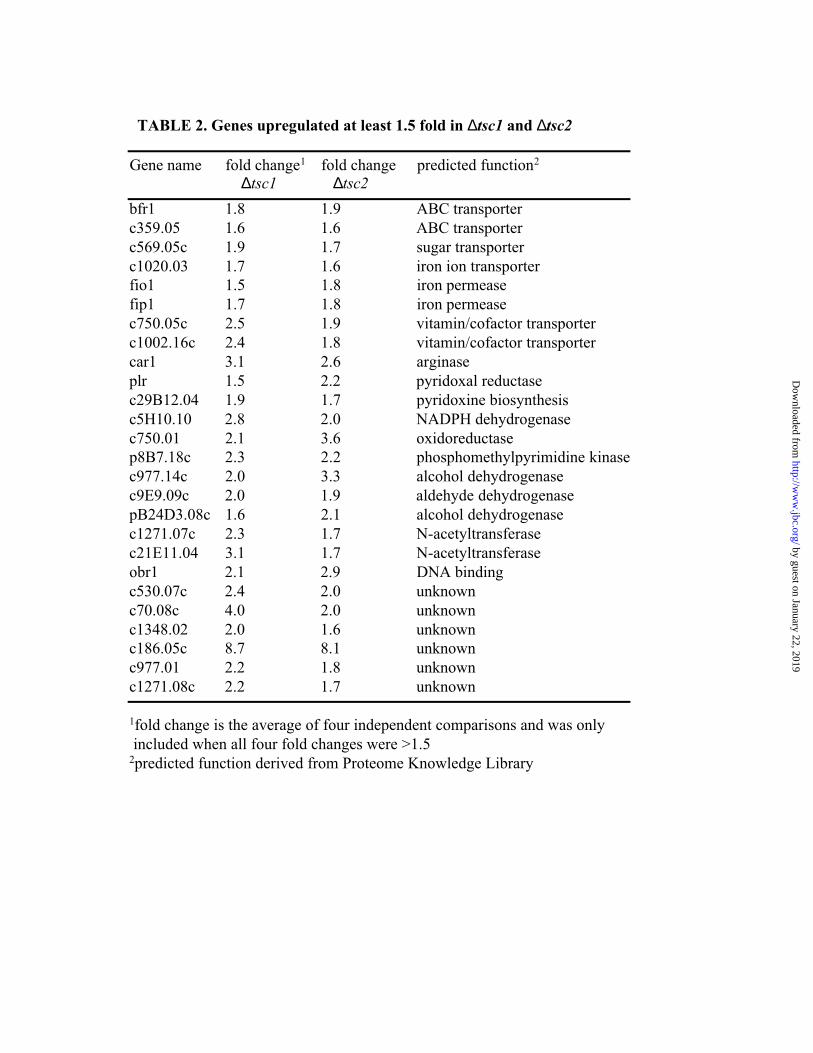
at least 1.5 fold both in 972∆tsc1 and 972∆tsc2 (Figure 4B). Table 2 lists the genes that were
upregulated at least 1.5 fold in both ∆tsc1 and ∆tsc2. Many of the upregulated genes have
predicted roles in iron transport and amino acid metabolism, including the arginase gene, car1+.
Table 3 lists the genes that were downregulated at least 1.5 fold in both ∆tsc1 and ∆tsc2.
Many of the downregulated genes were putative transporters, including three amino acid
permeases, two oligopeptide transporters, two polyamine transporters, and one with homology to
vitamin/cofactor transporters. Interestingly, the three downregulated amino acid permeases had
homology to the Gap1p (general amino acid permease) in S. cerevisiae. The expression change
for these three permeases was confirmed by Northern blotting (Figure 4C). The fold-change on
the Northern blot was determined by densitometry and was in each case slightly greater than the
fold-change on the array, further validating the array result. These data support that Tsc1 and
Tsc2 function in the same pathway in S. pombe, and suggest that they have a central role in the
regulation of the biosynthesis and uptake of amino acids, oligopeptides and polyamines.
Intracellular amino acid concentrations are decreased in 972∆tsc1 and 972∆tsc2.
The downregulation of permease expression and decreased uptake of amino acids in the
972∆tsc1 and 972∆tsc2 strains could represent an appropriate response to high intracellular
amino acid concentrations. However, we found that the intracellular levels of multiple amino
by guest on January 22, 2019http://w
ww
.jbc.org/D
ownloaded from

13
acids were low in 972∆tsc1 and 972∆tsc2 compared to 972 wild-type yeast (Figure 5A).
Ornithine, which is a product of both glutamate and arginine metabolism, showed the largest
relative decrease, from approximately 15 nM in 972 wild-type to nearly undetectable levels in
972∆tsc1 and 972∆tsc, while lysine was not changed (Figure 5B). A decrease of at least 40%
was detected for alanine, asparagine, histidine, glutamine, ornithine, citrulline and arginine.
Interestingly, the latter four are linked to arginine biosynthesis (Figure 5C). The low intracellular
amino acid levels, combined with the low amino acid permease expression levels and the
decreased arginine uptake, strongly suggest that yeast lacking tsc1+ or tsc2+ have an intrinsic
defect in amino acid sensing.
by guest on January 22, 2019http://w
ww
.jbc.org/D
ownloaded from

14
DISCUSSION
We report here that S. pombe lacking tsc1+ or tsc2+ have defects in amino acid transport,
involving not only the permease localization reported previously (24), but also decreased
expression of amino acid permeases, decreased uptake of arginine, and low intracellular amino
acid levels.
The decreased uptake of arginine in the ∆tsc2 cells could be restored by expressing wild-
type tsc2+, but not by expressing the tsc2+ gene carrying a mutation in the highly conserved GAP
domain. This mutation is homologous to the patient-derived N1643K. Interestingly, the small
GTPase Rheb was recently identified as the key target of the GAP domain of the TSC2 gene
product, tuberin, in mammals and Drosophila (5-7,9). From previous studies it was known that
Rhb1 regulates arginine uptake in S. pombe (25) as well as S. cerevisiae (31). We found that the
arginine uptake defect in the ∆tsc2 yeast was rescued by expression of a dominant negative form
of S. pombe Rhb1, D60K. The rescue by Rhb1-D60K suggests that Rhb1 is downstream of Tsc2
in S. pombe as well as in other species and further strengthens the relevance of the S. pombe
model to human TSC.
Previously, the mislocalization of an amino acid permease c359.03+ (accession No.
CAB91572) in ∆tsc1 and ∆tsc2 was postulated to be the result of aberrant protein trafficking
(24). However, we found that the expression of three other amino acid permeases with high
homology to the general amino acid permease (Gap1p) in S. cerevisiae were downregulated both
in ∆tsc1 and ∆tsc2 cells. The permease c359.03+ was not downregulated in ∆tsc1 or ∆tsc2,
suggesting that permeases are regulated at both the transcriptional and post-translational levels in
∆tsc1 and ∆tsc2. In S. cerevisiae, decreased expression of GAP1 and sorting of Gap1p from the
plasma membrane to the vacuole are the appropriate response to high levels of intracellular
amino acids (33). In contrast, the decreased permease expression in ∆tsc1 or ∆tsc2 yeast was
by guest on January 22, 2019http://w
ww
.jbc.org/D
ownloaded from

15
associated with low intracellular amino acids, including alanine, asparagine, histidine, glutamine,
ornithine, citrulline and arginine. The inability to respond appropriately to low amino acid levels
suggests that Tsc1 and Tsc2 play a role in amino acid sensing and would argue that expression
levels of permeases, as well as their localization, are crucial in coordinating sensing and growth
in S. pombe.
Altered intracellular amino acid levels have not been detected in mammalian cells lacking
tuberin or hamartin, although to our knowledge only limited studies have looked into this
phenomenon. The only study published so far measured the levels of valine, leucine,
phenylalanine and lysine in Drosophila S2 cells treated with TSC2 siRNA (17). A difference in
intracellular levels was not detected, but those four amino acids were not changed in S. pombe
lacking tsc1+ and tsc2+.
The expression profile of ∆tsc1 and ∆tsc2 cells showed extensive overlap, consistent with
similar phenotypes of TSC1 and TSC2 mutations in humans, rodents, Drosophila, and S. pombe.
In addition to the downregulated amino acid permeases, two enzymes linked to arginine
biosynthetic pathways were differentially expressed: arginase and 5-oxoprolinase. Two genes
with homology to mammalian 5-oxoprolinase were downregulated in both ∆tsc1 and ∆tsc2. 5-
oxoprolinase hydrolyzes pyroglutamic acid to glutamate, and is downregulated in some human
tumors (34). Arginase was upregulated in both ∆tsc1 and ∆tsc2, despite the low intracellular
arginine levels. Arginase plays an important role in the production of ornithine (35), so the
increase in arginase mRNA could be a response to the drop in ornithine levels from 15 nm in
wild-type to nearly undetectable levels in the ∆tsc1 and ∆tsc2 strains. Ornithine is the precursor
of polyamines, including spermidine. Spermidine is essential for growth and cell cycle
progression in S. pombe (36). Polyamines are also critical to the growth and differentiation of
mammalian cells, and are elevated in many human cancers (37,38). Finally, arginase is
by guest on January 22, 2019http://w
ww
.jbc.org/D
ownloaded from
16
important in mammalian cells because it competes with nitric oxide synthetase (NOS) for
arginine, which is the substrate for both arginase and NOS. In mammalian cells, nitric oxide is a
key second messenger regulating many processes, including neuronal signaling (39). It will
clearly be important to determine whether expression of permeases, arginase, or 5-oxoprolinase
is regulated by mammalian TSC1 and TSC2.
Mice with conditional inactivation of Tsc1 in brain astrocytes develop seizures (40).
Seizures are a major clinical problem in TSC, affecting 80% of patients, and are often refractory
to treatment. Interestingly, the Tsc1-/- astrocytes have decreased uptake of the excitatory
neurotransmitter glutamate and decreased expression of two glutamate transporters (40). It is
postulated that reduced astrocyte clearance of glutamate from the synaptic cleft slows the decay
of excitatory stimuli, lowering the seizure threshold. If the decreased glutamate uptake is
mechanistically related to the decreased amino acid uptake in S. pombe, the yeast model could
provide a novel system for the study of epilepsy.
In conclusion, our data show for the first time that Tsc1 and Tsc2 regulate arginine
uptake and arginine biosynthesis in S. pombe. Rescue of the arginine uptake defect by a
dominant negative form of Rhb1 suggests that Rhb1 is downstream of Tsc2 in S. pombe, as well
as in other species. The complexity of the amino acid phenotype is suggestive of an intrinsic
defect in amino acid sensing, involving amino acids and enzymes closely linked to ornithine and
arginine. If similar pathways are affected in mammalian cells lacking TSC1 or TSC2, defects in
polyamines and/ or nitric oxide levels could be pathogenically linked to the clinical
manifestations of TSC, including refractory seizures.
by guest on January 22, 2019http://w
ww
.jbc.org/D
ownloaded from
17
ACKNOWLEDGEMENTS
We are grateful to the FCCC Microarray Facility for help with the protocols and to Erica
Golemis and Jon Chernoff for critical reading of the manuscript. This work was supported by a
fellowship from the Polycystic Kidney Disease Foundation to MvS and by the Department of
Defense.
REFERENCES
1. van Slegtenhorst, M., de Hoogt, R., Hermans, C., Nellist, M., Janssen, B., Verhoef, S.,
Lindhout, D., van den Ouweland, A., Halley, D., Young, J., Burley, M., Jeremiah, S.,
Woodward, K., Nahmias, J., Fox, M., Ekong, R., Osborne, J., Wolfe, J., Povey, S., Snell,
R. G., Cheadle, J. P., Jones, A. C., Tachataki, M., Ravine, D., Kwiatkowski, D. J., and et
al. (1997) Science 277, 805-808
2. The European Chromosome 16 Tuberous Sclerosis Consortium. (1993) Cell 75, 1305-
1315
3. Plank, T. L., Yeung, R. S., and Henske, E. P. (1998) Cancer Res 58, 4766-4770
4. van Slegtenhorst, M., Nellist, M., Nagelkerken, B., Cheadle, J., Snell, R., van den
Ouweland, A., Reuser, A., Sampson, J., Halley, D., and van der Sluijs, P. (1998) Hum
Mol Genet 7, 1053-1057
5. Saucedo, L. J., Gao, X., Chiarelli, D. A., Li, L., Pan, D., and Edgar, B. A. (2003) Nat Cell
Biol 5, 566-571
6. Stocker, H., Radimerski, T., Schindelholz, B., Wittwer, F., Belawat, P., Daram, P.,
Breuer, S., Thomas, G., and Hafen, E. (2003) Nat Cell Biol 5, 559-565
by guest on January 22, 2019http://w
ww
.jbc.org/D
ownloaded from

18
7. Zhang, Y., Gao, X., Saucedo, L. J., Ru, B., Edgar, B. A., and Pan, D. (2003) Nat Cell
Biol 5, 578-581
8. Tee, A. R., Manning, B. D., Roux, P. P., Cantley, L. C., and Blenis, J. (2003) Curr Biol
13, 1259-1268
9. Garami, A., Zwartkruis, F. J., Nobukuni, T., Joaquin, M., Roccio, M., Stocker, H.,
Kozma, S. C., Hafen, E., Bos, J. L., and Thomas, G. (2003) Mol Cell 11, 1457-1466
10. Castro, A. F., Rebhun, J. F., Clark, G. J., and Quilliam, L. A. (2003) J Biol Chem 278,
32493-32496
11. Inoki, K., Li, Y., Xu, T., and Guan, K. L. (2003) Genes Dev 17, 1829-1834
12. Yang, W., Tabancay, A. P., Jr., Urano, J., and Tamanoi, F. (2001) Mol Microbiol 41,
1339-1347
13. Potter, C. J., Huang, H., and Xu, T. (2001) Cell 105, 357-368
14. Manning, B. D., Tee, A. R., Logsdon, M. N., Blenis, J., and Cantley, L. C. (2002) Mol
Cell 10, 151-162
15. Tapon, N., Ito, N., Dickson, B. J., Treisman, J. E., and Hariharan, I. K. (2001) Cell 105,
345-355
16. Radimerski, T., Montagne, J., Hemmings-Mieszczak, M., and Thomas, G. (2002) Genes
Dev 16, 2627-2632
17. Gao, X., Zhang, Y., Arrazola, P., Hino, O., Kobayashi, T., Yeung, R. S., Ru, B., and Pan,
D. (2002) Nat Cell Biol 4, 699-704
18. Jaeschke, A., Hartkamp, J., Saitoh, M., Roworth, W., Nobukuni, T., Hodges, A.,
Sampson, J., Thomas, G., and Lamb, R. (2002) J Cell Biol 159, 217-224
19. Astrinidis, A., Senapedis, W., Coleman, T. R., and Henske, E. P. (2003) J Biol Chem
by guest on January 22, 2019http://w
ww
.jbc.org/D
ownloaded from
19
20. Dan, H. C., Sun, M., Yang, L., Feldman, R. I., Sui, X. M., Ou, C. C., Nellist, M., Yeung,
R. S., Halley, D. J., Nicosia, S. V., Pledger, W. J., and Cheng, J. Q. (2002) J Biol Chem
277, 35364-35370
21. Inoki, K., Li, Y., Zhu, T., Wu, J., and Guan, K. L. (2002) Nat Cell Biol 4, 648-657
22. Li, Y., Inoki, K., Vacratsis, P., and Guan, K. L. (2003) J Biol Chem 278, 13663-13671
23. Inoki, K., Zhu, T., and Guan, K. L. (2003) Cell 115, 577-590
24. Matsumoto, S., Bandyopadhyay, A., Kwiatkowski, D. J., Maitra, U., and Matsumoto, T.
(2002) Genetics 161, 1053-1063
25. Mach, K. E., Furge, K. A., and Albright, C. F. (2000) Genetics 155, 611-622
26. Yang, W., Urano, J., and Tamanoi, F. (2000) J Biol Chem 275, 429-438
27. Leupold, U. (1970) Methods Cell Physiol. 4, 169-177
28. Grimm, C., and Kohli, J. (1988) Mol Gen Genet 215, 87-93
29. Bahler, J., Wu, J. Q., Longtine, M. S., Shah, N. G., McKenzie, A., 3rd, Steever, A. B.,
Wach, A., Philippsen, P., and Pringle, J. R. (1998) Yeast 14, 943-951
30. Quackenbush, J. (2002) Nat Genet 32 Suppl, 496-501
31. Urano, J., Tabancay, A. P., Yang, W., and Tamanoi, F. (2000) J Biol Chem 275, 11198-
11206
32. Tabancay, A. P., Jr., Gau, C. L., Machado, I. M., Uhlmann, E. J., Gutmann, D. H., Guo,
L., and Tamanoi, F. (2003) J Biol Chem 278, 39921-39930
33. Chen, E. J., and Kaiser, C. A. (2003) J Cell Biol 161, 333-347
34. Su, A. I., Cooke, M. P., Ching, K. A., Hakak, Y., Walker, J. R., Wiltshire, T., Orth, A. P.,
Vega, R. G., Sapinoso, L. M., Moqrich, A., Patapoutian, A., Hampton, G. M., Schultz, P.
G., and Hogenesch, J. B. (2002) Proc Natl Acad Sci U S A 99, 4465-4470
35. Bansal, V., and Ochoa, J. B. (2003) Curr Opin Clin Nutr Metab Care 6, 223-228
by guest on January 22, 2019http://w
ww
.jbc.org/D
ownloaded from

20
36. Chattopadhyay, M. K., Tabor, C. W., and Tabor, H. (2002) Proc Natl Acad Sci U S A 99,
10330-10334
37. Wallace, H. M., Fraser, A. V., and Hughes, A. (2003) Biochem J 376, 1-14
38. Thomas, T., and Thomas, T. J. (2003) J Cell Mol Med 7, 113-126
39. Wu, G., and Morris, S. M., Jr. (1998) Biochem J 336 ( Pt 1), 1-17
40. Wong, M., Ess, K. C., Uhlmann, E. J., Jansen, L. A., Li, W., Crino, P. B., Mennerick, S.,
Yamada, K. A., and Gutmann, D. H. (2003) Ann Neurol 54, 251-256
by guest on January 22, 2019http://w
ww
.jbc.org/D
ownloaded from
21
FIGURE LEGENDS
Figure 1. F15∆tsc1 and F15∆tsc2 exhibit growth defects.
(A) F15, F15∆tsc1 and F15∆tsc2 strains were grown in rich liquid medium with supplements
(YES) overnight to midlog phase (OD595= 0.4-0.6) and diluted to OD595= 0.2. Cells were grown
for an additional 6 hours and the generation time was determined between 3 and 6 hours. The
F15∆tsc1 and F15∆tsc2 needed approximately 5 hours to complete one generation compared to
3.5 hours for wild-type strains (B) 40,000 F15, F15∆tsc1 and F15∆tsc2 cells were spotted on
YES + G418 (200 µg/ml). F15∆tsc1 and F15∆tsc2 were G418 resistant as expected. The cells
were also spotted on YES plates and grown at 25°C, 30°C and 37°C for 3 days. No growth
differences were seen between F15, F15∆tsc1 and F15∆tsc2. (C) F15, F15∆tsc1 and F15∆tsc2
cells were spotted (40,000 cells) onto essential minimal medium (EMM) plates with different
amounts of adenine, leucine, histidine and uracil. At regular amounts (50 µg/ml) the F15∆tsc1
and F15∆tsc2 could not grow, but growth was partially restored by increasing the amount of
supplements to 1 mg/ml. (D) Tsc1 and Tsc2 expression constructs in pREP4X (ura4+) were
transformed into F15∆tsc1 and F15∆tsc2 and plated onto EMM plates supplemented with 50
µg/ml leucine, adenine and histidine. pREP4X-Tsc1 expression rescued the growth of F15∆tsc1,
and pREP4X-Tsc2 expression rescued the growth of F15∆tsc2.
by guest on January 22, 2019http://w
ww
.jbc.org/D
ownloaded from

22
Figure 2. The 972∆tsc1 and 972∆tsc2 have a decreased uptake of arginine, which can be
restored in the 972∆tsc2 by expressing a dominant negative Rhb1 mutation.
(A) 972 wild-type, 972∆tsc1 and 972∆tsc2 were grown in EMM without supplements overnight
to midlog phase and cells were diluted to OD595=0.4. Three different dilutions (40,000-4000-400
cells) were spotted on EMM plates with and without 60 µg/ml canavanine. Plates were incubated
at 30°C for 3 days. Canavanine killed wild-type cells, but 972∆tsc1 and 972∆tsc2 were resistant
to 60 µg/ml canavanine. (B) Cells were grown till midlog phase (OD595=0.5) in EMM and
25,000 cells were resuspended in 100 µM of L-arginine with 1 µCi of L-H3 arginine (40-70
Ci/mmol) in 600 µl. Aliquots of 200 µl were injected into 5 ml of EMM in a vacuum manifold at
0 and 10 minutes, washed twice with 5 ml of deionized water and assayed for L-H3 arginine
uptake. The arginine uptake was 3.5-fold less in the 972∆tsc1 and 972∆tsc2 strains compared to
972 wild-type. Experiments were done in triplicate and similar results were seen in two
independent experiments. (C) The arginine uptake was measured for the ura4∆tsc2 strain
expressing either empty vector, Tsc2, Rhb1 and dominant negative Rhb-D60K from a plasmid
with ura4+. Expression of either Tsc2 or Rhb1-D60K restored the arginine uptake.
by guest on January 22, 2019http://w
ww
.jbc.org/D
ownloaded from
23
Figure 3. A patient-derived mutant form of tsc2 does not rescue the arginine uptake.
(A) Alignment of the GAP domain amino acids 1609-1675. Three human disease causing
mutations (N1643K, N1651S and P1675L), indicated by asterisks above the alignment, are
conserved in S. pombe. (B) Expression of HA-Tsc2 and HA-Tsc2-N1292K was confirmed in
ura4∆tsc2 by Western immunoblot with an anti-HA antibody. Tubulin is shown as a loading
control. (C) Constructs expressing wild-type Tsc2 and Tsc2-N1292K were transformed into the
F15∆tsc2 strain and plated onto EMM plates supplemented with 50 µg/ml of leucine, adenine,
histidine, without uracil. Tsc2 expression rescued growth, while the Tsc2-N1292K mutation did
not. (D) Canavanine sensitivity was measured in ura4∆tsc2 expressing either empty vector,
Tsc2, or Tsc2-N1292K, from a plasmid with ura4+. Tsc2 expression restored the canavanine
sensitivity in ∆tsc2, while Tsc2-N1292K expression did not. (E) Arginine uptake was measured
in ura4∆tsc2 expressing either empty vector, Tsc2 or Tsc2-N1292K. The uptake defect was
rescued by expressing Tsc2, but not by Tsc2-N1292K.
by guest on January 22, 2019http://w
ww
.jbc.org/D
ownloaded from

24
Figure 4. 972∆tsc1 and 972∆tsc2 show a significant overlap in expression profile.
(A) Correlation plot of the average gene expression ratios from the ∆tsc1 dyeflip experiment. (B)
Expression profiles were compared between 972, 972∆tsc, and 972∆tsc2. At fold change > 1.5,
there were 14 downregulated and 26 upregulated genes in common. (C) Expression of three
permease genes, p7G5.06+, c869.10+ and isp5+ was determined by Northern blots. Fold changes
were determined by densitometry. All three genes were downregulated in 972∆tsc1 and
972∆tsc2, consistent with the array result.
Figure 5. Intracellular amino acid levels are low in the 972∆tsc1 and 972∆tsc2.
(A) Intracellular amino acid levels in 972∆tsc1 and 972∆tsc2 were compared to 972 wild-type
yeast. A decrease of at least 40% was detected for alanine, asparagine, histidine, glutamine,
ornithine, citrulline and arginine in 972∆tsc1 and 972∆tsc2. Two biological replicates were run
for each sample and similar results were seen in two independent experiments. (B) Ornithine and
lysine amino acid profile in 972 wild-type, 972∆tsc1 and 972∆tsc2. Ornithine levels were greatly
decreased in 972∆tsc1 and 972∆tsc2, while lysine levels were similar for 972 wild-type,
972∆tsc1 and 972∆tsc2. (C) Arginine metabolism in S. pombe. Enzymes are in italic. Arginase
converts arginine into ornithine, a precursor of polyamines.
by guest on January 22, 2019http://w
ww
.jbc.org/D
ownloaded from

TABLE 1. S. pombe strains used in this study
Strain Genotype Source
972 h- LeupoldMVS1 h-, ∆tsc1::kan+ This studyMVS2 h-, ∆tsc2::kan+ This studyura4-D18 h+, ura4-D18 Grimm and KohliMVS3 h+, ura4-D18, ∆tsc1::kan+ This study MVS4 h+, ura4-D18, ∆tsc2::kan+ This study CHP428 h+, leu1-32, ura4-D18, ade6-210, his7-366 HoffmanCHP429 h-, leu1-32, ura4-D18, ade6-216, his7-366 HoffmanMVS5 h-, leu1-32, ura4-D18, ade6-216, his7-366, ∆tsc1::kan+ This studyMVS6 h-, leu1-32, ura4-D18, ade6-216, his7-366, ∆tsc2::kan+ This study
by guest on January 22, 2019http://w
ww
.jbc.org/D
ownloaded from
bfr1 1.8 1.9 ABC transporterc359.05 1.6 1.6 ABC transporter c569.05c 1.9 1.7 sugar transporterc1020.03 1.7 1.6 iron ion transporterfio1 1.5 1.8 iron permeasefip1 1.7 1.8 iron permeasec750.05c 2.5 1.9 vitamin/cofactor transporterc1002.16c 2.4 1.8 vitamin/cofactor transportercar1 3.1 2.6 arginaseplr 1.5 2.2 pyridoxal reductasec29B12.04 1.9 1.7 pyridoxine biosynthesisc5H10.10 2.8 2.0 NADPH dehydrogenasec750.01 2.1 3.6 oxidoreductasep8B7.18c 2.3 2.2 phosphomethylpyrimidine kinasec977.14c 2.0 3.3 alcohol dehydrogenasec9E9.09c 2.0 1.9 aldehyde dehydrogenasepB24D3.08c 1.6 2.1 alcohol dehydrogenasec1271.07c 2.3 1.7 N-acetyltransferasec21E11.04 3.1 1.7 N-acetyltransferaseobr1 2.1 2.9 DNA bindingc530.07c 2.4 2.0 unknownc70.08c 4.0 2.0 unknownc1348.02 2.0 1.6 unknownc186.05c 8.7 8.1 unknownc977.01 2.2 1.8 unknownc1271.08c 2.2 1.7 unknown
1fold change is the average of four independent comparisons and was only included when all four fold changes were >1.52predicted function derived from Proteome Knowledge Library
TABLE 2. Genes upregulated at least 1.5 fold in ∆tsc1 and ∆tsc2
Gene name fold change1 fold change predicted function2
∆tsc1 ∆tsc2
by guest on January 22, 2019http://w
ww
.jbc.org/D
ownloaded from

Gene name fold change1 fold change predicted function2
972∆tsc1 972∆tsc2
isp5 3.6 2.6 amino acid permeasec869.10c 1.6 1.5 amino acid permeasep7G5.06 1.7 1.5 amino acid permeaseisp4 4.4 3.7 oligo peptide transporterptr2 2.4 2.3 oligo peptide transporterc409.08 1.6 1.5 polyamine transporterc794.04c 3.3 2.3 polyamine transporterc11D3.18c 3.4 2.5 vitamin/cofactor transporterc1039.10 2.3 1.8 translation initiation inhibitorc11D3.14c 3.6 2.3 5-oxoprolinasec11D3.15 3.7 2.3 5-oxoprolinasec2H10.01 2.1 1.6 transcription factorc1223.09 1.7 1.6 urate oxidasec5H10.01 6.7 3.1 unknown
1fold change is the average of four independent comparisons and was only included when all four fold changes were >1.52predicted function derived from Proteome Knowledge Library
TABLE 3. Genes downregulated at least 1.5 fold in 972∆tsc1 and 972∆tsc2
by guest on January 22, 2019http://w
ww
.jbc.org/D
ownloaded from

A
0.00
0.20
0.40
0.60
0.80
0 2 4 6
F15
F15∆tsc1F15∆tsc2
O.D
. 595
time (hours)
B
C
F15∆
tsc2
F15
F15∆
tsc1
F15∆tsc1 F15∆tsc2
pTsc1+
pTsc2+
D
Figure 1
F15∆
tsc2
F15
F15∆
tsc1
37°C
25°C
30°C + G418
EMM
50 µg/ml
250 µg/ml
1000 µg/ml
YES
30°C
by guest on January 22, 2019http://w
ww
.jbc.org/D
ownloaded from
A
EMMEMM +
canavanine
Figure 2
972∆tsc2
972∆tsc1
972
4000
0
400
0
400
4000
0
400
0
400
3 H-A
rg (
cpm
)
B
0
20000
40000
60000
80000
972∆tsc2972∆tsc1972wt
t=0 min
t=10 min
C
5000
15000
25000
35000
ura4∆tsc2 tsc2+
ura4∆tsc2 rhbwt+
ura4∆tsc2rhbD60K+
3 H-A
rg (
cpm
)
t=0 min
t=5 min
ura4∆tsc2 vector+
by guest on January 22, 2019http://w
ww
.jbc.org/D
ownloaded from
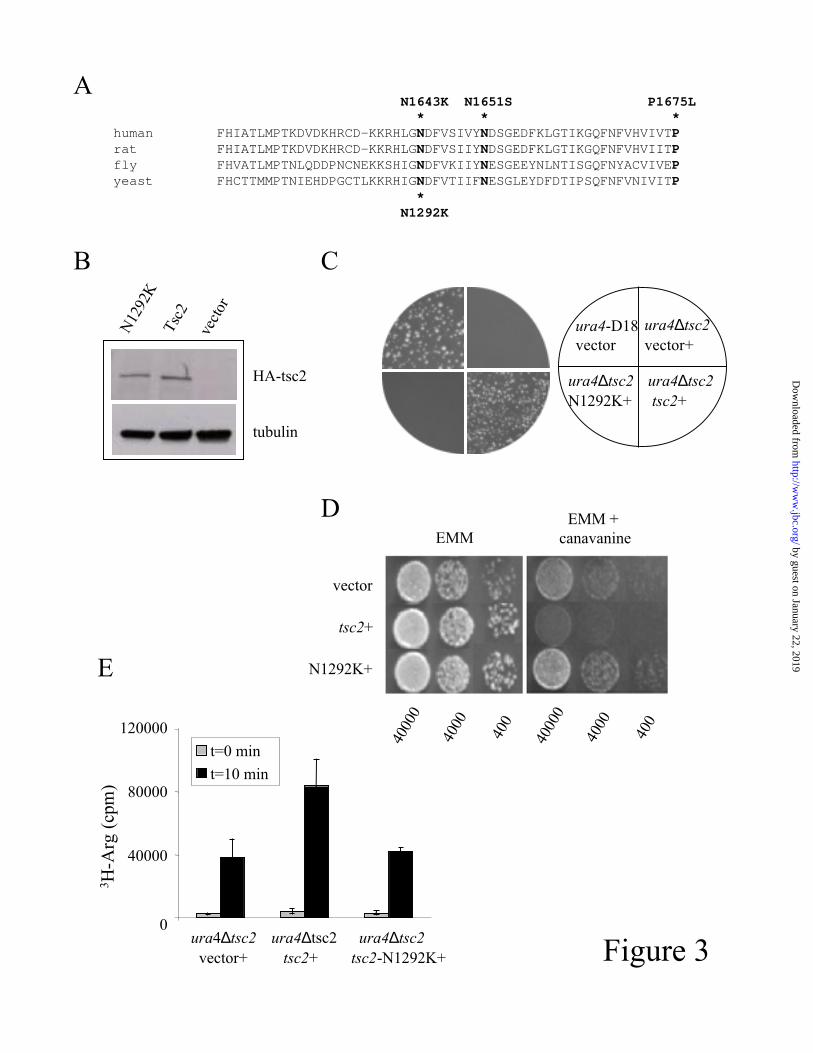
Figure 3
B
Tsc2
N12
92K
vect
or
tubulin
HA-tsc2
N1643K N1651S P1675L * * *human FHIATLMPTKDVDKHRCD-KKRHLGNDFVSIVYNDSGEDFKLGTIKGQFNFVHVIVTPrat FHIATLMPTKDVDKHRCD-KKRHLGNDFVSIIYNDSGEDFKLGTIKGQFNFVHVIITPfly FHVATLMPTNLQDDPNCNEKKSHIGNDFVKIIYNESGEEYNLNTISGQFNYACVIVEPyeast FHCTTMMPTNIEHDPGCTLKKRHIGNDFVTIIFNESGLEYDFDTIPSQFNFVNIVITP
*N1292K
A
DEMM
EMM + canavanine
N1292K+
vector
tsc2+
4000
0
400
0
400
4000
0
400
0
400
E
0
40000
80000
120000
ura4∆tsc2 vector+
ura4∆tsc2 tsc2+
ura4∆tsc2tsc2-N1292K+
t=0 min
t=10 min
3 H-A
rg (
cpm
)
C
ura4-D18vector
ura4∆tsc2N1292K+
ura4∆tsc2 tsc2+
ura4∆tsc2vector+
by guest on January 22, 2019http://w
ww
.jbc.org/D
ownloaded from

Figure 4
Bdownregulated upregulated
14
∆tsc1 ∆tsc2
214 30
∆tsc1 ∆tsc2
1026
C
p7G5.06
972w
t97
2∆tsc
1
c869.10
gpd3
972∆
tsc2
isp5
FC∆t
sc1
FC∆t
sc2
-2.0 -1.7
-2.0 -2.4
-6.8 -4.7
control
A
-3
-2
-1
0
1
2
3
-3 -2 -1 0 1 2 3
arra
y 2
array 1
by guest on January 22, 2019http://w
ww
.jbc.org/D
ownloaded from

Figure 5
A
0
10
20
30
glu orn asp ala lys gly gln
972wt972∆tsc1972∆tsc2
aa c
once
ntra
tion
(nm
ole)
0
1
2
thr ser asn citr val leu tyr phe his arg pro
aa c
once
ntra
tion
(nm
ole)
CB
ornithine lysine
972wt972∆tsc1972∆tsc2
glutamate
ornithine
citrulline
arginine
glutamine
arginase
pyroglutamic acid
5-oxoprolinase
polyamines
by guest on January 22, 2019http://w
ww
.jbc.org/D
ownloaded from

Petri HenskeMarjon van Slegtenhorst, Erikka Carr, Radka Stoyanova, Warren Kruger and Elizabeth
pombeTsc1+ and tsc2+ regulate arginine uptake and metabolism in Schizosaccharomyces
published online January 12, 2004J. Biol. Chem.
10.1074/jbc.M313874200Access the most updated version of this article at doi:
Alerts:
When a correction for this article is posted•
When this article is cited•
to choose from all of JBC's e-mail alertsClick here
by guest on January 22, 2019http://w
ww
.jbc.org/D
ownloaded from