Trusted by the Life Sciences Industry -...
20
Trusted by the Life Sciences Industry Second Quarter 2018 1
Transcript of Trusted by the Life Sciences Industry -...

Trusted by the Life Sciences Industry
Second Quarter 2018
1

This presentation contains certain forward-looking statements that involve risks and
uncertainties. Such forward-looking statements include statements regarding attempts
to identify new strategic opportunities which may include a strategic transaction, plans
regarding partnering activities, product pricing, financial forecasts. Such statements are
only predictions and the Company's actual results may differ materially from those
anticipated in these forward-looking statements. Factors that may cause such differences
include the risk that the Company may not be able to identify acceptable strategic
opportunities or conclude any strategic transaction which it does identify, the risk that
products that appeared promising in early use do not demonstrate the same utility in
larger-scale uses, the risks associated with the Company's reliance on outside financing
to meet its capital requirements, and the risks associated with the Company's reliance on
collaborative partners for shipping. Forward-looking statements are inherently subject to
risks and uncertainties, some of which cannot be predicted, or quantified. Future events
and actual results could differ materially from those set forth in, contemplated by, or
underlying the forward-looking statements. The risks and uncertainties to which forward-
looking statements are subject include, but are not limited to, the effect of government
regulation, competition and other material risks. These factors and others are more fully
discussed in the Company's periodic reports and other filings with the Securities and
Exchange Commission.
Safe Harbor – Forward Looking Statements
2

Quarterly Overview
Business description Leading temperature-controlled logistics solutions provider for the life sciences industry with a focus on
the regenerative medicine market (e.g., CAR-T)
Clients Pharmaceutical and biotechnology companies (e.g., Novartis, Gilead/Kite(a), Atara, Zoetis etc.)
Markets Biopharma, Reproductive Medicine, and Animal Health
Commercial Biopharma
Agreements Novartis and Gilead/Kite
Number of Clinical Trials
Currently Supported 258, 34 of which are in Phase III
Revenue Growth Year-
over-Year 59%
Q1 2018 Gross Margin 54%
Biopharma Revenue
Growth Year-over-Year 73%
CEO Jerrell Shelton
Headquarters Irvine, CA
(a) Kite was acquired by Gilead Sciences in October 2017
3

4
Global Logistics Centers & Volume Heat Maps
866 Global Regenerative Medicine Companies (up
from 672 in 2016) – 466 North America, 235 Europe
and Israel, 127 Asia, and 16 RoW.
May, 2018 Gilead announced a new YescartaTM
manufacturing facility would be built in Amsterdam,
Netherlands.
July, 2018 Novartis announced KymriahTM
manufacturing centers in Paris, France and Leipzig,
Germany.
New Cryoport Global Logistics Centers in Livingston,
New Jersey and Amsterdam, Netherlands.

Global Transportation Partnerships
FedEx® Deep Frozen
Shipping Solution
powered by Cryoport®
Cryoport’s solutions have global reach through shipping agreements with FedEx,
UPS, DHL, and World Courier
5

Clinical Trials Drive Revenue Growth in Biopharma
258
110 114 34
22 new clinical trials (net) added in Q2-2018; 86 clinical trials (net) added since Q2-2017;
34 Phase III
6

(a) Alliance for Regenerative Medicine, July 1, 2018
(b) Alliance for Regenerative Medicine, March 7, 2017
Industry inflection point:
Commercialization has begun
Novartis’ CAR-T drug, KymriahTM ,
approved in August 2017 and
Gilead/Kite therapy, Yescarta™,
approved in October 2017
Kymriah™ second indication
approved on 5/1/18
Two EMA’s filed and one EMA
approved so far in 2018
At least 4 additional BLA/EMAs
for regenerative therapies
expected to be filed in 2018
532 of all current clinical trials are
in oncology
Total of 20 Regenerative Medicine
Advanced Therapy designations
granted
977 Clinical trials underway(a)
631 year-end 2015(b)
Ph. I: 324 (261 in 2016)
(192 in 2015)
Ph. II: 560 (475 in 2016)
(376 in 2015)
Ph. III: 93 (68 in 2016)
(63 in 2015)
804 year-end 2016(b)
7
Primary Target Market: Regenerative Therapy

CHAIN of CUSTODY CHAIN of CONDITION CHAIN of IDENTITY CHAIN of COMPLIANCETM
Traceability of the Custody of each Client’s or Patient’s Therapy
Traceability of the Condition of each Client’s
or Patient’s Therapy
Traceability of the Identity of each Client’s or Patient’s Therapy
Traceability of the Equipment and Processes Supporting each
Client’s or Patient’s Therapy
Chain of ComplianceTM Logistics Management
8

Current FDA Approved RMAT Designations
Company Product Indication Website Year
Asterias Biotherapeutics AST-OPC1 Spinal Cord www.asteriasbiotherapeutics.com 2017
Athersys Multistem Ischemic Stroke www.athersys.com 2017
Bluebird Bio Lentiglobin Sickle Cell www.bluebirdbio.com 2017
Cellvation CEVA101 Brain Injury www.cellvation.com 2017
Humacyte Humacyl Hemodialysis www.humacyte.com 2017
Enzyvant RVT-802 DiGeorge Syndrome www.enzyvant.com 2017
Jcyte jcell Retinitis Pigmentosa www.jcyte.com 2017
Juno Therapeutics JCAR017 Lymphoma www.junotherapeutics.com 2017
Kiadis Pharma ATIR101 Leukemia www.kiadis.com 2017
Mallinckrodt Pharma Stratagraft Thermal Burns www.mallinckrodt.com 2017
Mesoblast MPC-150-IM Heart Failure www.mesoblast.com 2017
Vericel Corp. lxymelocel-T Dialated Cardiomyopathy www.vcel.com 2017
Abeona Therapeutics EB-101 Recessive RDEB www.abeonatherapeutics.com 2018
Abeona Therapeutics ABO-102 Sanfilippo Syndrome www.abeonatherapeutics.com 2018
Caladrius Biosciences CLBS14 Refractory Angina www.caladrius.com 2018
Capricor Therapeutics CAP-1001 Duchenne Muscular Dystrophy www.capricor.com 2018
Cellerant Therapeutics Romyelocel-L Neutropenia Infections www.cellerant.com 2018
MiMedx AmnioFix Osteoarthritis www.mimedx.com 2018
Nightstar Therapeutics NSR-REP1 Chorideremia www.nightstartx.com 2018
Voyager Therapeutics VY-AADC Parkinsons www.voyagertherapeutics.com 2018
9

Adoptive Cellular Therapy: Immuno-Oncology
Landscape
10
Source – Wells Fargo Securities Conference, November 2017

Novartis – KymriahTM Ramp Continues
Second indication of KymriahTM for adult r/r DLBCL approved in Q2 2018
Received positive CHMP opinion for both r/r pediatric & young adult ALL and r/r DLBCL in Q2
$16 million Q2 2018 commercial revenue for KymriahTM
Six additional active clinical trials
Manufactured for over 300 patients in 11 countries and 35 certified treatment centers at end of
Q1 2018
Over 500 employees supporting KymriahTM
11

Gilead – Yescarta™ Ramp Builds
Yescarta™ approved in U.S. in October 2017
Received positive CHMP opinion for r/r DLBCL
in Q2 and European approval anticipated in Q3
2018.
$68 million in net commercial YescartaTM
revenues in Q2 2018
61 cancer centers authorized as of June 30,
2018 with access to approximately 80% of
eligible patients
New 117,000 sq ft manufacturing facility leased
in the Netherlands to support European
distribution
Entered a new Cooperative Research and
Development Agreement with the National
Cancer Institute to develop cell therapies
targeting patient specific tumor neoantigens
12

CryoStork℠ for Reproductive Medicine
New: CryoStork℠ Insurance Providing Expectant Parents with Peace of Mind
Multi-tiered insurance solution to be offered through Cryoport’s
network of ~400 fertility clinics
13
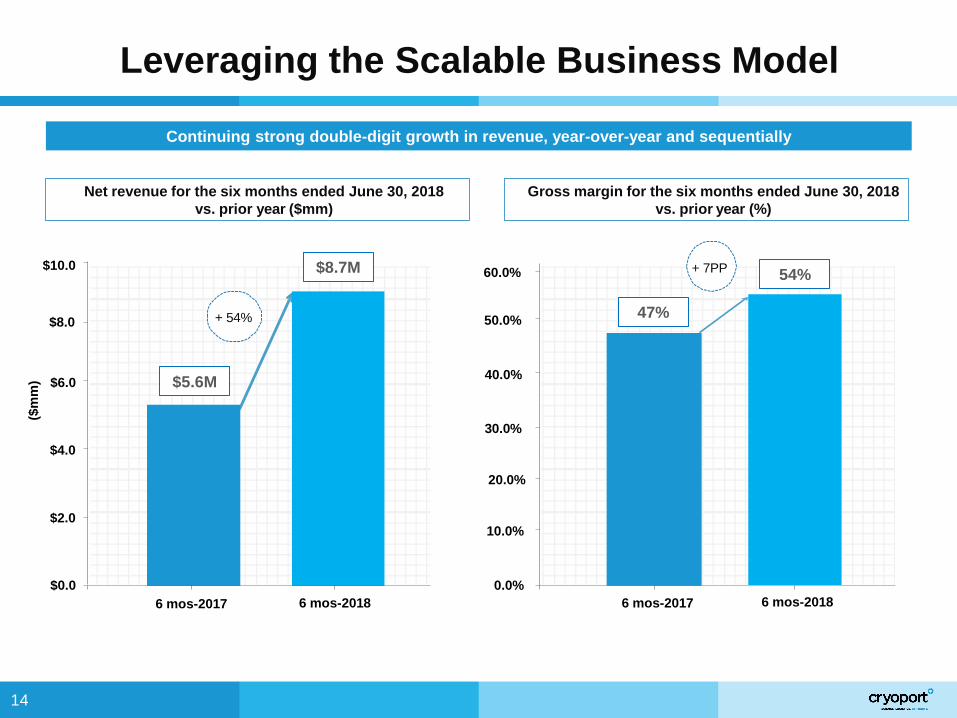
Leveraging the Scalable Business Model
Net revenue for the six months ended June 30, 2018
vs. prior year ($mm)
Gross margin for the six months ended June 30, 2018
vs. prior year (%)
Continuing strong double-digit growth in revenue, year-over-year and sequentially
+ 54%
54.3%
0.0%
10.0%
20.0%
30.0%
40.0%
50.0%
6 mos-2017 6 mos-2018
$0.0
$2.0
$4.0
$6.0
$8.0
$10.0
6 mos-2017 6 mos-2018
($m
m)
60.0% + 7PP
14
$5.6M
54% $8.7M
47%

Quarterly Revenue Trends
$4.6M
$2.9M
$3.3M
$4.0M
Q2-2018 over Q2-2017 growth: 58.6%
Sequential growth: 15.0%
$3.0M
Continued quarterly revenue growth fueled by revenue expansion from existing clients
and new client acquisitions
15

Q2-2018 over Q2-2017 growth:
+72.6%
+17.2%
+6.5%
Quarterly Revenue Trends (cont’d)
Biopharma growth continues to be driven by ramp in clinical trials supported and commencement of revenue
from the support of commercials therapy launches
16

Financial Summary
17
Statements of Operations Data:
(in thousands) 2015 2016 2017 Q2-2017 Q2-2018 QoQ growth %
Net Revenues $ 5,525 $ 7,679 $ 11,954 $ 2,917 $ 4,627 58.6%
Biopharma 3,364 5,302 9,113 2,229 3,849 72.6%
Animal Health 869 845 1,135 262 279 6.5%
Reprodcutive Medicine 1,292 1,532 1,707 426 500 17.2%
Cost of revenues 3,847 4,577 5,988 1,524 2,123
Gross margin (loss) 1,679 3,101 5,966 1,393 2,504 79.7%
Loss from operations (7,810) (8,766) (7,893) (1,864) (2,465)
Adjusted EBITDA (5,339) (5,281) (3,666) (890) (821)
Net loss $ (16,222) $ (13,188) $ (7,899) $ (1,861) $ (2,470)
Net loss per share - basic and diluted $ (2.72) $ (0.93) $ (0.93) $ (0.08) $ (0.09)
Balance sheet data:
(in thousands) 30-Jun-18
Cash and cash equivalents $ 20,011
Working capital 21,116
Total assets 27,738
Long term obligations, less current portion 184
Total stockholders' equity 24,422

NASDAQ: CYRX 18
0
2
4
6
8
10
12
14
16
6/13/17 7/13/17 8/13/17 9/13/17 10/13/17 11/13/17 12/13/17 1/13/18 2/13/18 3/13/18 4/13/18 5/13/18 6/13/18
SharePrice ($)
Cryoport added to the Russell 2000 and Russell 3000 Indexes on June 25th
Russell US Indexes widely used by investment managers and institutional investors as
the building blocks of a broad range of financial products, such as index tracking funds,
derivatives and Exchange Traded Funds (ETFs), as well as being performance
benchmarks.
Approximately $9 trillion in assets under management (AUM) are benchmarked to or
invested in products based on the Russell US Indexes, 18% of which is to the Russell
2000® alone.
Inclusion in the Indexes increases Cryoport’s exposure among investors, provides
additional liquidity for the stock and is expected to broaden its shareholder base.
Added to Russell 2000® Index and Russell 3000® Index

Conclusion
19
Large & Rapidly
Developing Market for
Temperature Controlled
Logistics for the Life
Sciences
Established Brand with
Full Cryogenic Logistics
Solutions Suite
Strategically Positioned
with Leading Clients in
the Life Sciences Market
Key Partnerships with
Global Transportation
Operators
Diversified, Growing,
Sticky Client Base
Impressive Revenue
Growth
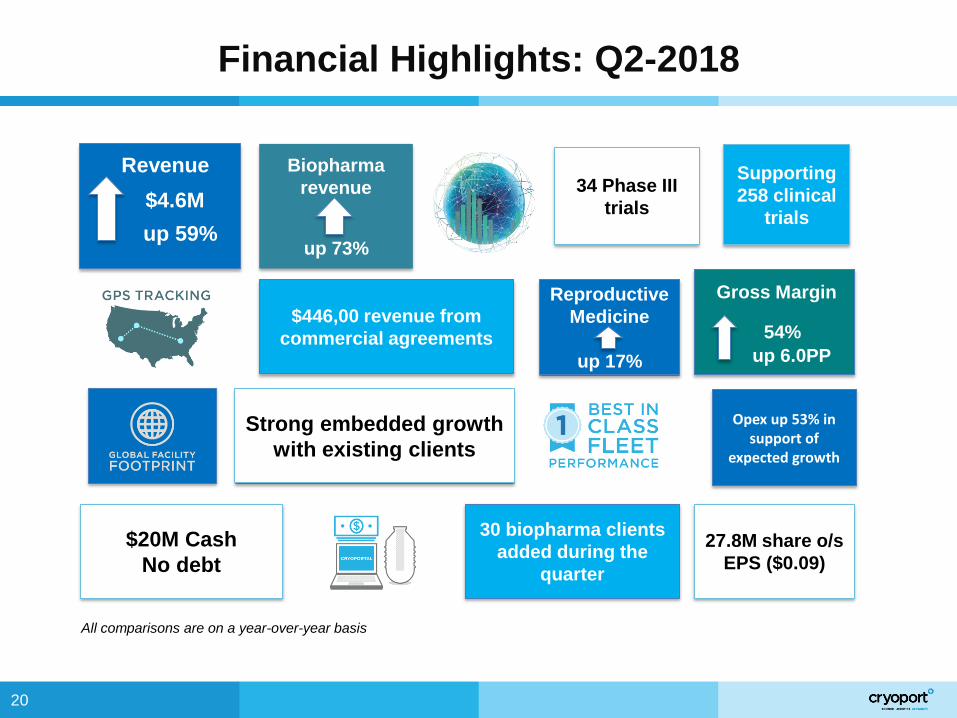
Financial Highlights: Q2-2018
$20M Cash
No debt
30 biopharma clients
added during the
quarter
Gross Margin
54%
up 6.0PP
Revenue
$4.6M
up 59%
Opex up 53% in support of
expected growth
$446,00 revenue from
commercial agreements
Strong embedded growth
with existing clients
Supporting
258 clinical
trials
Biopharma
revenue
up 73%
27.8M share o/s
EPS ($0.09)
Reproductive
Medicine
up 17%
34 Phase III
trials
All comparisons are on a year-over-year basis
20