truss. A previous TxDOT study, Project 0-1395 Field … · Trapezoidal steel box girder systems are...
216
torsional stiffuess of a closed box section is often more than I 000 times larger than that of a comparable J-shaped section. Based upon these advantages, box girders have gained popularity in curved bridge applications. Although there are significant structural advantages in the completed box girder bridge, during construction box girders require a number of bracing system to improve their torsional stiffuess and maintain stability. Typical bracing systems for steel box girders include internal and external cross-frames and also a top flange lateral truss. A previous TxDOT study, Project 0-1395 Field and Computational Studies of Steel Trapezoidal Box Girders, resulted in design expression for the bracing systems. Helwig and Fan (2000) presented design expressions to predict the forces in the top lateral truss and internal K-frames. However, the effects of external intermediate cross-frames and support skew were not considered in the development of the bracing design expressions in this previous study. The purpose of this investigation is to improve the Wlderstanding of trapezoidal box girders with skewed supports. The impact of external K-frames on the behavior of the internal K-frames and top lateral truss was also studied. Modifications to the design equations for box girder bracing are recommended in this report, as well as a design methodology for the external K-frames. Methods of analysis are also discussed and simplified methods are presented for girders with skewed supports. 17. Key Words 18. Distribution Statement trapezoidal box girders, curved girders, bracing, skewed No restrictions. This document is available to the public through supports, cross-frames, diaphragms, steel bridge the National Technical Infonnation Service, Springfield, Virginia 22161. 19. Security Classif. (of report) 20. Security Classif. (of this page) 21. No. of pages 22. Price Unclassified Unclassified 218 Form DOT F 1700.7 (8-72) Reproduction of completed page authorized
Transcript of truss. A previous TxDOT study, Project 0-1395 Field … · Trapezoidal steel box girder systems are...

Technical Report Documentation Page
I. Report No. 12. Government Accession No. 3. Recipient's Catalog No. 0-4148-1
4. Title and Subtitle 5. Report Date
Behavior of Trapezoidal Box Girders with Skewed Supports May 2004
7. Author(s) 6. Performing Organization Code
Todd A. Helwig, Reagan S. Herman, and Dawei Li 8. Performing Organization Report No.
Research Report 0-4148-1
9. Performing Organization Name and Address 10. Work Unit No. (TRAIS)
University of Houston 4800 Calhoun, Engineering. Bldg. I, Rm. Nl07 11. Contract or Grant No.
Houston, Texas 77204-4003 Research Study 0-4148
12. Sponsoring Agency Name and Address 13. Type of Report and Period Covered
Texas Department of Transportation Final (9/2000-8/2003) Research and Technology Transfer Section/Construction Division 14. Sponsoring Agency Code P.O. Box 5080 Austin, TX 78763-5080
15. Supplementary Notes
Project conducted in cooperation with the U.S. Department of Transportation, Federal Highway Administration, and the Texas Department of Transportation. Research Study Title: Field Monitoring of Trapezoidal Box Girders with Skewed Supports
16. Abstract
Trapezoidal steel box girder systems are frequently used in Texas for the construction of highway interchanges and elevated expressways in urban areas. There are a number of aspects of box girder bridges, including both aesthetic and structural advantages, which make them an attractive alternative compared to other bridge types. The smooth shape of the box leads to good aesthetics, as well as providing maintenance advantages since there are fewer places where debris can accumulate. In addition to good aesthetic and serviceability properties, box girders also have structural advantages, particularly with respect to the torsional performance of the girders. The torsional stiffuess of a closed box section is often more than I 000 times larger than that of a comparable J-shaped section. Based upon these advantages, box girders have gained popularity in curved bridge applications.
Although there are significant structural advantages in the completed box girder bridge, during construction box girders require a number of bracing system to improve their torsional stiffuess and maintain stability. Typical bracing systems for steel box girders include internal and external cross-frames and also a top flange lateral truss. A previous TxDOT study, Project 0-1395 Field and Computational Studies of Steel Trapezoidal Box Girders, resulted in design expression for the bracing systems. Helwig and Fan (2000) presented design expressions to predict the forces in the top lateral truss and internal K-frames. However, the effects of external intermediate cross-frames and support skew were not considered in the development of the bracing design expressions in this previous study.
The purpose of this investigation is to improve the Wlderstanding of trapezoidal box girders with skewed supports. The impact of external K-frames on the behavior of the internal K-frames and top lateral truss was also studied. Modifications to the design equations for box girder bracing are recommended in this report, as well as a design methodology for the external K-frames. Methods of analysis are also discussed and simplified methods are presented for girders with skewed supports.
17. Key Words 18. Distribution Statement trapezoidal box girders, curved girders, bracing, skewed No restrictions. This document is available to the public through supports, cross-frames, diaphragms, steel bridge the National Technical Infonnation Service, Springfield, Virginia
22161. 19. Security Classif. (of report) 20. Security Classif. (of this page) 21. No. of pages 22. Price Unclassified Unclassified 218
Form DOT F 1700.7 (8-72) Reproduction of completed page authorized

BEHAVIOR OF TRAPEZOIDAL BOX GIRDERS WITH SKEWED SUPPORTS
by
Todd A. Helwig, Reagan S. Herman, and Dawei Li
Research Report Number 0-4148-1
Research Project 0-4148
FIELD MONITORING OF TRAPEZOIDAL BOX GIRDERS WITH SKEWED SUPPORTS
Conducted for the
Texas Department of Transportation
in cooperation with the
U.S. Department of Transportation
Federal Highway Administration
by the
UNIVERSITY OF HOUSTON
May 2004

Research performed in cooperation with the Texas Department of Transportation and the Federal Highway Administration.
ACKNOWLEDGMENTS
The authors greatly appreciate the financial support from the Texas Department of Transportation that made this project possible. The authors would like to extend special thanks to the program coordinator, J.C. Liu, and the project director, Jon Holt, for their cooperation and recommendations during this research study. In addition the authors would like to thank several other TxDOT engineers that provided feedback during this project, including Tim Chase, Tom Fan, Kenny Ozuna, and John Vogel.
DISCLAIMERS
The contents of this report reflect the views of the authors, who are responsible for the facts and the accuracy of the data presented herein. The contents do not necessarily reflect the official view or policies of the Federal Highway Administration (FHW A) or the Texas Department of Transportation (TxDOT). This report does not constitute a standard, specification, or regulation.
THIS REPORT IS NOT INTENDED FOR CONSTRUCTION, BIDDING, OR PERMIT PURPOSES.
The Unites States Government and the State of Texas do not endorse products or manufacturers. Trade or manufacturers' names appear herein solely because they are considered essential to the object of this report.
Research Supervisors
Todd A. Helwig, Ph.D. Reagan S. Herman, Ph.D.
II
SUMMARY
Trapezoidal steel box girder systems are frequently used in Texas for the construction of highway interchanges and elevated expressways in urban areas. There are a number of aspects of box girder bridges, including both aesthetic and structural advantages, which make them an attractive alternative compared to other bridge types. The smooth shape of the box leads to good aesthetics, as well as providing maintenance advantages since there are fewer places where debris can accumulate. In addition to good aesthetic and serviceability properties, box girders also have structural advantages, particularly with respect to the torsional performance of the girders. The torsional stiffness of a closed box section is often more than 1000 times larger than that of a comparable !-shaped section. Based upon these advantages, box girders have gained popularity in curved bridge applications.
Although there are significant structural advantages in the completed box girder bridge, during construction box girders require a number of bracing system to improve their torsional stiffness and maintain stability. Typical bracing systems for steel box girders include internal and external cross-frames and also a top flange lateral truss. A previous TxDOT study, Project 0-1395 Field and Computational Studies of Steel Trapezoidal Box Girders, resulted in design expressions for the bracing systems. Helwig and Fan (2000) presented design expressions to predict the forces in the top lateral truss and internal Kframes. However, the effects of external intermediate cross-frames and support skew were not considered in the development of the bracing design expressions in this previous study.
The purpose of this investigation was to improve the understanding of trapezoidal box girders with skewed supports. The impact of external K-frames on the behavior of the internal K-frames and top lateral truss was also studied. Modifications to the design equations for box girder bracing are recommended in this report, as well as a design methodology for the external K-frames. Methods of analysis are also discussed and simplified methods are presented for girders with skewed supports.
Note to Designers
Although the entire report contains important information regarding the behavior of steel trapezoidal box girder bridges, bridge designers should pay particular attention to Chapters 1, 2, 7, and 8. The material presented in Chapter 6 will also be of interest to designers since this chapter summarizes the results of the parametric studies. Although Chapter 6 is relatively lengthy, there is a large amount of information on the general behavior of steel box girders presented in the chapter which should prove valuable to designers.
l11

!!!!!!!!!!!!!!!!!!!"#$%!&'()!*)&+',)%!'-!$-.)-.$/-'++0!1+'-2!&'()!$-!.#)!/*$($-'+3!
44!5"6!7$1*'*0!8$($.$9'.$/-!")':!

Table of Contents
Chapter 1 Introduction ........................................................................................................ 1 1.1 Research Overview ...................................................................................... 1 1.2 Skewed Supports .......................................................................................... 3 1.3 Bracing Systems ........................................................................................... 4
1.3.1 Top Lateral Truss System ................................................................... 5 1.3.2 Internal K-Frames ............................................................................... 6 1.3.3 External K-Frames .............................................................................. 7
1.4 Research Objectives and Report Outline ..................................................... 8
Chapter 2 Background ...................................................................................................... 11 2.1 Introduction ................................................................................................ 11 2.2 Basic Mechanics of Box Girders ............................................................... 12
2.2.1 Bending ............................................................................................. 12 2.2.2 Torsion .............................................................................................. 12
2.3 Distortion ................................................................................................... 13 2.4 Effects of Box Girder Bending on Forces in Top Truss ............................ 15 2.5 Total Force in Top Lateral Truss System .................................................. 16
Chapter 3 Finite Element Model of Twin Trapezoidal Box Girders ................................ 19 3.1 Introduction ................................................................................................ 19 3.2 Elements Used in the FEA Models ............................................................ l9 3.3 Modeling Details for the Field and Parametric Studies ............................. 23 3.4 FEA Boundary Conditions ......................................................................... 24
Chapter 4 Field Studies ..................................................................................................... 27 4.1 Introduction ................................................................................................ 27 4.2 Bridge Geometry ........................................................................................ 28
4.2.1 Layout ............................................................................................... 28 4.2.2 Bracing Systems ................................................................................ 31
4.3 Instrumentation .......................................................................................... 35 4.4 Strain Gage Application ............................................................................ .41 4.5 Protection System ...................................................................................... 42 4.6 Data Acquisition ........................................................................................ 44
4.6.1 Calibration of Data Acquisition System .......................................... .47
Chapter 5 Comparison of Field Measurements with Finite Element Model ................... .49 5.1 Introduction ................................................................................................ 49
v

5.2 Girder Erection ........................................................................................... 49 5.2.1 Erection Sequence ............................................................................. 49 5.2.2 First Lift ............................................................................................ 51 5.2.3 Second Li:ft ........................................................................................ 55
5.3 Concrete Slab Construction ................................................. , ..................... 59 5.4 Live Load Test ........................................................................................... 73
5.4.1 Introduction .................................................................................... 73 5.4.2 First Live Load Test ....................................................................... 76 5.4.3 Second Live Load Test .................................................................. 85 5.4.4 Effect of External K-Frame on Girder Flange Stresses ................. 86 5.4.5 Effect ofExternal K-Frame on Internal K-Frames ........................ 87
Chapter 6 Parametrical Studies on Box Girders ............................................................... 89 6.1 Introduction ................................................................................................ 89
6.1.1 Distortional and Bending/Torsion Component of Internal K-Frame Strut Forces ............................................................................ 91
6.2 Depth of Solid Diaphragm at End Supports .............................................. 92 6.2.1 Top Lateral Truss System ................................................................. 94 6.2.2 Internal K-Frames ............................................................................. 95 6.2.3 External K-Frames ............................................................................ 97 6.2.4 Stresses in Girder Flanges and Girder Deflections ........................... 99
6.3 Diaphragm Connection Details ................................................................ ! 00 6.4 Top Lateral Truss System Panel Lengths ................................................ ! 02 6.5 Top Lateral Truss System Layout.. .......................................................... I 03 6.6 Internal K-Frame Spacing ........................................................................ 107
6.6.1 Effect of Top Truss Panel Geometry Internal Cross-Frames at Every Panel No External Cross-Frames ...................................... 1 07
6.6.2 Layouts Alternating Internal K-Frame and Top Strut Only Braces .............................................................................................. ItO
6.7 External K-Frames Impact on Systems with Parallel Top Lateral Truss Layout and Internal K-Frames Every Other Panel (P2) ................. 115 6. 7.1 Girder Deformation ......................................................................... 116 6.7.2 Diagonals ofTop Lateral Truss System ......................................... .120 6.7.3 Internal K-Frames and Top Struts .................................................. .122
6.8 Bracing Design Equations Developed in Project 0-1395 for P2 Systems 126 6.9 Alternate Truss Layouts ........................................................................... 128 6.10 Parallel Top Lateral Truss Layout with Internal K-Frames Every
Panel (P 1 ) ................................................................................................. 130 6.11 Mirror Layout with Internal K -Frames Every Other Panel (M2) ............ 134 6.12 Summary ofPl, P2, and M2 Layouts ...................................................... 137 6.13 Use of Results from Parametric Studies .................................................. 138
VI

Chapter 7 Analysis of Curved Steel Trapezoidal Box Girders ....................................... 139 7.1 Introduction .............................................................................................. 139 7.2 Proposed Analysis I Design Methodology for External Intermediate
K-Frames .................................................................................................. 139 7.3 Equivalent Plate Method .......................................................................... 141 7.4 Torsional Constants for Box Girders ....................................................... 142 7.5 Approaches to Determine Distribution ofTorsional Moments .............. .144
7.5.1 Grid Analyses of Systems with Radial Supports ............................ 146 7.5.2 Grid Analyses of Systems with a Skewed Support ........................ .147 7.5.3 Simplified Grid Analysis of Curved Girders with Skewed
Supports .......................................................................................... 149 7.6 Moment and Torque for Continuous Girders .......................................... .! 53
Chapter 8 Summary and Conclusions ............................................................................. 159 8.1 Project Overview ..................................................................................... 159 8.2 Recommendations for Design of Box Girder Systems ............................ 160
8.2.1 Determination ofTorques for Girder Design: ............................... .160 8.2.2 Equivalent Plate Method ................................................................. 160 8 .2.3 Elevation of Top Lateral Truss ....................................................... 160 8.2.4lnternal K-Frames Layout ............................................................... 161 8.2.5 Top Lateral Truss Layouts .............................................................. 161 8.2.6 Serviceability Role of External Cross-Frames ................................ 162 8.2.7 Partial Depth End Diaphragms ....................................................... 162 8.2.8 Connectivity of External Solid Diaphragm Flanges ....................... 163
8.3 Design Equations for Top Lateral Truss and Internal K-Frames ............ .l63
Appendix A Axial Force Derivation ............................................................................... 167 A.l Introduction .............................................................................................. 167 A.2 Regression Method .................................................................................. 167
Appendix B Layout ofBracing in the Parametric Analyses .......................................... .l69 Appendix C Supplementary Results of Parametric Analyses ......................................... l72
C. I Layout of Top Lateral Truss .................................................................... 172 C.2 Brace Force Vs # ofExt-K: (Span Length: 160 Feet Parallel) ................ 172 C.3 Brace Force Vs Internal K-Frame's Spacing: (Span Length: 160 Feet
Parallel) .................................................................................................... 175 C.4 Brace Force vs. Skew Angle (Span Length 160 feet, Parallel
Layout) ..................................................................................................... 180 C.5 Brace Force Vs # ofExt-K: (Span Length: 160 Feet Mirror) ................. .l84 C.6 Brace Forces vs. # OfExternal K's for Short Span and Skewed Box
Girders ...................................................................................................... 187 C.6.1 Radius= 600ft., Length= 120ft., Parallel ................................. 187 C.6.2 Radius= 600ft., Length= 120ft., Mirror .................................. .188
vii

C.7 Brace Forces vs. # OfExt-K for Long Span and Skewed Box Girders (Radius = 1200 ft., Length = 240 ft., Parallel) ......................................... 190
Appendix D Torque Derivation ...................................................................................... 193 D.l Geometry and loading .............................................................................. 193 D.2 MIR method ............................................................................................. 193 D.3 Accurate method ...................................................................................... 194
References ........................................................................................................................ 197
viii

Figure 1.1 Figure 1.2 Figure 1.3 Figure 1.4 Figure 1.5 Figure 1.6
Figure 2.1 Figure 2.2
Figure 3.1 Figure 3.2 Figure 3.3 Figure 3.4 Figure 3.5
Figure 4.1 Figure 4.2 Figure 4.3 Figure 4.4 Figure 4.5 Figure 4.6 Figure 4.7 Figure 4.8 Figure 4.9 Figure 4.10 Figure 4.11 Figure 4.12 Figure 4.13 Figure 4.14 Figure 4.15 Figure 4.16 Figure 4.17 Figure 4.18 Figure 4.19 Figure 4.20 Figure 4.21 Figure 4.22
List of Figures
Trapezoidal Box Girder Bridge ...................................................................... 1 Skew Angle in Curved Box Girders with Skewed Supports ......................... .3 Box Girder Bridge Cross-Section .................................................................. .4 Top Lateral Truss System ............................................................................... 6 Internal K-Frame ............................................................................................. 7 External K Frame between Girders (Milligan 2002) ...................................... 8
Components of Torsional Load on Rectangular Section .............................. 14 Schematic Showing Formula Variables ........................................................ l5
SHELL93 Element Shape and Node Order .................................................. 20 BEAM4 Line Element Shape ........................................................................ 21 Three-Dimensional Finite Element Model of Skewed Twin Box Girders ... 22 Composite Section of Box Girder Bridge .................................................... .24 Boundary Conditions of Field Study Bridge ................................................ 25
Location of the Field Studies ........................................................................ 27 Overall Bridge ............................................................................................... 28 Span Lengths ................................................................................................. 28 Skewed Support at Bent 23 ........................................................................... 29 Bridge Cross-Section .................................................................................... 29 Dapped End of Girder at Bent 23 .............................. : .................................. 30 Cross-Sectional Dimensions at Instrumented Girder Sections ..................... 30 Top Lateral Truss System ............................................................................. 31 Internal Diaphragms ...................................................................................... 32 Solid External Diaphragm ............................................................................ .32 Solid Diaphragm at Bent 23 .......................................................................... 33 Dimensions of External Solid Diaphragm .................................................... 33 Temporary External Cross-Frame ................................................................. 34 Instrumentation Plan ..................................................................................... 36 Instrumentation at Station 1 of Girder 1.. ...................................................... 36 Instrumentation at Station 2 of Girder 1.. ..................................................... .3 7 Instrumentation at Station 1 of Girder E ...................................................... .3 7 Instrumentation at Station 2 of Girder E ....................................................... 37 Instrumentation Locations on Solid Diaphragm .......................................... .38 Instrumentation Layout on Solid Diaphragm .............................................. .39 Number of Gages on Internal and External Cross-Frames .......................... .40 Strain Gage Layout for Internal K Frames .................................................. .40
lX

Figure 4.23 Figure 4.24 Figure 4.25 Figure 4.26 Figure 4.27 Figure 4.28 Figure 4.29
Figure 5.1 Figure 5.2 Figure 5.3 Figure 5.4 Figure 5.5 Figure 5.6 Figure 5.7 Figure 5.8 Figure 5.9 Figure 5.10 Figure 5.11
Figure 5.12
Figure 5.13
Figure 5.14 Figure 5.15 Figure 5.16
Figure 5.17 Figure 5.18
Figure 5.19
Figure 5.20
Figure 5.21 Figure 5.22
Figure 5.23
Figure 5.24 Figure 5.25
Figure 5.26
Strain Gage Layout for External K Frame .................................................... 41 Instrumented External K-Frame ................................................................... 41 Strain Gage Application Procedure .............................................................. 42 Moisture and Light Abrasion Protection System ......................................... .43 Strain Gage Protection Systems ................................................................... .44 Data Acquisition System Operation ............................................................. .45 Wireless Data Acquisition System ............................................................... .46
Erection Sequence ......................................................................................... 50 Stress Development in Flanges during First Lift at Girder I Station 1 ......... 52 Field Data and FEA Results for Girder I at Release ..................................... 53 Field Data and FEA Results for Girder Eat Release .................................... 54 Stress Development in Flanges during Second Lift at Girder I Station 2 ..... 56 Field Data and FEA Results for Girder I in the Second Lift ........................ 57 Field Data and FEA Results for Girder E in the Second Lift ....................... 58 Stress Development in the Solid Diaphragm during the Second Lift ........... 59 Concrete Casting Sequence ........................................................................... 60 Stress Development in Flanges during Cast Stage 1 at Girder I Station 1 ... 62 Stress Development in Diagonal during Cast Stage 1 at Girder I Station 1 ..................................................................................................................... 62 Field Data and FEA Results for Flanges and Top Lateral Truss of Girder I during Cast 1A ............................................................................................ 64 Field Data and FEA Results for Flanges and Top Lateral Truss of Girder E during Cast IA ........................................................................................... 64 Stress Development of the Outside Strut ofK-I for Stage 1.. ....................... 65 Stress Development of the Inside Diagonal ofK-I for Stage 1 .................... 65 Comparison of Field Data and FEA Results for Internal K-Frames during Concrete Cast 1A ............................................................................... 66 Stress Development of the Top Chord of the External-K for Stage 1 .......... 67 Stress Development of the Interior Diagonal of the External-K for Stage 1 ..................................................................................................................... 67 Stress Development of the Exterior Bottom Chord of the Extemal-K for Stage 1 ........................................................................................................... 68 Comparison of Field Data and FEA Results for External K-Frame during the Concrete Cast I A .................................................................................... 69 Deformation of Bridge Section Due to Construction Facility Load ............. 70 Stress Development in Solid Diaphragm during Cast Stage 1 (Uniaxial Gages on Interior Girder Side) ...................................................................... 71 Stress Development in Solid Diaphragm during Cast Stage 1 (Uniaxial Gages on Exterior Girder Side) ..................................................................... 71 Stresses in Solid Diaphragm during Deck Cast Stage I ............................... 72 Flange Stresses for Girder I during Second Concrete Cast (FEA Models with and without Concrete Deck Stiffness) .................................................. 73 Diaphragm Cut in the Instrumented Span ..................................................... 74
X

Figure 5.27 Truck Formations for Live Load Tests ......................................................... 75 Figure 5.28 Truck Dimensions ......................................................................................... 76 Figure 5.29 Bottom Flange Stress during Phase 1 Live Load Test 1 at Station I-1 ......... 78 Figure 5.30 Bottom Flange Stress during Phase 1 Live Load Test 1 at Station I-2 ......... 78 Figure 5.31 Bottom Flange Stress during Phase 1 Live Load Test 1 at Station E-1 ........ 79 Figure 5.32 Bottom Flange Stress during Phase 1 Live Load Test 1 at Station E-2 ........ 80 Figure 5.33 Stress in Inside Strut ofK-I during Phase 1 Test 1 ....................................... 81 Figure 5.34 Stress In Outside Strut ofK-I during Phase 1 Test 1 .................................... 81 Figure 5.35 Stress in Inside Diagonal ofK-I during Phase 1 Test I ................................ 82 Figure 5.36 Stress In Outside Diagonal ofK-I during Phase 1 Test 1 ............................. 82 Figure 5.37 Stress in Top Strut of External K-Frame during Phase 1 Test 1 ................... 83 Figure 5.38 Stress in Inside Diagonal of External K-Frame during Phase 1 Test I ........ 83 Figure 5.39 Stress In Outside Diagonal of External K-Frame during Phase 1 Test 1.. .... 84 Figure 5.40 Stress in Inside Bottom Strut ofExternal K-Frame during Phase 1 Test 1 .. 84 Figure 5.4I Stress in Outside Bottom Strut ofExternal K-Frame during Phase I Test
1 ..................................................................................................................... 85 Figure 5.42 Bottom Flange Stress in Phase 1 Test 2 and Phase 2 Test 2 ......................... 87 Figure 5.43 Stresses in Exterior Diagonal ofinternal K-Frame of Girder I in Test 3 ..... 88
Figure 6.1 Figure 6.2 Figure 6.3 Figure 6.4 Figure 6.5 Figure 6.6 Figure 6.7 Figure 6.8 Figure 6.9 Figure 6.IO
Figure 6.11 Figure 6.12 Figure 6.13 Figure 6.14 Figure 6.15 Figure 6.16 Figure 6.17 Figure 6.18
Figure 6.19 Figure 6.20 Figure 6.21
Top Lateral Truss Layout in Parametric Study ............................................. 90 Section Properties Used in Parametric Study FEA Models .......................... 90 Location of Two and Three External K-Frames in Parametric Study .......... 90 Example Strut Forces in Internal K-Frames ................................................. 91 Top Strut Resultant Forces ............................................................................ 92 Partial Depth Diaphragm used in Instrumented Bridge ................................ 93 Model of Partial Depth Solid Diaphragm used in FEA ................................ 93 Top Diagonal Forces in Girder I (Partial and Full Depth Diaphragms) ....... 95 Top Diagonal Forces in Girder E (Partial and Full Depth Diaphragms) ...... 95 Top Strut Force in the Internal K-Frames of Girder E Due to Bending and Torsion ofGirder .................................................................................... 96 Top Strut Force in the Internal K-Frames of Girder E Due to Distortion ..... 96 Diagonal Forces in the Internal K-Frames of Girder E ................................. 97 Twist Along Girder Length for Partial and Full Depth Solid Diaphragms ... 98 Member Forces Developed in the External K-Frame ................................... 98 Stresses in the Exterior Top Flange of Girder I ............................................ 99 Displacements at Mid-Span of Girder I ...................................................... 1 00 Non-Continuous Flanges for Connection Details ofPlate Diaphragms .... .lOl Axial Forces of Top Lateral Diagonals in Girder I with Both Continuous and Discontinuous Flanges on Solid Diaphragm ....................................... .1 02 Definition of Top Lateral Diagonal Angle u ............................................. .l02 Top Lateral Truss Layouts ......................................................................... .! 05 Parallel Layout of Top Truss Diagonals of Exterior Girder Only Intersect towards External K-Frame ........................................................... 1 06
Xl
Figure 6.22 Mirror Layout of Top Truss Diagonals ofBoth Girders Intersect towards External K-Frame .......................................................................... 1 06
Figure 6.23 Axial Forces in Diagonals ofTop Truss System (Varying Internal K-Frame Spacing and Panel Dimension PI Truss) ..................................... 1 08
Figure 6.24 Strut Forces in Internal K-Frames Due to Bending/Torsion of Girders (K -Frames at every Panel Point - Varying Panel Length - P 1 Truss) ...... .1 09
Figure 6.25 Strut Forces in the Internal K-Frames Due to Distortion (K-Frames at every Panel Point Varying Panel Length PI Truss) ............................ .110
Figure 6.26 Diagonal Forces in the Internal K-Frames (K-Frames at every Panel Point Varying Panel Length- PI Truss) ................................................. l10
Figure 6.27 Full Internal K-Frame vs. Top Strut Only Layout ...................................... 111 Figure 6.28 Axial Forces in Diagonals ofParallel Top Lateral Truss (Varying
Internal K-Frame Spacing with Constant Panel Dimension) ...................... 112 Figure 6.29 Top Strut Forces Due to Bending and Torsion of Girder (Varying
Internal K-Frame Spacing with Constant Panel Dimension- Parallel Truss) .......................................................................................................... 113
Figure 6.30 Strut Forces in the Internal K-Frames Due to Distortion (Varying Internal K-Frame Spacing with Constant Panel Dimension -Parallel Truss) .......................................................................................................... 114
Figure 6.31 Diagonal Forces in the Internal K-Frames of Girder I (Varying Internal K-Frame Spacing with Constant Panel Dimension Parallel Truss) ......... 114
Figure 6.32 Moments Between the External K-Frame and Box Girders ...................... .116 Figure 6.33 Concrete Deck in Transverse Direction without Intermediate External K-
Frame .......................................................................................................... 117 Figure 6.34 Concrete Deck in Transverse Direction with Intermediate External K-
Frame .......................................................................................................... 117 Figure 6.35 Top Flange Positions used in Plots ofVertical Deflection ........................ .118 Figure 6.36 Vertical Displacements of Center of Top Flanges at Girder Midspan ........ 119 Figure 6.37 Vertical Displacements of Center of Top Flanges at Girder Quarter-Span 119 Figure 6.38 Resultant Axial Forces in External K-Frames with 1 and 3 External K's .. 120 Figure 6.39 Axial Forces Developed in Top Truss Diagonals (P2-Radial Support) ..... .l22 Figure 6.40 Axial Forces Developed in Top Truss Diagonals (P2-30° Skewed
Support) ....................................................................................................... 122 Figure 6.41 Top Strut Axial Forces of the Internal K-Frames (P2-Radial Supports) ... .123 Figure 6.42 Diagonal Forces of the Internal K-Frame (P2-Radial Supports) ............... .124 Figure 6.43 Top Strut Forces in the Internal K-Frame (P2-30° Skewed Support) ........ .l25 Figure 6.44 Diagonal Forces in the Internal K-Frame (P2-30° Skewed Support) ......... .125 Figure 6.45 Comparison of 1395 Equations and 3D FEA for P2 Truss System Top
Diagonal Forces (30° Skewed Support) ...................................................... 127 Figure 6.46 Comparison of 1395 Equations and 3D FEA for P2 Truss System Strut
Forces (30° Skewed Support) ...................................................................... 127 Figure 6.47 Comparison of 1395 Equations and 3D FEA for P2 Truss System K-
Frame Diagonal Forces (30° Skewed Support) ........................................... l28
xu

Figure 6.48
Figure 6.49 Figure 6.50
Figure 6.5I Figure 6.52 Figure 6.53 Figure 6.54 Figure 6.55 Figure 6.56
Figure 6.57 Figure 6.58 Figure 6.59 Figure 6.60
Figure 7.1 Figure 7.2 Figure 7.3 Figure 7.4 Figure 7.5 Figure 7.6
Figure 7.7
Figure 7.8 Figure 7.9 Figure 7.10
Figure 7.II Figure 7.12 Figure 7.13 Figure 7.I4 Figure 7.I5
Figure 8.I Figure 8.2 Figure 8.3
Layout of Top Truss Diagonals of Exterior Girder Only Intersect towards External K-Frame .......................................................................... I29 Axial Forces Developed in Top Truss Diagonals (PI-Radial Support) ..... .13I Axial Forces Developed in Top Truss Diagonals (PI-30° Skewed Support) ....................................................................................................... I3I Top Strut Axial Forces of the Internal K-Frames (PI-Radial Supports) ... .132 Diagonal Forces ofthe Internal K-Frame (PI-Radial Supports) ................ I32 Top Strut Forces in the Internal K-Frame (PI-30° Skewed Support) ......... I33 Diagonal Forces in the Internal K-Frame (Pl-30° Skewed Support) .......... 133 Axial Forces Developed in Top Truss Diagonals (M2-Radial Support) ... .134 Axial Forces Developed in Top Truss Diagonals (M2-30° Skewed Support) ....................................................................................................... I35 Top Strut Axial Forces of the Internal K-Frames (M2-Radial Supports) ... 136 Diagonal Forces ofthe Internal K-Frame (M2-Radial Supports) ............... l36 Top Strut Forces in the Internal K-Frame (M2-30° Skewed Support) ........ l37 Diagonal Forces in the Internal K-Frame (M2-30° Skewed Support) ........ I37
Forces in Cross-Frame using Member (2002) Equation and 3D FEA. ...... .l40 Definition of Variables in Equivalent Plate Thickness Formula ................ 14 2 Geometry of Box Girder used in Parametric Studies .................................. l43 MIR Method ................................................................................................ l45 Curved Box Girder with Skewed Support at One End ............................... 146 Distribution of Torque from Grid Analysis and 3D FEA Models for Girders with Radial Supports ...................................................................... 14 7 Distribution of Torque from Grid Analysis and 3D FEA Models for Girders with One Skewed Support ............................................................ .149 Definition of Variables used in Torque Modification Equations ............... .151 Comparison of Proposed Equations for Interior Girder ............................. .l52 Comparison ofProposed Equations for Exterior Girder with Full 3D FEA and Radial Grid Analysis Results ....................................................... I 53 Box Girder System Properties used in Three Span Model ......................... l54 Bending Moment Diagrams for Three Span Box Girder System ............... I54 Torque Diagrams for Three Span Box Girder System ................................ I 55 Variation in Forces in Top Diagonals with End Support Skew .................. I 56 Change in Top Diagonal Forces due to Skew at End Support ................... .! 56
Parallel Top Lateral Truss Layout .............................................................. 162 Mirror Top Lateral Truss Layout.. .............................................................. I62 Top Lateral Truss Layouts .......................................................................... 164
Figure C.l Layout of Top Lateral Truss ...................................................................... .172 Figure C.2 Diagonal Force vs. # ofExt-K ( R=600 ft., 0 deg. Skew, Int-K Spacing
Every 2 Panels) ........................................................................................... 172
xiii
Figure C.3 Diagonal Force vs. # ofExt-K ( R=600 ft., 30 deg. Skew, Int-K Spacing Every 2 Panels) ........................................................................................... 173
Figure C.4 Strut Force vs. # ofExt-K ( R=600 ft., 0 deg. Skew, Int-K Every 2 Panels) ......................................................................................................... 173
Figure C.5 Diagonal Force vs. # ofExt-K ( R=600 ft., 30 deg. Skew, Int-K Spacing Every 2 Panels) ........................................................................................... 174
Figure C.6 Int-K Diagonal Force vs. # ofExt-K ( R=600 ft., 0 deg. Skew, Int-K Spacing Every 2 Panels) ............................................................................. 174
Figure C.7 Int-K Diagonal Force vs. # ofExt-K ( R=600 ft., 30 deg. Skew, Int-K Spacing Every 2 Panels) ............................................................................. 175
Figure C.8 Strut Force vs. Int-K Spacing ( R=600 ft., 0 deg. Skew, No Ext-K) .......... 175 Figure C.9 Strut Force vs. Int-K Spacing ( R=600 ft., 10 deg. Skew, No Ext-K) ........ 176 Figure C.1 0 Strut Force vs. Int-K Spacing ( R=600 ft., 20 deg. Skew, No Ext-K) ........ 176 Figure C.l1 Strut Force vs. Int-K Spacing ( R=600 ft., 30 deg. Skew, No Ext-K) ........ 177 Figure C.l2 Strut Force vs. Int-K Spacing ( R=1200 ft., 0 deg. Skew, No Ext-K) ....... .177 Figure C.13 Strut Force vs. Int-K Spacing ( 200ft., 10 deg. Skew, No Ext-K) ...... 178 Figure C.l4 Strut Force vs. Int-K Spacing ( R=1200 ft., 20 deg. Skew, No Ext-K) ..... .178 Figure C.15 Strut Force vs. Int-K Spacing ( R= 1200 ft., 30 deg. Skew, No Ext-K) ...... 179 Figure C.l6 Strut Force vs. Skew Angle ( R=600 ft., Int-K Every Panel, No Ext-K) ... .l80 Figure C.17 Strut Force vs. Skew Angle ( R=600 ft., Int-K Every Panel, 1 Ext-K) ...... 180 Figure C.18 Strut Force vs. Skew Angle ( R=600 ft., Int-K Every Panel, 2 Ext-K) ..... .181 Figure C.l9 Strut Force vs. Skew Angle ( R=600 ft., Int-K Every Panel, 3 Ext-K) ...... 181 Figure C.20 Strut Force vs. Skew Angle ( R=600 ft., Int-K Every 2 Panels, No Ext-
K) ................................................................................................................ 182 Figure C.21 Strut Force vs. Skew Angle ( R=600 ft., Int-K Every 2 Panels, 1 Ext-K) . .l82 Figure C.22 Strut Force vs. Skew Angle ( R=600 ft., Int-K Every 2 Panels, 2 Ext-K) .. l83 Figure C.23 Strut Force vs. Skew Angle ( R=600 ft., Int-K Every 2 Panels, 3Ext-K) ... 183 Figure C.24 Top Lateral Truss Force vs. # ofExt-K ( R=600 ft., 0 deg. Skew, Int-K
Spacing Every 2 Panels) ............................................................................. 184 Figure C.25 Top Lateral Truss Force vs. # ofExt-K ( R=600 ft., 30 deg. Skew, Int-K
Spacing Every 2 Panels) ............................................................................. 184 Figure C.26 Strut Force vs. # ofExt-K ( R=600 ft., 0 deg. Skew, Int-K Every 2
Panels) ......................................................................................................... 185 Figure C.27 Strut Force vs. # ofExt-K ( R=600 ft., 30 deg. Skew, Int-K Spacing
Every 2 Panels) ........................................................................................... 185 Figure C.28 Int-K Diagonal Force vs. # of Ext-K ( R=600 ft., 0 deg. Skew, Int-K
Spacing Every 2 Panels) ............................................................................. 186 Figure C.29 lnt-K Diagonal Force vs. # ofExt-K ( R=600 ft, 30 deg. Skew, Int-K
Spacing Every 2 Panels) ............................................................................. 186 Figure C.30 Top Lateral Truss Force vs. # ofExt-K ( R=600 ft, 15 deg. Skew, Int-K
Spacing Every 2 Panels) ............................................................................. 187 Figure C.31 Strut Force vs. # ofExt-K ( R=600 ft, 15 deg. Skew, Int-K Spacing
Every 2 Panels) ........................................................................................... 187
XIV

Figure C.32 Int-K Diagonal Force vs. # ofExt-K ( R=600 ft, 15 deg. Skew, Int-K Spacing Every 2 Panels) ............................................................................. 188
Figure C.33 Top Lateral Truss Force vs. # ofExt-K ( R=600 ft, 15 deg. Skew, Int-K Spacing Every 2 Panels) ............................................................................ .188
Figure C.34 Strut Force vs. # ofExt-K ( R=600 ft, 15 deg. Skew, Int-K Spacing Every 2 Panels) ........................................................................................... 189
Figure C.35 Int-K Diagonal Force vs. # ofExt-K ( R=600 ft, 15 deg. Skew, Int-K Spacing Every 2 Panels) ............................................................................. 189
Figure C.36 Top Lateral Truss Force vs. # ofExt-K ( R=1200 ft, 30 deg. Skew, Int-K Spacing Every 2 Panels) ............................................................................. 190
Figure C.37 Strut Force vs. # ofExt-K ( R=1200 ft, 30 deg. Skew, Int-K Spacing Every 2 Panels) ........................................................................................... 190
Figure C.38 Int-K Diagonal Force vs. # ofExt-K ( R=1200 ft, 30 deg. Skew, Int-K Spacing Every 2 Panels) ............................................................................. 191
Figure D.l Curved Twin Girders .................................................................................. 192
XV

!!!!!!!!!!!!!!!!!!!"#$%!&'()!*)&+',)%!'-!$-.)-.$/-'++0!1+'-2!&'()!$-!.#)!/*$($-'+3!
44!5"6!7$1*'*0!8$($.$9'.$/-!")':!

Table 4.1
Table 5.1 Table 5.2 Table 5.3 Table 5.4
Table 6.1 Table 6.2
Table 6.3
Table 7.1 Table 7.2
Table 8.1
Table 8.2
List of Tables
External Cross-Frame Properties ................................................................. .35
Girder Lifts .............. , ..................................................................................... 50 Concrete Casting Schedule ........................................................................... 61 Weight of Trucks in Live Load Test Phase 1 (lbs) ....................................... 77 Axle and Total Weight of Trucks in Second Phase of Live Load Tests (lbs) ............................................................................................................... 86
Parametric FEA Scheme ............................................................................... 90 Amplification Factors to 1395 Equations for Systems with Radial Supports (With or Without External Cross-Frames) or Skewed Supports (Without External Cross-Frames) ............................................................... 138 Amplification Factors to 1395 Equations for Systems with Skewed Supports With External Cross-Frames CNEK =Number ofExternal K's) .. 138
Torsional Constants for Box Girder used in Parametric Studies ................ 144 FEA Parametric Study Scheme for Grid Systems ..................................... .150
Amplification Factors to 1395 Equations for Systems with Radial Supports (With or Without External Cross-Frames) and Skewed Supports (Without External Cross-Frames) ............................................... .l65 Amplification Factors to 1395 Equations for Systems with Skewed Supports (With External Cross-Frames) ..................................................... 165
xvn

Chapter 1
Introduction
1.1 Research Overview
Trapezoidal steel box girder systems are frequently used in Texas for the construction of highway interchanges and elevated expressways in urban areas. Figure 1.1 shows a typical steel box girder bridge in northeast Houston. There are a number of aspects of box girder bridges that make them an attractive alternative compared to other bridge types. These benefits include both aesthetic and structural advantages. The aesthetic advantages are primarily due to the smooth appearance of the boxes. The smooth shape of the girders also offer maintenance advantages since the interior surface of the closed box remains clean and dry, and there are fewer areas where debris and water can readily accumulate.
Figure 1.1 Trapezoidal Box Girder Bridge
In addition to good aesthetic and serviceability properties, box girders also have structural advantages, particularly with respect to the torsional performance of the girders. The torsional stiffness of a box section is generally in the range of 1 00 to more than 1000 times larger than that of a comparable !-shaped section (Heins and Hall 1981). Because of their high torsional stiffness, box girders have good transverse load distribution characteristics, which in turn lead to more efficient designs. Furthermore the box girders have the ability to resist torsion without extensive use of intermediate diaphragms between the girders, which can lead to a reduction of erection time in the field. Based upon these advantages, box girders have gained popularity in curved bridge applications.
1
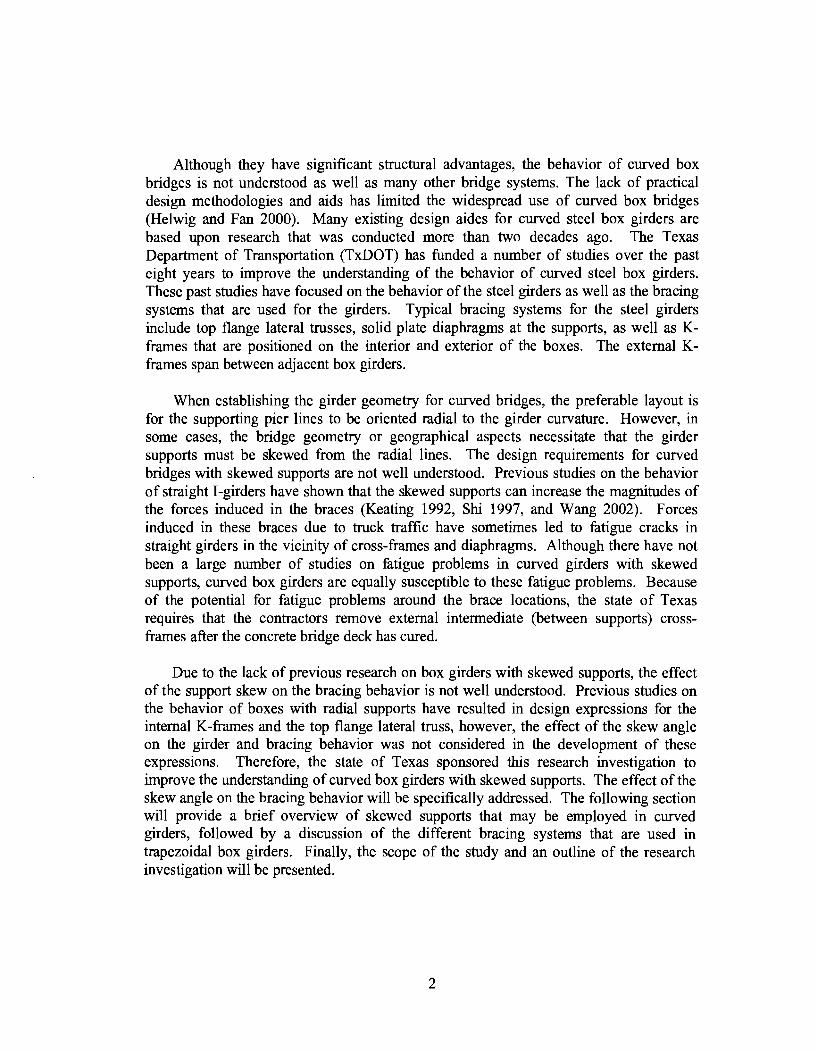
Although they have significant structural advantages, the behavior of curved box bridges is not understood as well as many other bridge systems. The lack of practical design methodologies and aids has limited the widespread use of curved box bridges (Helwig and Fan 2000). Many existing design aides for curved steel box girders are based upon research that was conducted more than two decades ago. The Texas Department of Transportation (TxDOT) has funded a number of studies over the past eight years to improve the understanding of the behavior of curved steel box girders. These past studies have focused on the behavior of the steel girders as well as the bracing systems that are used for the girders. Typical bracing systems for the steel girders include top flange lateral trusses, solid plate diaphragms at the supports, as well as Kframes that are positioned on the interior and exterior of the boxes. The external Kframes span between adjacent box girders.
When establishing the girder geometry for curved bridges, the preferable layout is for the supporting pier lines to be oriented radial to the girder curvature. However, in some cases, the bridge geometry or geographical aspects necessitate that the girder supports must be skewed from the radial lines. The design requirements for curved bridges with skewed supports are not well understood. Previous studies on the behavior of straight 1-girders have shown that the skewed supports can increase the magnitudes of the forces induced in the braces (Keating 1992, Shi 1997, and Wang 2002). Forces induced in these braces due to truck traffic have sometimes led to fatigue cracks in straight girders in the vicinity of cross-frames and diaphragms. Although there have not been a large number of studies on fatigue problems in curved girders with skewed supports, curved box girders are equally susceptible to these fatigue problems. Because of the potential for fatigue problems around the brace locations, the state of Texas requires that the contractors remove external intermediate (between supports) crossframes after the concrete bridge deck has cured.
Due to the lack of previous research on box girders with skewed supports, the effect of the support skew on the bracing behavior is not well understood. Previous studies on the behavior of boxes with radial supports have resulted in design expressions for the internal K-frames and the top flange lateral truss, however, the effect of the skew angle on the girder and bracing behavior was not considered in the development of these expressions. Therefore, the state of Texas sponsored this research investigation to improve the understanding of curved box girders with skewed supports. The effect of the skew angle on the bracing behavior will be specifically addressed. The following section will provide a brief overview of skewed supports that may be employed in curved girders, followed by a discussion of the different bracing systems that are used in trapezoidal box girders. Finally, the scope of the study and an outline of the research investigation will be presented.
2

1.2 Skewed Supports
When establishing the geometry for straight bridges, engineers usually attempt to orient the supports normal to the longitudinal axis of the girders. Due to problems with the geological terrain or intersecting roadways, it is not always possible to orient the supports normal to the girder lines and in these cases the supports are offset along a skew angle.
In curved bridges, engineers generally attempt to orient the bridge piers radial to the horizontal curvature. Thus in a curved bridge a skewed support is created when a girder support is not radial to the girder lines, as shown in Figure 1.2.
Exterior girder
·, ·, Skewed support ·,.,
Figure 1.2 Skew Angle in Curved Box Girders with Skewed Supports
For straight bridges, the skew angle is the angle measured between the longitudinal axis of the girders and a line perpendicular to the bridge pier. For c;urved bridges, the skew angle is the angle between a line parallel to the bridge pier and a line radial to the bridge curvature as shown in Figure 1.2.
The behavior of bridges with skewed supports is more complicated than the behavior of bridges without skewed supports. A skew angle such as the one shown in Figure 1.2 amplifies the difference between the girder lengths, which therefore increases the differences in the stiffness of the two girders. The braces therefore may attract larger forces that may also introduce additional moments and torques in the box girders. Consequently, the configuration shown in Figure 1.2, in which the skew angle increases the length of the exterior girder relative to that of the interior girder, was the focus of this study.
Previous studies of straight !-girders have shown that skewed supports can increase the magnitudes of forces induced in bracing elements (Keating 1992, Shi 1997, and
3
Wang 2002). This is also true for the external K-frames between curved girders. The forces induced in the external K-frames depend on the in-plane stiffness of the box girders. The forces in the external K-frame are magnified by the presence of a skewed support since the ends of the external K-frames are connected at two different locations along the length of the individual girders, which leads to differential deflection across the cross-frame. This interaction between the girders and K-frames in bridges with skewed supports is not well understood and design engineers may end up with an impractical or improbable design for the external K-frames using typical design approaches. Appropriate design requirements for curved box girder bridges with skewed supports are therefore not well understood.
1.3 Bracing Systems
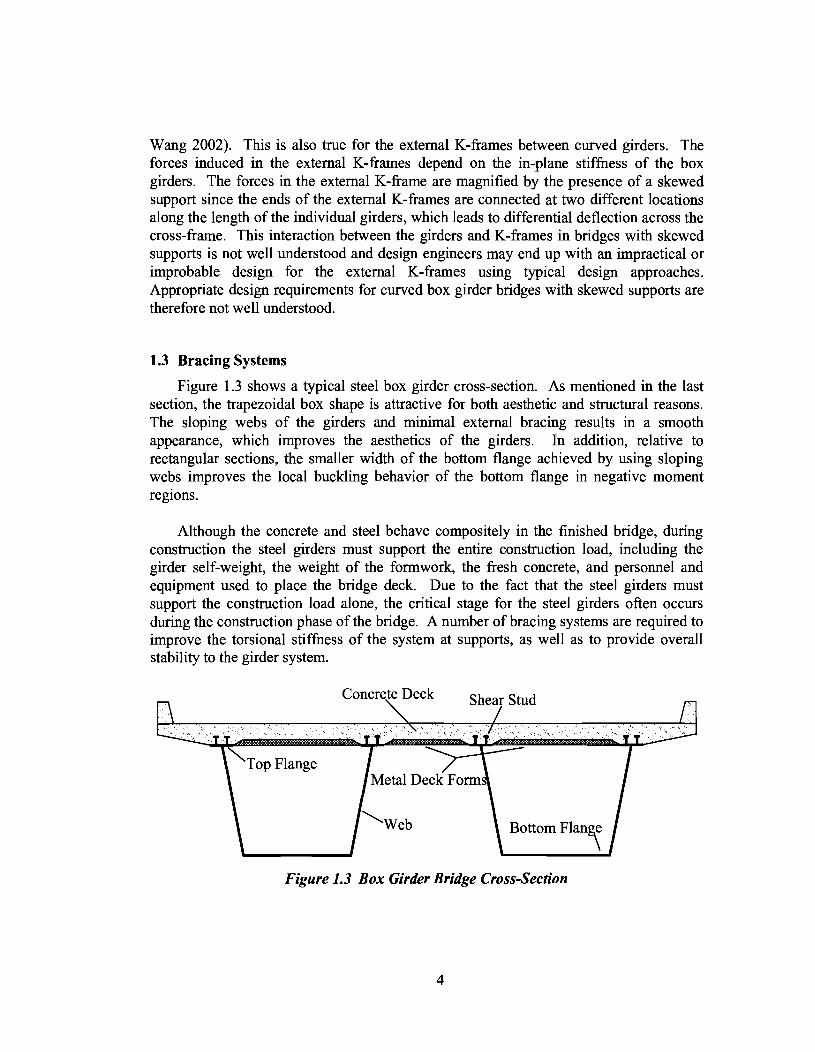
Figure 1.3 shows a typical steel box girder cross-section. As mentioned in the last section, the trapezoidal box shape is attractive for both aesthetic and structural reasons. The sloping webs of the girders and minimal external bracing results in a smooth appearance, which improves the aesthetics of the girders. In addition, relative to rectangular sections, the smaller width of the bottom flange achieved by using sloping webs improves the local buckling behavior of the bottom flange in negative moment regions.
Although the concrete and steel behave compositely in the finished bridge, during construction the steel girders must support the entire construction load, including the girder self-weight, the weight of the formwork, the fresh concrete, and personnel and equipment used to place the bridge deck. Due to the fact that the steel girders must support the construction load alone, the critical stage for the steel girders often occurs during the construction phase of the bridge. A number of bracing systems are required to improve the torsional stiffness of the system at supports, as well as to provide overall stability to the girder system.
Concrete Deck
Figure 1.3 Box Girder Bridge Cross-Section
4

Although some of the box girder bracing systems are necessary in the completed bridge, the critical need for many of the braces typically occurs during girder erection and casting of the concrete bridge deck. As noted, after the concrete deck has hardened and composite action is achieved, the box girder system has a large torsional stiffness. However, during most phases of construction, the girders are open at the top and require bracing to increase their torsional stiffness. Bracing is typically provided by three main components: the lateral truss system, internal diaphragms, and external diaphragms. Each of these bracing systems will be discussed in the following sections of this report. Although box girder systems have been successfully constructed with no intermediate (between the supports) external cross-frames, recent practice for box girder construction in Texas has usually included a number of external K-frames placed at intermediate locations between the girder supports. The use of these external cross-frames is primarily to control the relative movement of the top flanges of the box girder bridges. Although there is no specific condition regarding when the external braces are required, some engineers have employed the intermediate cross frames when the anticipated relative movement from girder twist and differential deflection between adjacent girders is larger than approximately 0.5 in. (between neighboring top flanges).
TxDOT Project 0-1395 was one of the first studies on curved box girders since the 1970's. Design expressions for the top lateral truss and the internal K-frames were developed in the 0-1395 study; however the girders that were studied did not have any external intermediate K-frames. Therefore the effects of these external braces on the design requirements of the other bracing systems are not clear, particularly for girders with skewed supports. The following three subsections of this report will briefly discuss the role of the different bracing systems.
1.3.1 Top Lateral Truss System
The top flange lateral truss system, as shown in Figure 1.4, is primarily required during erection and construction of the concrete bridge deck. The truss is formed by the top flanges of the box girders and the diagonal and strut members shown in the figure. This top lateral bracing system increases the torsional stiffness of the open steel section. The plane of the top lateral truss should be positioned as close to the plane of the top flanges as possible, however, small offsets to avoid interference between the metal deck forms and the truss generally have a negligible effect on the girder performance. For connection simplicity, given adequate top flange width, the diagonal can be fastened directly to the top flange thereby eliminating the necessity of a gusset plate.
The steel box girder with the top flange lateral truss is generally referred to as a quasi-closed section. The torsional stiffness of the quasi-closed section is often evaluated by transforming the top lateral bracing into an equivalent plate. Formulas developed by Kollbrunner and Basler (1969) are available for computing the equivalent plate thickness for various sizes and types of lateral bracing. By converting the bracing into an equivalent plate, the St. Venant formula for closed sections can be used to determine the
5
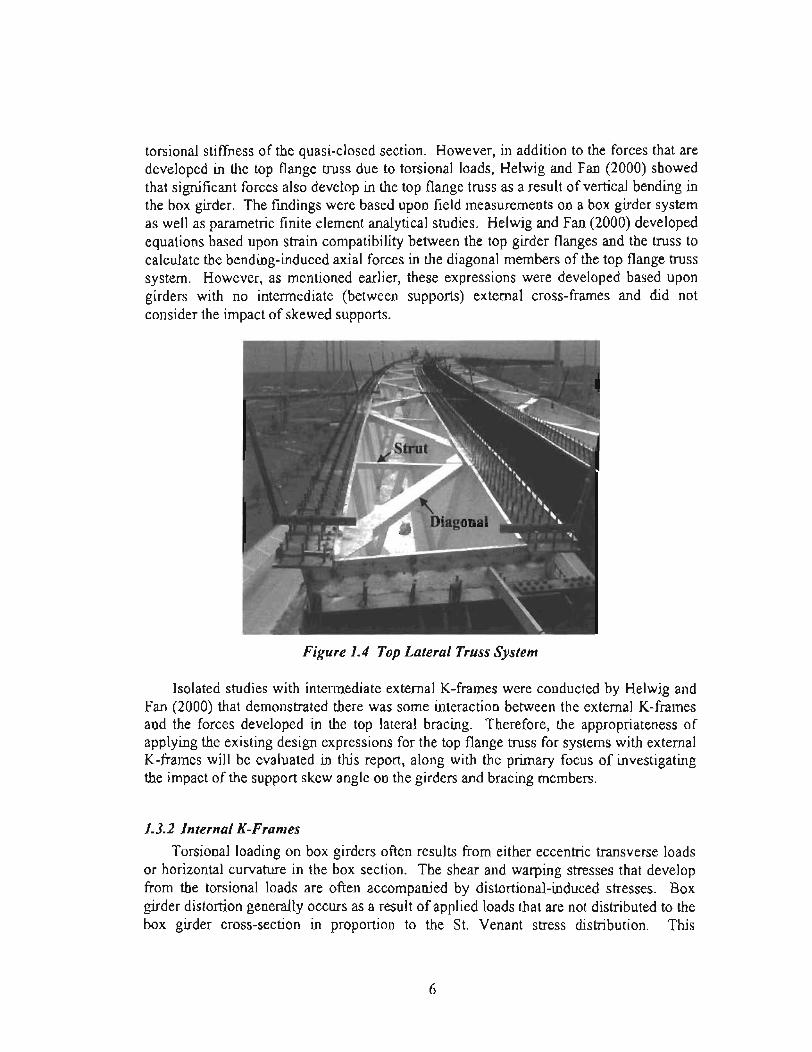
torsional stiffness of the quasi-closed section. However, in addition to the forces that are developed in the top flange truss due to torsional loads, Helwig and Fan (2000) showed that significant forces also develop in the top flange truss as a result of vertical bending in the box girder. The fmdings were based upon field measurements on a box girder system as well as parametric finite element analytical studies. Helwig and Fan (2000) developed equations based upon strain compatibility between the top girder flanges and the truss to calculate the bending-induced axial forces in the diagonal members of the top flange truss system. However, as mentioned earlier, these expressions were developed based upon girders with no intermediate (between supports) external cross-frames and did not consider the impact of skewed supports.
Figure 1.4 Top Lateral Truss System
Isolated studies with intermediate external K-frames were conducted by Helwig and Fan (2000) that demonstrated there was some interaction between the external K-frames and the forces developed in the top lateral bracing. Therefore, the appropriateness of applying the existing design expressions for the top flange truss for systems with external K-frames will be evaluated in this report, along with the primary focus of investigating the impact of the support skew angle on the girders and bracing members.
1.3.2 Internal K-Frames
Torsional loading on box girders often results from either eccentric transverse loads or horizontal curvature in the box section. The shear and watping stresses that develop from the torsional loads are often accompanied by distortional-induced stresses. Box girder distortion generally occurs as a result of applied loads that are not distributed to the box girder cross-section in proportion to the St. Venant stress distribution. This
6

distortion is most pronounced at the point of load application and diminishes with distance away from the load point. Internal K-frames such as the one shown in Figure 1.5 are provided to control cross-sectional distortion. The K-frames are typically provided at a uniform spacing along the length of the bridge. Although other cross-frame shapes, such as X-type systems, can also effectively control distortion, the K-frame shape is usually used since it provides an opening at the middle of the box that permits construction workers and inspectors access to walk through the middle of the girders.
Figure 1.5 Internal K-Frame
As shown in Figure 1.5, the K-frames consist of a top strut and two diagonals. The top strut of the K-frame should be positioned as close to the plane of the top flange truss as possible since this member also serves as the lateral strut in the truss. Heins (1978) developed simple formulas for the K-frame spacing and the required area of the diaphragm diagonals so as to provide adequate stiffness to control box girder distortion. Helwig and Fan (2000) developed strength formulas that predict the distortional forces in the cross-frames. Like the above-referenced equations for the top lateral truss, the strength equations for the internal K-frames did not consider the impact of external Kframes. Given the limitations of previous studies, the effects of external K-frames and support skew on the internal braces are not well understood.
1.3.3 External K-Frames
The possibility of differential deflection between the girder flanges during casting of the concrete deck is a point of significant concern. Both vertical and lateral differential deflections should be considered. Differential vertical deflection causes a variation in the thickness of the slab across the width of the bridge. Differential lateral deflection between adjacent girders can put stress on the connection between the permanent metal deck form (PMDF) and the girders, potentially compromising the safety of the PMDF during deck casting. One obvious source of the differential deflection is from twist of the girders, which results in a relative movement of the flanges of the box sections. Differential deflections also develop between adjacent boxes in curved bridges due to differences in girder length, where shorter interior girders deflect less than longer exterior
7
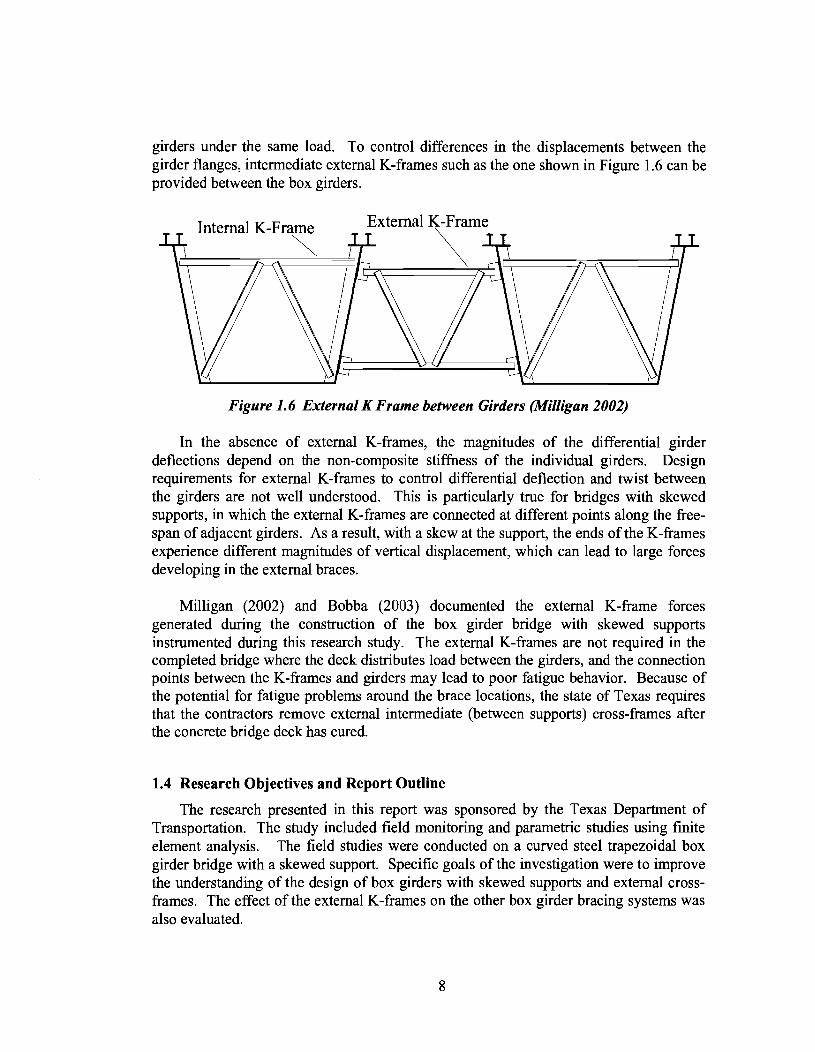
girders under the same load. To control differences in the displacements between the girder flanges~ intermediate external K-frames such as the one shown in Figure 1.6 can be provided between the box girders.
Internal K-Frame
~ External K-Frame
~
Figure 1.6 External K Frame between Girders (Milligan 2002)
In the absence of external K-frames, the magnitudes of the differential girder deflections depend on the non-composite stiffness of the individual girders. Design requirements for external K-frames to control differential deflection and twist between the girders are not well understood. This is particularly true for bridges with skewed supports, in which the external K-frames are connected at different points along the freespan of adjacent girders. As a result, with a skew at the support, the ends of the K-frames experience different magnitudes of vertical displacement, which can lead to large forces developing in the external braces.
Milligan (2002) and Bobba (2003) documented the external K-frame forces generated during the construction of the box girder bridge with skewed supports instrumented during this research study. The external K-frames are not required in the completed bridge where the deck distributes load between the girders, and the connection points between the K-frames and girders may lead to poor fatigue behavior. Because of the potential for fatigue problems around the brace locations, the state of Texas requires that the contractors remove external intermediate (between supports) cross-frames after the concrete bridge deck has cured.
1.4 Research Objectives and Report Outline
The research presented in this report was sponsored by the Texas Department of Transportation. The study included field monitoring and parametric studies using finite element analysis. The field studies were conducted on a curved steel trapezoidal box girder bridge with a skewed support. Specific goals of the investigation were to improve the understanding of the design of box girders with skewed supports and external crossframes. The effect of the external K-frames on the other box girder bracing systems was also evaluated.
8

A total of eight chapters are presented in the report. Following this introductory chapter, the second chapter briefly explains the behavior of box girders and provides background infonnation from previous studies on box girders and other related investigations. A discussion of the three-dimensional finite element analytical (FEA) model is presented in Chapter 3.
The fourth chapter describes the data acquisition system that was used in the field studies and also includes a brief overview of the bridge that was monitored. The fifth chapter presents FEA verification of selected field results obtained during girder erection, concrete deck casting, and live load tests. Results from the parametric studies are presented in Chapter 6. Chapter 7 focuses on the analysis requirements of bridges with skewed supports and external cross-frames and finally the summary and conclusions are presented in Chapter 8.
9

!!!!!!!!!!!!!!!!!!!"#$%!&'()!*)&+',)%!'-!$-.)-.$/-'++0!1+'-2!&'()!$-!.#)!/*$($-'+3!
44!5"6!7$1*'*0!8$($.$9'.$/-!")':!
Chapter 2
Background
2.1 Introduction
The design requirements for curved girders are often difficult to ascertain since . AASHTO employs a "Guide" Specification (AASHTO Guide 2003) for horizontally curved steel girder bridges. The difficult nature of establishing appropriate design requirements is further intensified since many of the critical bracing elements are inadequately addressed in the Guide Specification. For example, the following guidance is provided with regard to the internal diaphragms and cross-frames in the Guide Specification (2003):
"Intermediate diaphragms or cross-frames within each box girder shall be required to limit the normal stresses and the transverse bending stresses due to distortion. . . . The longitudinal spacing and stiffness of such diaphragms, if required, shall be determined using a rational analysis."
The vague nature of this requirement leaves it open to wide interpretation since it is not clear what constitutes a "rational analysis." External cross-frame and diaphragm bracing is addressed in the NCHRP Recommended Specifications (NCHRP 1998), which states:
"External bracing at other than support points is usually not necessary. If analysis shows that the boxes will rotate excessively when the deck is placed, temporary external bracing may be desirable. "
The lack of a clear defmition of "excessive rotation" also makes this provision of the specification difficult to employ. The Colorado Department of Transportation "Bridge Design Manual" does provide a requirement for the external braces (Cheplak 2001):
"When the radius of curvature, R, is less than I 000 feet, temporary external diaphragms shall be provided at every internal cross-frame. . .. These temporary frames serve to unify the overall action of the steel box girders during deck pouring while also providing additional restraint for temperature effects. "
However, the above reference has very little to do with the actual requirements of the bridge since it is based solely on geometry and does not address the torsional stiffness or strength of the girders.
11
Due to the inconsistencies and lack of guidance in the design specifications that are currently available for the design of curved steel box girder bridges, engineers are faced with difficult design decisions regarding the sizing of the basic elements of the bridge girders. As a result of this lack of guidance, there has been a number of research investigations focused on curved steel girders over the past 30 years.
Past investigations sponsored by TxDOT have provided an overview of the pertinent research on box sections that have been conducted over the last several decades (Helwig and Fan 2000). This chapter will not repeat the literature search provided in these past studies, however, an overview of the pertinent research that has been conducted over the past decade will be provided. This chapter will provide background information that is specific to this research investigation.
2.2 Basic Mechanics of Box Girders
2.2.1 Bending
Flexure is a primary source of stresses for box girders and is analyzed usmg traditional beam theory. The longitudinal stress,/, is calculated with the formula:
J=Mz I
(2.1)
where M is the bending moment, z is the distance on the cross-section from the neutral axis to the point under consideration, and I is the moment of inertia about the axis of bending. During construction the applicable moment of inertia is that of the steel section alone since it supports all of the applied loads. After the concrete deck has cured, the composite cross-section resists the applied loads and the moment of inertia of the composite section is used in stress calculations. The concrete is often transformed into an equivalent steel area while evaluating the cross-sectional stiffness.
2.2.2 Torsion Torsional moments in box girders are primarily resisted by shear stresses on the
girder cross-section. Torsion is generally divided into two types: Saint-Venant torsion and warping torsion. Box girders are usually dominated by Saint-Venant torsion and so warping torsion in box sections is often neglected.
The torsional constant of a closed cross-section can be determined usmg the following expression:
12
(2.2)
where, Ao is the area enclosed by the cross-section, and I:bi I ti is the summation of the width to thickness ratios of the plates making up the closed cross-section.
Although the closed box formed by the composite section has a large torsional stiffness, during many stages of construction the steel section consists of an open section. As noted in the introduction, a top lateral truss is usually provided to increase the torsional stiffness of the steel section during construction. The top lateral truss of the quasi-closed section is often converted into an "equivalent plate" using a method developed by Kolbrunner and Basler (1969). An approximate value of the torsional constant, KT, can be obtained for the quasi-closed section using the equivalent plate method.
The rotation of the cross-section, d+, due to torsion can be calculated using an expression developed by Kolbrunner and Basler (1969):
(2.3)
where MT is the applied torque, dx is the length of the section considered, G is the shear modulus of the material, and KT is the torsional constant.
The shear flow, which is the shear stress multiplied by the plate thickness, can be found using an equation originally presented by Bredt in 1896, and used by Kolbrunner and Basler (1969):
M q=rt=-r-
2Ao (2.4)
where 't is the shear stress, which is assumed uniform for a thin plate, and t is the plate thickness.
2.3 Distortion
The expressions presented in the previous sections for torsional analyses assume the cross-section of the member keeps its original shape and does not distort. However, loads that are applied to the cross-section which are not in proportion to the St. Venant
13

shear flow cause cross-sectional distortion. Realistically this non-St. Venant distribution is generated from all typical transverse loads. The resulting distortion is a function of a number of factors, including the magnitude and placement of the loads, the cross-section geometry, as well as the curvature of the bridge.
Figure 2.1 shows the breakdown of a vertical torsional load in terms of the torsional and distortional components for a rectangular section. The torque that is pictured in Figure 2.la results from a "vertical couple", which is representative of a torque caused by an eccentric load such as the weight of concrete that is not symmetrically balanced on the box girder. The distribution of the pure torsional loads shown in Figure 2.1 b is in proportion to the St. Venant shear flow and therefore does not result in cross-sectional distortion. The distribution shown in Figure 2.lc does not cause any net torsion on the cross-section but instead results in a pure distortion.
MT b b
h
b
(a) Vertical Torsional loading
MT 2h
-Mr
2h
Mr
2h
-MT 2h
(b) Torsional Component (c) Distortional Component
Figure '2.1 Components of Torsional Load on Rectangular Section
A similar breakdown to that shown for a vertical torsional loading can be made for a torque consisting of a horizontal couple, which is consistent with the torque resulting from horizontal curvature of box girders. Though Figure 2.1 shows the distribution of torsional and distortional components in a rectangular section, similar breakdowns of the torque on trapezoidal shapes have been presented by Helwig and Fan (2000).
As discussed in the introduction, internal cross-frames such as the one shown in Figure 2.2 are provided to control box girder distortion. Helwig and Fan (2000) showed that for torques caused by eccentric gravity loads, the diagonal and strut forces in internal cross-frames can be found using the following expressions:
D Ldae = ws
bh(a +b) (2.5)
14
a 2e S= ws
2bh(a +b) (2.6)
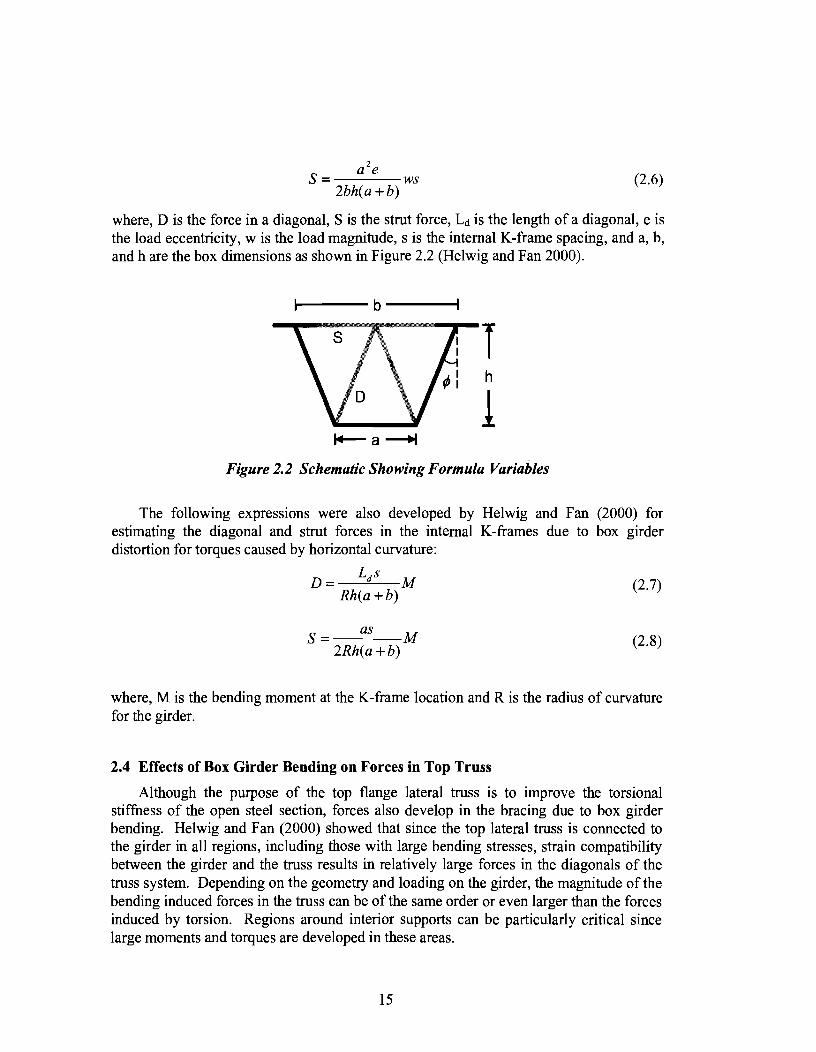
where, D is the force in a diagonal, S is the strut force, Ld is the length of a diagonal, e is the load eccentricity, w is the load magnitude, sis the internal K-frame spacing, and a, b, and hare the box dimensions as shown in Figure 2.2 (Helwig and Fan 2000).
T h
1 Figure 2.2 Schematic Showing Formula Variables
The following expressions were also developed by Helwig and Fan (2000) for estimating the diagonal and strut forces in the internal K-frames due to box girder distortion for torques caused by horizontal curvature:
S= as M 2Rh(a+b)
(2.7)
(2.8)
where, M is the bending moment at the K-frame location and R is the radius of curvature for the girder.
2.4 Effects of Box Girder Bending on Forces in Top Truss
Although the purpose of the top flange lateral truss is to improve the torsional stiffness of the open steel section, forces also develop in the bracing due to box girder bending. Helwig and Fan (2000) showed that since the top lateral truss is connected to the girder in all regions, including those with large bending stresses, strain compatibility between the girder and the truss results in relatively large forces in the diagonals of the truss system. Depending on the geometry and loading on the girder, the magnitude of the bending induced forces in the truss can be of the same order or even larger than the forces induced by torsion. Regions around interior supports can be particularly critical since large moments and torques are developed in these areas.
15

The bending-induced forces that develop in the truss are a function of the stresses induced in the top flanges of the girders. The forces and resulting stresses in the tops flange of the girders are a function of whether a single diagonal or truss or X-type truss is used. Equations for both single diagonal and X-type trusses were developed by Helwig and Fan (2000). However, most box girder bridges in Texas use single diagonal truss systems, due to the additional fabrication costs with X-type truss systems. All studies in this report have used top lateral trusses with single diagonals, so only the equations for these systems will be presented in this chapter.
Within a given truss panel, the stress at the middle of the top flange (fx Top) can be found using Eq. (2.1 ). Based upon strain compatibility between the top flange and the truss, the following expressions were derived by Helwig and Fan (2000) to estimate the bending force in the diagonals, Dbend, the force in the struts, Sbend, and the resulting lateral bending stress,JL bend, in top lateral trusses with a single diagonal:
fxrop scosa Dbend = K
l
(2.9)
(2.10)
r l.Ss 8 J Lbend = -b 2 bend
f tf (2.11)
where, the parameter K1 is defined by
(2.12)
In the equations above s is the spacing of struts (panel length), a is the acute angle between the top flange and the diagonal, br and tr are the respective values of the width and thickness of the top flange, d is length of a diagonal, b is the distance between the middle of the top flanges, and Ad and As are the respective cross-sectional areas of the diagonals and the struts. The diagonals will have the same state of stress (compression or tension) as the top flange at the point under consideration. The state of stress in the struts is opposite to that of the diagonals as indicated by the negative sign in Eq. (2.1 0).
2.5 Total Force in Top Lateral Truss System
In curved girders subjected to gravity loads, the forces in the top lateral diagonals contain components due to bending, torsion, and sloping web effects. The total axial
16

force induced in the diagonals of the top truss can be determined using Eq. (2.13). As shown in the equation, the total diagonal force includes components from bending (Dbend), torsion (DP."PM), and a horizontal component, (Dza1) due to the effect of the sloping web. It is important to maintain the sign convention for the force components of the total diagonal force. The web slope has no net effect on the top lateral diagonals, so Drat in Eq. (2.13) is equal to zero.
(2.13)
A formula to compute the bending component of this force was presented in Eq. (2.9). An equation for the torsional component of the diagonal force, labeled DEPM where EPM stands for the Equivalent Plate Method, was developed by Helwig and Fan (2000) using Tung and Fountain's (1970) MIR method, as shown in Eqs. (2.14) and (2.15).
where,
qb DEPM =-.
sma
T q=-
2Ao
The average total strut force can be determined using Eq. (2.16).
wstanf] . Statal= 2 + Dsma
(2.14)
(2.15)
(2.16)
The first term in Eq. (2.16) is the sloping web effect and the total diagonal forces are correctly used rather than just the Drend component shown in this equation in Helwig and Fan's (2000) report. The following chapter of this report will discuss the analytical work conducted in this research study.
17

!!!!!!!!!!!!!!!!!!!"#$%!&'()!*)&+',)%!'-!$-.)-.$/-'++0!1+'-2!&'()!$-!.#)!/*$($-'+3!
44!5"6!7$1*'*0!8$($.$9'.$/-!")':!

Chapter 3
Finite Element Model of Twin Trapezoidal Box Girders
3.1 Introduction
The finite element analysis (FEA) that was conducted during this investigation included modeling of the bridge that was instrumented in the field studies as well as subsequent parametric studies on trapezoidal box girder systems with varying radii of curvature, skew angles, and cross-frame spacings. The FEA studies were conducted using the 3D FEA program ANSYS (2002). Results from the FEA model and the field measurements were compared to ensure that the boundary conditions and modeling techniques were properly applied in the computational investigations. The FEA model was then used to investigate the impact of various parameters on the girder behavior. Since the primary focus of the investigation was the girder behavior during the construction stages, a first-order analysis with linear elastic material behavior was utilized in all analyses.
This chapter provides an overview of the modeling techniques, element types, and boundary conditions that were used in the analyses. The following sections discuss the modeling scheme that was used for the box sections along with the elements that were employed.
3.2 Elements Used in the FEA Models
The finite element models developed in this study focused on systems with two girders since twin girder systems are widely utilized throughout the state of Texas. Application of the results to systems with more than two girders will generally be acceptable since the behavior does not differ substantially from a twin girder system. The twin girder system was modeled using a combination of shell elements, 3D beam elements, and truss elements.
The shell elements used in the FEA models consisted of 3D 8-node shells (SHELL93) that were used to model the flanges, webs, and transverse stiffeners of the box sections as well as the solid diaphragms that were located at the supports. Figure 3.1 shows the order of the node numbering that is used for the SHELL93 element. These elements generally have higher shape functions, to model curved shells, than other element types for linear structural analysis. Each element node has six degrees of freedom (DOF) that include three translational (x, y, and z) and three rotational (about x, y, and z axes) DOFs. The deformational shapes are quadratic in the two in-plane directions of the element. Accurate deformational results can be obtained in the plane of the elements including warping as well as axial shortening and elongation. The elements also provide accurate solutions for out-of-plane bending of the element. The required input for the elements includes the thickness of the shell as well as the appropriate
19

material properties. Although the element cannot have a zero thickness at any point, the thickness can vary linearly through the element. Available element output includes both nodal output and elemental output at the integration points. The nodal output that is available consists of deformations as well as stress output at the comer nodes. The results from a given shell element can be extracted at either the top, bottom, or middle layer of the shell, however, a linear relationship is assumed through the thickness of the shell. Most of the shell elements that were used in the box girder models were rectangular in shape; however "irregular" shapes were also sometimes used in regions of discontinuities in the girder system. Some of the regions that required irregularly shaped shells included areas around girder splice details and the solid diaphragms at the supports. In many situations trapezoidal shaped elements were used in these transitional areas.
z L
Figure 3.1 SHELL93 Element Shape and Node Order
The top flange truss and the intermediate cross frames that were provided on the interior and exterior of the box were modeled with a combination of beam and truss elements. The beam elements used were BEAM4 elements, which are 3D line elements. Figure 3.2 shows the node layout of the BEAM4 element. The BEAM4 elements are uniaxial elements that can model tension, compression, torsion, and bending. The elements have six DOFs at each node, including three translational DOFs in the nodal x, y, and z directions and three rotational DOFs about the x, y, and z axes. The required inputs for the beam elements include the cross-sectional area, moment of inertia, width, and depth, as well as the corresponding material properties. The beam cannot have a zero length or area, however. the moment of inertia may be set equal to zero provided a large displacement analysis is not conducted. The shear and deflection of the BEAM4 element can vary linearly along the length of an individual element, but the torsional stiffuess is assumed constant along the element length. Although the beam can have any crosssectional shape for which the moments of inertia can be computed, the stresses are computed as if the neutral axis lies at the middle of the section. The element thicknesses are used only in the bending and thermal stress calculations.
20

z
y
X
Figure 3.2 BEAM4 Line Element Shape
A three-dimensional "spar" or truss element (LINK8) was used to model the members that have the dual function of serving as the struts in the top flange truss and the struts in the internal cross-frames. Because these struts consist of angles that are typically welded on one leg, the rotational restraint at the ends is negligible compared to the axial stiffness. The LINK8 is a uniaxial element with tension and compression capabilities. The element has three translational degrees of freedom at each node in the x, y, and z directions. As in a pin-jointed member, the elements have no bending or torsional stiffness. The spar element assumes a straight bar, axially loaded at its ends and has uniform properties from end to end. The length of the spar and area must be greater than zero. The input required for the spar element is the cross-sectional area as well as the corresponding material properties. The output data is the axial force developed in the member. Although the diagonals of the K-frames also consisted of angle sections, for geometric stability these elements were modeled using the BEAM4 elements discussed above.
Figure 3.3 shows a typical modeling scheme for a twin box girder system. Two shell elements were used to model each top flange with one element positioned on either side of the web. Five elements were generally used through the depth of the web while four elements were typically used across the width of the bottom flange. The mesh density along the girder length was dictated based upon sensitivity analyses that were periodically conducted to ensure that the necessary precision of the analyses was adequately maintained. To properly model the skewed end of the girders, the lengths of the flange and web elements were varied compared to the elements along the rest of the girder length. The variable element size in the vicinity of the skewed solid diaphragm is demonstrated in Figure 3.3.
21
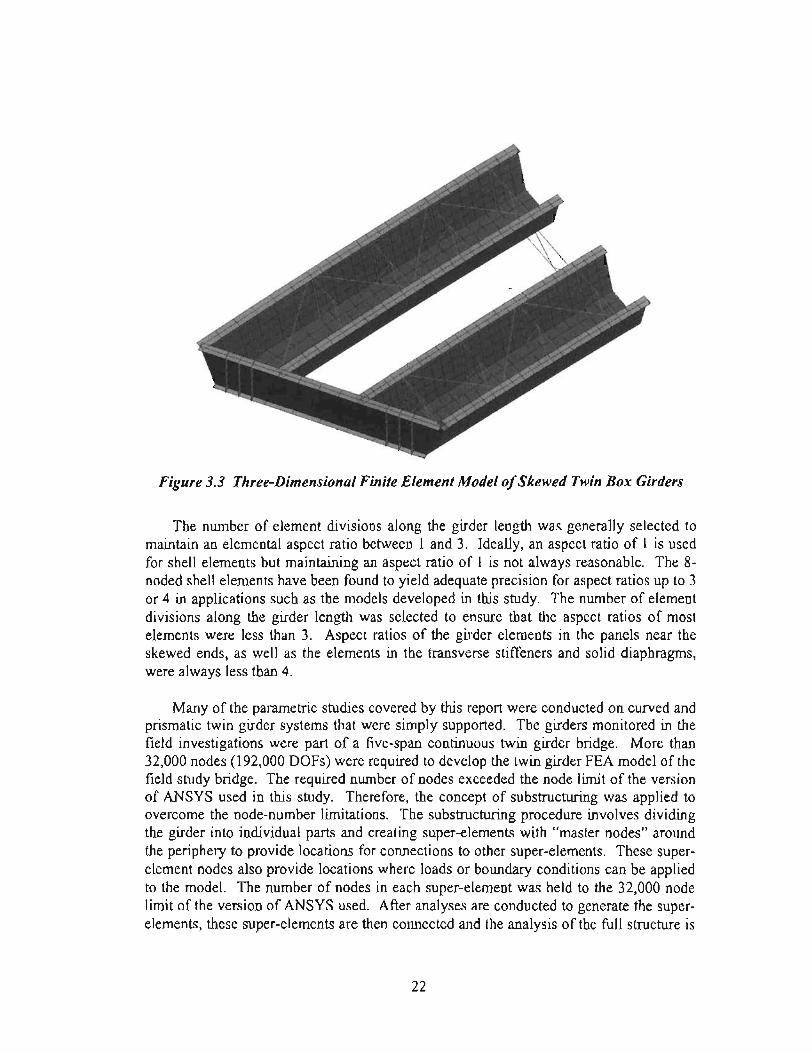
Figure 3.3 Three-Dimensional Finite Element Model of Skewed Twin Box Girders
The number of element divisions along the girder length was generally selected to maintain an elemental aspect ratio between 1 and 3. Ideally, an aspect ratio of 1 is used for shell elements but maintaining an aspect ratio of 1 is not always reasonable. The 8-noded shell elements have been found to yield adequate precision for aspect ratios up to 3 or 4 in applications such as the models developed in this study. The number of element divisions along the girder length was selected to ensure that the aspect ratios of most elements were less than 3. Aspect ratios of the girder elements in the panels near the skewed ends, as well as the elements in the transverse stiffeners and solid diaphragms, were always less than 4.
Many of the parametric studies covered by this report were conducted on curved and prismatic twin girder systems that were simply supported. The girders monitored in the field investigations were part of a five-span continuous twin girder bridge. More than 32,000 nodes (192,000 DOFs) were required to develop the twin girder FEA model of the field study bridge. The required number of nodes exceeded the node limit of the version of ANSYS used in this study. Therefore, the concept of substructuring was applied to overcome the node-number limitations. The substructuring procedure involves dividing the girder into individual parts and creating super-elements with "master nodes" around the periphery to provide locations for connections to other super-elements. These superelement nodes also provide locations where loads or boundary conditions can be applied to the model. The number of nodes in each super-element was held to the 32,000 node limit of the version of ANSYS used. After analyses are conducted to generate the superelements, these super-elements are then connected and the analysis of the full structure is
22

carried out, followed by a series of expansion passes to retrieve the results in the individual super-elements.
3.3 Modeling Details for the Field and Parametric Studies
In the bridge that was monitored in the field investigations, the top struts of the internal K -frames, which also serve as the struts in the top lateral truss system, were positioned approximately 12 inches below the top flange, rather than framing directly into the top flange. The large offset of the top strut appeared to be an attempt by the design engineer to avoid interference between the struts and diagonals of the top flange truss, even though this offset was not actually needed to avoid interference. Although a small offset is sometimes used, the 12 inch offset was excessive and such an offset will generally result in relatively poor interaction between the strut and the diagonals of the top lateral truss system. In order to appropriately correlate data from the field monitoring with the FEA model of the instrumented bridge, the location of the top strut of the internal K-frames was positioned to match the location of the strut in the actual bridge. However, in the models used in the parametric studies the struts were positioned to frame directly into the node between the top flange and the top of the webs to more accurately model the recommended practice of positioning the strut as closely as possible to the plane of the top flanges.
To increase the economy of the steel girders, the plate sizes that are used to make up the cross-sections of the box girders are varied along different segments of the bridge to provide more efficient sections based upon the design moments at each particular location. Transitions in both flange width and thickness occur along the length of the bridge. In the finite element model, a change in flange width was accommodated by a transitional element whose width was varied appropriately across the flange transition. To accommodate changes in flange thickness, since the flange and web coincide at a single point in the FEA model, at locations where the flange thickness changed the depth of the web in the FEA model was increased or decreased slightly to position the node at the center of the flange.
For the FEA model of the composite bridge girders, such as that shown in Figure 3.4, a modeling technique outlined by Helwig and Fan (2000) was used for the deck. Using this approach, the slab was modeled with a combination of shell and solid brick elements. Ideally, the concrete would be completely modeled using solid brick elements; however, using solid elements results in a very large number of nodes and an exorbitant increase in the number of DOFs in the model. The alternative approach that was used consists of modeling the majority of the slab using 8-node shell elements that were positioned at the middle of the slab thickness. The slab directly above the top flanges of the steel girders was modeled using 20-node brick elements that connected to the concrete shell elements, at the middle of the slab, and to the top flanges of the steel girders. With this approach the composite girder can be adequately modeled without unwarranted increases in the size of the FEA model.
23

Figure 3.4 Composite Section of Box Girder Bridge
3.4 FEA Boundary Conditions
The boundary conditions used in the twin girder FEA parametric models were employed based on an idealized pot bearing layout used in steel box girder construction. There are generally three types of pot bearings used in box girder systems: fixed, unidirectional, and multidirectional bearings. The categories of the bearings are dependent on the type of movement that is permitted in the plane of the bearing. A fixed bearing is one that restrains translational movements in all directions, while a unidirectional bearing has lateral guides that restrict the movement to one single direction. A multidirectional bearing does not restrict any movements in the plane of the bearing.
There are a variety of bearing layouts that have been utilized in Texas bridges over the past couple of decades. The bearing layout used in the FEA studies was consistent with the bridge instrumented in the field study component of this project. As shown in Figure 3.5, Bent 20 was the "fixed" support of the system and fixed bearings were positioned under each girder at this bent. At each other support location a multidirectional bearing was located under the interior girder and a unidirectional bearing was used under the exterior girder. The guides on the unidirectional bearings were oriented on a chord line to the fixed support. The chord orientation of the lateral guides permits free expansion under uniform thermal loads.
In the FEA model, the unidirectional bearings under the interior girders were modeled by preventing translation in the vertical direction and along the radial line, but allowing translation along the local direction defined by the chord line between the corresponding support and the "fixed" support. The multidirectional bearings were modeled under the exterior girders by preventing translation only in the vertical direction.
24
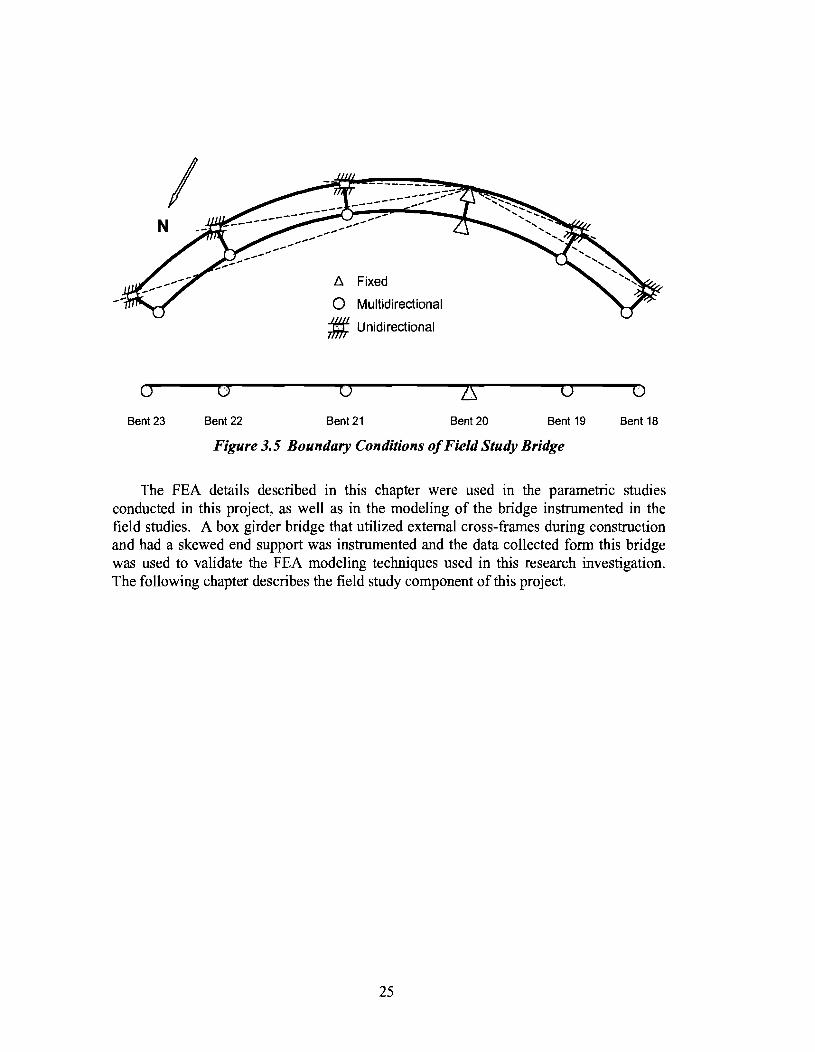
I N
a Bent23
0 Bent22
A Fixed
0 Multidirectional
1ft. Unidirectional
0
Bent21
0 Bent 20 Bent 19
Figure 3.5 Boundary Conditions of Field Study Bridge
0
Bent18
The FEA details described in this chapter were used in the parametric studies conducted in this project, as well as in the modeling of the bridge instrumented in the field studies. A box girder bridge that utilized external cross-frames during construction and had a skewed end support was instrumented and the data collected form this bridge was used to validate the FEA modeling techniques used in this research investigation. The following chapter describes the field study component of this project.
25

!!!!!!!!!!!!!!!!!!!"#$%!&'()!*)&+',)%!'-!$-.)-.$/-'++0!1+'-2!&'()!$-!.#)!/*$($-'+3!
44!5"6!7$1*'*0!8$($.$9'.$/-!")':!

4.1 Introduction
Chapter 4
Field Studies
The steel trapezoidal box girder bridge that was monitored in the field studies is part of the interchange connecting Beltway 8 (Sam Houston Parkway) and Highway 59 (Eastex Freeway) in Houston, Texas as shown in Figure 4.1. The instrumented girders are part of a direct connector that is a curved flyover bridge connecting the eastbound lanes of Beltway 8 to the northbound lanes of Highway 59. Concrete box girders were used in the approach ramps at the two ends of the connector, and steel box girders were used in the horizontally curved portion ofthe bridge.
1-10
Highway-288
Figure 4.1 Location of the Field Studies
The steel segments in this bridge consist of a four-span continuous unit and a fivespan continuous unit. The girder and bracing elements instrumented for this research project were part of the five-span continuous steel box girder unit. Figure 4.2 shows a picture of the field site after erection of all five spans ofthe bridge.
27

Figure 4.2 Overall Bridge
4.2 Bridge Geometry
4.2.1 Layout The five-span bridge instrumented for this study was chosen since it met the
requirement of having a skewed support, and its construction schedule met the timetable of the research project. Figure 4.3 shows the length of each of the five spans as measured along the centerline of the bridge. Since the bridge is horizontally curved, the spans of the interior girders are slightly less than the centerline length while the exterior girders are slightly longer. The bridge had a moderate radius of curvature of 1634 ft. measured relative to the bridge centerline.
1 .. 164'
.. I .. 212'
•1,. 289'
•1,. 269'
•lo~ 133'
•I
1 l ]_ ]_ 1 1 I I I
2b I I
Bent 23 22 21 19 18
Figure 4.3 Span Lengths
The five-span unit has a skewed support at Bent 23 where the steel sections end and concrete box girders begin. Figure 4.4 shows a plan view of the girders near Bent 23. The instrumentation that was applied to the bridge was positioned in the vicinity of the skewed support at Bent 23. An overview of the instrumentation is presented later in the chapter. The skew angle at Bent 23 is 09°-03'-57". The elevation of the steel unit varies
28

from approximately 60 ft. at Bent 23 to 70 ft. at Bent 18. A cross slope of 4.2% was used in the radial direction to help reduce vehicle centrifugal forces.
Bent 23 ;...- Radial Line I
I I I
---.:
Girders
Figure 4.4 Skewed Support at Bent 23
The box girders of the five-span unit were transported from the fabrication shop to the site in eighteen segments and spliced on the ground so that erection could be completed in a total of five stages. The completed cross-section of the instrumented box girder system consists of two trapezoidal box girders with an 8 in. thick concrete deck as shown in Figure 4.5.
Figure 4.5 Bridge Cross-Section
The width and depth of the girders is constant along the length of the bridge, except at Bent 23 where the steel girders are dapped as shown in Figure 4.6. The steel girders have significantly longer spans than the concrete girders ofthe short approach ramps, and therefore the steel girders are deeper than the concrete box girders. To enable the
29

concrete and steel girders to share a pier where they meet, the ends of the steel girders were dapped to match the depth ofthe concrete beams.
I
Figure 4.6 Dapped End of Girder at Bent 23
The flange thickness and top flange width were varied along the girder length in accordance with changes in the design moment along the length of the bridge. The crosssectional dimensions of the flanges and webs at the instrumented sections near the skewed support at Bent 23 are shown in Figure 4.7.
19.7"
83.7"
55.1"
Figure 4. 7 Cross-Sectional Dimensions at Instrumented Girder Sections
30
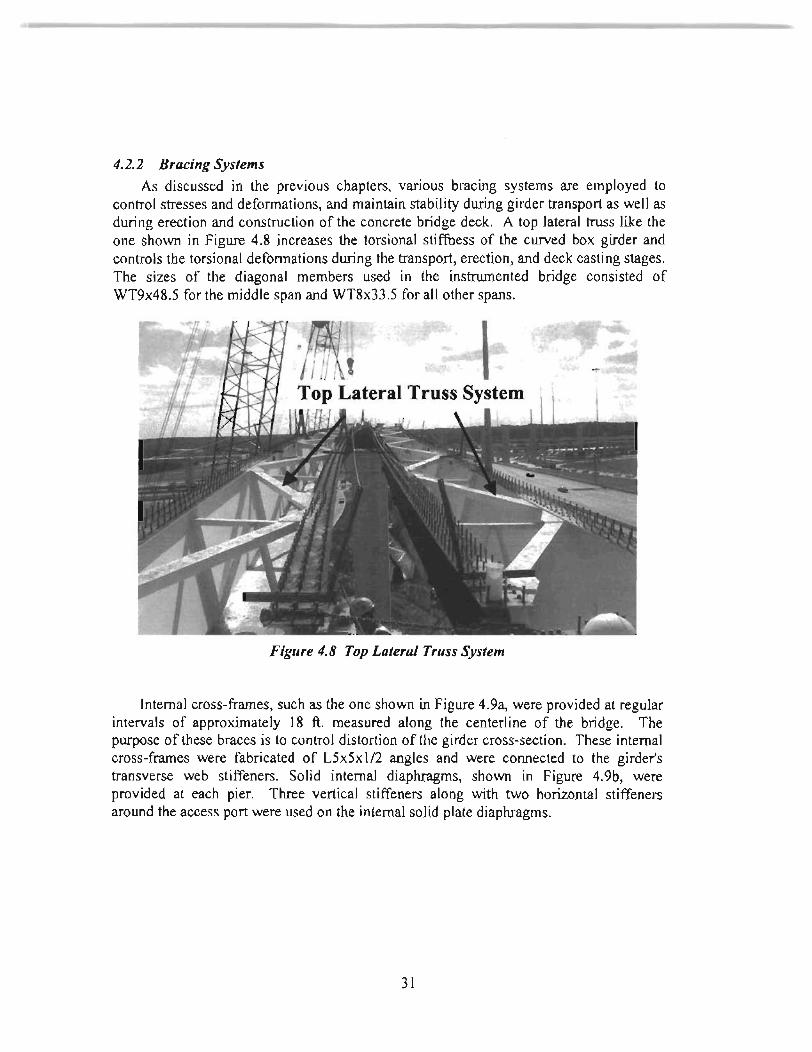
4.2.2 Bracing Systems
As discussed in the previous chapters, various bracing systems are employed to control stresses and deformations, and maintain stability during girder transport as well as during erection and construction of the concrete bridge deck. A top lateral truss like the one shown in Figure 4.8 increases the torsional stiffuess of the curved box girder and controls the torsional deformations during the transport, erection, and deck casting stages. The sizes of the diagonal members used in the instrumented bridge consisted of WT9x48.5 for the middle span and WT8x33.5 for all other spans.
Figure 4.8 Top Lateral Truss System
Internal cross-frames, such as the one shown in Figure 4.9a, were provided at regular intervals of approximately 18 ft. measured along the centerline of the bridge. The purpose of these braces is to control distortion of the girder cross-section. These internal cross-frames were fabricated of L5x5xl/2 angles and were connected to the girder's transverse web stiffeners. Solid internal diaphragms, shown in Figure 4.9b, were provided at each pier. Three vertical stiffeners along with two horizontal stiffeners around the access port were used on the internal solid plate diaphragms.
31

(a) Internal Cross-Frame (b) Internal Solid Diaphragm with Access Port
Figure 4.9 Internal Diaphragms
Solid external diaphragms, such as the one shown cantilevering from an interior girder segment in Figure 4.1 0, were provided between the girders at each support to control girder twist. The external plate diaphragms tie the girders together and enable them to act as a system. The external diaphragms were fabricated in a trapezoidal shape to match the geometry of the box sections. The flanges of the diaphragms were bolted to the girders to provide continuity between the internal and external diaphragm flanges across the full width of the bridge.
Figure 4.10 Solid External Diaphragm
32

Figure 4.11 shows the instrumented solid diaphragm in place at Bent 23. The depth of the solid diaphragm at the dapped end at Bent 23 was approximately half that of the full-depth solid diaphragms at the other bent locations. The instrumentation that is visible on the diaphragm will be discussed later in this chapter. The dimensions of the instrumented solid diaphragm at Bent 23 are shown in Figure 4.12. Eight pairs of shear studs were provided on the top flange of the external diaphragm to help develop composite action between the diaphragm and the concrete deck. A325 bolts were used to attach the solid diaphragms to the girders.
Figure 4.11 Solid Diaphragm at Bent 23
I~ 76"
39.5"
I~ 14" 93"
Figure 4.12 Dimensions of External Solid Diaphragm
Temporary external cross-frames, as shown in Figure 4.13, were provided at intermediate locations between the girders to minimize differential deflection during
33

casting of the concrete deck. The external cross-frames were located at every third internal cross-frame location, which corresponds to a spacing of approximately 54 ft. measured relative to the centerline of the bridge. The original design of all external cross-frames consisted of WT7x21.5 members for the top and bottom chord and L5x3.5xY:z members for the diagonals.
Instrumentation of the typical K-frame, composed of angle and T -sections, was somewhat undesirable since determining the forces developed in these members can be difficult due to a lack of symmetry as well as eccentric connections. The bending that results in the K-frame members from eccentricities in the connections makes it difficult to determine the axial forces developed in the angle or T shaped members. Due to the connection and bending characteristics of angles and tees, regression techniques that require assumptions about the planes of bending are required to obtain estimates of the axial forces in the bracing members. To obtain data that could be more easily reduced, the researchers proposed altering the member shapes for the instrumented external crossframe. With the approval of TxDOT and the contractor, a special external K-frame composed of symmetric tubular members was fabricated and used at the desired instrumentation location in place of a regular cross-frame. This substitute cross-frame was fabricated and tested at the University of Houston's Structural Engineering Lab. The laboratory testing of the instrumented K-frame also provided a calibration of the instrumentation system used in the field studies as will be discussed later in this chapter. A detailed discussion on the construction and laboratory testing of the instrumented external cross-frame has been presented by Milligan (2002).
Figure 4.13 Temporary External Cross-Frame
The members ofthe instrumented cross-frame shown in Figure 4.13 were sized such that the stiffness of the substitute cross-frame was comparable to the cross-frames in the original design. The member sizes of the original cross-frames and the substitute crossframe are given in Table 4.1. Gusset plates on the substitute external cross-frame were
34

fabricated of 0.5 in. thick Grade 50 plate similar to the original cross-frames. The use of tubular sections for the cross-frames permitted the eccentricities present in the typical connections to be essentially eliminated. The connections were made by splitting the tubes so that the gusset plates could be positioned right along the centroidal axis of the tubes. As will be described in the next section, strain gages were applied so that bending due to misalignment and other sources could be accounted for in the reduction of collected data. The doubly-symmetric shape of the tubes makes adjusting for bending very simple compared to singly-symmetric sections such as angles and tees.
Table 4.1 External Cross-Frame Properties
0 .. ] ngma Member Section Area (in")
Top and Bottom Chord WT 7x21.5 6.31 Diagonals L 5x3.5x0.5 4
Substitute Member Tubular Section Area (in2
)
Top and Bottom Chord 7x3x3/8 6.58 Diagonals 5x3x5/16 4.36
4.3 Instrumentation
The steel trapezoidal box girder sections were delivered to the construction site in mid-December 2001. Instrumentation was applied to both the interior and exterior girder sections on December 20 and 21 while the segments were on the ground in a storage area near the bridge site. Installing the instrumentation while the girders were on the ground not only allowed for ease of access, but also the gauges could be monitored during all construction events, including girder erection, with this instrumentation scheme.
Throughout the remainder of this report the girder positioned on the outside of the curve in the completed bridge will be referenced as Girder E (exterior), while the girder on the interior of the curve will be referenced as Girder I (interior). A nomenclature for the instrumentation stations has also been established as will be discussed. The girders were instrumented with foil type strain gages at four locations along the length of the bridge as shown in Figure 4.14. The instrumented locations include Stations D, K, 1, and 2. Station D is located at Bent 23 where the external solid diaphragm at the skewed support was instrumented. Station K was located at the external cross-frame closest to the skewed support, or 54.5' from Bent 23. At Station K both the internal and external Kframes were instrumented. The external K-frame used at Station K was the cross-frame fabricated from tubular members discussed in the preceding section of this chapter. Stations 1 and 2 were at approximately 45.5' and 63.5', respectively, along the centerline of the bridge from Bent 23, which corresponds to half a top truss panel before and after
35
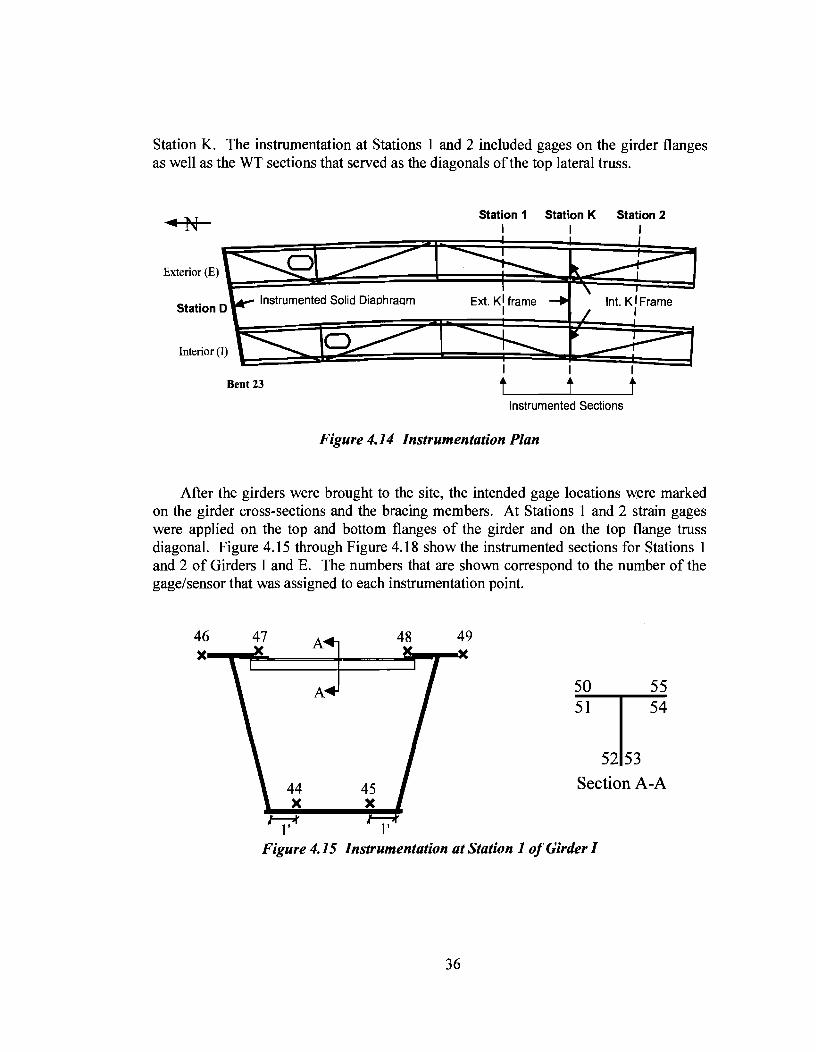
Station K. The instrumentation at Stations 1 and 2 included gages on the girder flanges as well as the WT sections that served as the diagonals of the top lateral truss.
Station 1 Station K Station 2 I I I
Instrumented Sections
Figure 4.14 Instrumentation Plan
After the girders were brought to the site, the intended gage locations were marked on the girder cross-sections and the bracing members. At Stations 1 and 2 strain gages were applied on the top and bottom flanges of the girder and on the top flange truss diagonal. Figure 4.15 through Figure 4. 1 8 show the instrumented sections for Stations 1 and 2 of Girders I and E. The numbers that are shown correspond to the number of the gage/sensor that was assigned to each instrumentation point.
49 46
x~~~--==~----~-T-«
44 X
7
50 55
T Section A-A
Figure 4.15 Instrumentation at Station 1 of Girder I
36

20 41 X~~~~~-=--~--~«
l' 1'
23 24 22 25
21 26
Section A-A
Figure 4.16 Instrumentation at Station Z of Girder I
17 X
B
86 X
7 7
96 91 95 92
94 93 SectionB-B
Figure 4.17 Instrumentation at Station 1 of Girder E
58 62 x--~~====-=~-=~_.,--x
T Section B-B
1' 1' Figure 4.18 Instrumentation at Station Z of Girder E
37

On the top flanges of the girders, gages were installed at the mid-thickness of the flange tips. On the bottom flanges, strain gages were installed one foot from each web. For the top lateral truss diagonal, a total of six strain gages were placed on the web and flange of the tee-shaped section. Each strain gage was positioned at a location one inch from the free edge of the flange or web. The instrumentation on the diagonals of the top lateral truss was located at mid-length of the members to minimize localized stress effects that might develop at the ends of these bracing members.
Strain gages were applied to the web of the solid external diaphragm at Station D. No gages were applied on the flanges of the external diaphragm since gages on the flanges could not have been adequately protected during the erection procedure. Four uniaxial strain gages and one 45° rosette were placed on each side of the solid diaphragm's web as shown in Figure 4.19. The gage numbers on the solid diaphragm are shown in Figure 4.20. Note that in Figure 4.20 the first gage number listed is the gage on the side of the diaphragm facing Bent 22, while the second gage number listed in parentheses is the gage on the side of the diaphragm away from Bent 22.
19.75"
Girder I GirderE
43.87"
17''
Figure 4.19 Instrumentation Locations on Solid Diaphragm
38
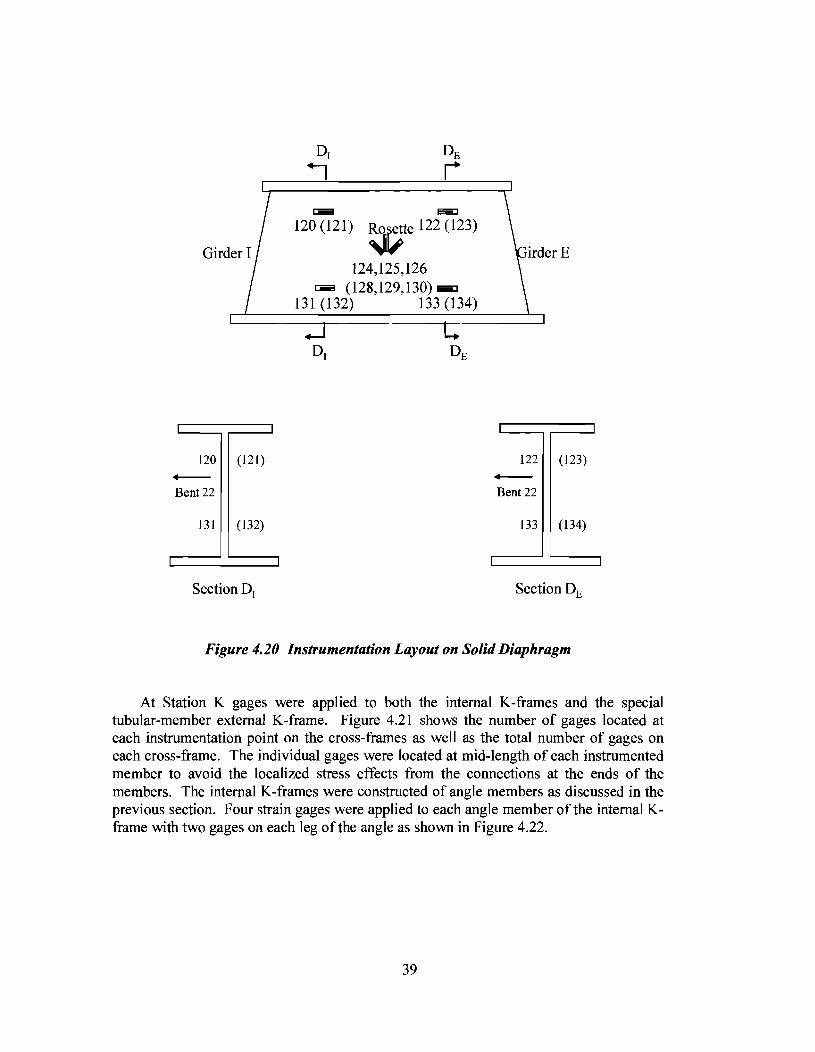
Girder I
120 (121) -Bent22
131 (132)
SectionD1
l:!!iiiB liiiiiiiJ
120 (121) we 122 (123)
124,125,126 l:!!iiiB (12 8' 12 9' 13 0) liiiiJ
131(132) 133(134)
irder E
122 (123) -Bent22
133 (134)
Section DE
Figure 4.20 Instrumentation Layout on Solid Diaphragm
At Station K gages were applied to both the internal K-frames and the special tubular-member external K-frame. Figure 4.21 shows the number of gages located at each instrumentation point on the cross-frames as well as the total number of gages on each cross-frame. The individual gages were located at mid-length of each instrumented member to avoid the localized stress effects from the connections at the ends of the members. The internal K-frames were constructed of angle members as discussed in the previous section. Four strain gages were applied to each angle member of the internal Kframe with two gages on each leg ofthe angle as shown in Figure 4.22.
39

Girder I Girder E Figure 4.21 Number of Gages on Internal and External Cross-Frames
30 34 72 76
~ ~~en ~ ~3~ 27 28\ 69 70\ ,0~ ,2~
Girder I 39 Girder E 81
Figure 4.22 Strain Gage Layout for Internal K Frames
As discussed, the instrumented external K-frame was constructed of tubular members as shown in Figure 4.23. The brace was fabricated at the University of Houston and then transported to the bridge site and substituted for the brace originally des~gned for the bridge. The new brace was made of rectangular tubular steel sections, with crosssectional areas nearly identical to the angles used on the original external K-frame. Four strain gages were applied to each diagonal of the external cross-frame, and at two locations along the bottom chord of the external cross-frame. Two gages were also applied to the top chord of the cross-frame as shown in the figure. The gages on the individual faces of the rectangular sections were placed at the middle of each face as shown in Figure 4.24. The process that was used to apply and protect all strain gages is described in the next two sections of this report.
40

102
101 0 104
105
112
IIIDIIJ 114
97099 n
118
115 D 117
116
110
Figure 4.23 Strain Gage Layout for External K Frame
(a) K-Frame in Laboratory (b) Gage Closeup
Figure 4.24 Instrumented External K-Frame
4.4 Strain Gage Application
The strain gages were applied following a careful procedure of surface preparation and cleaning to achieve the best bond possible between the gages and the instrumented steel sections. The steps followed during strain gage application are detailed in the flowchart presented in Figure 4.25.
41

Prepare surface using grinder and sanding discs
I Mark strain gage
location using scriber
I Lightly sand surface to remove any protrusions
I Clean surface using acetone
I Apply catalyst to
strain gauge
I Apply adhesive to gage
area and install gage
I Use heat gun to ensure good
bond achieved
I Check gage resistance
using voltmeter
I Apply wax and silicone
for protection
Figure 4.15 Strain Gage Application Procedure
4.5 Protection System
The adhesive used to bond the gages to the steel sections is susceptible to degradation from moisture. Direct contact with moisture from precipitation or even the humidity in the air will eventually degrade the bond. Therefore it is important to adequately protect gages in field installations from the weather immediately after the gages are installed. All gages could experience light abrasion from construction workers during bridge construction, but certain gages were very susceptible to damage from foot
42
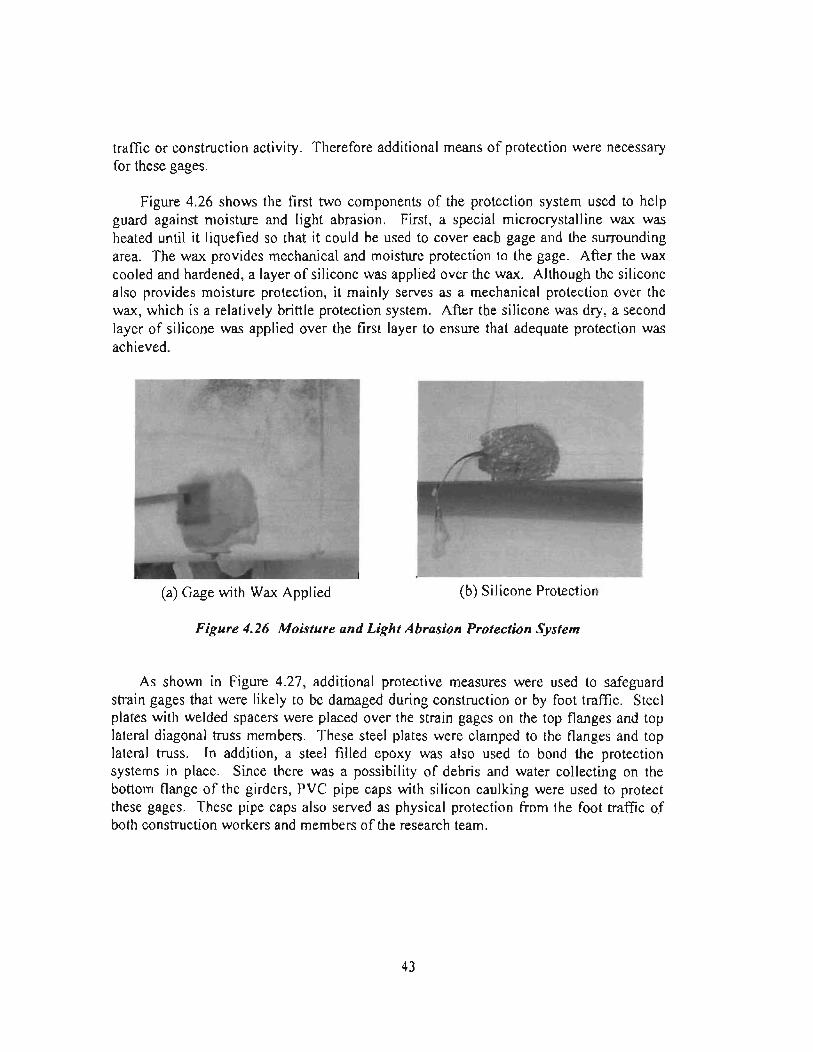
traffic or construction activity. Therefore additional means of protection were necessary for these gages.
Figure 4.26 shows the first two components of the protection system used to help guard against moisture and light abrasion. First, a special microcrystalline wax was heated until it liquefied so that it could be used to cover each gage and the surrounding area. The wax provides mechanical and moisture protection to the gage. After the wax cooled and hardened, a layer of silicone was applied over the wax. Although the silicone also provides moisture protection, it mainly serves as a mechanical protection over the wax, which is a relatively brittle protection system. After the silicone was dry, a second layer of silicone was applied over the first layer to ensure that adequate protection was achieved.
(a) Gage with Wax Applied (b) Silicone Protection
Figure 4.26 Moisture and Light Abrasion Protection System
As shown in Figure 4.27, additional protective measures were used to safeguard strain gages that were likely to be damaged during construction or by foot traffic. Steel plates with welded spacers were placed over the strain gages on the top flanges and top lateral diagonal truss members. These steel plates were clamped to the flanges and top lateral truss. In addition, a steel filled epoxy was also used to bond the protection systems in place. Since there was a possibility of debris and water collecting on the bottom flange of the girders, PVC pipe caps with silicon caulking were used to protect these gages. These pipe caps also served as physical protection from the foot traffic of both construction workers and members of the research team.
43

(c) Bottom Flange Protection
Figure 4.27 Strain Gage Protection Systems
4.6 Data Acquisition
A wireless data acquisition system which operates in the 900 MHz frequency range was used to acquire data from the strain gages. The main advantage of using a wireless data acquisition system is that it was not necessary to run wires between the desired instrumentation locations, which were spread out inside both box girders as well at locations outside the box girders on the external cross-frame and solid diaphragm. It would not have been possible to record erection data with a traditional data acquisition system with wires running between the various instrumentation stations. In addition, the wires of systems used in past field projects have proven vulnerable to damage during construction activities.
Invocon, Inc., a research and development company based in Conroe, TX, manufactured the wireless data acquisition system used in this project. The system was based on an architecture developed for the National Aeronautics and Space Administration (NASA). The components of the system, depicted in Figure 4.28, include individual sensor units that are attached to each strain gauge, relay units, and a receiver unit that is attached to a notebook computer. The basic operation of the system includes wireless transmissions between the sensors and the relay/storage unit and transmissions between the relay unit and a notebook computer, as depicted in the figure. The sensors
44

and relay units remain on the bridge at all times while the notebook computer is only brought to the bridge site as needed to download data. A total of 112 sensors were installed at the various gage locations at the previously defined Stations D, K, 1, and 2. The data from the sensors were received and stored in three relay units.
Figure 4.28 Data Acquisition System Operation
The various components of the data acquisition system are shown in Figure 4.29. Sensor units, like that shown in Figure 4.29a, were attached directly to each individual strain gage through the connector shown in the figure. The sensors were individually powered by long-life lithium battery packs, and each sensor was potted in a tough, plastic coating to provide protection from weather and potential damage from physical contact. The antennae wire used in transmitting and receiving the 900 MHz signals protrudes from the potting material. Each sensor unit contains three completion resistors that form a full bridge when attached to a strain gauge. The sensor units also include Resistance Temperature Detectors (RIDs) for monitoring the temperature at each sensor. Each sensor unit has a unique identification number programmed by the system manufacturer so the captured data can be affiliated with the correct sensor. The sensors do not have any onboard memory for storing readings; they simply record a strain gauge reading on a programmed schedule and then transmit the reading to a relay unit.
45

(c) Notebook Computer and Receiver Unit
Figure 4.29 Wireless Data Acquisition System
The relay unit was also potted for protection and the potted relay unit was about the size of a hockey puck. The relay unit has an integrated antenna and a detachable receiver unit with antenna as shown in Figure 4.29b. Each relay unit is powered by an extended life lithium battery pack. The detachable receiver unit is used for communication between the relay unit and the sensors. The integrated wire antenna is used for communication between the relay unit and a notebook computer. The relay unit has 2 megabytes of memory for storing the strain and temperature readings transmitted to it from the sensors. A total of three relay units were used to monitor the gages on the bridge. Multiple relay units were required since the 900 MHz wireless transmissions essentially require line-of-sight, and therefore sensors inside a box girder could not be adequately monitored by a relay outside the box girder, or vice versa. One relay was placed in each box girder to collect data from all the sensors contained in that girder. A third relay was placed on the exterior solid diaphragm at Bent 23 to store data from the sensors that were mounted outside of the box girders, namely those on the solid diaphragm and external K-frame.
The data acquisition system also included hardware and software that were installed on a notebook computer. A special receiver unit that enabled the notebook computer to
46

communicate with the relay unit was connected to the computer's serial port as shown in Figure 4.29c. Data acquisition software used for programming the relay as well as downloading data from the relay was installed on the notebook computer. The software was used to select the desired sample rate, which was then transmitted to the sensors via the relays. The software could be used to select a variety of sample rates ranging from 1 sample every 16 seconds to 1 sample every 60 minutes. During faster construction events, the sensors were set to transmit readings more frequently. During days when the girders were subjected to slower events, such as regular daily thermal cycles, the sensors were set to transmit readings on a slower schedule, so that the relay unit's memory was not filled as rapidly.
4.6.1 Calibration of Data Acquisition System
To ensure the wireless data acquisition system was working properly, all of the sensors were calibrated. Each sensor was connected to a strain gage calibrator capable of producing prescribed strain levels and the data acquisition system was configured to collect readings from the sensors. The strain gage calibrator was then switched to produce strains of 0 J..I.E, 250 J..I.E, and 500 J..I.E. Then the measured strain level in each sensor was compared to the calibration value. Table 4.2 shows typical data collected from one of the sensor units during sensor calibration. The sensor calibration showed that the data acquisition system accurately measured the strain levels. All sensors used on the bridge were checked using the strain indicator calibrator to ensure each sensor functioned properly.
Table 4.2 Calibration Data
Sensor Date Time Strain (w;:) 12/13/01 17:17 o.o· 12/13/01 17:18 0.0 12/13/01 17:19 0.0 12/13/01 17:20 250.4
20 12/13/01 17:21 250.4 12/13/01 17:22 250.4 12/13/01 17:23 248.4 12/13/01 17:24 501.0 12/13/01 17:25 499.0
The results from the calibration tests of the sensors were valuable since they provided an indication of the sensitivity or resolution of the individual sensors. A 2.0 J..1.E variation can be seen in the data of Table 4.2 for a given strain input. The reading for Sensor 20 changes from 250.4 J..I.E at 17:22 to 248.4 J..I.E at 17:23, even though the strain in the calibrator was held constant at 250 J..I.E. This strain variation represents the smallest increment of strain that can accurately be measured by the data acquisition system. Thus,
47

the resolution of the system is ±2.0 !!S· When converted to stress and adjusted for the gage factor, the resolution becomes ±0.05 ksi. Thus the measurements taken with the wireless data acquisition system were accurate to approximately ±0.05 ksi. The next chapter of this report will document the field data collected from the instrumented bridge using the wireless data acquisition system.
48
Chapter 5
Comparison of Field Measurements with Finite Element Model
5.1 Introduction
The results presented in this chapter focus on the behavior of the instrumented bridge during the box girder erection, concrete deck casting, and live load tests. The box girder was erected in five lifts from February 9 to March 6, 2002. The concrete deck construction occurred over a three-day period from June 5 to June 8, 2002. The live load test was conducted twice; once on October 16, 2002 while the external K-frames were still in place on the bridge and then again on October 25. 2002 after the instrumented external K-frames were removed. The complete results from the field measurements have been presented in Milligan (2002), Muzumdar (2003) and Bobba (2003). This chapter will not focus on a complete presentation of the results but instead focuses on key results that demonstrate the accuracy of the finite element analytical (FEA) models that will be used in the parametric studies presented in Chapter 7. The following discussion utilizes the nomenclature for instrumentation locations established in the previous chapter.
5.2 Girder Erection
5.2.1 Erection Sequence
The lengths of the girder segments that could be shipped to the site were limited by transportation restrictions; however individual segments were spliced on the ground on site so that the girder erection could be completed in five stages. All erection stages were scheduled during daytime periods from approximately 7:00am to 5:00pm. Since some portions of the bridge crossed over Highway 59 and required closure of this highway, erection of these segments was conducted on weekends to avoid significant workday traffic delays.
The erection sequence is presented in Figure 5.1 along with the approximate segment length for each lift. The segment length shown is an average of the interior and exterior girder segment lengths. The erection sequence started at Bent 23 and progressed until completion at Bent 18. The erection of the girders was completed in 3.5 weeks as shown in Table 5.1. All of the lifts were completed in one day except for the last lift, which took two days to complete due to connection problems. The following discussion will focus on a comparison of analytical and field results for the first two lifts, Lifts 1 and 2, since the construction activity associated with Lifts 3, 4, and 5 took place further from the instrumented sections and generated small to negligible changes in the strain gauges.
49

Lift I - 218' Lift 2- 248' Lift 3- 252' Lift 4 - 243' Lift 5 - I 06'
1 I l ll 23 22 21 20 19 18
Figure 5.1 Erection Sequence
Table 5.1 Girder Lifts
Lift Date Segment Length (ft.) 1 February 9, 2002 218 2 February 14, 2002 248 3 February 16, 2002 252 4 March 2. 2002 243
5 March 5, 2002 through
106 March 6, 2002
A very difficult aspect of comparing field results with FEA solutions is accounting for the effects of thermal stresses on field data, particularly when the construction or live load event takes place during daylight hours. Substantial thermal stresses often result in the girders and bracing members due to thermal gradients along the length and width of the bridge. In addition, the supports often provide restraints that limit the thermal movements of the girders; however exactly modeling the true boundary conditions for thermal movements is complicated. As a result of the complex thermal stress distributions in the bridge, obtaining the stress change due to a particular construction event for comparison with FEA results becomes complicated, since the measured stresses include both the construction and thermal stresses.
Different approaches were investigated to isolate the construction stresses from the total stress that was measured. In the final approach used to isolate construction stresses from thermal stresses, the data from the early morning hours before and after a construction event were considered. By selecting early morning hours, the effect of direct sunlight on the girders was eliminated and the bridge had sufficient time to stabilize from the thermal gradients caused by uneven heating from the previous day. Accordingly, the change in stress from approximately 02:00 the morning before a construction event to approximately 02:00 the morning after a construction event was determined. Provided that the temperatures at these two times were similar, the difference in the data at these two times was purely the stress change from the construction event. On days when the temperature was slightly different at 02:00 from the previous day's temperature, another early morning time was selected based upon the
50

ambient temperatures before and after the construction event. This procedure worked well for all sequences of girder erection and subsequent construction events. After an event stress from the field data was isolated it could then be appropriately compared to analytical results.
5.2.2 First Lift
The erection procedure began with the interior girder (Girder I), which was lifted from the ground at 10:30 and released on the pier at approximately 13:00. Once on the pier, Girder I was secured with chains and blocks under the solid diaphragms so that the cranes could be released to pick up the exterior girder (Girder E). Girder E was lifted from the ground at 13:30 and released at 15:45. A number of bolts were then insta11ed between the diaphragms and the exterior girder to stabilize the twin girder system. The cranes were used to adjust the position of Girder E as needed to facilitate installation of the bolts.
Figure 5.2 shows the stress measurements in the interior girder at Station 1 during the first stage lift. Noticeable stress jumps occurred at approximately 10:30 and 13:00. These changes, as labeled in the figure, correspond with the lifting of the girder (ILinterior lift) and the releasing of the girder onto the piers (IR-interior release). Similar results were observed during Lift 1 at Station 2 for the interior girder as well as at Stations 1 and 2 in the exterior girder. For the purposes of comparing the field measurements and the FEA results it was difficult to assess the state of stress while the girders were on the ground. Therefore the state of stress was determined based upon the change in girder stresses during the release of the girders from the cranes. The location of the crane lifting points were recorded and the FEA comparisons were based upon the change in stresses between when a girder was supported by the crane and when it was put on the supports.
51

5 ~~~··~~~~--~~~~~~~~~~~~~~~~~~~
4 ~~~-···········~~~~~~~~··············~~~··~~~4-~~~··· -~~~~~~
3 t--~~~-
2~~~~~~~~~~~···~~----~
-1 'iii ~0 II)
= -1 ... -(/) -2
-3 t-----~~~-
-4
-5 ~~~~···~-~~-~···············~~~··~~-1-~~~~------------------~
-6~-···············~-~-------~------~~~~~~ ....... ~
-?~-------··-~---~~~~~~====~ -8 ~-··~ .. ~--··········~-----~··············------················--------
Figure 5.1 Stress Development in Flanges during First Lift at Girder I Station 1
Figure 5.3 shows a comparison of field data and FEA results for the first lift of the interior girder. Results from the field monitoring are shown in bold. With the exception of the results shown in the boxes, the units of the measurements presented are in ksi. The results shown in the boxes give member forces for the angles and WT sections in units of kips. The regression method outlined by Helwig and Fan (2000) was used to determine the member forces from the strain gage data. A discussion of the regression method is presented in the appendix. Some of the gages or sensors during the lifting did not provide data and are shown with an N/ A in the figure. There is a reasonable agreement between the FEA results and the field data. The largest difference between the field data and the FEA results occurred in the member forces of the angles forming the internal Kframe. The reason for the large difference is most likely due to the resolution of the instrumentation and the complex behavior of the angle members, which have eccentric connections. As outlined in the last chapter, the resolution of the sensors was approximately 0.05 ksi. When this resolution limit is combined with the complex bending behavior of the angles, larger discrepancies between FEA and field results are more likely, particularly at such low stress levels as those measured during erection.
52

-5.5 -5.4 -4.3 -5.7
(46)
-0.6 -1.3 (50) (55)
(51) (54)
-07 -1.1~ • -7.3kios (52) (53) 0.1 0.2 -6.0 -5.7 -9.0
-6.4
I Station 1 I
(44)
-5.9 NIA
(49) (41)
FIELD DATA IS IN BOLD;
UNITS ARE IN KSI llNLESS
OTHERWISE SPECIFIED
-1.7 -2.5 (23) (24)
(22) (25) -1.5 -2.4
-6.3 (21) (26) 1.0 0.8
-7.6
(16)
Figure 5.3 Field Data and FEA Results for Girder I at Release
-7.9 -8.4 -8.4 -8.5
Comparisons of field and FEA results for the exterior girder during the first lift are shown in Figure 5.4. Three of the four gauges on the bottom flange did not provide data as shown by theN/A labels. The problems with many of the troubled sensors were fixed after girder erection prior to subsequent construction events. The comparisons between the FEA results and field data for the exterior girder showed agreement comparable to those observed for the interior girder.
53

-6.0 -4.3
(87)
-1.0 -0.9 (96) 91
(95) (92) -0.8 -0.8 --t>
-5.5 (94) (93)
-6.3 0.1 0.2 -4.7 -5.7
I Station 1 I
(17) (86)
-1.9 -2.3 (66) (65
(67) (64) -1.5 -2.1
-6.1 -8.8 -7.2 (68) (63) 0.8 0.7
-4.5 -8.0 -6.2
(90) (58)
FIELD DATA IS IN BOLD;
UNITS ARE IN KSI UNLESS
OTHERWISE SPECIFIED
I Station 21
(56) (57)
-J!fj (!:: (8 - 4) -0.7 (81)
-8.5 -7.5
Figure 5.4 Field Data and FEA Results for Girder Eat Release
-8.4 -7.8
The comparisons between the FEA and field results generally showed reasonable agreement. Simulating the exact boundary conditions in the FEA models for the first erection stage was difficult since the torsional restraints provided by the combination of the wood blocking under the diaphragms as well as the chains and cables is difficult to simulate. However, the FEA model generally showed the same trends as the measured field data for the girders and their internal elements. Comparisons of the FEA and field data for the external K-frames did not produce significant results since although the external K-frames were installed using the erection bolts, the welding of the K-frames were not completed until all five spans of the bridge had been fully erected. In most instances only 2 of the 4 erection bolts were installed in the external K-frames due to fitup problems. The instrumented K-frame had the two bolts at the ends of the top chord installed; however the bottom 2 bolts were left out. The comparison of the FEA and field results for the instrumented external K-frame in later events, after the K-frames were welded into place, will be discussed in subsequent sections of this chapter.
54
5.2.3 Second Lift The second lift was conducted on February 14, 2002 starting at 08:30 and ending at
approximately 18:00. Two girder sections, each approximately 248 feet long, were erected and spliced to the interior and exterior girder segments erected during the first lift. As shown in Figure 5.1, the first lift cantilevered over Bent 22. The segments erected in the second lift completed the span between Bents 22 and 21, and cantilevered approximately 90 feet past Bent 21.
The interior segment was lifted from the ground at 08:30 and suspended in the air for a couple ofhours. The splicing began at 11:15 and finished at approximately 12:50. The addition of this segment caused a stress change in the instrumented segment previously erected on February 9, 2002. The data was monitored for the whole splicing and releasing procedure at a 4-minute sample rate. Thermal effects were accounted for using the method previously outlined in Section 5.2.1.
As mentioned in the last section, typica1ly only the 2 erection bolts at the ends of the top chords of the external K-frames were installed during the first lift. Although the bottom chords of the external K-frames were not connected to the webs of the girders, the top chords of the K-frames and the solid diaphragms at the supports still tied the interior and exterior girders together. Thus the splicing and release of the interior girder resulted in stress changes in the instrumentation in both the interior and exterior girders. As will be shown, the magnitudes of the stress changes were in the range of 2 to 3 ksi, much less than the -9.0 to 9.0 ksi stress changes measured in the first lift.
Figure 5.5 shows the stress change in the interior box girder at Station 2 during the second lift. The approximate times at the beginning of the splicing operation and the crane release are indicated by IS, IR, ES, and ER in the figures where I indicates the interior girder, E indicates the exterior girder, and S and R represent the start of the splicing operation and the release from the cranes, respectively. For example, IR represents the approximate time that the interior girder was released from the crane. Sensor 16 malfunctioned during the lifting procedure and therefore does not have a line on the graph. The fluctuations in stresses during the splicing procedure are from variations in loads from the cranes to the box girders while the splices were being completed. As the crane was used to hold the girders during the splicing operation, an upward load was typically applied to the end of the cantilevered section erected in Lift 1. This therefore resulted in compression in the bottom flange and tension in the top flange at instrumented Station 1. The stresses were then reversed when the girders were released. Similar results were observed at the other instrumented stations in the twin box girder bridge.
55

6
4
-2 'iii ~ -:2 ! -cno
10 00
-2
-4
41\18 19T20
~
Figure 5.5 Stress Development in Flanges during Second Lift at Girder I Station 2
Figure 5.6 shows the comparison of field data and FEA results for the interior girder during the second lift. The presented data shows the stress change after erection of both the interior and exterior girder segments in the second lift after isolation of thermal effects. There was generally good agreement between the FEA model and the field results, particularly for the girder stresses. The forces in the bracing members also showed reasonable agreement between the FEA and field results, however, as with the first lift, the low stress levels often led to some difficulty obtaining consistent estimates of the member forces. Similar agreement was obtained between the comparisons of the FEA solutions and the field results for the exterior girder as shown in Figure 5.7.
56

0.4 0.5 N/A 0.9 (50) (55) (23) (24)
(51) (54) (22) (25)
-0.7 -1.1.....;:> <::!==== 0.6 0.5
1.3 1.4 (52) (53)
1.5 1.4 2.2 1.8 (21) (26)
2.3 2.0 -0.2 -0.2 -0.1 -0.2 0.9 1.3 1.7 1.7 1.6 1.6 2.9 2.2
(46) (49) (41) (20)
I Station I I FIELD DATA IS IN BOLD;
I Station 2 I UNITS ARE IN KSI UNLESS
OTHERWISE SPECIFIED
(44) (16)
Figure 5.6 Field Data and FEA Results for Girder I in the Second Lift
57

1.5 1.3
(87)
0.5 0.6 (96) 91
(95) (92) 0.4 0.7 --c>
1.6 (94) (93)
1.6 -0.2 -0.2 1.6 1.8
I Station 1 I
(17) (86)
1.6 2.3 1.6 2.3
(90) (58)
FIELD DATA IS IN BOLD;
UNITS ARE IN KSI UNLESS
OTHERWISE SPECIFIED
0.7 0.4 (66) (65)
(67) (64)
<1-- 0.4 0.3
1.9 (68) (63)
2.5 -0.2 -0.2 2.0 2.6
I Station 2 I
(56) (57)
Figure 5. 7 Field Data and F EA Results for Girder E in the Second Lift
2.1 2.2
(62)
Since the external K-frame was not fully connected during the girder erection, meaningful data was not obtained from it during the erection operation. As mentioned in the last section, the external K-frame connections were not welded until after the five spans of the steel girders had been fully erected. Comparisons between the FEA solutions and the field measurements for the external K-frame will be made for later events.
The solid diaphragm at the skewed support, Station D, was also instrumented. However, since there were full depth interior and exterior solid diaphragms separating the instrumented solid diaphragm at the dapped girder end from the additional segments, the stress changes in the instrumented solid diaphragm from the second lift were very low. A comparison of field and FEA results at Station D for the second lift are shown in Figure 5.8. Both the field and FEA data show very similar results with measured and predicted stresses less than 0.2 ksi. As discussed in Chapter 4, the resolution of the instrumentation is ±0.05 ksi, so these small stresses were quite close to the resolution of the instrumentation system.
58

0.1 ksi Field data bolded I -0.1 ksi r::::::3 ~
0.1 ksi
~ 0.2 ksi
Girder I
Rosette -0.1 ksi 0.1 ksi
r::::::3 ~
0.1 ksi -0.2 ksi
(J X
0.1 ksi ± 0.0 ksi
(Jy -0.2 ksi ± 0.0 ksi
txy -0.1 ksi ± 0.1 ksi
Figure 5.8 Stress Development in the Solid Diaphragm during the Second Lift
5.3 Concrete Slab Construction
After the erection process was complete, the external K-frame connections were welded, and the permanent metal deck forms (PMDF) and deck reinforcing steel were installed. The concrete deck was then placed in three stages as shown in Figure 5.9. The first stage of the concrete deck placement was divided into three phases beginning at Bent 23 in the vicinity of the instrumented stations. This was followed by concrete placement at the other end of the bridge at Bent 18. The last phase of the first stage was in the positive moment region of the span adjacent to the instrumented span. Stages 2 and 3 also were divided into multiple phases. Table 5.2 shows that the concrete placement for the entire bridge was completed in slightly more than three days. Stages 1 and 3 were conducted during the daytime, while Stage 2 was completed at night and in the early morning to minimize traffic interruption since Highway 59 had to be closed for this cast directly overhead.
The concrete placed during Stages 2 and 3 resulted in relatively small stresses at the instrumented regions of the bridge. The reason for the smaller stress measurements in Stages 2 and 3 is primarily due to two factors: the composite interaction between the steel girders and concrete placed during Stage 1, as well as the greater distance of later concrete casts from the instrumented locations. Although the concrete placed during Stage 1 was only 1 or 2 days old during later casts, the stiffness of the concrete picks up relatively quickly as outlined by Cheplak (2001) and as also will be shown in the results
59

from this study. The resulting composite behavior due to the relatively large stiffuess of the fresh concrete results in low stresses in many of the gages in the bracing members since the neutral axis of the composite section is close to the top flange of the girders. As a result of the lower stresses during Stage 2 and 3, the comparisons between the field measurements and the FEA solutions will focus on the first stage of the concreting.
Bent 23
Bent 23
Bent 23
1A 123'
22
2D 85'
22
22
1C 102'
21
2C 113'
21
-+----21
1st stage
2nd stage
2B 174'
3rd stage
20
20
20
2A 161'
Figure 5.9 Concrete Casting Sequence
60
19
19
3A 95'
19
1B 75'
18
18
18

Table 5.2 Concrete Casting Schedule
Stage Date Segment Start Time End Time 1A 07:00 08:05
1 6/5/02 lB 09:20 10:10 1C 10:40 11:55 2A 20:35 22:09
2 6/6/02 - 617/02 2B 22:35 00:25 2C 00:45 01:55 2D 02:20 03:00
3 6/8/02 3A 06:35 07:35 3B 08:45 10:12
The first phase of the Stage I concrete placement began at 07:00 and finished at 08:05. Thermal effects during the cast were isolated using the method outlined previously. As expected, the Stage lA concrete placement resulted in the largest casting stresses at the instrumented portions of the bridge since the concrete was placed directly over the instrumented sections in this cast. The Stage 1 B cast caused only minor changes in the gages due to the large distance of this cast from the instrumented locations.
Figure 5.10 and Figure 5.11 show the stress changes in the box girder flanges and top lateral truss at Station 1 for the interior girder during the Stage 1 placement of the concrete. The graph of the stress changes in the girder flanges show that the Phase lA placement caused the largest stress changes in the instrumentation. The placement of the Phase 1B concrete produced negligible changes at the instrumented locations (near Bent 23) since Phase 1B consisted of a cast at the far end of the bridge adjacent to Bent 18. There was a measurable change in stress during the Phase 1 C concrete placement; however, the change was substantially less than that experienced in Phase 1A. The Phase 1 C induced stresses caused a reduction in the total stress near Bent 23 since the sense of bending produced at the instrumented regions were opposite for the Phase 1 A and 1 C casts.
Like the girder flanges, the top lateral truss diagonal showed a noticeable change in stress during the Stage 1 A cast, however, the curves were not as smooth for the truss members and the stress magnitudes are substantially smaller than the girder stresses. There was a noticiable spike in the diagonal stresses at approximately 07:15, which corresponded to the time that the concrete was placed directly over the diagonal member. The stress measurements at the other stations exhibited similar behavior as those shown for Station 1 of the interior girder.
61

10 ~------------------------------------------------44
_2.5 1--······--------1'----- ································------------········--- ------1-------1
~ ~ 1-8 .. 1 1-C -= 0 ~----~~-----+------~------+-----~~----~--~ ! 6· ... 8:00 9:00
~2.5
49
48 End of Cast
47 -10 ~-··············--------··············------ _________ ---!
Figure 5.10 Stress Development in Flanges during Cast Stage 1 at Girder I Station 1
52 1
-~0 ~~~~~~---+------~------~~£_~+-.~---4~---= 6: e Ci)
-2
8:00 9:00
1-C
1 :00
End of Cast
.. I
50 55
51 ,153 54
-3 ~-··············· -·········----·····························---------------------~
Figure 5.11 Stress Development in Diagonal during Cast Stage 1 at Girder I Station 1
62
A summary of the FEA and field data results for the girder stresses and the diagonals ofthe top lateral truss during Phase lA of the concrete placement are presented in Figure 5.12 and Figure 5.13 for the interior and exterior girders, respectively. Overall, there is excellent agreement between the FEA results and the field measurements on these members. One exception is the diagonal of the top lateral truss of the exterior girder at Station 2. The reason for the poor agreement in this particular member is not clear. The measured stresses in the flange of the WT section at Station 2 of the exterior girder are very similar to those at Station 2 of the interior girder. The corresponding stresses in the stems between the two girders at Station 2, however, are substantially different. If one of the gages on the stem was not well bonded, the force in the diagonal that results from the regression analysis would be off. For example, if the stem experienced lateral bending and one of the gages was not well bonded, the regression would not offset the bending effect and therefore a lower force would be extrapolated from the gage data. Although the forces predicted for this one diagonal did not show good agreement with the field measurements, the close agreement between the remainder of the field data and the FEA stresses show that the FEA model provided good estimates of the girder behavior during the Stage I A concrete cast.
Figure 5.14 and Figure 5.15 show graphs of the stress development at the strain gage locations on a diagonal and strut ofK-1 (the interior K-frame of the interior girder) during Stage 1 of the concrete placement. Similar to the stresses in the girder and top truss diagonal, the Phase lA concrete placement caused the largest stresses, particularly in the top strut ofthe K-frame. The stresses in the diagonals of the K-frame were significantly smaller than those in the top strut diagonals, which implies that distortional-induced forces were probably relatively small. The forces in the top strut ofthe internal K-frame were mainly caused by the torsional and bending behavior of the box girder since the strut is part of the top flange lateral truss system. Since the forces in the K-frame diagonals continued to increase after the concrete placement was completed, much of the force in these members is probably due to thermal effects on the bridge. The stresses and member behavior in the other elements of this K-frame and the members of the internal K-frame in the exterior girder exhibited similar behavior.
63

-1.3 (50)
(51)
-1.0
(52) -7.5 -8.9 0.9 -5.8 -9.6
(46)
I Station I I
(44) (45)
-9.3 -9.1
-7.9 -8.9 -7.9 -7.6
(49) (41)
FIELD DATA IS IN BOLD;
UNITS ARE IN KSI UNLESS
OTHERWISE SPECIFIED
-1.9 -2.3 (23) (24)
(22) (25)
<J---1.5 -2.2
(21) (26) -9.4 0.6 0.6 -10.7 -8.8
-11.3 N/A -8.7
(20)
I Station 21
10.2
(15) (16)
Figure 5.12 Field Data and FEA Results for Flanges and Top Lateral Truss of Girder I during Cast 1A
-1.5 -1.3 (96) (91)
(95) (92) -1.5 -1.3 --[;>
(94) (93) -8.2 -9.5 0.7 0.8 -10.3 -7.2 -9.8 -9.9
(87)
I Station I I
(17) (86)
-8.8 -9.5 -7.6 -9.0
(90)
FIELD DATA IS IN BOLD;
UNITS ARE IN KSI UNLESS
OTHERWISE SPECIFIED
-9.9 -9.7
-1.6 (65)
(64) -1.7
I Station 2 I
(56) (57)
-11.6 -9.5 -11.5 -8.7
(62)
Figure 5.13 Field Data and FEA Results for Flanges and Top Lateral Truss of Girder E during Cast 1A
64

-~ -II) II)
f -U)
10
8
6
4
2
-4
6/5/02 3:30
31 32
34
33
31
32
~ c
6/5/02 21:00
6/6/02 0:30
34 33
6/6/02 4:00
Figure 5.14 Stress Development of the Outside Strut of K-1 for Stage 1
10
8
-~ 4 -
-4
~----~3-8~37~~~--c~
6/5/02 3:30
: 1-A :1-s:1-c: 14 ............ 1 I I I
6/~02
35
6/5/02 14:00
6/5/02 17:30
6/5/02 21:00
6/6/02 0:30
6/6/02 4:00
Figure 5.15 Stress Development of the Inside Diagonal of K-1 for Stage 1
65

Figure 5.16 shows a comparison between the forces in the internal K-frames extrapolated from the field data and those produced using the FEA models during the Phase 1 A placement of the concrete. The FEA results generally underpredicted the forces in the top struts and overpredicted the forces in the diagonals of the K-frames. Since the FEA solution had reasonable agreement with the measurements for the diagonals of the top flange truss, the source of the difference is probably not related to the modeling of the braces on the girders. The difference is more likely related to the modeling of the load application to the twin box girders, which will be further discussed after results from the external K-frame are presented.
Girder I
FIELD DATA IS IN BOLD;
UNITS ARE IN KSI UNLESS
OTHERWISE SPECIFIED GirderE
0.3 ! 0.3 ~)(83)
L.::IIA...(84) -0.4 (81)
* Poor agreement
Figure 5.16 Comparison of Field Data and FEA Results for Internal K-Frames during Concrete Cast JA
Figure 5.17 through Figure 5.19 show the respective behavior of the top strut, the interior diagonal, and the exterior bottom strut of the instrumented external K-frame during the Stage 1 placement of the concrete deck. Although there was a problem with one of the sensors on the interior bottom strut, the behavior of the other strut and diagonal were similar to the presented results. As was seen for the other instrumented elements, the largest forces in the external K-frame during the concrete cast generally occurred during the Phase 1 A placement, however, there was a difference between the stress gains in the top strut relative to that in the diagonals and bottom struts. The diagonals and bottom struts tended to pick up forces in a relatively "linear" fashion during the entire Phase lA concrete placement and continued to develop stress after this particular concrete placement phase was completed. The latter stress development was most likely due to thermal effects.
66

5
4
3
2 -'iii .ll: -II) II)
f -tn 0
-2
-3
I I I I I I I I I 1-A 11-811-C1 lo~~ .. ~ .. ..-:• .. I
I I I
6/5(02 :6/5{02 I 7:@>0 110:60 I
1-----·---+-----1----l-......... -.-
6/5/02 6/5/02 14:00 17:30 ---
1 I ...... --~~~ ...... --.. ~ .. --' -v
6/5/02 21:00
6/6/02 0:30
97
99
6/6/02 4:00
Figure 5.17 Stress Development of the Top Chord of the External-Kfor Stage 1
102
3
2
101
-2
-3
: : ······~:-~: ··~·-- ...... --··~ --~c~c~V I 1-A 11-811-CI I. ..~ ....... 1
_ ............ _~······: : I __ ...... ----c7".r=:.""'-....... ______ _
I I I I I
6/6/02 4:00
Figure 5.18 Stress Development ofthe Interior Diagonal of the External-Kfor Stage 1
67

-! Ill Ill I!! -tn
5 I
I 1-A 118 :•
4 I
115 117
3 116
2
0
I I I
11-Bi1~C: .. : .. --: .. .. I
I
6/6/02 6/6/02 0:30 4:00
ci£2_ ~
-3 ~~---·························-~~~~······· -~~~~--··································~~~~················~···· -
Figure 5.19 Stress Development of the Exterior Bottom Chord of the External-K for Stage 1
As noted the diagonals and bottom struts tended to pick up forces in a relatively linear fashion during the entire Phase 1 A cast, but the stress that was accumulated in the top strut developed very quickly while the concrete was being placed in the vicinity of the brace between 07:00 and 07:30. Referring back to Figure 5.14 and Figure 5.15, which show the behavior of a top strut and diagonal of the internal K-frame in the interior grider, a similar trend in stress development is seen. The top struts attracted the most force as the concrete was being placed directly over the brace, and the stress in the diagonal increased in a relatively linear fashion over the entire Stage IA event. This response will be discussed in more detail in following sections.
Figure 5.20 shows a comparison of the FEA solutions and data from the field measurements for the external K-frame during the Stage 1 concrete placement. There is generally good agreement between the measured and predicted values for the two diagonals and one of the bottom struts. The bottom strut results that have been marked with an asterisk are relatively poor, however, since one of the gages on the bottom of the strut was lost the accuracy of the field data for these members is somewhat questionable. Because of the missing gage it is not possible to properly account for the bending effects about the strong axis, and the bending effects about the weak axis actually cancel out.
68
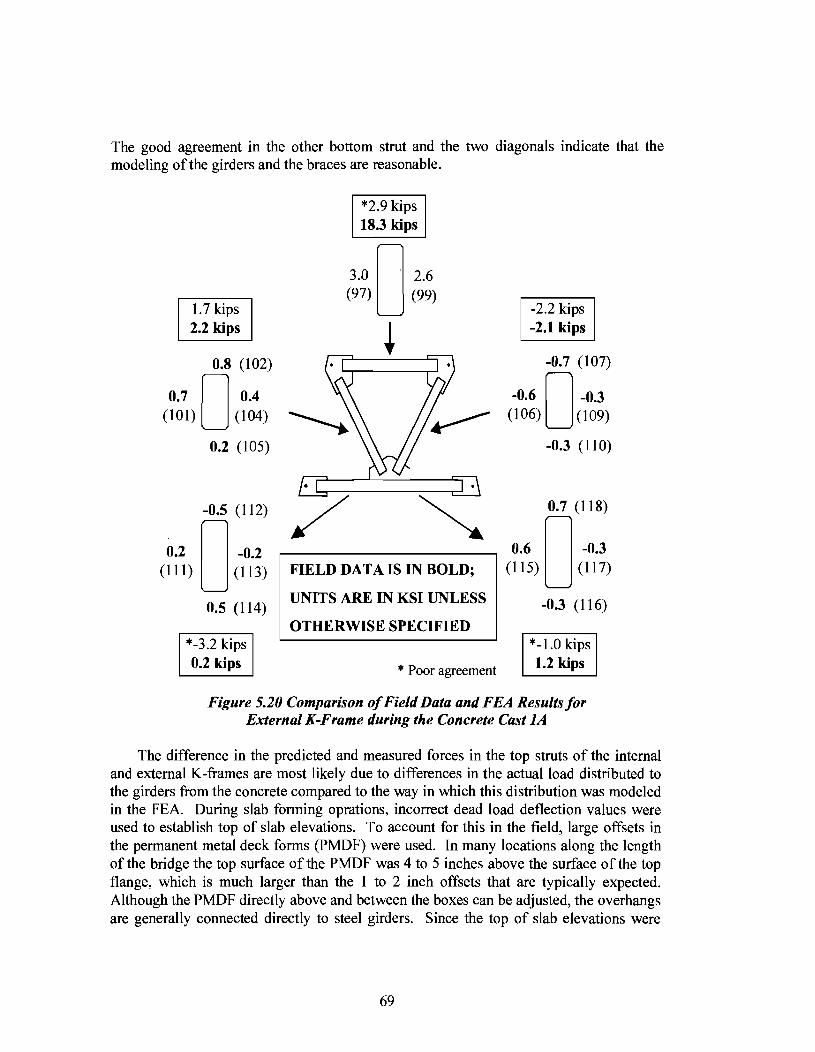
The good agreement in the other bottom strut and the two diagonals indicate that the modeling ofthe girders and the braces are reasonable.
1.7 kips 2.2 kips
0.8 (102)
0.7 0 0.4 (101) (104)
0.2 (105)
-0.5 (112)
0.2 0 -0.2 (Ill) (113)
0.5 {114)
*-3.2 kips 0.2 kips
*2.9 kips 18.3 kips
3.0 0 2.6 (97) (99)
~
FIELD DATA IS IN BOLD;
UNITS ARE IN KSI UNLESS
OTHERWISE SPECIFIED
* Poor agreement
-2.2 kips -2.1 kips
-0.7 (107)
-0.6 0 -0.3 (106) (109)
-0.3 (110)
o.6 Do. 7 (~:~: (115) (117)
-0.3 (116)
*-1.0 kips 1.2 kips
Figure 5.20 Comparison of Field Data and FEA Results for External K-Frame during the Concrete Cast JA
The difference in the predicted and measured forces in the top struts of the internal and external K-frames are most likely due to differences in the actual load distributed to the girders from the concrete compared to the way in which this distribution was modeled in the FEA. During slab forming oprations, incorrect dead load deflection values were used to establish top of slab elevations. To account for this in the field, large offsets in the permanent metal deck forms (PMDF) were used. In many locations along the length of the bridge the top surface of the PMDF was 4 to 5 inches above the surface of the top flange, which is much larger than the 1 to 2 inch offsets that are typically expected. Although the PMDF directly above and between the boxes can be adjusted, the overhangs are generally connected directly to steel girders. Since the top of slab elevations were
69

above the planned location, the overhangs were probably on average 1 to 2 inches thicker than they should have been. As a result the larger overhangs resulted in an outward torque on the exterior girder and an inward torque on the interior girder such as that shown in Figure 5.21. Because of these torques, additional tension developed in the top struts of the K-frames, which extend across the width of the bridge. The thicker overhangs were not included in the analysis and as a result there is a large difference between the predicted and measured results for the top struts of the K-frames.
PMDF
Figure 5.21 Deformation of Bridge Section Due to Construction Facility Load
Figure 5.22 and Figure 5.23 show the variation in the stresses in the uniaxial gages on the solid diaphragm during the Stage 1 deck cast. The stresses in the solid diaphragm were generally quite low during the concrete placement, particularly on the interior girder side of the diaphragm (Figure 5.22). The induced stresses were all less than ±0.5 ksi. Figure 5.24 shows a comparison between the measured and FEA predicted stresses in the solid diaphragm. Although the predicted and measured stresses do not agree very well, the low level of stress generally results in significant errors due to the resolution of the sensors (±0.05 ksi). Additionally, the stresses induced from the construction event were actually less than typical thermal induced stresses in the solid diaphragm, further complicating proper reduction of the field data. Furthermore the effect from the thickened overhangs, as depicted in Figure 5.21, is also consistent with the discrepancies seen between field and FEA results.
70
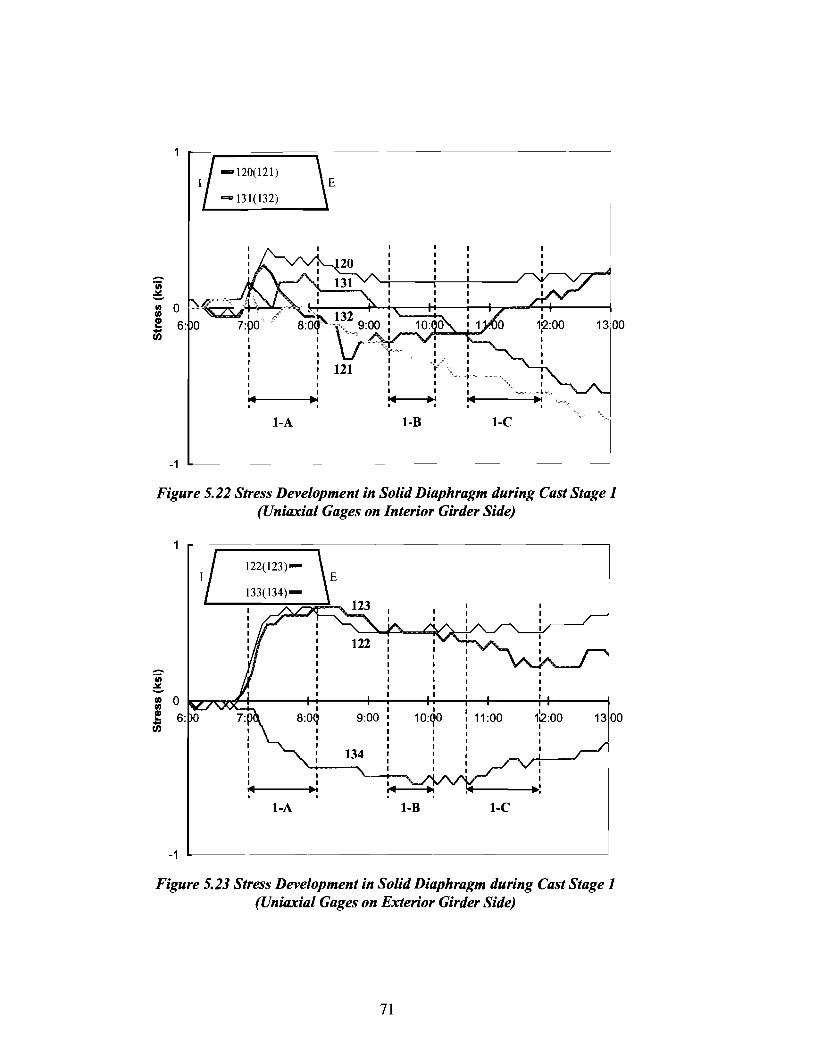
-1
-120(121)
-131(132)
I I I I I I I I
"' 1-A
I I ,...
1-B 1-C
Figure 5.22 Stress Development in Solid Diaphragm during Cast Stage 1 (Uniaxial Gages on Interior Girder Side)
...... ! = 0 ~ UJ
-1
122(123)-
I I I I I I I I ...
1-A
I
8:0~ I
1o:qo 1~:00 9:00 11:00 13,00
Figure 5.23 Stress Development in Solid Diaphragm during Cast Stage 1 (Uniaxial Gages on Exterior Girder Side)
71
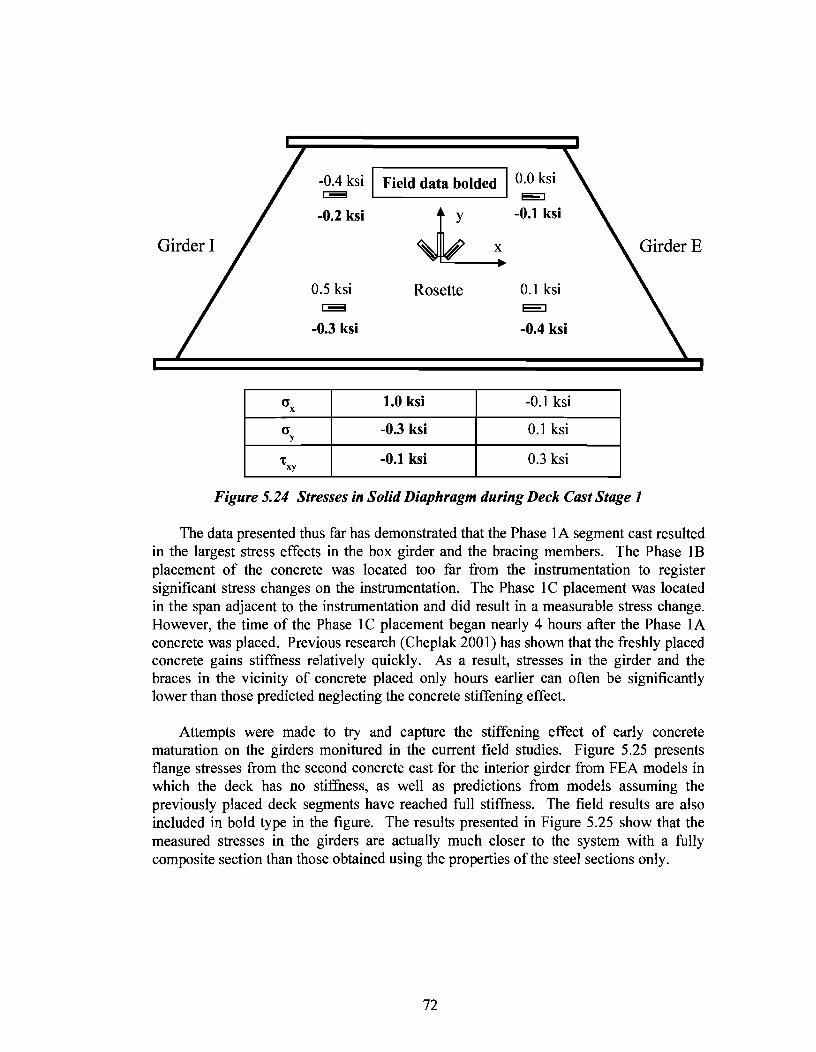
Girder I
I a X
(Jy
'txy
-~ ksi I Field data bolded I O~i -0.2 ksi ~ -0.1 ksi
0.5 ksi c:iiii3
-0.3 ksi
Rosette
1.0 ksi
-0.3 ksi
-0.1 ksi
0.1 ksi E:::::J
-0.4 ksi
-0.1 ksi
0.1 ksi
0.3 ksi
Figure 5.24 Stresses in Solid Diaphragm during Deck Cast Stage 1
The data presented thus far has demonstrated that the Phase I A segment cast resulted in the largest stress effects in the box girder and the bracing members. The Phase 1B placement of the concrete was located too far from the instrumentation to register significant stress changes on the instrumentation. The Phase 1 C placement was located in the span adjacent to the instrumentation and did result in a measurable stress change. However, the time of the Phase 1 C placement began nearly 4 hours after the Phase 1 A concrete was placed. Previous research (Cheplak 2001) has shown that the freshly placed concrete gains stiffness relatively quickly. As a result, stresses in the girder and the braces in the vicinity of concrete placed only hours earlier can often be significantly lower than those predicted neglecting the concrete stiffening effect.
Attempts were made to try and capture the stiffening effect of early concrete maturation on the girders monitured in the current field studies. Figure 5.25 presents flange stresses from the second concrete cast for the interior girder from FEA models in which the deck has no stiffness, as well as predictions from models assuming the previously placed deck segments have reached full stiffness. The field results are also included in bold type in the figure. The results presented in Figure 5.25 show that the measured stresses in the girders are actually much closer to the system with a fully composite section than those obtained using the properties of the steel sections only.
72

-0.8 -0.9 -0.1 0.1
(46)
(44) (45)
-0.9 -0.1 -0.1
(49)
FEA-No stiffuess FEA -Full stifthess
Field data
Station 2
(15)
L.l 1.0
(16)
:.!..:.± -0.1 0.0
Figure 5.25 Flange Stresses for Girder I during Second Concrete Cast (FEA Models with and without Concrete Deck Stiffness)
5.4 Live Load Test
5.4.1 Introduction
(20)
Live load tests were conducted approximately four months after the concrete deck was placed. The testing was conducted on two separate occasions to provide more data on the effect of the external K-frames on the box girder behavior. As discussed, the external K-frames are typically removed from the bridge in the latter stages of construction after the concrete deck is placed. The original plan was to monitor the instrumentation with truck loading on the bridge with and without the external K-frames in place. However, trucks could not be put on the bridge until the concrete rails were in place. Unfortunately, the contractor began removing the external K-frames before the concrete guardrails were cast. The contractor did agree to leave the K-frames in place on the instrumented span, however, due to a miscommunication between researchers and the contractor's personnel, the bottom struts of one of the K-frames in the instrumented span was removed as shown in Figure 5.26. The instrumented external K-frame was undamaged. The fact that the bottom chord of one of the external K-frames in the instrumented spans was cut should amplify any live load forces induced in the instrumented external K-frame.
The first live load test was conducted on October 16, 2002 with the external Kframes, including the partially cut K-frame, in the instrumented span still in place. The second live load test was conducted on October 25, 2002 after all of the intermediate external K-frames were removed. For the purposes of discussion in this chapter the two live load tests will be referenced as "Phase 1" and "Phase 2" where Phase 1 refers to the load test conducted with the external K-frames in place and Phase 2 refers to the test conducted after the external cross-frames were removed.
73

Figure 5.26 Diaphragm Cut in the Instrumented Span
The loading used in the live load tests consisted of four sand trucks that were paced across the bridge in a variety of patterns. The trucks were stopped at pre-marked stations for time periods long enough to permit data from all of the sensors to be recorded. In each phase of testing three different load patterns were used in which the truck orientations and positions were varied. Figure 5.27 shows the three different loading patterns used in the tests. Test 1 consisted of the four trucks grouped in pairs positioned near the exterior edge of the bridge. Test 2 also used pairs of trucks but in this test the trucks were positioned near the interior edge of the bridge. For Tests 1 and 2, the trucks were positioned as close to the curb as possible, and the drivers were asked to maintain a consistent distance from the curb. The drivers were also asked to maintain a close spacing between the trucks, both transversely and longitudinally during the tests.
In Test 3 the trucks were oriented in a single-file line and positioned along the centerline of the bridge. Since Bent 23 was skewed, referencing the stations from this bent could have led to errors and hence Bent 22, a radial support, was taken as the base reference. The stress variations due to truck loading are graphed as a function of the center of gravity of the truck formation, denoted by X, with Bent 22 as the reference. A negative X represents the case when the center of gravity of the trucks is between Bent 22 and Bent 23. The truck dimensions pertinent to the load layouts are shown in Figure 5.28.
74

Bent 22...,....,,...;G:;:.l:::.. rd::.:e:..:.r-=E;---rG:::.:i:::.;rd:;.;e;.;;.r.,;;.I....,,
X
TEST 1
Girder E Girder I rT~~r----r~~rrr-Bem22
uu X
TEST2
Bent 22 Girder I
TEST3
Figure 5.27 Truck Formations for Live Load Tests
75

, .. 23'2"
UL UL 4'2"
7' ll"
Figure 5.28 Truck Dimensions
In each test the trucks entered the bridge from the north end (Bent 23) and exited at the south end (Bent 18). The composite action between the girders and the deck resulted in a neutral axis position very close to the top flange, which therefore resulted in relatively small stresses in the box girder top flanges and the top flange truss. Hence for the live load tests the stresses developed in the bottom flanges provided the most significant stress readings. To make sure that adequate bottom flange data was collected, an additional strain gage was installed at each girder station between the two existing gages. Since the stresses in the top flanges and top lateral truss are minimal, only readings from the bottom flanges will be presented in the following discussion. As mentioned earlier in the report, thermal stresses can severely complicate the analysis of field data. To minimize the complications from thermal effects, the first phase of live load tests was conducted at night when the thermal gradients expected in the bridge were less significant. For the second phase of live load tests there was a very small window of time during which the tests could be conducted prior to opening of the bridge to traffic. As a result, nighttime testing was not possible. However, due to heavy cloud cover and rain, the temperature effects were minimal in the second phase of tests.
5.4.2 First Live Load Test
The first live load test was conducted less than two days after the bridge rails were completed. The testing began at 17:35 on October 16,2002 and was completed at 01:30 on October 17, 2002. The rail within the instrumented span was the first to be cast and had four days to cure prior to the live load test. As mentioned earlier, the first tests were
76
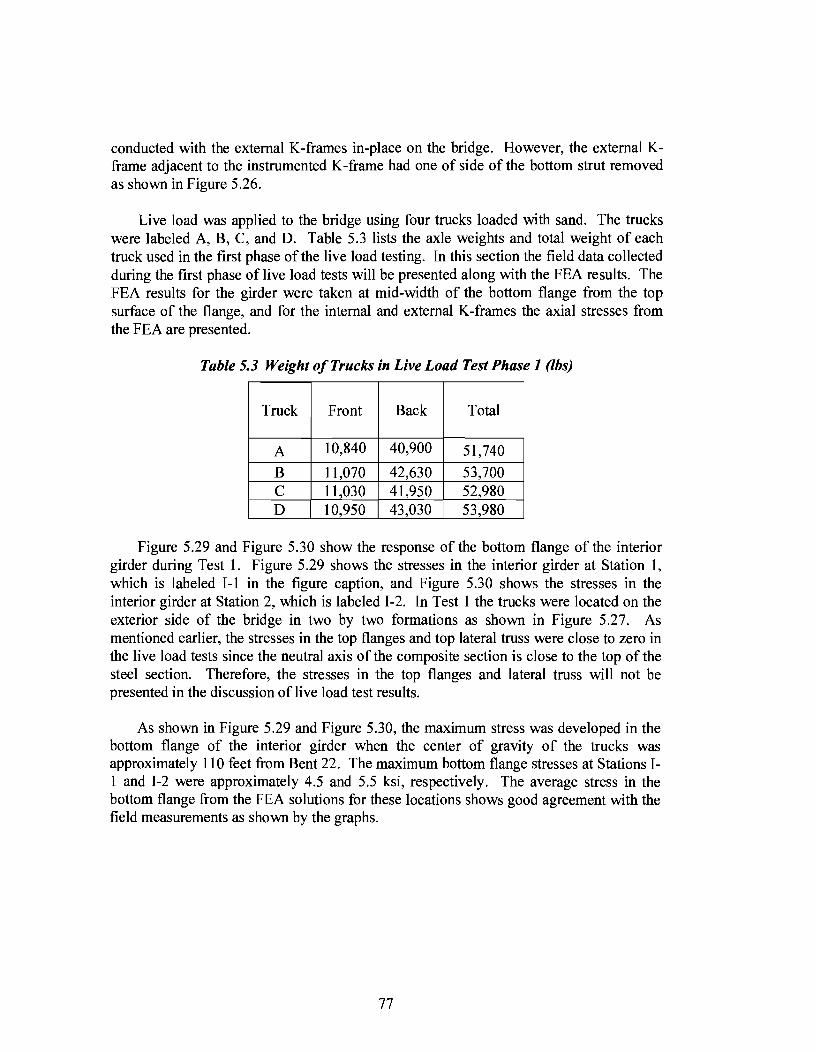
conducted with the external K-frames in-place on the bridge. However, the external Kframe adjacent to the instrumented K-frame had one of side of the bottom strut removed as shown in Figure 5.26.
Live load was applied to the bridge using four trucks loaded with sand. The trucks were labeled A, B, C, and D. Table 5.3 lists the axle weights and total weight of each truck used in the first phase of the live load testing. In this section the field data collected during the first phase of live load tests will be presented along with the FEA results. The FEA results for the girder were taken at mid-width of the bottom flange from the top surface of the flange, and for the internal and external K-frames the axial stresses from the FEA are presented.
Table 5.3 Weight of Trucks in Live Load Test Phase 1 (lbs)
Truck Front Back Total
A 10,840 40,900 51,740
B 11,070 42,630 53,700 c 11,030 41,950 52,980 D 10,950 43,030 53,980
Figure 5.29 and Figure 5.30 show the response of the bottom flange of the interior girder during Test 1. Figure 5.29 shows the stresses in the interior girder at Station 1, which is labeled 1-1 in the figure caption, and Figure 5.30 shows the stresses in the interior girder at Station 2, which is labeled I-2. In Test I the trucks were located on the exterior side of the bridge in two by two formations as shown in Figure 5.27. As mentioned earlier, the stresses in the top flanges and top lateral truss were close to zero in the live load tests since the neutral axis of the composite section is close to the top of the steel section. Therefore, the stresses in the top flanges and lateral truss will not be presented in the discussion of live load test results.
As shown in Figure 5.29 and Figure 5.30, the maximum stress was developed in the bottom flange of the interior girder when the center of gravity of the trucks was approximately 110 feet from Bent 22. The maximum bottom flange stresses at Stations 1-1 and 1-2 were approximately 4.5 and 5.5 ksi, respectively. The average stress in the bottom flange from the FEA solutions for these locations shows good agreement with the field measurements as shown by the graphs.
77

6
5
4 46
::-3 1ft ~ -: 2 l!! -(I)
Truck Location X in Feet
Figure 5.29 Bottom Flange Stress during Phase 1 Live Load Test 1 at Station 1-1
6 ~~····················~~~~~-~~~~~·······················~~~~~~~~~~~ ............. _
TEST I
Bent20 Bent 19 Bent 18
-2···~~-~~~~~~~~~~~~~~- ~~--····~··· -~~~~~~
Truck Location X in feet
Figure 5.30 Bottom Flange Stress during Phase 1 Live Load Test 1 at Station 1-2
78
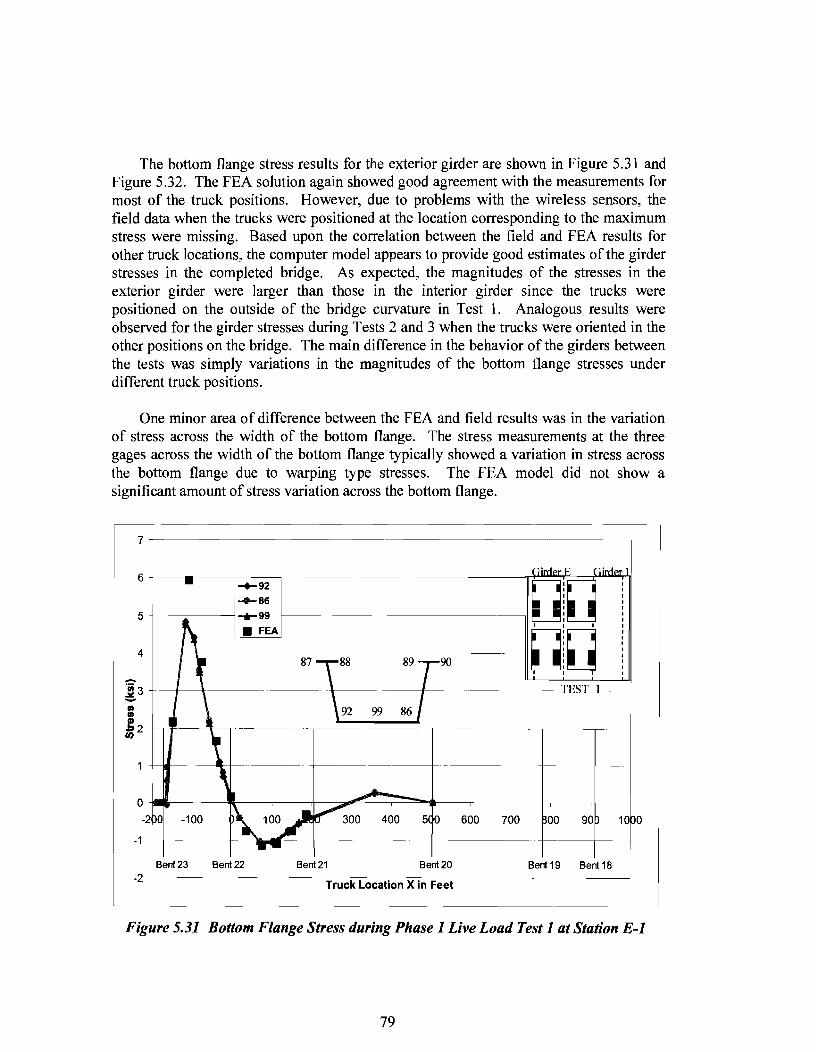
The bottom flange stress results for the exterior girder are shown in Figure 5.31 and Figure 5.32. The FEA solution again showed good agreement with the measurements for most of the truck positions. However, due to problems with the wireless sensors, the field data when the trucks were positioned at the location corresponding to the maximum stress were missing. Based upon the correlation between the field and FEA results for other truck locations, the computer model appears to provide good estimates of the girder stresses in the completed bridge. As expected, the magnitudes of the stresses in the exterior girder were larger than those in the interior girder since the trucks were positioned on the outside of the bridge curvature in Test 1. Analogous results were observed for the girder stresses during Tests 2 and 3 when the trucks were oriented in the other positions on the bridge. The main difference in the behavior of the girders between the tests was simply variations in the magnitudes of the bottom flange stresses under different truck positions.
One minor area of difference between the FEA and field results was in the variation of stress across the width of the bottom flange. The stress measurements at the three gages across the width of the bottom flange typically showed a variation in stress across the bottom flange due to warping type stresses. The FEA model did not show a significant amount of stress variation across the bottom flange.
6+---~--------~------ -----~~-----------------~~~~~~~
5 ~------------ ---------------JI~] 4 --r------+---+---~----------------~---------------90----------liOiO
600 700 00 90 1000
-1
! Bent23 Bent22 Benl21 Bent 20 Bent19 Bent18 i -2 .i_ ________________________________________________________________ J
Truck Location X in Feet
Figure 5.31 Bottom Flange Stress during Phase 1 Live Load Test 1 at Station E-1
79
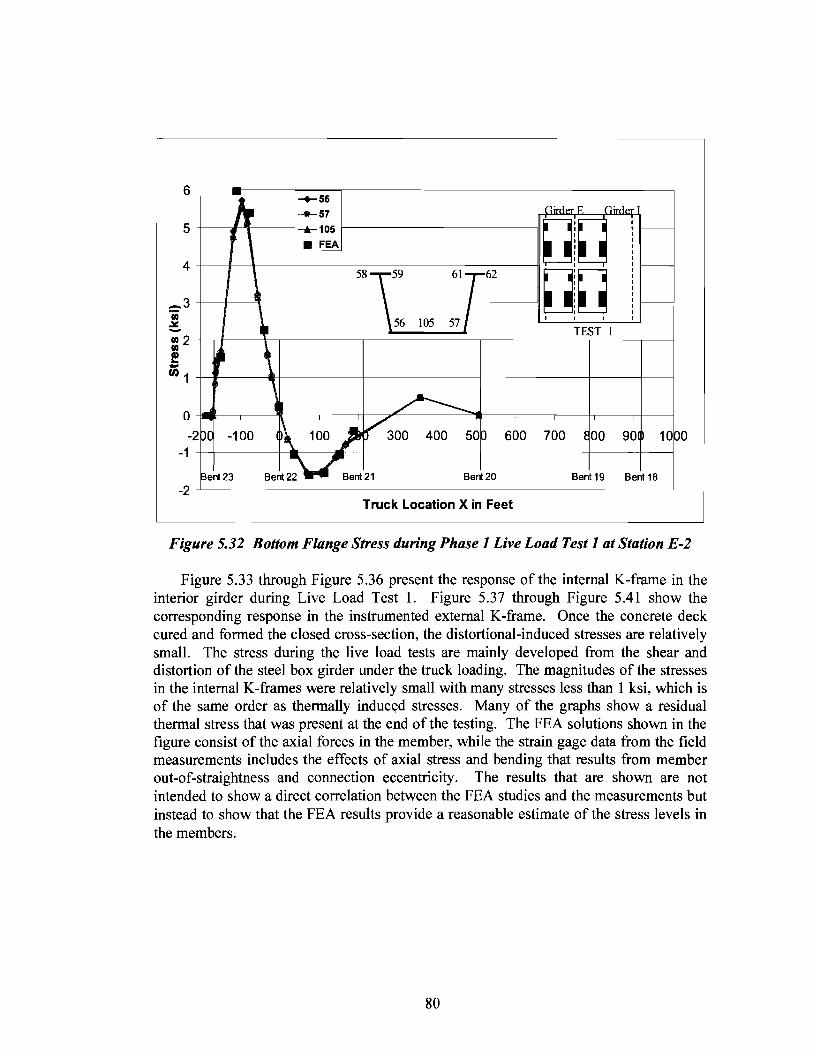
6 ~~.r~~~----~~~--~--------------~------~~-, -+-56 _._57
5 +--~#-"!~~~~-:-!: t-----------------------1101 'j: T-~'---"i---~--~---5-8 -~--~-:--l-05---,~-T--..... -6-.~----~o'----'-[--~-'---'-" - I -rl---~h~~~~---.~~-::::::::::::::::~----.- TEST 1 •2 +
J tn1
0
600 700 oo go 1obo
Bent 19 Bent18
Truck Location X in Feet
Figure 5.32 Bottom Flange Stress during Phase 1 Live Load Test 1 at Station E-2
Figure 5.33 through Figure 5.36 present the response of the internal K-frame in the interior girder during Live Load Test 1. Figure 5.37 through Figure 5.41 show the corresponding response in the instrumented external K-frame. Once the concrete deck cured and formed the closed cross-section, the distortional-induced stresses are relatively small. The stress during the live load tests are mainly developed from the shear and distortion of the steel box girder under the truck loading. The magnitudes of the stresses in the internal K-frames were relatively small with many stresses less than 1 ksi, which is of the same order as thermally induced stresses. Many of the graphs show a residual thermal stress that was present at the end of the testing. The FEA solutions shown in the figure consist of the axial forces in the member, while the strain gage data from the field measurements includes the effects of axial stress and bending that results from member out-of-straightness and connection eccentricity. The results that are shown are not intended to show a direct correlation between the FEA studies and the measurements but instead to show that the FEA results provide a reasonable estimate of the stress levels in the members.
80
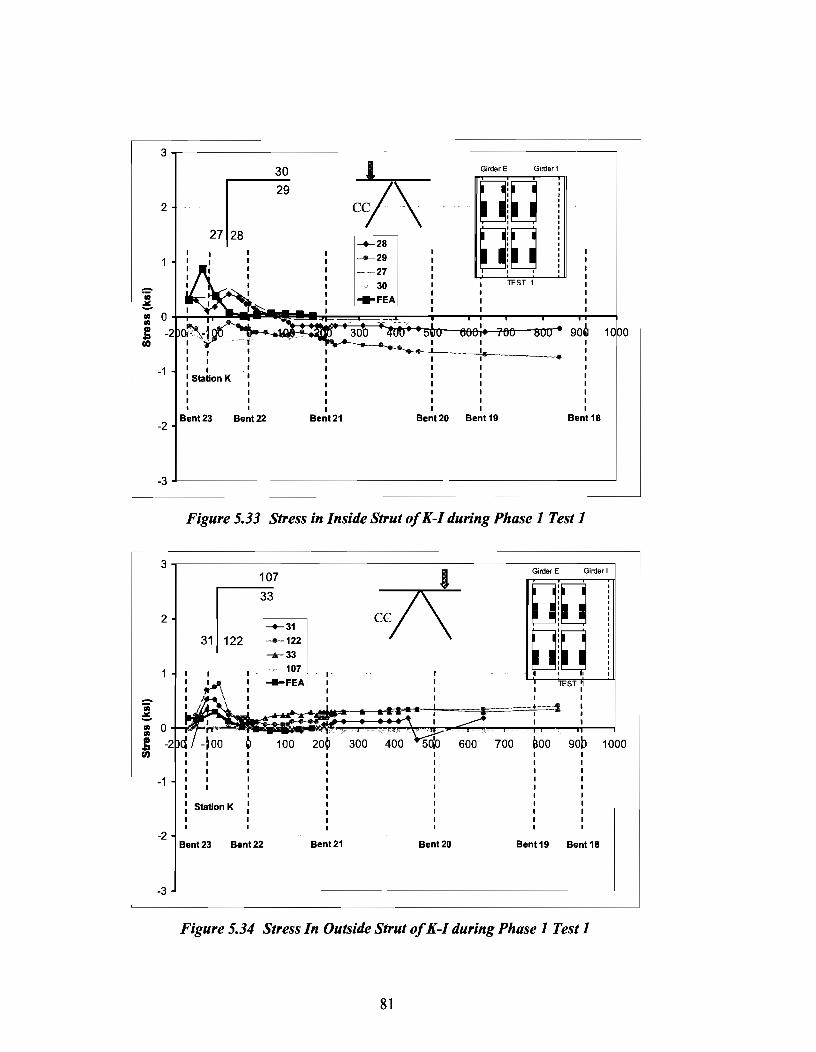
3
2
--"i ~ Ill 0 Ill l! -U)
-1
-2
2
-1
30 I
~ cc/\ DiD OiU 27
--+-28 --29 --27
30 lEST 1
,-.FEA
90~
I I I
I I I I
I I I I
Bent23 Bent22 Bent21 Bent20 Bent 19
Figure 5.33 Stress in Inside Strut of K-I during Phase 1 Test 1
107
31~:~ '--.ilr-33
107
Station K
Bent21
c~
300 400
Bent20
700 eoo
TEST I I I I
Bent 19 Bent 18
Figure 5.34 Stress In Outside Strut of K-I during Phase 1 Test 1
81
1000
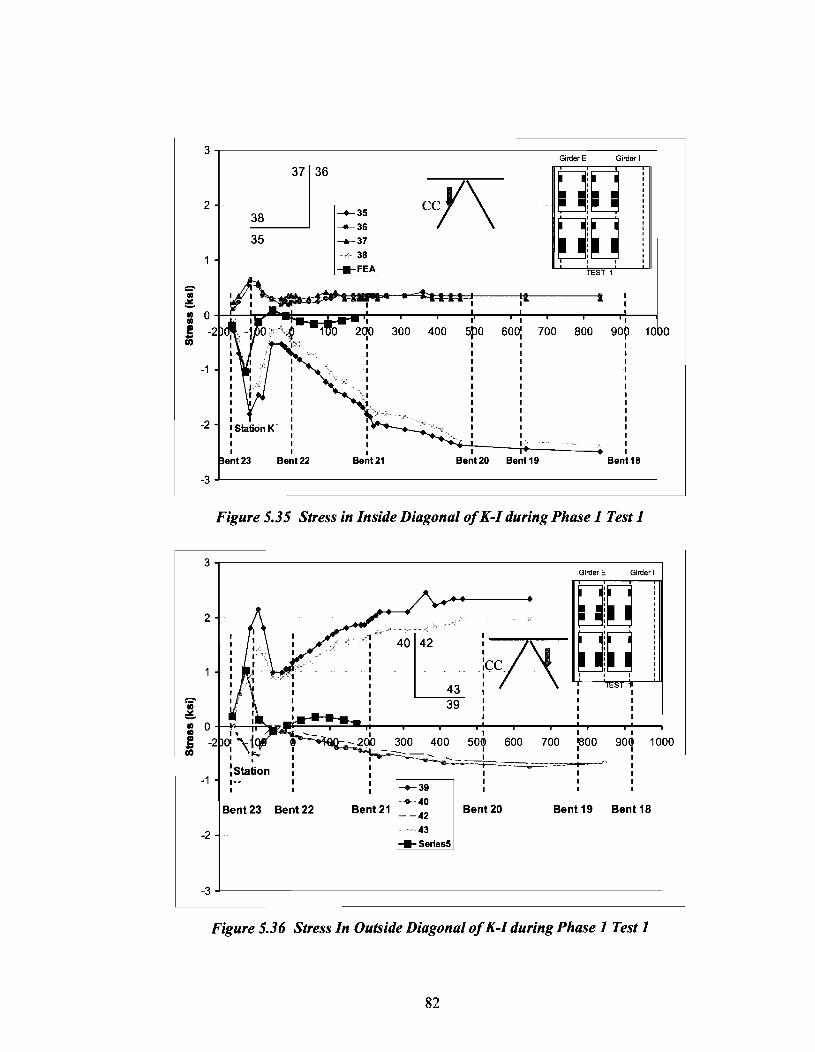
~ ·; ~ Ill Ill
!: U)
3~--------------------------------------------------------~
2
-1
-2
ent23
8
36~ -+-35
-+-36
35 --37
Bent22
38
-e-FEA
I I I I
Bent 21
ccf\
Ben 20 Bent 19
Girder E Girder
~i 0[~ ' ' '
TEST 1
Ben 18
-3~----------------------------------------------------------
Figure 5.35 Stress in Inside Diagonal of K-I during Phase 1 Test 1
3~----------------------------------------------------------~
2
0 -2
-1 1·-I
Bent23 Bent22
-2
Girder E Girder
DiU 40142 ~DiU ~ : I TEST\
39 : : :
400
-+-39
-+-40 Bent 21 __
42 43
-e-series5
I 50(1)
I I I I I I
Bent20
I I
600 700 '800 900 10 0 I I I I I I
I I
' Bent19 Bent18
-3~------------------------------------------------------
Figure 5.36 Stress In Outside Diagonal of K-I during Phase 1 Test 1
82

Figure 5.3 7 Stress in Top Strut of External K-Frame during Phase 1 Test 1
3
118
2 970101 ~ ~]U U!U 113
•I ' I
..... TES d 'i :!!.
"' I I "' i 600 700 ~00 gqo --+-97
-1 1~::: )' 110 1
..... FEA.
-2 Station K
Bent23 Bent22 Bent21 Bent20
Figure 5.38 Stress in Inside Diagonal of External K-Frame during Phase 1 Test 1
83

3 C:ir£1,. F (;j,.£1,...
116 (jl'' 114034 ,- cc\f :l! i--+-114
~ 1--115 O!U ~ !~:· 115 I -:.-FEA I I I I I
1\ I I I I TEST, 1 I I I I I I I I I I I I I I -:::- ....
I \ .,._
I I I I : Ql -1po ~ 100 200 300 400 sqo 600 700 poo gqo 10
I I I I I I I
2
! • 0 • I! -2 -en
00
I I I I I I I I I I I I I I I I I I -1 I I I I I I I I I I I I I I I I I I I I I I I I I . I I I I
-2 I Station K I I I I
Bent23 Bent22 Ben 21 Bent20 Bent 19 Bent18
-3
Figure 5.39 Stress In Outside Diagonal of External K-Frame during Phase 1 Test 1
2~---~~~~~~---·············-----~~~~~~~~~- -~~~~~~-,
104
110112 117 :
I
CCN J --104 .... 111
--112
- -+-117
U!D D!D ' ' '
TEST l
~ ~-~~~~~~3t~~~~~~-.r~~FEA~~~---.~---r----~--~----~----, I Oi -~ ! -2 0: -1bo ~ 100 2do 3oo 400 sdo 6oo 700 BOO
-1 Station K
Bent23 Bent22 Bent21 Bent20 Bent 19 Bent 18
Figure 5.40 Stress in Inside Bottom Strut of External K-Frame during Phase 1 Test 1
84

2
..... iii ~
• 0 • e -fiJ
-1
106
11[]136 109
I 1-+-106
1
I I I I I TEST: 1 I I I I
I I 9do 500 600 700 1800 I I I I I I I I I I I I
Station K I
Bent23 Bent22 Bent21 Bent20 Bent19 Bent 18
Figure 5.41 Stress in Outside Bottom Strut of External K-Frame during Phase 1 Test 1
I
10b0
The solid diaphragm behaved similar to the previous construction stages and didn't develop significant stress during the live load tests. The maximum stresses that were measured in the external diaphragm occurred as the center of gravity of trucks passed over the solid diaphragm, which produced a maximum stress of approximately 1.5 ksi. In general, the results from both the field and FEA results showed that the instrumented solid diaphragm stresses were low during the live load tests.
5.4.3 Second Live Load Test
To evaluate and compare the bridge behavior without the external K-frames, a second phase of live load tests were conducted from 09:35 to 12:05 on October 25, 2002. As mentioned earlier, due to time constraints related to the opening of the bridge, the tests were conducted during daylight hours. However, due to cloud cover and rain, thermal stresses were relatively small. The orientation of the test trucks were similar to those described for Test 1. The truck weights were also similar to those used in the first phase of tests as shown in Table 5.4, which lists the axle weights of the individual trucks used in the second phase of tests. The difference in truck weights between the two tests phases was less than 2%.
85
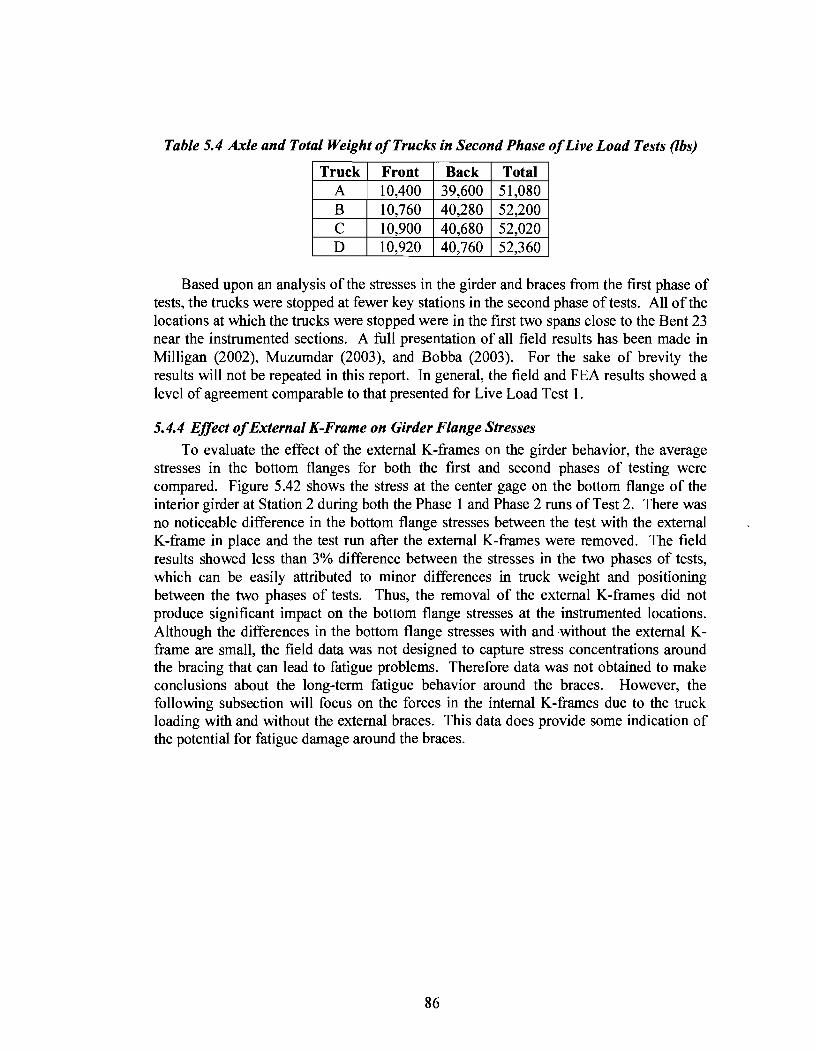
Table 5.4 Axle and Total Weight of Trucks in Second Phase of Live Load Tests (lbs)
Truck Front Back Total A 10,400 39,600 51,080 B 10,760 40,280 52,200 c 10,900 40,680 52,020 D 10,920 40,760 52,360
Based upon an analysis of the stresses in the girder and braces from the first phase of tests, the trucks were stopped at fewer key stations in the second phase of tests. All of the locations at which the trucks were stopped were in the first two spans close to the Bent 23 near the instrumented sections. A full presentation of all field results has been made in Milligan (2002), Muzumdar (2003), and Bobba (2003). For the sake of brevity the results will not be repeated in this report. In general, the field and FEA results showed a level of agreement comparable to that presented for Live Load Test 1.
5.4.4 Effect of External K-Frame on Girder Flange Stresses
To evaluate the effect of the external K-frames on the girder behavior, the average stresses in the bottom flanges for both the first and second phases of testing were compared. Figure 5.42 shows the stress at the center gage on the bottom flange of the interior girder at Station 2 during both the Phase 1 and Phase 2 runs of Test 2. There was no noticeable difference in the bottom flange stresses between the test with the external K-frame in place and the test run after the external K-frames were removed. The field results showed less than 3% difference between the stresses in the two phases of tests, which can be easily attributed to minor differences in truck weight and positioning between the two phases of tests. Thus, the removal of the external K-frames did not produce significant impact on the bottom flange stresses at the instrumented locations. Although the differences in the bottom flange stresses with and without the external Kframe are small, the field data was not designed to capture stress concentrations around the bracing that can lead to fatigue problems. Therefore data was not obtained to make conclusions about the long-term fatigue behavior around the braces. However, the following subsection will focus on the forces in the internal K-frames due to the truck loading with and without the external braces. This data does provide some indication of the potential for fatigue damage around the braces.
86

5~----------------------------------------------------,
4
3 -I---_,_
-'iii ..lll: -= 2 +--¥-------E 't;; G) Phase 2
irder E
D~ DID
TEST 2 ~1 -1-.---~~--------~--~--------~----------~----~-
IIS ;;::::
-1 -1-1----------l
Phase 1
50 600 700 1 0
-2~----------------------------------------------------~
Truck Location X in feet
Figure 5.42 Bottom Flange Stress in Phase 1 Test 2 and Phase 2 Test 2
5.4.5 Effect of External K-Frame on Internal K-Frames
The forces developed in the top struts and diagonals of the internal K-frame in the interior girder in Phase 1 Test 3 and Phase 2 Test 3 are shown in Figure 5.43. As shown in the figure, the removal of the external K-frame had a more significant effect on the forces developed in the internal K-frames than it did on the girder stresses. The internal K-frame developed greater forces when the external K-frames were still in place on the bridge spanning between the adjacent girders. There are two main reasons why the internal K-frame forces were higher when the external K-frames were on the bridge. First, the box girder system is stiffer torsionally with the external K-frames than without them, and the forces attracted by the external K-frames were transferred into the internal K-frames. Secondly, the presence of the external K-frames restrains shear deformation in the area of the internal K-frames, which also leads to the development of larger forces in these K-frames.
87

-1
Station K
Bent23
I I
-wlol:xt-K I
42 • wl E'ld-K I I I I I
Bent22
I I I I I I I I
Bent21
Figure 5.43 Stresses in Exterior Diagonal of Internal K-Frame of Girder I in Test 3
In conclusion leaving the external K-frames in place after construction did not have significant impact on the flange stresses developed at the instrumented locations, however, the presence of the external K-frames did significantly impact the forces developed in the internal K-frames. Given the potential for fatigue concerns related to cross-frame locations, without further study it is not advisable to leave the external Kframes in place on the bridge.
88

6.1 Introduction
Chapter 6
Parametrical Studies on Box Girders
The behavior of many of the bracing systems that are used in box girder systems has generally not been well understood. Previous studies (Fan and Helwig 2000, Chen 2002) have focused on improving the understanding of bracing systems used within the box girders, such as the internal K-frame and top flange lateral truss systems. Equations (see Chapter 2) were developed in TxDOT Research Study 0-1395 to provide design requirements for the top flange lateral truss as well as the internal K-frames (Helwig and Fan 2000), however, these previous studies were conducted on girders with no intermediate (between the supports) external K-frames. Additionally, the previous investigations were conducted on girders with radial supports. The general behavior of systems with intermediate external K-frames and/or skewed supports is not well understood. FEA parametric studies were conducted to improve the understanding of bracing systems used in box girder bridges with skewed supports and external K-frames.
The majority of the parametric studies were focused on a twin girder system with a span of 160 ft. measured along the centerline of the bridge, however isolated analyses were also conducted on systems with longer spans. The basic cross-sectional properties and internal K-frame member sizes chosen for the parametric studies were based on the model used in the FEA behavioral studies conducted in TxDOT Research Study 0-1395. Similar properties were used for the parametric analyses in the current study to facilitate comparison of findings with previous results. The layout of the top flange lateral truss had 16 panels in the longitudinal direction along the bridge as shown in Figure 6.1. The top lateral diagonals were WT8x20 sections and the struts were L4x4x5/16 angles as shown in the figure.
The girder cross-sectional properties and K-frame member sizes used in the parametric analyses are shown in Figure 6.2. The internal K-frames were composed of L4x4x5/16 sections and the external K-frames consisted ofL5x3.5xl/2 sections as shown in the figure. Table 6.1 shows the range of the parameters that were considered in the investigation. As shown in the table, the number of external K-frames that were considered in the parametric studies ranged from 0 to 3. The locations of the external Kframes varied depending on the number of braces. For example, for cases with a single external brace the K-frame was placed at midspan of the girders as shown in Figure 6.1. The external K-frame locations for the cases with 2 and 3 K-frames, respectively, are shown in Figure 6.3. So as to control excessive box girder distortion, an external Kframe should only frame into a girder at a location where there is an internal K-frame. A pictorial layout specifically detailing the internal and external K-frame locations for each analysis case conducted in the parametric studies is presented in the appendix to this report. Additional systems outside the range of the parameters listed in Table 6.1 were also analyzed to evaluate the sensitivity of the results to other factors.
89

Diagonal: WT8x20 Strut: L4x4x5/16
Figure 6.1 Top Lateral Truss Layout in Parametric Study
18"X0.75" 125" 125"
90"
80"x0.6875"
Figure 6.2 Section Properties Used in Parametric Study FEA Models
Table 6.1 Parametric FEA Scheme Skew angle (degrees) 0, 5, 10, 15, 20, 30 Radius (feet) 600, 1200, 1800, 12000 (~straight) Internal K-Frame spacing (panels) 1, 2, 4, 6 # oflntermediate External K- Frames 0, 1, 2, 3
2 External K's 3 External K's
Figure 6.3 Location of Two and Three External K-Frames in Parametric Study
90
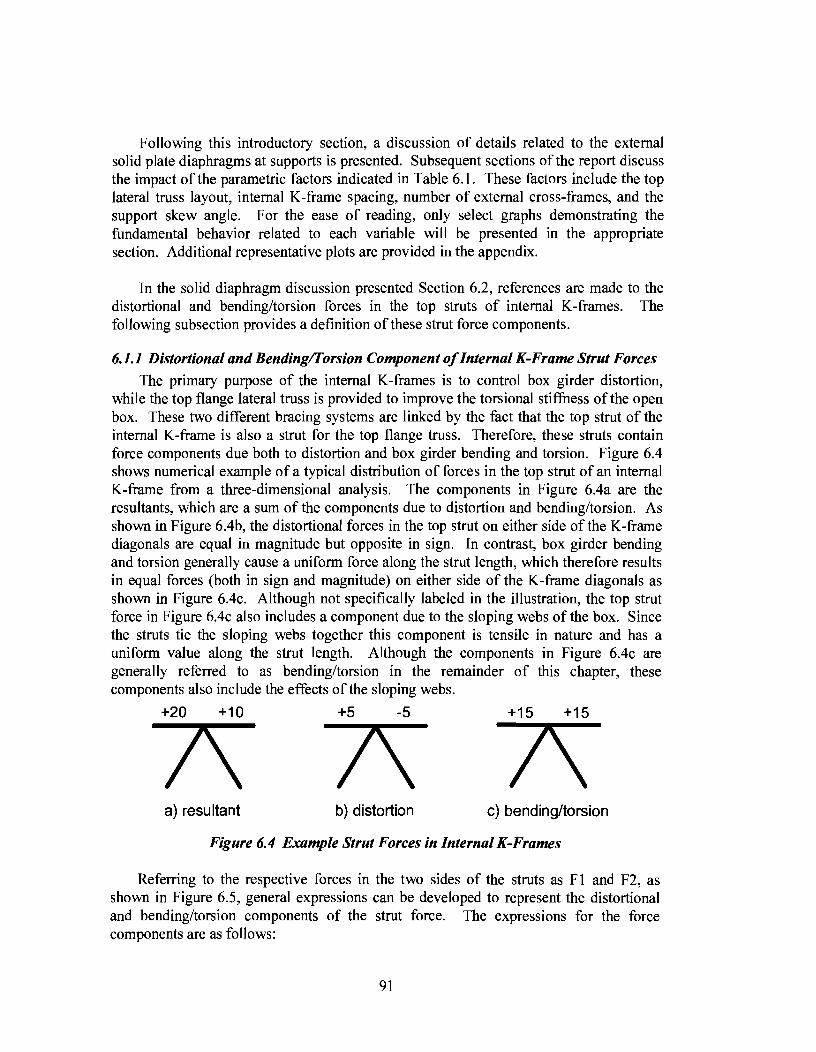
Following this introductory section, a discussion of details related to the external solid plate diaphragms at supports is presented. Subsequent sections ofthe report discuss the impact of the parametric factors indicated in Table 6.1. These factors include the top lateral truss layout, internal K-frame spacing, number of external cross-frames, and the support skew angle. For the ease of reading, only select graphs demonstrating the fundamental behavior related to each variable will be presented in the appropriate section. Additional representative plots are provided in the appendix.
In the solid diaphragm discussion presented Section 6.2, references are made to the distortional and bending/torsion forces in the top struts of internal K-frames. The following subsection provides a definition of these strut force components.
6.1.1 Distortional and Bending/Torsion Component of Internal K-Frame Strut Forces
The primary purpose of the internal K-frames is to control box girder distortion, while the top flange lateral truss is provided to improve the torsional stiffness of the open box. These two different bracing systems are linked by the fact that the top strut of the internal K-frame is also a strut for the top flange truss. Therefore, these struts contain force components due both to distortion and box girder bending and torsion. Figure 6.4 shows numerical example of a typical distribution of forces in the top strut of an internal K-frame from a three-dimensional analysis. The components in Figure 6.4a are the resultants, which are a sum of the components due to distortion and bending/torsion. As shown in Figure 6.4b, the distortional forces in the top strut on either side of the K-frame diagonals are equal in magnitude but opposite in sign. In contrast, box girder bending and torsion generally cause a uniform force along the strut length, which therefore results in equal forces (both in sign and magnitude) on either side of the K-frame diagonals as shown in Figure 6.4c. Although not specifically labeled in the illustration, the top strut force in Figure 6.4c also includes a component due to the sloping webs of the box. Since the struts tie the sloping webs together this component is tensile in nature and has a uniform value along the strut length. Although the components in Figure 6.4c are generally referred to as bending/torsion in the remainder of this chapter, these components also include the effects of the sloping webs.
+20 +10 +5 -5 +15 +15
a) resultant b) distortion c) bending/torsion
Figure 6.4 Example Strut Forces in Internal K-Frames
Referring to the respective forces in the two sides of the struts as F 1 and F2, as shown in Figure 6.5, general expressions can be developed to represent the distortional and bending/torsion components of the strut force. The expressions for the force components are as follows:
91

Distortional Component +Fl-F2 - 2
Fl+F2 Bending/Torsion Component =
2
(6.1)
(6.2)
Throughout this chapter in the discussion of distortion and the bending/torsion top strut forces; the individual components were separated using Eqs. ( 6.1 )and ( 6.2).
F1 F2
Figure 6.5 Top Strut Resultant Forces
6.2 Depth of Solid Diaphragm at End Supports
The early phases of the parametric studies the analyses that were conducted on a model that employed a detail for the solid diaphragm at the supports that was similar to the detail used on the bridge instrumented in the field studies. The bridge in the field studies had an integral expansion joint that required the depth of the concrete slab at the end supports to be approximately twice as deep as the conventional concrete slab that was specified along the bridge length. As a result of the thickened slab at the expansion joint, a partial depth solid diaphragm that framed into the girder cross-section below the top flange level was utilized at the exterior supports. Figure 6.6 shows a picture of this solid diaphragm detail at an end support in the instrumented bridge. Although the "partial depth" diaphragm provides a simple method of accounting for the clearance requirements of the expansion joint, the detail also results in a lack of anchorage for the top flange lateral truss that effects the distribution of the brace forces, particularly near the ends of the girder. In the remainder of this section, the term "partial depth" diaphragm will be used to describe a detail similar to that shown in Figure 6.6 where the diaphragm does not frame into the girder near the top flange. There generally is not a problem using an external solid diaphragm that is not full depth on the girders, however as will be shown in this section, poor behavior results if the internal solid diaphragm does not frame into the girder near the top flange level. A detail such as this for the internal solid diaphragm requires the web of the girder to provide anchorage to the top flange lateral truss at the girder ends, which usually results in too low of a stiffness.
92
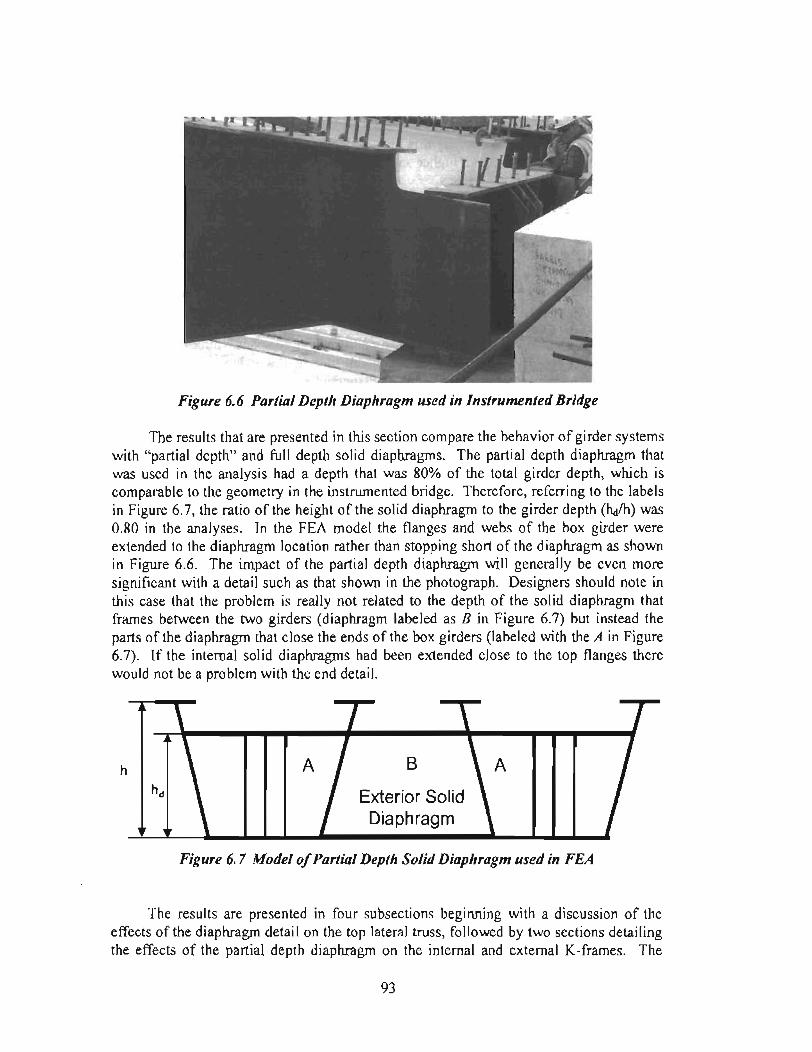
Figure 6.6 Partial Depth Diaphragm used in Instrumented Bridge
The results that are presented in this section compare the behavior of girder systems with "partial depth" and full depth solid diaphragms. The partial depth diaphragm that was used in the analysis had a depth that was 80% of the total girder depth, which is comparable to the geometry in the instrumented bridge. Therefore, referring to the labels in Figure 6.7, the ratio of the height ofthe solid diaphragm to the girder depth (~/h) was 0.80 in the analyses. In the FEA model the flanges and webs of the box girder were extended to the diaphragm location rather than stopping short of the diaphragm as shown in Figure 6.6. The impact of the partial depth diaphragm will generally be even more significant with a detail such as that shown in the photograph. Designers should note in this case that the problem is really not related to the depth of the solid diaphragm that frames between the two girders (diaphragm labeled as B in Figure 6.7) but instead the parts of the diaphragm that close the ends of the box girders (labeled with the A in Figure 6.7). If the internal solid diaphragms had been extended close to the top flanges there would not be a problem with th{; end detail.
h A B
Exterior Solid Diaphragm
A
Figure 6. 7 Model of Partial Depth Solid Diaphragm used in FEA
The results are presented in four subsections beginning with a discussion of the effects ofthe diaphragm detail on the top lateral truss, followed by two sections detailing the effects of the partial depth diaphragm on the internal and external K-frames. The
93

effect of the diaphragm depth on girder stresses and deflections is then discussed. The impact of the partial depth diaphragm is most pronounced for bridges with a relatively small radius of curvature and higher end skews, so the figures presented in each subsection will highlight these cases.
6.2.1 Top Lateral Truss System
Figure 6.8 and Figure 6.9 show graphs of the diagonal forces in the top flange lateral truss for girders with both partial depth and full depth end diaphragms. The results for the interior girder (Girder I) are shown in Figure 6.8 and the exterior girder (Girder E) values are presented in Figure 6.9. The results in the figures are for a system with a radius of curvature of 600 ft. and a 30° skew at the end support plotted on the left end of the x-axis on the graphs. There are smaller forces in the diagonals near the skewed end since more demand is placed on the radial support in skewed spans. Internal K-frames were located at every panel point of the top lateral truss and no external K-frames were provided. In the system with the partial depth diaphragms, the diagonals of the top lateral trusses at the end panels are not properly anchored since the partial depth diaphragm is stopped short of the top flanges of the girder. This leads to the development of smaller forces in the diagonals in the "soft" end panel next to the partial depth diaphragms and larger forces in some of the other panels. The term soft end panel is used because the lack of anchorage of the top truss leads to a relatively flexible panel.
The use of a partial depth end diaphragm generally results in a larger diagonal force in some of the panels away from the ends of the girder. In the cases considered in this investigation, the exterior girder generally had substantially larger diagonal forces with the partial depth diaphragm. For example, as shown in Figure 6.9 the maximum diagonal force with the full depth diaphragm was approximately 175 kips in the end panel, while the partial depth diaphragm case had a maximum force of 220 kips, over 25% larger, in the panel adjacent to the end panel. In addition to larger panel forces, the maximum forces developed in other bracing systems, as well as girder deflections, are increased when a partial depth diaphragm is used rather than a full depth diaphragm. These effects will be discussed in the following subsections.
94
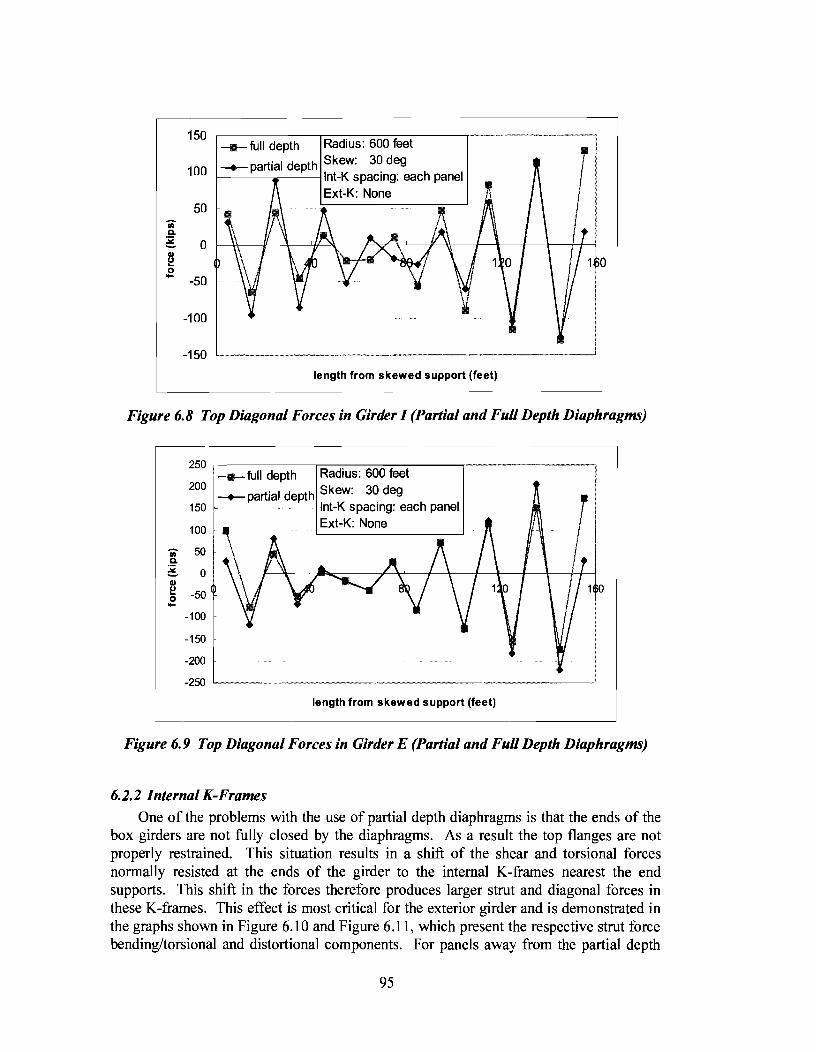
150 _._full depth Radius: 600 feet
100 __._partial depth Skew: 30 deg
f---······· --..-----1lnt-K spacing: each panel Ext-K: None
50
-100
length from skewed support (feet)
Figure 6.8 Top Diagonal Forces in Girder I (Partial and Full Depth Diaphragms)
Iii Q.
~ e 0 ....
250
200
150
100
50
0
-50
-100
-150
-200
_._full depth Radius: 600 feet
_._partial depth Skew: 30 deg ~-~········~~---Jint-K spacing: each panel
Ext-K: None
-250 L-----~----------------~----------~-----__J
length from skewed support (feet)
Figure 6.9 Top Diagonal Forces in Girder E (Partial and Full Depth Diaphragms)
6.2.2 Internal K-Frames
One of the problems with the use of partial depth diaphragms is that the ends of the box girders are not fully closed by the diaphragms. As a result the top flanges are not properly restrained. This situation results in a shift of the shear and torsional forces normally resisted at the ends of the girder to the internal K-frames nearest the end supports. This shift in the forces therefore produces larger strut and diagonal forces in these K-frames. This effect is most critical for the exterior girder and is demonstrated in the graphs shown in Figure 6.10 and Figure 6.11, which present the respective strut force bending/torsional and distortional components. For panels away from the partial depth
95

solid diaphragm, the axial forces in the struts are analogous to the results from the full depth solid diaphragm model. However, the axial forces in the struts near the end panels are considerably larger for the system with the partial depth diaphragm. Because of the use of a partial depth end diaphragm, which cannot properly anchor the end diagonals of the top lateral truss system, there is excessive demand placed on the internal K-frames nearest the end supports.
40
30
-fl) 20 c. :si! -G)
~ 10 J2
0
-10
100
80
60 II) c. ~ 40 G)
~ J2
20
0
-20
Radius: 600 feet -11-- full depth
Skew: 30 deg _.__partial depth lnt-K spacing: each panel1---~~~~__j
Ext-K: None
40 80 120
length from skewed support (feet)
--·····--·······
Figure 6.10 Top Strut Force in the Internal K-Frames of Girder E Due to Bending and Torsion of Girder
Radius: 600 feet .......... full depth Skew: 30 deg --.--partial depth lnt-K spacing: each panel Ext-K: None
80
length from skewed support (feet)
1 0
1 0
Figure 6.11 Top Strut Force in the Internal K-Frames of Girder E Due to Distortion
96

Like the strut forces, there are also larger diagonal forces in the K-frames in end panels in systems with partial depth diaphragms. Figure 6.12 shows the large forces that develop in the diagonals of the internal K-frames nearest the end support when partial depth diaphragms are used. Although the forces in only one diagonal are graphed, the other diag(mal has approximately the same magnitude of force with opposite sign. The large forces in the internal K-frames near the supports are due to box girder distortion in the "soft" end panels adjacent to the partial depth diaphragms.
40
0
-40 Ui c. ~ -80 CD t! .e
-120
-160
-200
Radius: 600 feet Skew: 30 deg lnt-K spacing: each panel ____:full dePful Ext-K: None -+-partial depth!
length from skewed support (feet)
1 0
Figure 6.12 Diagonal Forces in the Internal K-Frames of Girder E
6.2.3 External K-Frames
The use of partial depth diaphragms at the supports results in a reduction in the torsional stiffuess of the girders since the top flange truss is not effectively anchored at the ends. This is demonstrated in Figure 6.13, which shows the twist along the girder length. The twist of the girder with the partial depth diaphragm is considerably larger than the case with the full depth diaphragm. The difference in the distribution of the twist is primarily caused by the large twist in the first panels at the ends of the girders. Since the top truss diagonal is not properly anchored, the system has relatively flexible end panels that result in large twist deformations in these panels.
97

0.020
0.016 partial depth solid diaphragm (0.8d)
-'C e o.o12 -t: 0 ;; 0.008 s 0 ...
0.004
0.000
0 40 80 120 160
length from left support {feet)
Figure 6.13 Twist Along Girder Length for Partial and Full Depth Solid Diaphragms
Although the results presented so far in this chapter have been for girders with no intermediate external K-frames, most of the bridges currently erected in Texas employ external intermediate K-frames between the box girders. The external K-frames connect the girders and control twist between adjacent girders. If a partial depth diaphragm is used at the ends, the external K-frames generally develop larger forces to control the larger twists accompanying the partial depth diaphragms. To demonstrate the effect of the partial depth diaphragm on the external K-frames, a single intermediate external Kframe was positioned near the middle of the twin girder system. Figure 6.14 shows the external K-frame member forces for the two cases of end details with a partial depth end diaphragm and a full depth diaphragm. With the partial depth solid diaphragm there are much larger forces in the intermediate external K-frame. The diagonal forces resulting from the system with the partial depth diaphragm are about four times those of the system with the full depth diaphragm.
29 kips 12 kips
22 kips 3 kips
58 kips 17 kips
-61 kips -14 kips
Partial depth is in bold
Radius of curvature: 600 feet
Skew angle: 0 degree
lnt-K spacing: every panel
Ext-K: 1
Figure 6.14 Member Forces Developed in the External K-Frame
98

6.2.4 Stresses in Girder Flanges and Girder Deflections
From the discussion in the previous section it is apparent that the torsional stiffness of the system is considerably weakened by using a partial depth solid diaphragm at the end supports. The presence of a partial depth diaphragm has somewhat less effect on the shear and bending stiffuess of the girders. Since the members most affected by the reduced diaphragm depth are located in the panels near the end, the girder stresses are generally primarily affected only in these end regions. Figure 6.15 shows the stresses in the exterior top flange of the interior girder along the length of the bridge for models with full depth and partial depth diaphragms. The shape of the flange stresses plotted in the figure are not a smooth curve since there is a variation in the top flange stress near locations where the top lateral struts frame into the flange. As shown in the figure, there is a noticeable increase in flange stresses for the partial diaphragm case in the end regions nearer the supports. The maximum girder stress at midspan is generally not affected by the use of the partial depth diaphragm.
5 Radius: 600 feet -11-full depth
0 Skew: Odeg -+-partial depth - lnt-K spacing: each panel 'iii .::t:.
Ext-K: None - -5 II) II) e -10 u; iii 1: -15 :c ::s ~ -20 1: 0
-25
1 0 -30
length from left support (feet)
Figure 6.15 Stresses in the Exterior Top Flange of Girder I
Girder deflections were also evaluated and compared for systems with partial and full depth solid diaphragms. A graph of the vertical displacement at the center of the bottom flange of an interior girder is presented in Figure 6.16. Decreasing the depth of the solid diaphragm, which reduces the torsional stiffness of the system, obviously leads to increases in the vertical deflection of the girder as shown in the figure.
99

0 Radius: 600 feet ----full depth
:2 -2 u
c
Skew: 0 deg -+-partial depth lnt-K spacing: each panel r-------___J
::;.. Ext-K: None -c • -4 E • u ftl c. -6 II)
'0
iii u -8 ;:: ~ 40 80 120 1 0
-10
length from left support {feet)
Figure 6.16 Displacements at Mid-Span of Girder I
The use of partial depth end diaphragms in skewed and curved box girders can result in unsafe designs. The larger forces in the diagonals of the top flange truss, as well as in the members of the internal K-frames, could result in the failure of one of these braces. Such a failure would be most likely to occur during casting of the concrete deck and could lead to progressive failure of several of these braces. Even if the forces in the bracing members do not exceed their capacity, the increases in rotation and deformation resulting from the use of partial depth diaphragms can reduce the quality of the concrete deck. In the analyses discussed throughout the remainder of this chapter, full depth diaphragms were provided at each support.
6.3 Diaphragm Connection Details
In the grid analysis that is frequently used to model the box girders, the plate diaphragms are modeled as line elements. These line elements therefore require a "moment connection" between the girders and the solid diaphragms. Conventional detailing for flexural members usually requires connecting the flanges of the bending member to fully develop the rotational stiffuess and strength. Many bridge engineers often detail diaphragm connections that require the flanges of the l-shaped plate diaphragm to be connected to the box sections. In reality, diaphragms with aspect ratios (length over depth) of less than approximately 3 primarily restrain girder twist through the shear stiffness of the web plate of the diaphragm. The top and bottom flanges on the plate diaphragm primarily act as stiffeners to the web plate.
Ongoing work on TxDOT Project 0-4307 Steel Trapezoidal Box Girders: State of the Art is directed at determining the input properties that should be specified for the plate diaphragms in a grid analysis. However, as a supplement to the work detailed in this report, analyses were conducted to demonstrate that the connection of the top and bottom flanges of the solid diaphragm have essentially no effect on the behavior of the system. Analyses were first conducted using top and bottom flanges for the internal and external
100

solid diaphragms that were continuous across the full width of the bridge. Analyses were then conducted with diaphragms that did not have continuous flanges. The discontinuous flanges were modeled by tapering the flanges as shown in Figure 6.17. By tapering the flanges, the continuity of the flange is removed and the response is essentially the same as terminating the diaphragm flanges where the internal and external diaphragms meet. Figure 6.18 shows a graph of the forces in the diagonals of the top flange truss for the interior girder for the two different diaphragm flange connection details. As shown in the figure, the curves for the two diaphragms are essentially concurrent and there is essentially no difference in the top lateral forces for the two diaphragm connection details. The girder twist in systems with continuous and discontinuous diaphragm flanges was also reviewed and the difference in the magnitudes of twist at the girder ends was less than 1% for the two cases.
Based upon these results it can be concluded that continuous flanges are not required on external plate diaphragms at the girder supports for diaphragms with aspect ratios (length/depth) less than approximately 3. Provided the diaphragm flanges extend to within one or two inches of the ends of the plate diaphragms, the flanges can be stopped short of the trapezoidal girder sections without significantly affecting the behavior of the system. However, if the aspect ratio exceeds approximately 3, the flexural stiffness of the diaphragm will begin to affect the stiffness and the flanges should be connected to improve the efficiency of the member. Since the diaphragm is typically trapezoidal in shape, in computing the aspect ratio of the diaphragm, the average length of the diaphragm (at mid-height) should be used.
Figure 6.17 Non-Continuous Flanges for Connection Details of Plate Diaphragms
101

150
100
- 50 1/) a.
:.;: - 0 G)
e .2 -50
-100
-150
Radius: 600 feet Skew: 30 deg lnt-K spacing: e\ery panel Ext-K: None
-+-continuous flange
-u- discontinuous flange
length from skewed support (feet)
1 0
Figure 6.18 Axial Forces of Top Lateral Diagonals in Girder I with Both Continuous and Discontinuous Flanges on Solid Diaphragm
6.4 Top Lateral Truss System Panel Lengths
The ·design of the top flange lateral truss requires selection of an appropriate geometry for the layout of the truss system. Selecting a larger panel length for the truss leads to fewer connections that need to be fabricated, however, the angle of the truss diagonals can become too small and lead to undesirable bracing system behavior. Figure 6.19 shows the definition of the diagonal angle, a., for the top lateral truss system and the panel length, s. The Texas Steel Quality Council (2000) recommends that the minimum angle of the diagonal should be 35 degrees, with an optimal angle of 45 degrees. Using a smaller angle results in the development of larger forces in the diagonals from box girder bending (Helwig and Fan 2000) and also results in a longer diagonal, reducing the buckling capacity of this element.
I+-- s ___,
Figure 6.19 Definition of Top Lateral Diagonal Angle a
102
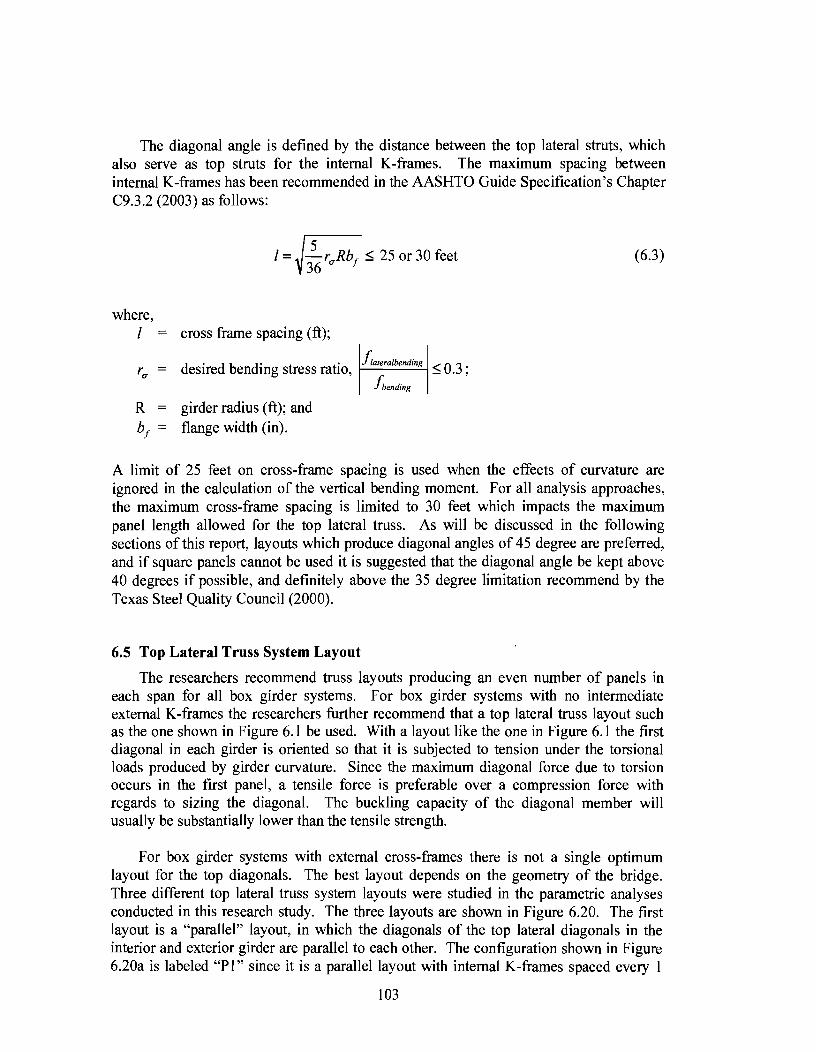
The diagonal angle is defined by the distance between the top lateral struts, which also serve as top struts for the internal K-frames. The maximum spacing between internal K-frames has been recommended in the AASHTO Guide Specification's Chapter C9.3.2 (2003) as follows:
(6.3)
where, I = cross frame spacing (:ft);
d · d b d' • ftatera/bending O 3 ru = esue en mg stress ratio, :5 . ; /bending
R girder radius (ft); and b 1 flange width (in).
A limit of 25 feet on cross-frame spacing is used when the effects of curvature are ignored in the calculation of the vertical bending moment. For all analysis approaches, the maximum cross-frame spacing is limited to 30 feet which impacts the maximum panel length allowed for the top lateral truss. As will be discussed in the following sections of this report, layouts which produce diagonal angles of 45 degree are preferred, and if square panels cannot be used it is suggested that the diagonal angle be kept above 40 degrees if possible, and definitely above the 35 degree limitation recommend by the Texas Steel Quality Council (2000).
6.5 Top Lateral Truss System Layout
The researchers recommend truss layouts producing an even number of panels in each span for all box girder systems. For box girder systems with no intermediate external K-frames the researchers further recommend that a top lateral truss layout such as the one shown in Figure 6.1 be used. With a layout like the one in Figure 6.1 the first diagonal in each girder is oriented so that it is subjected to tension under the torsional loads produced by girder curvature. Since the maximum diagonal force due to torsion occurs in the first panel, a tensile force is preferable over a compression force with regards to sizing the diagonal. The buckling capacity of the diagonal member will usually be substantially lower than the tensile strength.
For box girder systems with external cross-frames there is not a single optimum layout for the top diagonals. The best layout depends on the geometry of the bridge. Three different top lateral truss system layouts were studied in the parametric analyses conducted in this research study. The three layouts are shown in Figure 6.20. The first layout is a "parallel" layout, in which the diagonals of the top lateral diagonals in the interior and exterior girder are parallel to each other. The configuration shown in Figure 6.20a is labeled "PI" since it is a parallel layout with internal K-frames spaced every 1
103

panel. The second configuration, "P2", is a parallel layout with K-frames spaced every 2 panels. In the third top lateral truss system studied the diagonals of the top lateral truss in the interior girder were flipped as shown in Figure 6.20c. This produced a layout in which the top lateral trusses of the two girders are mirror images of each other. This "mirror" layout was evaluated based on the results of the investigations of parallel layout systems with external cross-frames. The mirror layout studied is labeled "M2" since it has internal K-frames spaced every 2 panels.
There are two main differences between the parallel and mirror layouts. The first difference is that with the parallel layout the first diagonal of both the exterior and interior diagonals are subjected to tensile forces due the torsion from the girder curvature. A parallel layout with internal K-frames every other panel is the preferred layout for bridges with no external cross-frames since, as will be discussed in the following sections, this layout results in the smallest forces in the top lateral truss and internal Kframe members. With the mirror layout the first diagonal of the exterior girder is subjected to tensile forces, but the first diagonal of the interior girder will carry compression. The interior girder truss was flipped in the mirror layout rather than that of the exterior girder since the bracing forces are generally smaller in the interior girder.
The second difference between the parallel and mirror schemes is the locations at which the diagonal members of the top lateral truss intersect the cross-frames. In the parallel layout, as shown in Figure 6.21, the truss diagonals of the exterior girder intersect at the external K-frame, but the interior diagonals do not. Thus, in the exterior girder, both the diagonals and the strut help transfer the load from the external K-frame to the girder. However, in the interior girder, only the strut participates in transferring the load to the girder. This leads to the development of larger forces in the internal K-frames in the interior girder at external cross-frame locations. The effect of this force is the most pronounced for systems with skewed supports as will be shown later in this report.
104
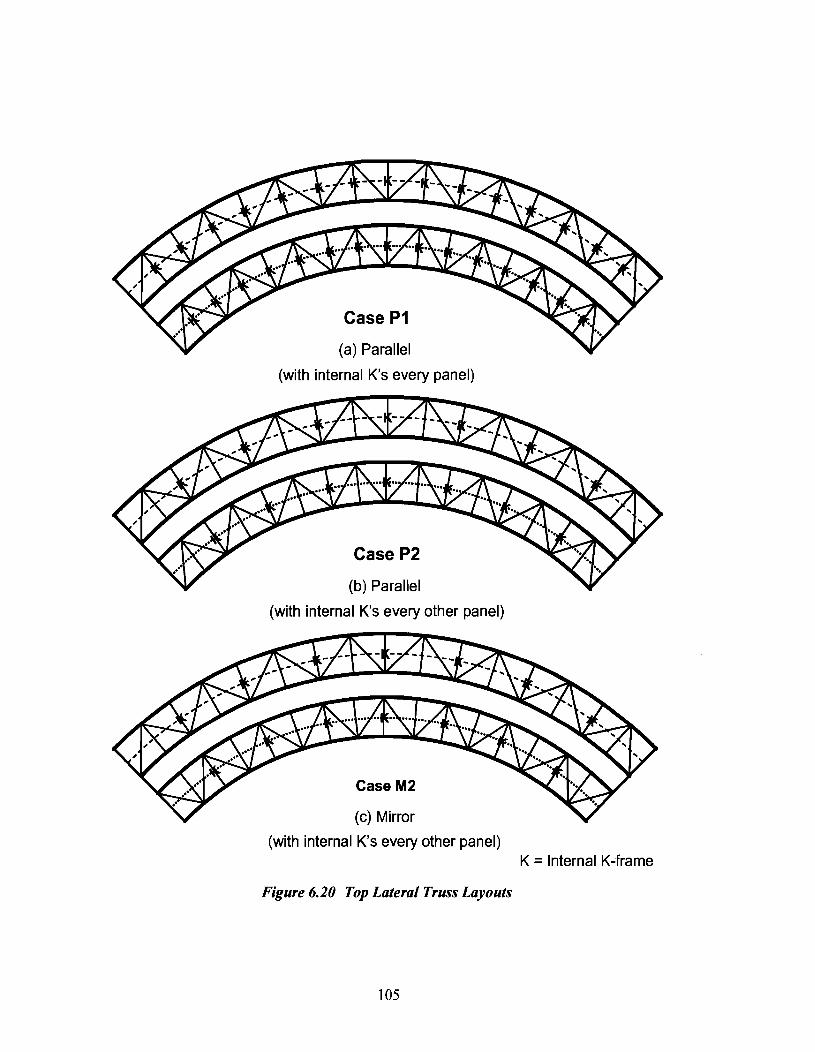
Case P1
(a) Parallel
(with internal K's every panel)
Case P2
(b) Parallel
(with internal K's every other panel)
Case M2
(c) Mirror
(with internal K's every other panel)
Figure 6.20 Top Lateral Truss Layouts
105
K =Internal K-frame
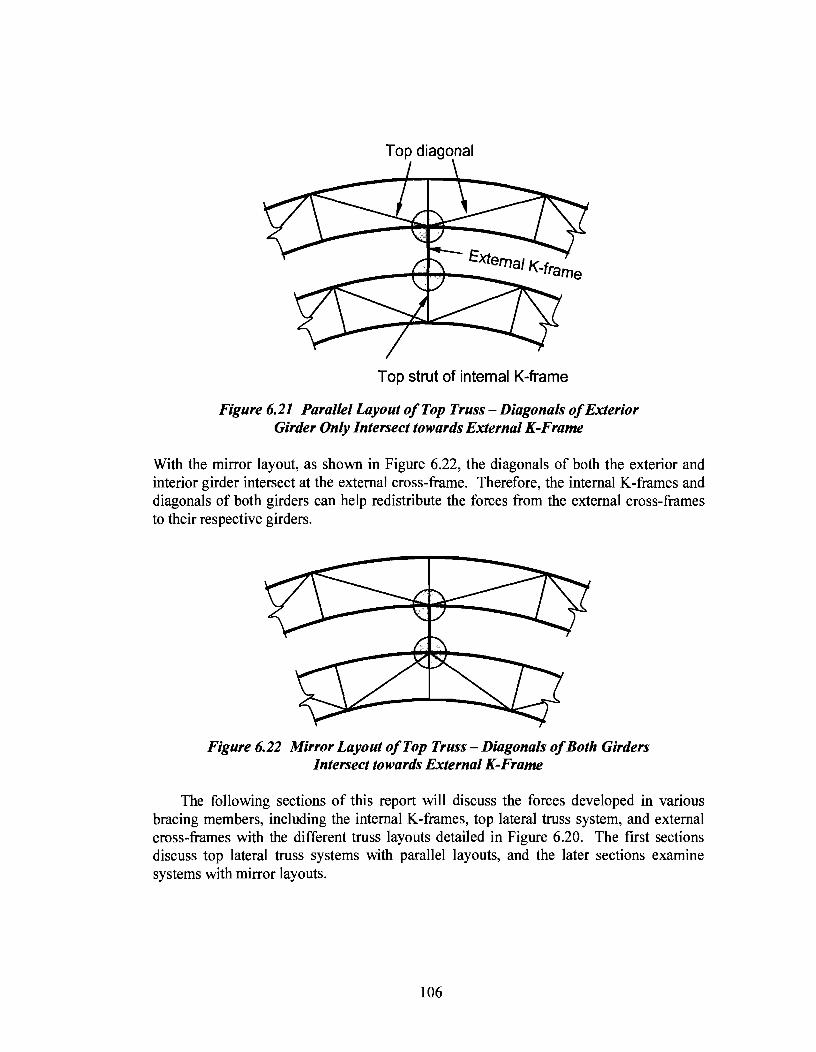
Top diagonal
Top strut of internal K-frame
Figure 6.21 Parallel Layout of Top Truss- Diagonals of Exterior Girder Only Intersect towards External K-Frame
With the mirror layout, as shown in Figure 6.22, the diagonals of both the exterior and interior girder intersect at the external cross-frame. Therefore, the internal K-frames and diagonals of both girders can help redistribute the forces from the external cross-frames to their respective girders.
Figure 6.22 Mi"or Layout of Top Truss- Diagonals of Both Girders Intersect towards External K-Frame
The following sections of this report wi11 discuss the forces developed in various bracing members, including the internal K-frames, top lateral truss system, and external cross-frames with the different truss layouts detailed in Figure 6.20. The first sections discuss top lateral truss systems with parallel layouts, and the later sections examine systems with mirror layouts.
106

6.6 Internal K-Frame Spacing
This section will focus on the impact of internal K-frame spacing with 1) varying top truss panel dimensions and 2) constant panel dimensions. In the first part of this section the system configuration is the Pl case, in which the internal K-frames are provided at every panel point of the top lateral truss system. The internal K-frame spacing, and subsequently the length of the top lateral truss panel, was varied to study the impact on the bracing system's behavior. In the second part, the top truss panel dimensions were held constant while the internal K-frame spacing was again varied. This study was conducted with a parallel top lateral truss layout like the one shown in Figure 6.20a.
The primary role of the internal K-frames is to control distortion of the box sections. A method of determining the distortional induced forces in the K-frames was developed by Helwig and Fan (2000) for box girders with radial supports, no external K-frames, and internal K-frames spaced at every other panel point of a parallel top lateral truss system. The parametric model described earlier, with a 160 ft. span, was used in preliminary work evaluating skewed system response with internal K-frames at different spacings. However, in later analytical work the span length was extended from 160 to 180 ft. to allow greater flexibility inK-frame spacing. For the 180ft. span length, skew angles ofO and 30 degrees were evaluated for radii of curvature of 600, 1200 and 1800 ft. A span length of 180ft. was only used to study the impact ofvarying K-frame spacing when Kframes were provided at every panel. The discussion presented in the next section of this report will focus on systems with a radius of curvature of 1200 ft. since box girders which are more curved than this are less common. Analyses were conducted with internal K-frames· spaced every first, second, and third panel for systems with 0, 1, or 3 external K-frames.
6.6.1 Effect of Top Truss Panel Geometry- Internal Cross-Frames at Every PanelNo External Cross-Frames
Analyses were conducted on systems with no external K-frames and internal Kframe spacings of 10 and 20 ft. to evaluate the impact of K -frame spacing on the forces developed in the top lateral truss system and the internal K-frames. With the 10 ft. spacing, the diagonal angle for the top flange truss is 45 degrees and with the 20 ft. spacing the angle is 26.6 degrees. The shallow 26.6 degree angle for the larger K-frame spacing is less than the 35 degree minimum recommended by the Texas Steel Quality Council (2000), however, a study of two substantially different K-frame spacings was desired to adequately demonstrate the effects of the larger spacing on the behavior of the bracing.
Figure 6.23 shows the axial forces in the diagonals of the top lateral truss system for both the interior and exterior girders for internal K-frame spacings, s, of 10 and 20ft. In the figure, the forces in the diagonals of the interior girder are plotted along the length of the girder, followed by the diagonal forces along the length of the exterior girder. If the spacing is increased from 10 ft. to 20 ft., the maximum axial force in the top lateral truss increases by approximately 60%. The flat angle of the diagonals with the 20ft. K-frame spacing results in relatively inefficient performance near the ends of the girders where the
107

torsion is high. In addition, with the larger panel lengths (K-frame spacing), the truss diagonals develop larger bending induced forces near midspan. For the system geometry plotted in Figure 6.23 the bending induced forces were smaller than the forces from torsion; however this may not be the case for all systems. In continuous systems, significant bending induced forces can also occur in regions of high torsion such as areas around interior supports, which would intensify the impact of the larger K-frame spacing.
U) Q. li! -Cl)
I:? .2
150
100
50
0
-50
-100
-150
Radius: 1200 feet Skew: 0 deg Ext-K: None
...,._s = 10feet
-s =20feet
length along span (feet)
Figure 6.23 Axial Forces in Diagonals of Top Truss System (Varying Internal K- Frame Spacing and Panel Dimension - Pl Truss)
Forces induced in the struts of the top lateral truss system from torsion and box girder bending are shown in Figure 6.24, and those from box girder distortion are shown in Figure 6.25. The components of the truss forces were computed using Equations (6.1) and ( 6.2). The axial forces due to bending and torsion increase by approximately 60% with the larger K-frame spacing as shown in Figure 6.24. The forces caused by distortion, Figure 6.25, are essentially tripled when the spacing of the internal K-frames is changed from 10 to 20ft. Figure 6.26 shows the forces in the diagonals of the internal Kframes, and like the strut distortional forces, the forces in the K-frame diagonals are tripled with the wider K-frame spacing.
The zig-zagging nature of the graph of the strut forces results from the torsional components of load that develop in the struts. In a single diagonal truss system the torques tend to cause the diagonals of the top truss in adjacent panels to experience alternating states of tension and compression. In a system subjected to uniform torsion, the magnitude of the diagonal forces in adjacent panels would have equal magnitudes of force with opposite signs. Considering equilibrium of the connection joint where 2 truss diagonals and a strut frame into the joint, the system is in equilibrium. With non-uniform torsion along the girder length, however in addition to an opposite state of stress, the magnitudes of the torques in two adjacent panels are different. Therefore, one diagonal will have a larger magnitude of the force than the adjacent diagonal. As a result, the strut
108
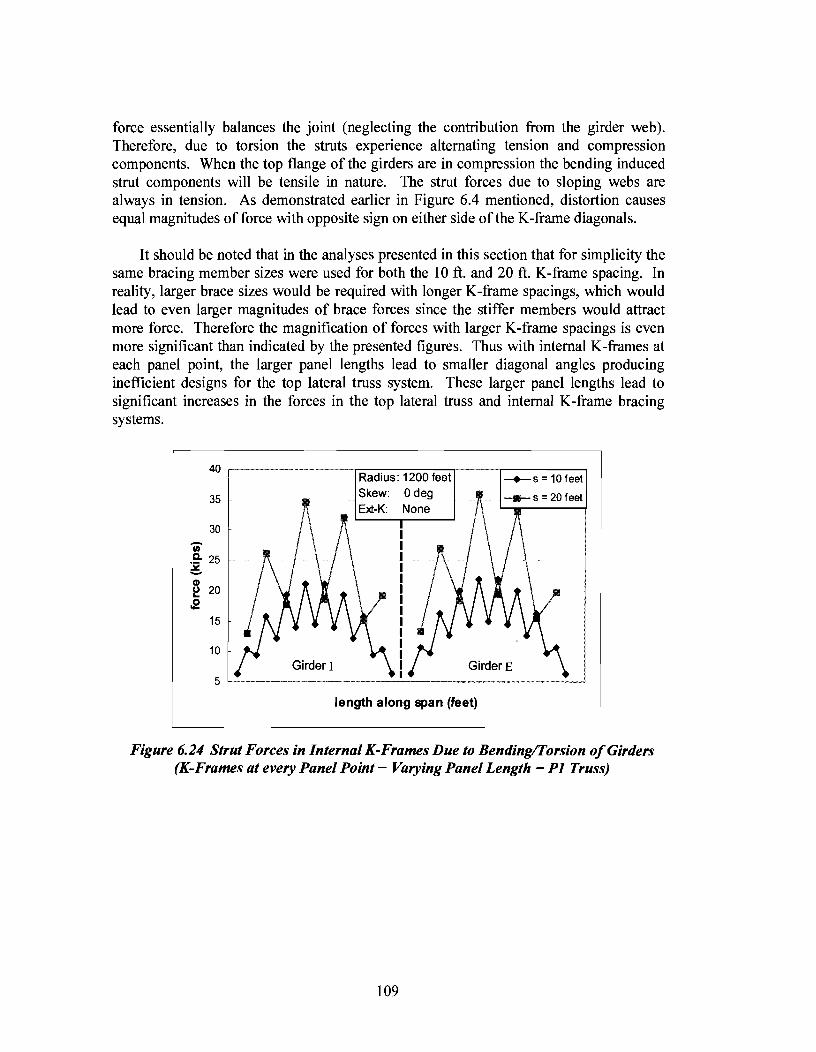
force essentially balances the joint (neglecting the contribution from the girder web). Therefore, due to torsion the struts experience alternating tension and compression components. When the top flange of the girders are in compression the bending induced strut components will be tensile in nature. The strut forces due to sloping webs are always in tension. As demonstrated earlier in Figure 6.4 mentioned, distortion causes equal magnitudes of force with opposite sign on either side of the K-frame diagonals.
It should be noted that in the analyses presented in this section that for simplicity the same bracing member sizes were used for both the 10ft. and 20ft. K-frame spacing. In reality, larger brace sizes would be required with longer K-frame spacings, which would lead to even larger magnitudes of brace forces since the stiffer members would attract more force. Therefore the magnification of forces with larger K-frame spacings is even more significant than indicated by the presented figures. Thus with internal K-frames at each panel point, the larger panel lengths lead to smaller diagonal angles producing inefficient designs for the top lateral truss system. These larger panel lengths lead to significant increases in the forces in the top lateral truss and internal K-frame bracing systems.
40 --------~-"'--r::--::---,..,.--::--....--- -.,------..., Radius: 1200 feet
35
30 'i) ,!; 25 ~ -G)
f:! 20 .e
15
10
5 Girder I
Skew: 0 deg Eld-K: None
I
--.- s = 10 feet
Girder E
length along span (feet)
Figure 6.24 Strut Forces in Internal K-Frames Due to Bending/Torsion of Girders (K-Frames at every Panel Point- Varying Panel Length- PI Truss)
109

'iii' 10 a.
;g_ 5
~ .e 0
-5
-10 Girder I Girder E -15 ...____ _______ , __ __,_ _________ ____j
length along span (feet)
Figure 6.25 Strut Forces in the Internal K-Frames Due to Distortion (K-Frames at every Panel Point- Varying Panel Length- Pl Truss)
30 --+-s = 10feet
20
10
0 'iii .9- -10 :. ~ -20 0 .... -30
-40
-50 Skew: Odeg Girder I Ext-K: None
-60
length along span (feet)
Figure 6.26 Diagonal Forces in the Internal K-Frames (K-Frames at every Panel Point- Varying Panel Length - Pl Truss)
6.6.2 Layouts Alternating Internal K-Frame and Top Strut Only Braces
As discussed previously, the purpose of the internal K-frames is to control distortion of the box girder cross-section. For most practical box girder designs, it is not necessary to provide an internal K-frame at every single panel point of the top lateral truss to control the distortional behavior of the box girders. While it is necessary to provide a top strut for the truss system, the diagonal members of the internal K-frame can often be
110
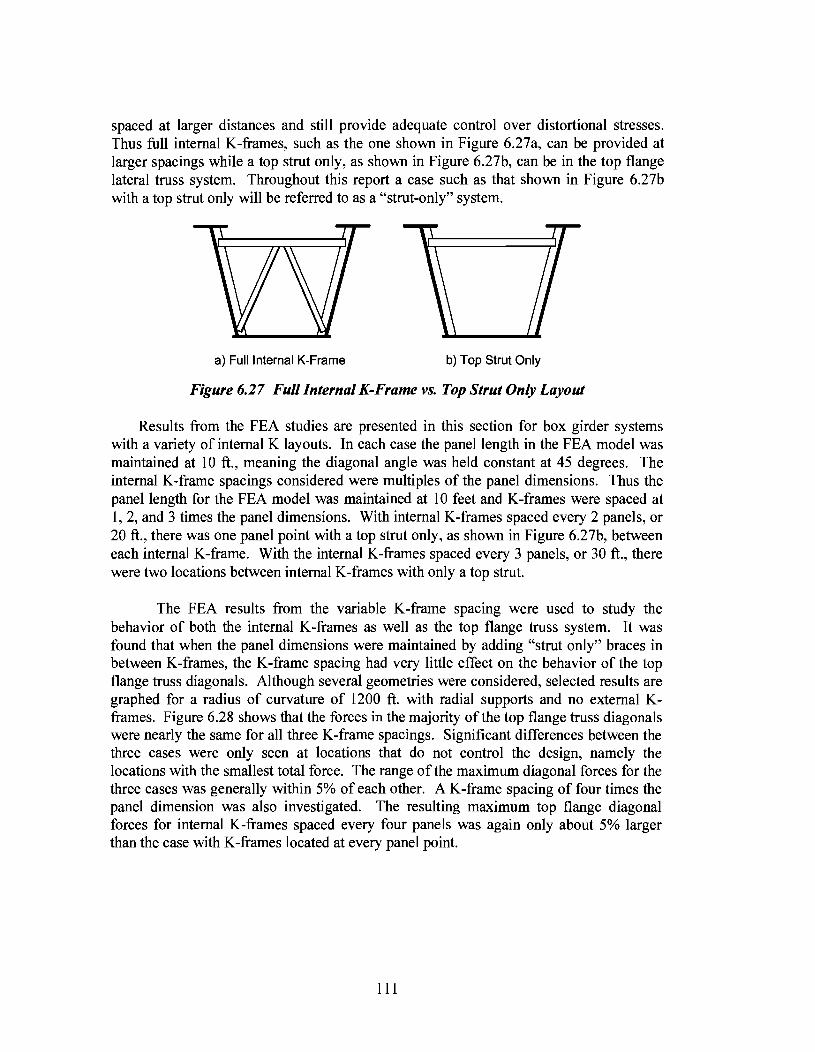
spaced at larger distances and still provide adequate control over distortional stresses. Thus full internal K-frames, such as the one shown in Figure 6.27a, can be provided at larger spacings while a top strut only, as shown in Figure 6.27b, can be in the top flange lateral truss system. Throughout this report a case such as that shown in Figure 6.27b with a top strut only will be referred to as a "strut-only" system.
a) Full Internal K-Frame b) Top Strut Only
Figure 6.27 Full Internal K-Frame vs. Top Strut Only Layout
Results from the FEA studies are presented in this section for box girder systems with a variety of internal K layouts. In each case the panel length in the FEA model was maintained at 10 ft., meaning the diagonal angle was held constant at 45 degrees. The internal K-frame spacings considered were multiples of the panel dimensions. Thus the panel length for the FEA model was maintained at 10 feet and K-frames were spaced at 1, 2, and 3 times the panel dimensions. With internal K -frames spaced every 2 panels, or 20ft., there was one panel point with a top strut only, as shown in Figure 6.27b, between each internal K-frame. With the internal K-frames spaced every 3 panels, or 30ft., there were two locations between internal K-frames with only a top strut.
The FEA results from the variable K-frame spacing were used to study the behavior of both the internal K-frames as well as the top flange truss system. It was found that when the panel dimensions were maintained by adding "strut only" braces in between K-frames, the K-frame spacing had very little effect on the behavior ofthe top flange truss diagonals. Although several geometries were considered, selected results are graphed for a radius of curvature of 1200 ft. with radial supports and no external Kframes. Figure 6.28 shows that the forces in the majority of the top flange truss diagonals were nearly the same for all three K-frame spacings. Significant differences between the three cases were only seen at locations that do not control the design, namely the locations with the smallest total force. The range of the maximum diagonal forces for the three cases was generally within 5% of each other. A K-frame spacing of four times the panel dimension was also investigated. The resulting maximum top flange diagonal forces for internal K-frames spaced every four panels was again only about 5% larger than the case with K-frames located at every panel point.
111

100
80
60
";) 40
c. 20 ~ -c» 0 ~ .2 -20
-40
-60
-80 Girder I
I ...... I I l
Radius: 1200 feet Skew: Odeg Ext-K: None
GirderE
length along span (feet)
Figure 6.18 Axial Forces in Diagonals of Parallel Top Lateral Truss (Varying Internal K-Frame Spacing with Constant Panel Dimension)
The forces in the top struts were separated into the components from box girder torsion/bending and the component from distortion using Equations (6.l)and (6.2)as discussed earlier. Figure 6.29 shows the strut forces due to box girder torsion and bending along the length of the interior and exterior girders. The figure includes the forces in both the top struts of the internal K-frames and the struts at locations where a full K-frame was not provided. The strut forces are larger at internal K-frame locations and smaller at "strut only" locations thus the curves, which plot forces in all struts, have a jagged appearance.
The strut forces were the largest for the cases with K-frames located at either 1 or 3 panel spacings. Positioning the K-frames at every other panel point, which is the P2 layout shown in Figure 6.20b, resulted in the smallest strut forces. These results are consistent with those found by Fan and Helwig (2004 - manuscript). The design expressions presented in Helwig and Fan (2000) were developed based upon this P2 parallel layout with K-frames at every other panel.
112

25 r-------~----~~~~~~,---------------~ Radius: 1200 feet --.--1 panel
10
Girder I 5
Skew: Odeg Ext-K: None
Girder E
length along span (feet)
Figure 6.29 Top Strut Forces Due to Bending and Torsion of Girder (Varying Internal K-Frame Spacing with Constant Panel Dimension - Parallel Truss)
The top strut forces from distortion are shown in Figure 6.30. Distortional forces are only produced in the top struts at locations where a full internal K-frame is provided, thus, there are fewer data points on the curves with larger K-frame spacings. For the internal K-frame spacings of 2 and 3 panels, the forces are coarsely in proportion to the tributary length controlled by the braces, which is equal to the spacing of the internal Kframes. Although with K-frames at every panel the tributary length controlled by each Kframe is half that for a system with K-frames at every other panel, maximum axial force in the internal K -strut is typically larger with internal K' s at every panel. Similar trends occurred in the internal K-frame diagonals as shown in Figure 6.31.
113
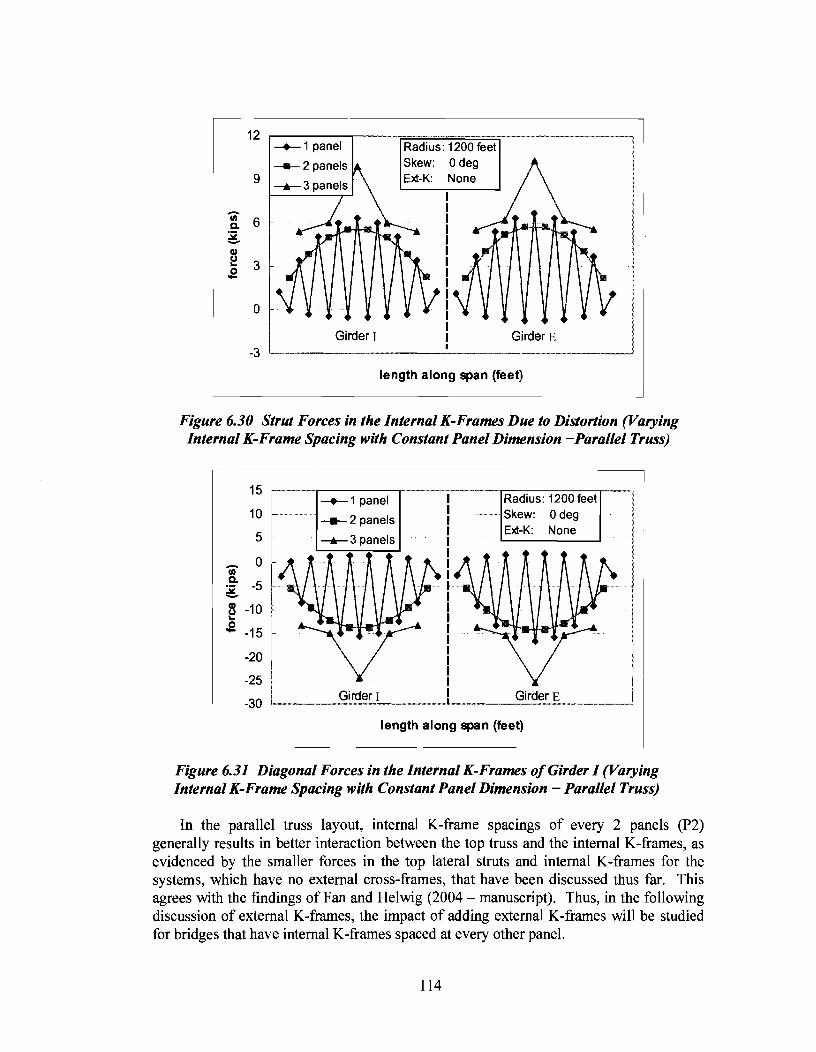
12
9
e 3 .e
0
-3
--+-1 panel
Girder I
Radius: 1200 feet Skew: 0 deg Ext-K: None
length along span (feet)
Figure 6.30 Strut Forces in the Internal K-Frames Due to Distortion (Varying Internal K-Frame Spacing with Constant Panel Dimension -Parallel Truss)
15
10
5
0
e -10
.e -15
-20
-25
-30
--+-1 panel I I I I I I I I I I I I I I I I I I I I
Radius: 1200 feet Skew: Odeg Ext-K: None
Girder E
length along span (feet)
Figure 6.31 Diagonal Forces in the Internal K-Frames of Girder I (Varying Internal K-Frame Spacing with Constant Panel Dimension -Parallel Truss)
In the parallel truss layout, internal K-frame spacings of every 2 panels (P2) generally results in better interaction between the top truss and the internal K-frames, as evidenced by the smaller forces in the top lateral struts and internal K-frames for the systems, which have no external cross-frames, that have been discussed thus far. This agrees with the findings of Fan and Helwig (2004 - manuscript). Thus, in the following discussion of external K-frames, the impact of adding external K-frames will be studied for bridges that have internal K-frames spaced at every other panel.
114

6.7 External K-Frames - Impact on Systems with Parallel Top Lateral Truss Layout and Internal K-Frames Every Other Panel (P2)
The parametric model described in the introduction to this report was used to study the brace forces developed in the top lateral truss system and internal K-frames when intermediate external cross-frames were added to the system. Since the top lateral truss system P2 shown in Figure 6.20b was shown to produce the best bracing force distribution in bridges with no external cross-frames, this same layout was evaluated for bridge models with external cross-frames. Systems with 1, 2, and 3 external K-frames were evaluated as shown in Figure 6.1 and Figure 6.3. In all plots presented for the remainder of this chapter the same scale will be used on forces for each member type (strut or diagonal) to facilitate ease of comparison
Forces are generated in the external K-frames by relative displacements between adjacent girders. The K-frame forces are caused by both relative twisting of the girders as well as differential vertical and horizontal deflections of the boxes. Differential vertical deflection between girders generally results from the different lengths of adjacent girders in curved bridges. Differential displacements are shown in Figure 6.32a. The difference in vertical displacement, AE-Ah generates forces in the external K-frames. Figure 6.32b shows the relative girder twists that occur as the curved girders twist away from the center of curvature of the bridge. As a result of the girder twist, moments are applied to the external K-frame as shown in the figure. The external K-frames essentially add a restoring torque to the girder systems to control the relative twist of the two girders. If the girder supports are radial, the relative displacements between the interior and exterior girder are comparatively small, and the external K-frame forces developed due to girder rotation are dominant. However, when the twin box girder supports are skewed, the differential deflections between adjacent girders can be considerable due to the unsymmetrical geometry produced by the skewed supports.
The primary reason that external K-frames are used is to control the relative deformation between adjacent girders during placement of the concrete deck. The current practice in Texas is to remove the external K-frames from the bridge once the composite concrete deck is in place. Relative twisting of two adjacent girders results in a non-uniform deck thickness, which is undesirable mainly for serviceability issues. Although the smaller concrete thickness caused by girder twist can affect the ultimate strength of the composite section, the affect would most likely be minimal since portions of the deck would thicker over parts of the girder cross-section and thinner over other parts. However, the girder rotation can result in less concrete cover on some regions of the deck reinforcing steel. In cases of extreme differential twist between the girders "scalping" of the deck steel could take place, which means that the steel is visible at the top surface of the deck. The reduction in the concrete cover over regions of the bridge deck can cause long-term serviceability problems with the deck.
115

Girder E /1v -/1v
E I Girder I
--,--------------
a) Due to vertical deflection
Girder E /1r -/1r
Girder I E I
\ --------------.,.- \ \
)(SJ )( 0 m \ \
\ b) Due to rotation \
Figure 6.31 Moments Between the External K-Frame and Box Girders
The following discussion is divided into three subsections. The effect of the external K-frames on the deformational behavior of the box girders will first be discussed, followed by the impact of external K-frames on the top lateral truss system. Finally, the effect of external K-frames on the forces developed in the internal K-frames will be discussed. As noted, this section will use a parallel top lateral truss layout with internal K-frames every other K-frame as shown in Figure 6.20b. The design equations that were developed by Helwig and Fan (2000) for the top lateral truss and the internal K-frames in girders with radial supports used this same top lateral truss layout. Although the design expressions developed by Helwig and Fan (2000) were very accurate for systems with radial supports and no intermediate external K-frames, the effects or skew or external K's on the accuracy of the equations was not considered in the previous work. Throughout this discussion it will be assumed that like-sized top lateral trusses and internal K-frames, respectively, would be provided in both girders.
6. 7.1 Girder Deformation
As previously mentioned, the primary purpose of the external K-frame is to control the relative deformation of adjacent girders so that a uniform deck thickness can be achieved. In the field, the thickness of the deck is typically set at the screed rails.
116

Therefore, regardless of how the girders deform, the thickness of the concrete at the screed rails should meet specified requirements. However, as shown in Figure 6.33, relative deformation between the two girders can result in an undesirable variation in the deck thickness. By using external K-frames the relative deformation of the two adjacent girders can be controlled so that a more uniform concrete thickness is achieved across the bridge width as shown in Figure 6.34.
Girder E Girder I
Figure 6.33 Concrete Deck in Transverse Direction without Intermediate External K-Frame
GirderE Girder I
----+-------=~:=1--f ~---~---h~i;-!-==---~-.,__~-----?\ --~;---
' Figure 6.34 Concrete Deck in Transverse Direction with
Intermediate External K-Frame
To investigate the behavior of box girder systems with external cross-frames, analyses were first conducted on systems with no external K's and then external K's were added. The presented results will focus on systems with 0, 1, and 3 external K-frames. Labels are used for the top flange locations in the plots to help describe the presented deformations. As shown in Figure 6.35, labels ofE-TF (exterior- top flange) and 1-TF (interior - top flange) are used to refer to points at the centroids of the exterior and interior top flange, respectively, for each girder. As with other references used in this report, "exterior" is used to label a point away from the center of curvature of the bridge, and interior is used at locations nearer the center of curvature.
117

I-TF l
Girder I
E-TF l
I-TF l
Girder E
Figure 6.35 Top Flange Positions used in Plots of Vertical Deflection
Figure 6.36 shows the vertical deflection profile of the twin girder system with different external K-frame layouts. The deflections shown in Figure 6.36 occurred at the midspan of the girders, where the deflections in the simply-supported girders were the largest. For the system with no external K-frames, there is a variation in the deformation between the two adjacent top flanges of the box girders. For the particular system that was considered in this analysis, the relative deformation between the two flanges was approximately 0.3 in. For systems with longer spans the relative deformation between boxes can be considerably larger with no external K-frames.
In addition to the top flange deflections with no external K-frames, Figure 6.36 also shows the top flange displacements at midspan for systems with I and 3 external Kframes. Figure 6.3 7 shows the corresponding deflection profile at the quarter points of the bridge. There is not a significant difference between the deflection characteristics for the systems with I and 3 external K-frames. The system with 3 external K-frames has slightly smaller deflections, particularly at the quarter points, but the differences between the 1 and 3 external K-frame cases are comparatively small. The expected concrete deck thickness will be relatively uniform across the bridge width for the layouts with either I or 3 external cross-frames. Although the results shown are for systems with radial supports, analyses were also done on systems with skewed supports and similar results were obtained. As with radial supports, the addition of a single external cross-frame minimized the relative twist between the girders compared to the case with no external Kframes, and the addition of 2 more cross-frames did not produce significantly better behavior.
118
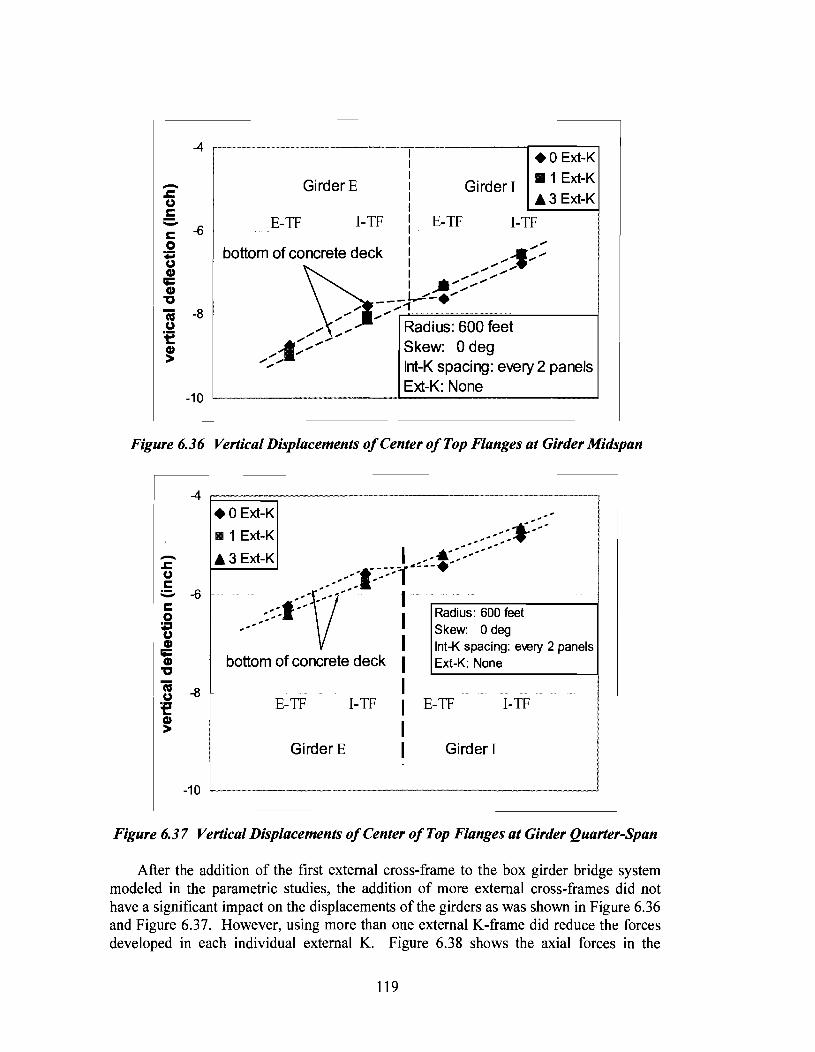
-4
-.c GirderE
I I I I I I
Girder I
+O Ext-K •1 Ext-K .3 Ext-K CJ
c :,:.. c -6 -- E-TF I-TF I E-TF
l I-TF I ..,.. 0
ti CD
q:: CD
"0
-10
bottom of concrete deck 1 ..... :J.::> ~ :.::-=--~L~::::.:> ... \~::J Radius: 600 feet
_..J;.............. Skew: 0 deg ............. lnt-K spacing: every 2
Ext-K: None
Figure 6.36 Vertical Displacements of Center of Top Flanges at Girder Midspan
-4 F=====,----------------------------
-.c CJ .5 - -6 c 0
ti CD -; "0
~ -8 :e ~
+O Ext-K
II 1 Ext-K
.3 Ext-K
E-TF
Girder
Radius: 600 feet Skew: 0 deg lnt-K spacing: every 2 panels Ext-K: None
I-TF
Figure 6.37 Vertical Displacements of Center of Top Flanges at Girder Quarter-Span
After the addition of the first external cross-frame to the box girder bridge system modeled in the parametric studies, the addition of more external cross-frames did not have a significant impact on the displacements of the girders as was shown in Figure 6.36 and Figure 6.37. However, using more than one external K-frame did reduce the forces developed in each individual external K. Figure 6.38 shows the axial forces in the
119

external K-frame members for systems with 1 and 3 external K-frames. The member forces for the system with 3 external K's are in bold. Figure 6.38a shows the forces in the external cross-frame at midspan, which is the only cross-frame for the system with 1 K-frame, and Figure 6.38b shows the forces in the external K-frames at the quarter span locations. The forces in the diagonals and bottom strut of the cross-frame at midspan are reduced by 40 to 50% in the system with 3 external K's compared to the system with a single external K-frame. As expected, the forces in the cross-frames at the quarter-span locations for the system with 3 external K-frames are smaller than for the case with a single cross-frame at midspan.
Thus, as shown in Figure 6.38, the use of more external cross-frames results in smaller member forces in each cross-frame, however, as discussed, the parametric studies showed that there was not a significant return in terms of minimizing relative girder displacements by using more external cross-frames. Therefore for the case analyzed, which was a simply-supported girder system with a 160 ft. span, using only one adequately sized external cross-frame would be the best approach if external bracing was desired for serviceability during the deck cast. With significantly longer spans the designer might choose to use a additional external K-frames. It should be noted that when laying out the external K-frame locations a cross-frame positioned at girder midspan will be the most effective at minimizing relative girder twist. Thus, if a layout with 2 external K-frames is used these 2 cross-frames should not be placed at the third points of the span but should instead be biased towards the midspan of the girder. For simplicity a designer who feels a single K-frame is inadequate may choose to move to a system with 3 K-frames so that one of the K-frames can be positioned in the most effective location: at the girder midspan. Although K-frames were positioned at the quarter points in the case with 3 external braces, better behavior with regards to controlling girder twist while minimizing the brace forces will most likely be achieved by biasing the other two braces towards midspan.
5.4kips 11.6 kips
2.9 kips 3.5 kips
-9.0 kips -15.1 kips
a) Cross-frame forces at midspan
3 Ext-Ks data in bold
Radius of curvature: 600 feet
Skew angle: 0 degree
Span length 160 feet
lnt-K spacing: every 2 panels
1.8 kips
4.7 kips -7.2 kips
b) Cross-frame forces at quarter-span
Figure 6.38 Resultant Axial Forces in External K-Frames with 1 and 3 External K's
6. 7.2 Diagonals of Top Lateral Truss System
This section will discuss the impact of variations in the number of external K-frames on the forces developed in the diagonals of the top lateral truss system for the P2 layout,
120

which is a parallel top truss system with internal K-frames spaced every other paneL The P2 system is the layout that had the smallest top lateral and internal K-frame forces in box girder systems with no external cross-frames. Most of the figures presented in the following discussion are for systems with a radius of curvature of 1200 ft., span lengths of 160 ft., and skew angles of 0 or 30 degrees. Additional representative figures are included in the appendix.
The axial forces in the top diagonals of systems with 0, 1, and 3 external K-frames are presented in Figure 6.39 and Figure 6.40. Figure 6.39 shows the diagonal forces developed in a system with radial supports and Figure 6.40 shows the diagonal forces in a system with a support skew of 30 degrees. With radial supports, the maximum truss diagonal forces are reduced by less than 4% with the addition of the first external crossframe, and reduced slightly more with the addition of more intermediate external braces. With skewed supports, there are small increases ( < 3%) in the maximum diagonal crossframe forces.
Additional conclusions can be drawn from Figure 6.39 with regards to the accuracy of the equations from the equivalent plate method and the expressions for bending induced forces that have been discussed in Chapter 2. The previous studies presented in Helwig and Fan (2000) demonstrated that these expressions had excellent agreement with the FEA solutions for the parallel truss systems with internal K-frames at every other panel, radial supports and no external K-frames. Figure 6.39 shows that adding external K-frames to this system with radial supports has a small impact on the forces in the diagonals of the top lateral truss. Therefore, applying the equations developed by Helwig and Fan (2000) in TxDOT Research Study 1395, will provide reasonable estimates of the diagonal forces.
As noted above, for the skewed system shown in Figure 6.40, there were very small increases (< 3%) in the maximum truss diagonal forces when the external cross-frames were added. Thus, for design purposes, there is negligible impact on the truss diagonal forces when external cross-frames are added to the system. However, comparing Figure 6.39 and Figure 6.40, there is a significant increase in maximum top diagonal forces in both girders when a skew is added at an end support.
Comparing Figure 6.39 and Figure 6.40, when a skew is added to the support at the left end of the bridge there is a reduction in the top diagonal forces near the skewed support, and significant increases in the diagonal forces nearer the radial support. As will be demonstrated in Chapter 7, when the left support is skewed, there is a transfer in torsional demands from the skewed support to the radial support, and hence the top diagonal forces nearer the radial support increase, while those nearer the skewed support increase. The critical diagonal force increases from approximately 57 to 104 kips, or about 80%, when the 30-degree end skew is introduced.
121

150 ~----~~--------r-------r-------~--~~ Radius: 1200 feet
100
50
-50
-100
-150
Skew: 0 deg lnt-K spacing: every 2 panels
Girder I
I -+-No Ext-K I I -1 Ext-K t .............. --- --1 1 _.,_ 3 Ext-K I I I I I t I I I I I I I I I I
GirderE
length along span (feet)
Figure 6.39 Axial Forces Developed in Top Truss Diagonals (P2-Radial Support)
150 Radius: 1200feet I -+-No Ext-K Skew: 30deg I
100 lnt-K spacing: every2 panels L ..... -1 Ext-K I I _.,_3 Ext-K I
50 I I I
0 I I I I
-50 I I I I
-100 I I
GirderE Girder I I
I -150
length from skewed
Figure 6.40 Axial Forces Developed in Top Truss Diagonals (P2-30° Skewed Support)
6. 7.3 Internal K-Frames and Top Struts
The impact of variations in the number of external K-frames on the forces developed in the internal K-frames and "strut-only" members will be discussed in this section. In general, the forces in the internal K-frames are only impacted at the location of the external K-frame(s). In other words, the only K-frames affected by the addition of
122
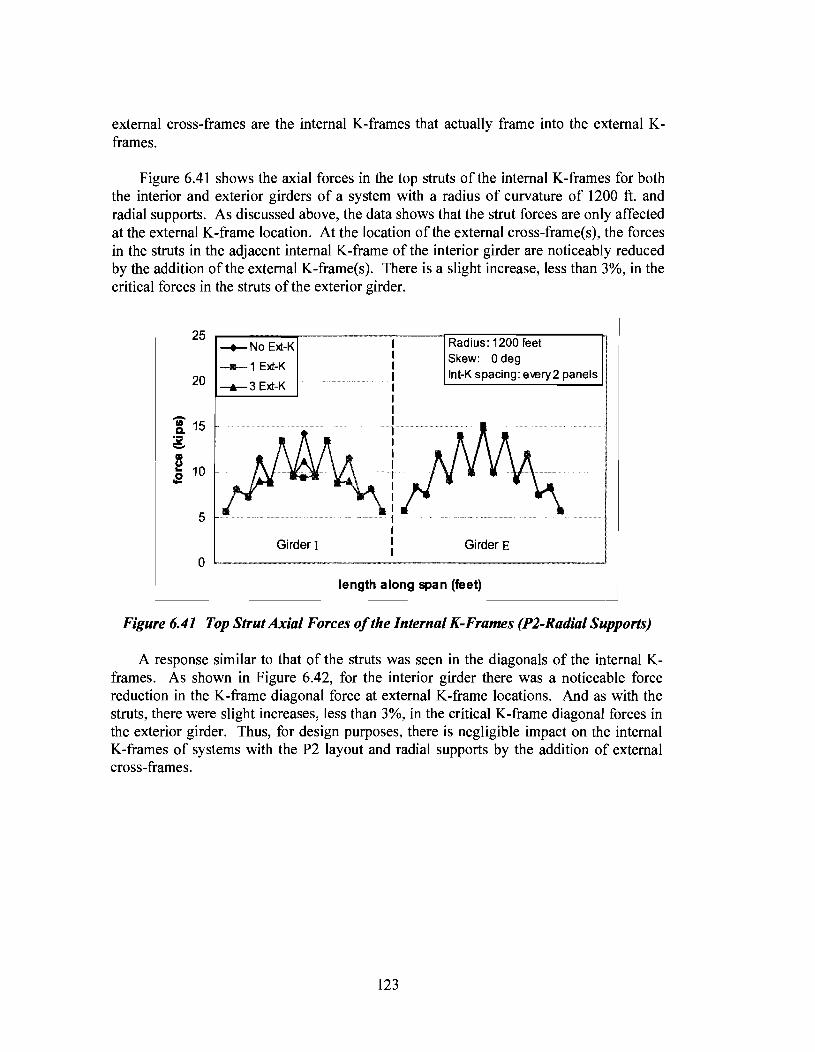
external cross-frames are the internal K-frames that actually frame into the external Kframes.
Figure 6.41 shows the axial forces in the top struts of the internal K-frames for both the interior and exterior girders of a system with a radius of curvature of 1200 ft. and radial supports. As discussed above, the data shows that the strut forces are only affected at the external K-frame location. At the location of the external cross-frame(s), the forces in the struts in the adjacent internal K-frame of the interior girder are noticeably reduced by the addition of the external K-frame(s). There is a slight increase, less than 3%, in the critical forces in the struts of the exterior girder.
5
Girder I
0
I I I I I I I
Radius: 1200 feet Skew: Odeg lnt-K spacing: every2 panels
Girder E
length along span (feet)
Figure 6.41 Top Strut Axial Forces of the Internal K-Frames (P2-Radial Supports)
A response similar to that of the struts was seen in the diagonals of the internal Kframes. As shown in Figure 6.42, for the interior girder there was a noticeable force reduction in the K-frame diagonal force at external K-frame locations. And as with the struts, there were slight increases, less than 3%, in the critical K-frame diagonal forces in the exterior girder. Thus, for design purposes, there is negligible impact on the internal K-frames of systems with the P2 layout and radial supports by the addition of external cross-frames.
123

10 I Radius: 1200 feet -+-No Ext-K I Skew: 0 deg __._1 Ext-K I
5 _.,_3 Ext-K I lnt-K spacing: every 2 panels I I I
li' 0 I Q. T li! I - I ~ -5
I .2 I
I I I
-10 ................. I I
Girder I I
Girder E I -15
length along span (feet)
Figure 6.42 Diagonal Forces of the Internal K-Frallfi! (P2-Radial Supports)
The top lateral truss and K-frame forces of systems with a skewed support were also examined. Figure 6.43 shows the strut forces for the same bridge geometry, only now a skew of 30 degrees has been added at the left support. As shown in Figure 6.43, there are significant increases in the strut forces in the interior girder when external cross-frames are added. The strut forces are increased at the location of the external cross-frame(s). Comparing the system with no external cross-frames to that with 1 external cross-frame, there is an 80% increase in the magnitude of the design strut force when the external K is added. The "design" strut force refers to the maximum force in the struts, assuming that all struts would be sized equally to facilitate fabrication. There are also increases in the K-frame diagonal forces in the interior girder when external.K-frames are added as shown in Figure 6.44. The maximum design force increase is about 20% when a single cross-frame is added.
As was discussed earlier in this chapter, the fact that there is a more significant effect on the K-frames in the interior girder in the skewed system is due the layout of the top flange truss as shown in Figure 6.21. As shown in the shaded region on the exterior girder in this figure, the diagonals of the top lateral truss frame into the top flange at the external K-frame location. These diagonals help to resist the external K-frame force. However, in the interior girder there is only a strut framing into the top flange at the location of the external K-frame. Due to the layout of the truss diagonals, there was a more significant effect on the forces in the interior girder than there was for the exterior girder.
124

25
20
-1!.15 :i -~ 10 .2
5
Girder I
0
-+-No Ext-K
-1111- 1 Ext-K
-.-3 Ext-K
I I I I I I I I I I I I I I I
Radius: 1200 feet Skew: 30deg lnt-Kspacing: every2
Girder E
length along span (feet)
Figure 6.43 Top Strut Forces in the Internal K-Frame (P2-30° Skewed Support)
10
5
c;; 0 a. ;g. 3 ... -5 .2
-10
-+-No Ext-K
-1111- 1 Ext-K \·················• _,._ 3 Ext-K
Girder I
Radius: 1200 feet Skew: 30deg lnt-K spacing: every 2 panels
Girder E
L-15
_____ ·········-······· length along spa~n~(~fe~e~t~) _______ _j
Figure 6.44 Diagonal Forces in the Internal K-Frame (P2-30° Skewed Support)
Comparing the figures for the internal K-frames in girders with radial supports to those in girders with an end skew of 30 degrees, there is a negligible effect on the strut forces in systems with no external cross-frames when an end skew is added. However for the same case, without external cross-frames, there is about a 20% increase in the Kframe diagonal forces with the end skew of 30 degrees. For systems with external crossframes, there is a maximum increase of 80% in the strut forces and 20% in the K-frame diagonal forces with the addition of the skew.
125

For the systems with cross-frames, when a support is skewed there is an impact on the strut forces that is related to the greater differential vertical deflections between the interior and exterior girders because of the end skew. As shown in Figure 6.43, in contrast to the response with radial supports presented in Figure 6.41, there is a substantial increase in the top strut forces in the interior girder and a slight decrease in the top strut forces in the exterior girder with the addition of external cross-frames. The amplification of the strut forces in the interior girder when external K-frames are present in a skewed system is significant, with maximum increases of 80% and 65%, respectively, for systems with 1 and 3 external K-frames, respectively. Although the maximum forces with external K-frames occur in the interior girder, the percentage increases reported above are based upon the strut force in the exterior box girder for the case with no external K-frames since that is the corresponding maximum value. As shown in Figure 6.44, there is much less effect on the forces in the diagonals of the internal K-frames compared to the struts for the system with skewed supports. The diagonal force increases were approximately 20% in the skewed system with external K's.
6.8 Bracing Design Equations Developed in Project 0-1395 for P2 Systems
By comparing the plots presented in the previous section for P2 systems with radial supports to those for systems with skewed supports, the impact of the skew angle on the bracing member forces can be evaluated. As mentioned in the discussion in the previous section, there is a significant impact on the diagonal forces when a skew is added to the P2 system. The torque at the skewed support is reduced, but the torque at the radial support increases substantially for all P2 layouts when a skew is added, including systems with no external cross-frames.
Design expressions for top diagonals and internal K-frames were developed in TxDOT Research Study 0-1395 by Helwig and Fan (2000). These expressions were presented in Chapter 2, and will be referenced as the "1395 equations" throughout the remainder of this report. The 1395 equations were developed for girders with radial supports, parallel top lateral truss layouts, and internal K-frames every other panel, or what is called a P2 Radial layout in this report. Analyses were conducted in this study to verify the accuracy of the 1395 equations for P2 Radial systems, and the equations were found to give relatively accurate predictions of the internal bracing member forces these systems. The appropriateness of these design expressions for P2 systems with skewed supports was also evaluated, and the 1395 equations were found to give good estimates of design forces for skewed systems as well. The following discussion will present a comparison of the top diagonal, strut, and K-frame diagonal forces in a P2 system with a radius of curvature of 600 ft. and a skewed support with a skew angle of 30 degrees.
Figure 6.45 shows the excellent agreement between the 1395 equations and the 3D FEA results for the top diagonal forces in a system with a 30 degree end skew. The equation not only captures the trend of the forces in all diagonals, but also very accurately predicts the maximum diagonal force. Since the 1395 diagonal equations depend on the torque in the girder, and good estimates of the torque can, as discussed earlier, be obtained; the equations do a nice job of predicting the truss diagonal force.
126
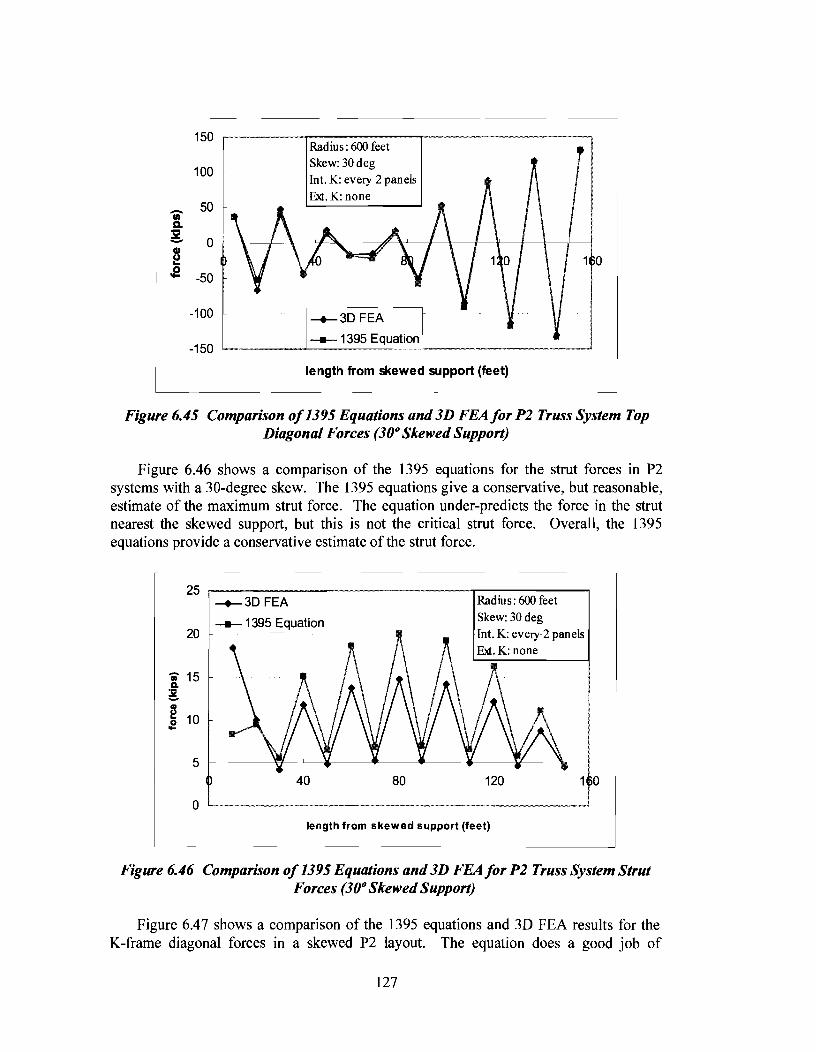
150
100
- 50 • Q.
lii! 0 -
~ .e -50
-100
-150
Radius: 600 feet Skew:30deg Int. K: every 2 panels Ext.K:none
-.-3D FEA
......._ 1395 Equation
length from skewed support (feet)
1 0
Figure 6.45 Comparison of 1395 Equations and 3D FEAfor P2 Truss System Top Diagonal Forces (309 Skewed Support)
Figure 6.46 shows a comparison of the 1395 equations for the strut forces in P2 systems with a 30-degree skew. The 1395 equations give a conservative, but reasonable, estimate of the maximum strut force. The equation under-predicts the force in the strut nearest the skewed support, but this is not the critical strut force. Overall, the 1395 equations provide a conservative estimate of the strut force.
25
20
.... 15 a. ;!.
~ .e 10
5
.-.-3D FEA
......._ 1395 Equation
40 80
Radius: 600 feet Skew: 30deg Int. K: every 2 panels
120 1 0
length from skewed support (feet)
Figure 6.46 Comparison of 1395 Equations and 3D FEAfor P2 Truss System Strut Forces (30 9 Skewed Support)
Figure 6.47 shows a comparison of the 1395 equations and 3D FEA results for the K-frame diagonal forces in a skewed P2 layout. The equation does a good job of
127
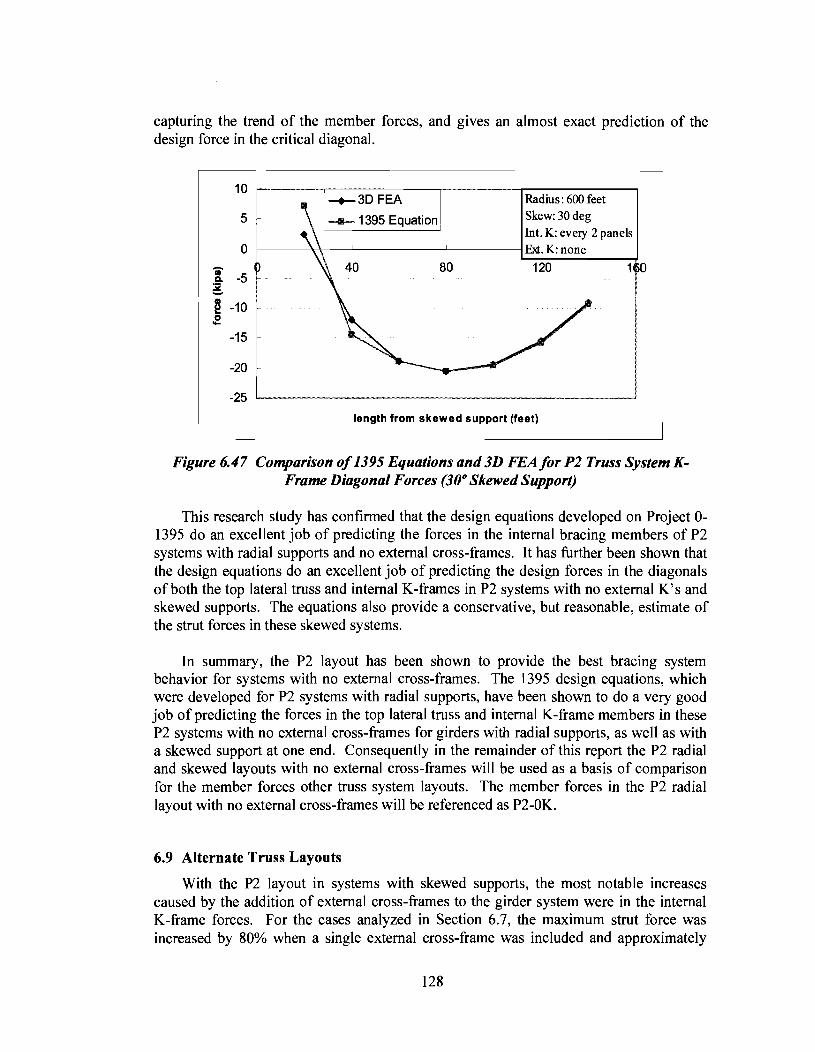
capturing the trend of the member forces, and gives an almost exact prediction of the design force in the critical diagonal.
10
r -+-3D FEA Radius: 600 feet
5 i ........_. 1395 Equation I Skew:30deg Int. K: every 2 panels
0 Ext.K:none
'i' 80 120 Cl. -5 !. I -10 !
-15
-20
-25
length from skewed
Figure 6.47 Comparison of 1395 Equations and 3D FEAfor P2 Truss System KFrame Diagonal Forces (30° Skewed Support)
This research study has confirmed that the design equations developed on Project 0-1395 do an excellent job of predicting the forces in the internal bracing members of P2 systems with radial supports and no external cross-frames. It has further been shown that the design equations do an excellent job of predicting the design forces in the diagonals of both the top lateral truss and internal K-frames in P2 systems with no external K's and skewed supports. The equations also provide a conservative, but reasonable, estimate of the strut forces in these skewed systems.
In summary, the P2 layout has been shown to provide the best bracing system behavior for systems with no external cross-frames. The 1395 design equations, which were developed for P2 systems with radial supports, have been shown to do a very good job of predicting the forces in the top lateral truss and internal K-frame members in these P2 systems with no external cross-frames for girders with radial supports, as well as with a skewed support at one end. Consequently in the remainder of this report the P2 radial and skewed layouts with no external cross-frames will be used as a basis of comparison for the member forces other truss system layouts. The member forces in the P2 radial layout with no external cross-frames will be referenced as P2-0K.
6.9 Alternate Truss Layouts
With the P2 layout in systems with skewed supports, the most notable increases caused by the addition of external cross-frames to the girder system were in the internal K-frame forces. For the cases analyzed in Section 6.7, the maximum strut force was increased by 80% when a single external cross-frame was included and approximately
128

40% when 3 external cross-frames were used. There were also increases in the maximum forces in the diagonals of about 20% for systems with 1 external cross-frame.
The most significant effect was on the forces in the K-frames in the interior girder. The forces in the skewed exterior girder were not significantly affected by the addition of external cross-frames. The reason for the more significant effect on the K-frames of the interior girder in the skewed system is due to the parallel layout of the top flange truss as was shown in Figure 6.21 and repeated in Figure 6.48. As shown in the shaded region on the exterior girder, the diagonals of the top lateral truss frame into the top flange at the external K-frame location. These diagonals help to resist the external K-frame force. However, in the interior girder there is only a strut framing into the top flange at the location of the external K-frame. Thus the external K-frame force must get transferred through the strut to get to the diagonals of the top flange truss. Therefore, due to the layout of the truss diagonals, in the skewed system there was a more significant effect on the strut forces in the interior girder than there was for the exterior girder when external K-frames were added.
Top diagonal
Top strut of internal K-frame
Figure 6.48 Layout of Top Truss -Diagonals of Exterior Girder Only Intersect towards External K-Frame
Figure 6.48 helps to explain why the strut forces in Figure 6.43 were so high at the location of the external K-frame. These two figures help to demonstrate that the orientation of the diagonals of the top flange truss have an impact on the forces induced in the struts of the internal K-frames by the external K-frames. The knowledge that the two diagonals of the top truss help in resisting/distributing the forces from the external bracing can be used to make the bracing more efficient. In a twin box girder bridge, the exterior K-frames frame into the outside flange of the interior girder and the inside flange of the exterior girder. If the layout of the top trusses is such that the diagonals frame into the flange nearer the external K-frame for both the exterior and the interior girders, as shown in Figure 6.22, better redundancy can be obtained in the overall system. The main concern with the P2 layout in a skewed system is that the external K-frame might cause the top strut of the interior K-frame to fail if the larger force is not accounted for.
129
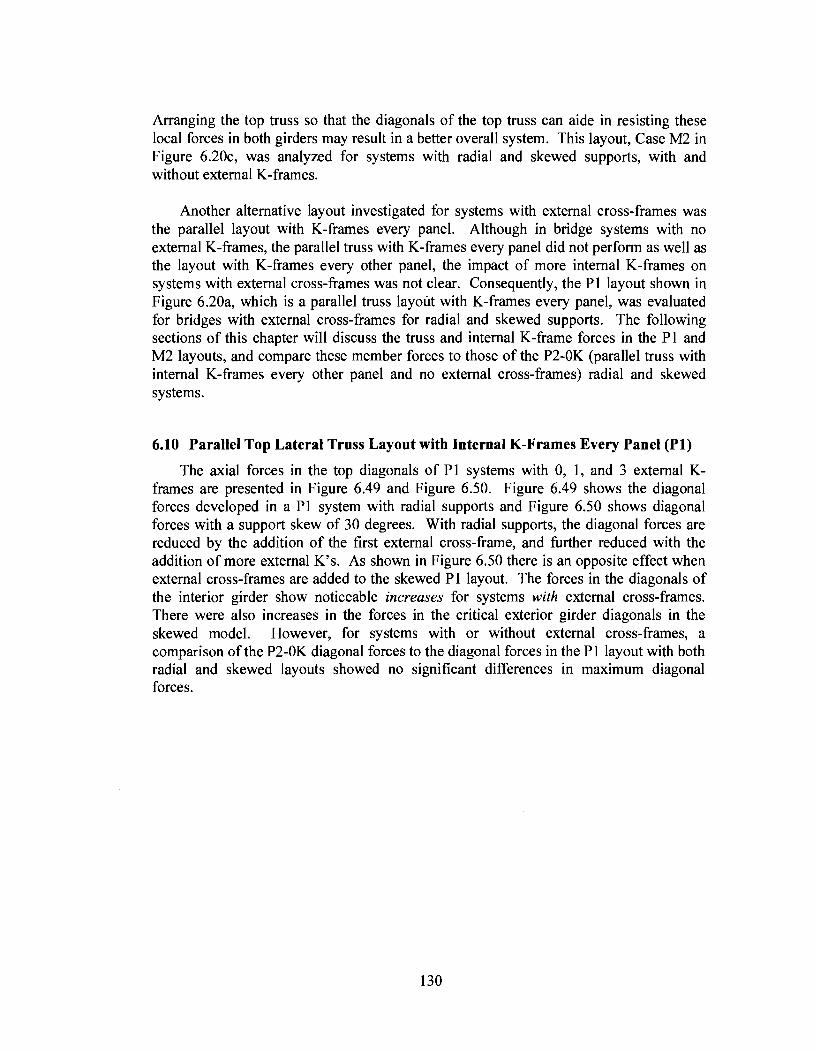
Arranging the top truss so that the diagonals of the top truss can aide in resisting these local forces in both girders may result in a better overall system. This layout, Case M2 in Figure 6.20c, was analyzed for systems with radial and skewed supports, with and without external K-frames.
Another alternative layout investigated for systems with external cross-frames was the parallel layout with K-frames every panel. Although in bridge systems with no external K-frames, the parallel truss with K-frames every panel did not perform as well as the layout with K-frames every other panel, the impact of more internal K-frames on systems with external cross-frames was not clear. Consequently, the Pl layout shown in Figure 6.20a, which is a parallel truss layout with K-frames every panel, was evaluated for bridges with external cross-frames for radial and skewed supports. The following sections of this chapter will discuss the truss and internal K-frame forces in the Pl and M2 layouts, and compare these member forces to those of the P2-0K (parallel truss with internal K-frames every other panel and no external cross-frames) radial and skewed systems.
6.10 Parallel Top Lateral Truss Layout with Internal K-Frames Every Panel (Pl)
The axial forces in the top diagonals of PI systems with 0, 1, and 3 external Kframes are presented in Figure 6.49 and Figure 6.50. Figure 6.49 shows the diagonal forces developed in a Pl system with radial supports and Figure 6.50 shows diagonal forces with a support skew of 30 degrees. With radial supports, the diagonal forces are reduced by the addition of the first external cross-frame, and further reduced with the addition of more external K' s. As shown in Figure 6.50 there is an opposite effect when external cross-frames are added to the skewed Pl layout. The forces in the diagonals of the interior girder show noticeable increases for systems with external cross-frames. There were also increases in the forces in the critical exterior girder diagonals in the skewed model. However, for systems with or without external cross-frames, a comparison of the P2-0K diagonal forces to the diagonal forces in the Pl layout with both radial and skewed layouts showed no significant differences in maximum diagonal forces.
130

150
100
- 50 • a. :52
0 -f .2 -50
-100
-150
Radius: 1200 feet Skew: 0 deg lnt-K spacing: every panel
Girder I
--+-- No Ext-K
-li-1 Ext-K
_.,_3 Ext-K
Girder£
length along span (feet)
Figure 6.49 Axial Forces Developed in Top Truss Diagonals (Pl-Radial Support)
150 Radius: 1200 feet Skew: 30 deg
100 lnt-K spacing: every panel
Girder E
length along span (feet}
Figure 6.50 Axial Forces Developed in Top Truss Diagonals (Pl-30° Skewed Support)
Figure 6.51 shows the axial forces in the top struts of the internal K-frames for a system with radial supports. As was seen in the P 1 case, the forces in the internal Kframes at locations away from the external K-frames are not affected by the addition of the external K's. At the location of the external cross-frames, the forces in the struts in the interior girder are significantly reduced by the addition of external K-frames, and the forces in the struts in the exterior girder experience moderate increases in magnitude. Thus, for the case with radial supports, the addition of external K-frames causes an increase in the maximum strut force developed in the systems. As shown in Figure 6.52, the addition of external K-frames also causes slight increases in the forces in the diagonals of the internal K-frames in both girders. There are small, but noticeable,
131

increases in the internal K diagonal forces for the interior girder at the location of the external K frames, and very slight increases in these forces for the exterior girder.
25 Radius: 1200 feet Skew: 0 deg
20 lnt-K spacing: every panel
-+-No Ext-K
......_1 Ext-K
-"'lllr- 3 Ext-K
Girder I
I I
• I I I I I I I I I I I .
length along span (feet)
Figure 6.51 Top Strut Axial Forces ofthe Internal K-Frames (Pl-Radial Supports)
Comparing the maximum internal K-ftame forces for the P1 radial layout (with and without external cross-frames) to the forces in the P2-0K layout shows differences in both the strut and diagonal forces. The strut forces are approximately 80% larger than the P2-0K case and the K-frame diagonal forces are approximately 20% greater than the base case.
10 r----.. -.. ------~-----~----------. Radius: 1200 feet Skew: 0 deg lnt-K spacing: every panel
-"'lllr- 3 Ext-K
length along span (feet)
Figure 6.52 Diagonal Forces of the Internal K-Frame (Pi-Radial Supports)
132

There were greater impacts by the addition of external cross-frames on the Pl systems with skewed supports. As shown in Figure 6.53, there is a significant increase in the top strut forces in the interior girder and a decrease in the top strut forces in the exterior girder with the addition of external cross-frames. As shown in Figure 6.54, there is much less effect on the forces in the diagonals of the internal K-frames compared to the struts for system with skewed supports and external cross-frames.
20
~ 10 2
5
0
Girder I
Radius: 1200 feet Skew: 30deg lnt-K spacing: every panel
I I 1 I I I I I I I I I I I
Girder E
length along span (feet)
-+-No Ext-K
-e-1 Ext-K
-A--3 Ext-K
Figure 6.53 Top Strut Forces in the Internal K-Frame (Pl-30° Skewed Support)
10
5
I 0
;g. -5
~ 2 -10
-15
-20
Girder r -e-1 Ext-K
--.-3 Ext-K
Radius: 1200 feet Skew: 30 deg
· lnt-K spacing: every panel
GirderE
length along span (feet)
Figure 6.54 Diagonal Forces in the Internal K-Frame (Pl-30° Skewed Support)
133

Comparing the PI skewed layout (with and without external cross-frames) to the P2-0K skewed case, the strut forces are significantly larger (approximately 80%) with the PI layout. The diagonal forces are approximately I5% larger than the base P2-0K case.
6.11 Mirror Layout with Internal K-Frames Every Other Panel (M2)
The same bridge geometry evaluated for the PI and P2 layouts was also evaluated with the M2 top lateral truss layout. With this layout the top lateral truss in the interior girder is flipped relative to the parallel layout, and there is an internal K-frame provided at every other panel. As with the parallel layouts, there were fairly small changes in the forces in both the radial and skewed system top diagonals when external cross-frames were added. As shown in Figure 6.55, the maximum diagonal forces in the radial system decreased less than 2% with the addition of cross-frames. Conversely, as shown in Figure 6.56, the maximum diagonal forces in the skewed system increased approximately 3% when external K's were added to the model. Comparisons of the M2 radial layout to the P2-0K radial layout, and the M2 skewed layout to the P2-0K layout show no significant differences in maximum diagonal forces.
150
100
50
~ 0
.2 -50
-100
-150
Radius: 1200 feet Skew: Odeg lnt-K spacing: e'.€ry2 panels
-+-No Ext-K
............ 1 Ext-K
-r-3 Ext-K
length along span (feet)
Figure 6.55 Axial Forces Developed in Top Truss Diagonals (M1-Radial Support)
134
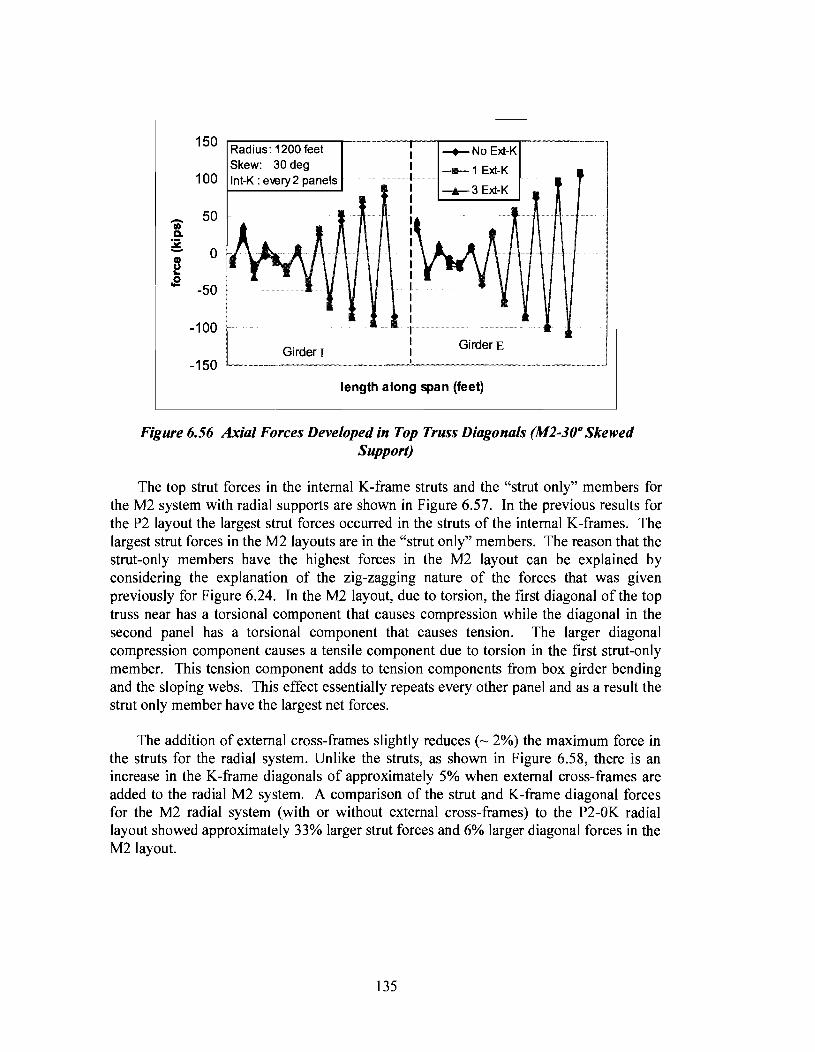
150 Radius: 1200 feet -+-No Ext-K I Skew: 30 deg I -tt--1 Ext-K
100 lnt-K :every 2 panels • I -+-3 Ext-K I
50 I 'i' I D. I l2 I - 0 I
~ I .g I
-50 ...... L .. I I
-100 I I I GirderE
-150
length along span (feet)
Figure 6.56 Axial Forces Developed in Top Truss Diagonals (M2-30° Skewed Support)
The top strut forces in the internal K-frame struts and the "strut only" members for the M2 system with radial supports are shown in Figure 6.57. In the previous results for the P2 layout the largest strut forces occurred in the struts of the internal K-frames. The largest strut forces in the M2layouts are in the "strut only" members. The reason that the strut-only members have the highest forces in the M2 layout can be explained by considering the explanation of the zig-zagging nature of the forces that was given previously for Figure 6.24. In the M2 layout, due to torsion, the first diagonal of the top truss near has a torsional component that causes compression while the diagonal in the second panel has a torsional component that causes tension. The larger diagonal compression component causes a tensile component due to torsion in the first strut-only member. This tension component adds to tension components from box girder bending and the sloping webs. This effect essentially repeats every other panel and as a result the strut only member have the largest net forces.
The addition of external cross-frames slightly reduces(~ 2%) the maximum force in the struts for the radial system. Unlike the struts, as shown in Figure 6.58, there is an increase in the K-frame diagonals of approximately 5% when external cross-frames are added to the radial M2 system. A comparison of the strut and K-frame diagonal forces for the M2 radial system (with or without external cross-frames) to the P2-0K radial layout showed approximately 33% larger strut forces and 6% larger diagonal forces in the M2layout.
135
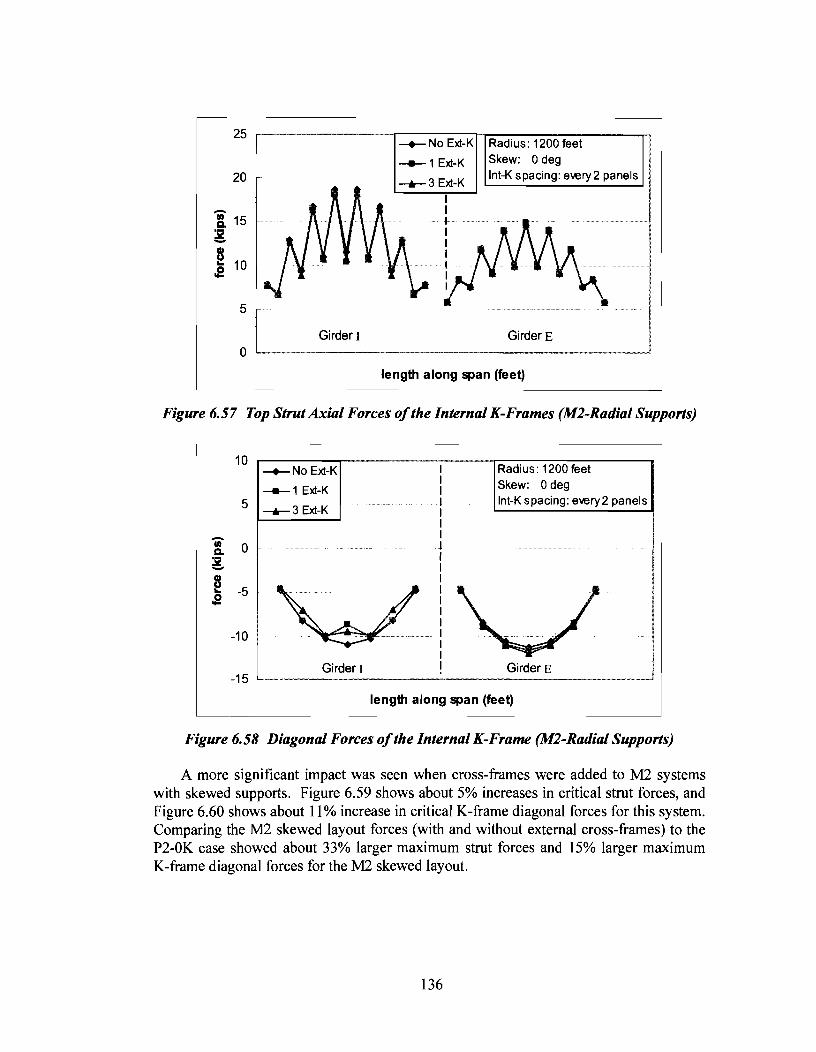
25
20
~ 10 .e
5
0 Girder I
~No Ext-K Radius: 1200 feet ....,._ 1 Ext-K Skew: 0 deg
__........ 3 Ext-K L..ln_t-_K_s_p_ac_in_g~: -~--.....J
Girder E
length along span
Figure 6.57 Top Strut Axial Forces ofthe Internal K-Frames (M2-Radial Supports)
10 I Radius: 1200 feet ~NoExt-K I Skew: 0 deg
-~~t--1 Ext-K I 5 __........3 Ext-K
... I lnt-K spacing: every2 panels I I - I
• 0 I a. I :5i! - I
~ I -5 l .e I
I I
-10 I I I
Girderr I GirderE -15
. length along span (feet)
Figure 6.58 Diagonal Forces of the Internal K-Frame (M2-Radial Supports)
A more significant impact was seen when cross-frames were added to M2 systems with skewed supports. Figure 6.59 shows about 5% increases in critical strut forces, and Figure 6.60 shows about 11% increase in critical K-frame diagonal forces for this system. Comparing the M2 skewed layout forces {with and without external cross-frames) to the P2-0K case showed about 33% larger maximum strut forces and 15% larger maximum K-frame diagonal forces for the M2 skewed layout.
136

25
20
~ 10 .e
5
0 Girder I
-+-No Ext-K
............. 1 Ext-K
........-3Ext-K I I I I I I I I I
Radius: 1200 feet Skew: 30 deg lnt-K spacing: every 2 panels
Girder E
length along span (feet)
Figure 6.59 Top Strut Forces in the Internal K-Frame (M2-3011 Skewed Support)
10 .-~~,~--------~~-.----,-r-~~~~~----~ Radius: 1200 feet
5
i 0 ;g.
~ -5 .e
-10
-15
-+-No Ext-K Skew: 30deg lnt-K spacing: every 2 panels
Girder E
length along span (feet)
Figure 6.60 Diagonal Forces in the Internal K-Frame (M2-3011 Skewed Support)
6.12 Summary of Pl, P2, and M2 Layouts
For bridges with no external cross-frames, the P2 layout, as shown in Figure 6.20b, produces the smallest overall brace forces in the top lateral truss and internal K-frames. A P2 layout with an even number of panels in each span is recommended for bridges with no external cross-frames, and either radial or skewed supports.
The P2 layout also produced the smallest strut and K-frame diagonal forces for bridges with external cross-frames and radial supports. For bridges with external crossframes and skewed supports the M2 layout produced the smallest strut and K-frame diagonal forces. However, the other top truss layouts can still be designed to provide
137
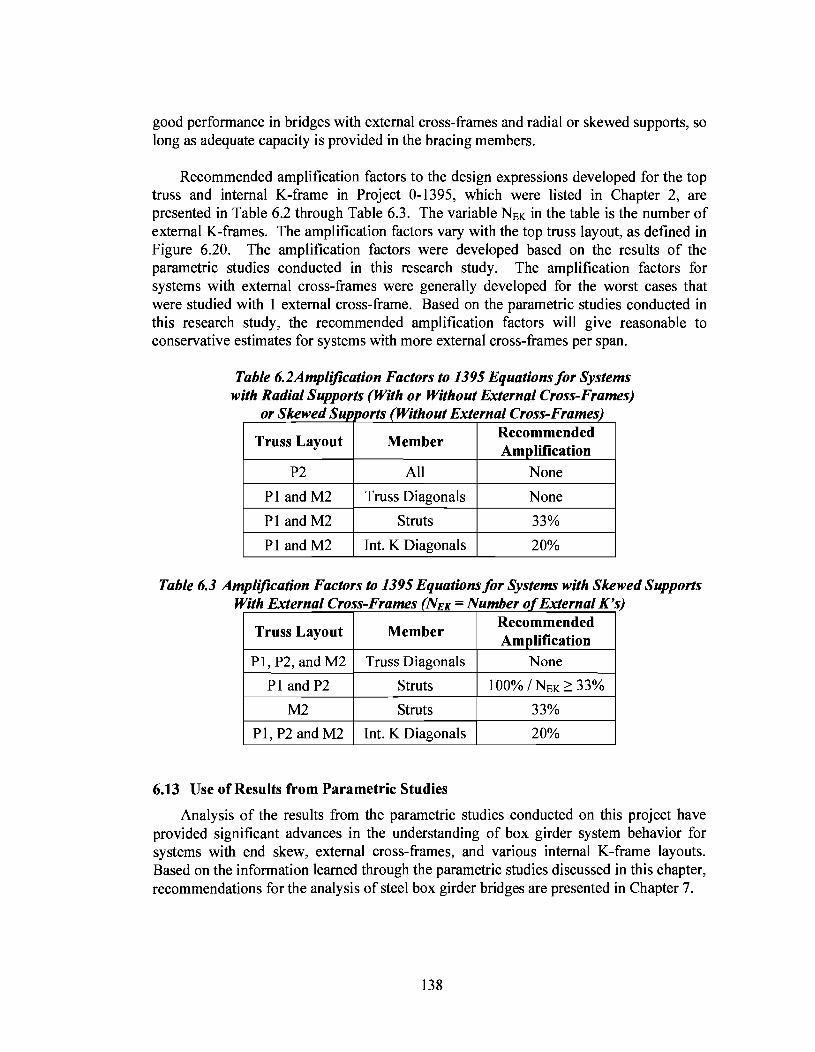
good performance in bridges with external cross-frames and radial or skewed supports, so long as adequate capacity is provided in the bracing members.
Recommended amplification factors to the design expressions developed for the top truss and internal K-frame in Project 0-1395, which were listed in Chapter 2, are presented in Table 6.2 through Table 6.3. The variable NEK in the table is the number of external K-frames. The amplification factors vary with the top truss layout, as defined in Figure 6.20. The amplification factors were developed based on the results of the parametric studies conducted in this research study. The amplification factors for systems with external cross-frames were generally developed for the worst cases that were studied with 1 external cross-frame. Based on the parametric studies conducted in this research study, the recommended amplification factors will give reasonable to conservative estimates for systems with more external cross-frames per span.
Table 6.2Amplijication Factors to 1395 Equations for Systems with Radial Supports (With or Without External Cross-Frames)
or Skewed S orts ithout External Cross-Frames
Truss Layout Member Recommended Am lification
P2 All None
Pl andM2 Truss Di None
Pl and M2 Struts 33%
Pl and M2 Int. K Diagonals 20%
Table 6.3 Amplification Factors to 1395 Equations for Systems with Skewed Supports ith External Cross-Frames (NEK =Number of External K' Wl ~
Truss Layout Member Recommended Amplification
PI, P2, and M2 Truss Diagonals None
Pl and P2 Struts 100% /NEK ~ 33%
M2 Struts 33%
Pl, P2 and M2 Int. K Diagonals 20%
6.13 Use of Results from Parametric Studies
Analysis of the results from the parametric studies conducted on this project have provided significant advances in the understanding of box girder system behavior for systems with end skew, external cross-frames, and various internal K-frame layouts. Based on the information learned through the parametric studies discussed in this chapter, recommendations for the analysis of steel box girder bridges are presented in Chapter 7.
138

Chapter 7
Analysis of Curved Steel Trapezoidal Box Girders
7.1 Introduction
Chapter 6 focused on the behavior and interaction of the different bracing systems utilized in box girder bridges. A thorough understanding of the behavior of these braces is required before they can be properly designed. However, before the girders and the bracing systems can be proportioned, the distribution of the moment and the torque along the girder length must be determined. Most analyses of curved bridges are conducted using a grid analysis, which consists of a simplified model of the bridge in which the girders and external braces are modeled as line elements. Acceptable results for the torque distribution can be obtained with these simplified models, however a clear plan of the design methodology of these braces must be selected prior to analyzing the girders. The modeling techniques during the analysis should reflect the role of the structural elements to the safety of the overall structure. This chapter outlines points for consideration in developing a suitable design methodology and plan for the analysis. The next section of this chapter will begin with a discussion of the role of external K-frames and provide advice regarding the analysis and subsequent design of box girder systems utilizing external cross-frames. A brief overview of the accuracy of the grid analysis relative to a three-dimensional FEA model is then presented. The analytical results help to demonstrate the sensitivity of a grid analysis to the correct section properties for the girder cross-sections on systems with skewed supports. Finally the torque distribution in a continuous bridge with a skew at an end support is discussed.
7.2 Proposed Analysis I Design Methodology for External Intermediate K-Frames
The use of intermediate external K -frames to control the relative twist of adjacent box girders was discussed in the last chapter. The effect of these external K-frames on the bracing systems internal to the box was also discussed. Three-dimensional FEA results showed that the addition of external cross-frames did not have a significant affect the forces in the diagonal of the top lateral truss, but did affect the forces in the internal cross-frames. The magnitude of the impact of the external cross-frames on the internal K-frame forces varied with the top lateral truss layout, number of external cross-frames, and bridge geometry.
Based on the results presented in Chapter 6, it is clear that there are a number of factors that affect the design forces for the external K-frames. These factors include the number of external K-frames, the girder span lengths, the radii of curvature ofthe girders, the relative stiffness of the two girders, the top lateral truss system layout, and the presence of a skew angle at a support. Design equations were proposed for the external K-frames by Memberg (2002). Figure 7.1 shows a comparison of external K-frame member forces predicted using Memberg's equations with those from a three-
139

dimensional FEA model. Three different orientations of the top lateral systems were discussed in Chapter 6. The range of results from three-dimensional analyses with the different top truss orientations are shown Figure 7.1 relative to the forces predicted using Memberg's equations. The girder system used in the FEA model was the same system used in the parametric studies presented in Chapter 6. The equations proposed by Memberg (2002) are very conservative for all of the members in the K-frame. Although these proposed equations can be used to conservatively estimate the forces in the external K-frames, efforts are still underway in TxDOT Project 0-4307 "Steel Trapezoidal Box Girders: State of the Art" to develop a relatively simple but accurate method that accounts for the numerous factors that affect the forces developed in external crossframes in box girder bridge systems.
-9.3 to -9.7 kips -107 kips
0.4 to 2.9 kips 5.3 kips
5.4 to 8.1 kips -6.9 to -9.0 kips 89 kips -78 kips
Forces in Cross-Frame at Midspan
3D FEA results in bold
Radius of curvature: 600 feet
Skew angle: 0 degree
Span Length: 160 feet
lnt-K spacing: every panel
Top Truss Layouts Evaluated:
Parallel w/lnt. K's every panel
Parallel w/lnt. K's every other panel
Mirror w/lnt. K's every other panel
Figure 7.1 Forces in Cross-Frame using Member (2002) Equation and 3D FEA
If the external K-frames are relied upon to resist the applied torque to the bridges, a set of design equations is essentially required to predict the external K-frame member forces because of the nature of the grid analyses that is usually used to analyze the system. Since a grid analysis uses line elements for the box girders, solid diaphragms, and external cross-frames, adequately modeling the external K-frames can pose a difficult task. The line elements used to model the girders are generally positioned at the centerline of the box sections. Thus, because of the greater distance between the girder centerlines, the lengths of the external braces in the computer model are often nearly twice as long as they actually are. Therefore, attempting to capture the stiffness of these members from a grid analysis is a difficult task. Additionally, a reliable method to resolve the grid analysis moments for these external braces into K-frame forces is also unclear.
Until a more robust analysis becomes feasible for TxDOT or reliable design expressions can be developed, the researchers on this project propose an alternate approach to designing the external intermediate K-frames, which involves designating
140

these braces as elements to satisfy a serviceability limit state instead of an ultimate limit state. The primary role of the external braces is to control the girder twist so as to achieve a uniform slab thickness across the width of the bridge. Although the uniformity of the slab thickness is an important consideration, the main impact of the variable thickness is primarily a serviceability limit state and not an ultimate limit state. If the role of the cross-frames is designated as a serviceability role, typical sizes can be used for these braces. However, in designating the external K-frames as serviceability elements, these braces should not be included in the girder system during analysis. The box girders, internal bracing members, and end diaphragms should be designed to carry the design construction loads. Typical sizes of external K-frames should then be provided to control the relative twist of adjacent girders to maintain uniformity of concrete deck thickness. To ensure ductile behavior, the connections between the box girders and the external K-frames should be designed to fully develop the K-frame members. The internal K-frames and top flange lateral truss would then be sized using the design expressions that were developed in the previous study by Helwig and Fan (2000), using the equations presented in Chapter 2 with the modification factors as outlined in Section 6.12.
The impact of this proposed method essentially categorizes the purpose of the external intermediate K-frames to a "serviceability role" during construction, namely to help maintain uniformity in the slab thickness. It is highly unlikely that the external Kframes would experience problems during construction, however, since the girders are being analyzed and designed to support the entire construction load without the help from the intermediate external K-frames, a failure of the external brace would essentially be categorized as a serviceability limit state and not an ultimate limit state. A problem with the external brace might result in a variation in the concrete deck thickness but the girders would still have adequate strength to support the construction load without the intermediate external K-frames. To ensure ductile behavior, the connections between the box girders and the external K-frames should be designed to fully develop the K-frame members.
7.3 Equivalent Plate Method
The equivalent plate method, presented by Kollbruner and Basler (1969), is often used to estimate an equivalent plate thickness for the top lateral truss system. This equivalent plate thickness is used in the calculation of approximate torsional properties for the quasi-closed section formed by the box girder and top lateral truss. The equivalent plate thickness for a top lateral truss system with a single diagonal layout is giveninEq. (7.1).
(7.1)
141

where, as shown in Figure 7.2, t* equivalent plate thickness; E modulus of elasticity (29,000 ksi for steel); G shear modulus (11 ,200 ksi for steel); s panel length, i.e. distance between centerlines of adjacent stuts; b distance between center lines of top flanges; Lct length of top lateral diagonal; Act area of top lateral diagonal; and, Ar area of girder top flange.
I+---- s ----+---- s ---+1
Figure 7.2 Definition of Variables in Equivalent Plate Thickness Formula
7.4 Torsional Constants for Box Girders
The torsional constant of a box girder varies with the size of the top lateral truss system and presence of the concrete deck. There are three diff~rent torsional constants that are typically calculated for a box girder section. These three torsional constants are for an open box girder section (box girder without a top lateral truss system), a quasiclosed section (box girder with top lateral truss system); and, a composite section (box girder with concrete deck).
The torsional constant, KT, of an open section is
1 3
KT = "-bt. L,.,3 II
' (7.2)
where b1 and t1 are the width and thickness, respectively, of each plate element in the cross section. The torsional constant of the quasi-closed and composite sections are calculated using the formula for closed sections. The torsional constant for a closed section is
142
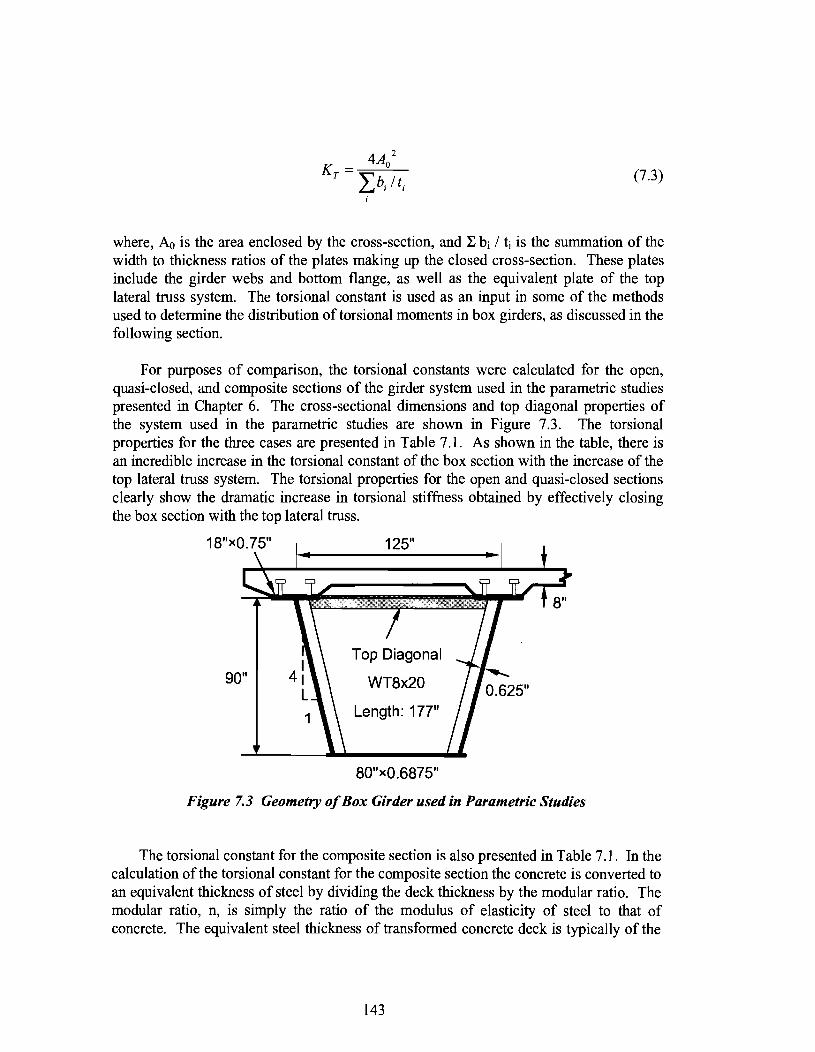
2
K _ 4A0 T-" £_},It;
i
(7.3)
where, Ao is the area enclosed by the cross-section, and l: hi I ti is the summation of the width to thickness ratios of the plates making up the closed cross-section. These plates include the girder webs and bottom flange, as well as the equivalent plate of the top lateral truss system. The torsional constant is used as an input in some of the methods used to determine the distribution of torsional moments in box girders, as discussed in the following section.
For purposes of comparison, the torsional constants were calculated for the open, quasi-closed, and composite sections of the girder system used in the parametric studies presented in Chapter 6. The cross-sectional dimensions and top diagonal properties of the system used in the parametric studies are shown in Figure 7.3. The torsional properties for the three cases are presented in Table 7 .1. As shown in the table, there is an incredible increase in the torsional constant of the box section with the increase of the top lateral truss system. The torsional properties for the open and quasi-closed sections clearly show the dramatic increase in torsional stiffness obtained by effectively closing the box section with the top lateral truss.
90"
125"
Top Diagonal
WT8x20
Length: 177"
80"x0.6875"
Figure 7.3 Geometry of Box Girder used in Parametric Studies
The torsional constant for the composite section is also presented in Table 7 .1. In the calculation of the torsional constant for the composite section the concrete is converted to an equivalent thickness of steel by dividing the deck thickness by the modular ratio. The modular ratio, n, is simply the ratio of the modulus of elasticity of steel to that of concrete. The equivalent steel thickness of transformed concrete deck is typically of the
143

order of 1 inch. The effective width of the concrete deck used in the torsional calculation is equal to the distance between the top flanges of the girder. Although the additional increase in the torsional stiffness by the inclusion of the concrete deck is not as staggering as that seen in the change from an open to a quasi-closed section, there is still a dramatic increase between the quasi-closed and closed section when the deck is included in calculation of the torsional constant.
Table 7.1 Torsional Constants for Box Girder used in Parametric Studies
Open Section Kr 29 in4
Quasi-Closed Section Kr 100,000 in4
Closed Composite Section Kr 630,000 in4
The torsional constants typically used in design are those of the quasi-closed and composite sections. The quasi-closed stiffness is used during construction stages where only the steel girders and bracing systems resist the construction loads. The composite torsional constant is used in design for service loads, where the composite bridge resists the applied loads. As will be discussed in the following section, the torsional constants are inputs in several of the approaches used to determine the distribution of torsional moments in box girder bridges.
7.5 Approaches to Determine Distribution of Torsional Moments
An important step in designing curved girders is to determine the magnitudes and distribution of torsional moments along the length of the girder. For systems with radial supports, there are a variety of methods that can be used to determine the design torques. Many engineers conduct a grid analysis on the curved girders to determine the magnitude and distribution of the torque and such an analysis has proven to be accurate for systems with radial supports as will be shown. Simplified analytical methods are also available for the torsional analysis of curved girders. One such method is the M1R method illustrated in Figure 7.4, which was proposed by Tung and Fountain (1970). The MIR method is generally suitable for girder spans with a subtended angle between supports up to 25° and a bending/torsional ratio (EI/GJ) less than 2.5. For systems that satisfY these conditions, the torque generally has a negligible effect on the distribution of bending moment. Therefore, the moments can be determined by analyzing a straight girder system with a span equal to the length along the bridge centerline, and the effect of curvature can be approximated as shown in Figure 7 .4b.
Once the moment diagram is determined, the torque caused by girder curvature can be estimated by applying a uniform lateral load equal to M!Rh to the top and bottom flanges of the box girder. The lateral loads are applied in opposite directions: outward/away from the center of curvature on the compression flange and inward on the tension flange as shown in Figure 7 .4c. At a given cross-section, the loads applied to the two flanges create a torque per unit length with a magnitude of M/R, which is where the
144

name of the method comes from. Therefore, the torsional moments due to the curvature of the girder are approximately equal to the torsional moments in a straight beam due to the distributed torsional load of MfR. If twist is prevented at all supports, the torsional analysis can be performed by considering only one span at a time since the effects of torsional warping are usually very small in box girders and thus the torsional deformation in one span generally does not significantly affect adjacent spans.
R
~b dO= ds jQ_ ~ted> ).
R h R M (ds )·'d _ M.. llR' s-Rh
a} Uniformly loaded curved girder b} approximation of curvature effect
M --hR
c} application of lateral loads to produce torque
Figure 7.4 MIR Method
In lieu of a computer solution, the torque at a given location can also be found using the following expression:
T r = wR 2ltan(p1
p ' 2
p. ) cos-' p)-(P~ -P) 2
2 P. cos(-' p) 2
(7.4)
145
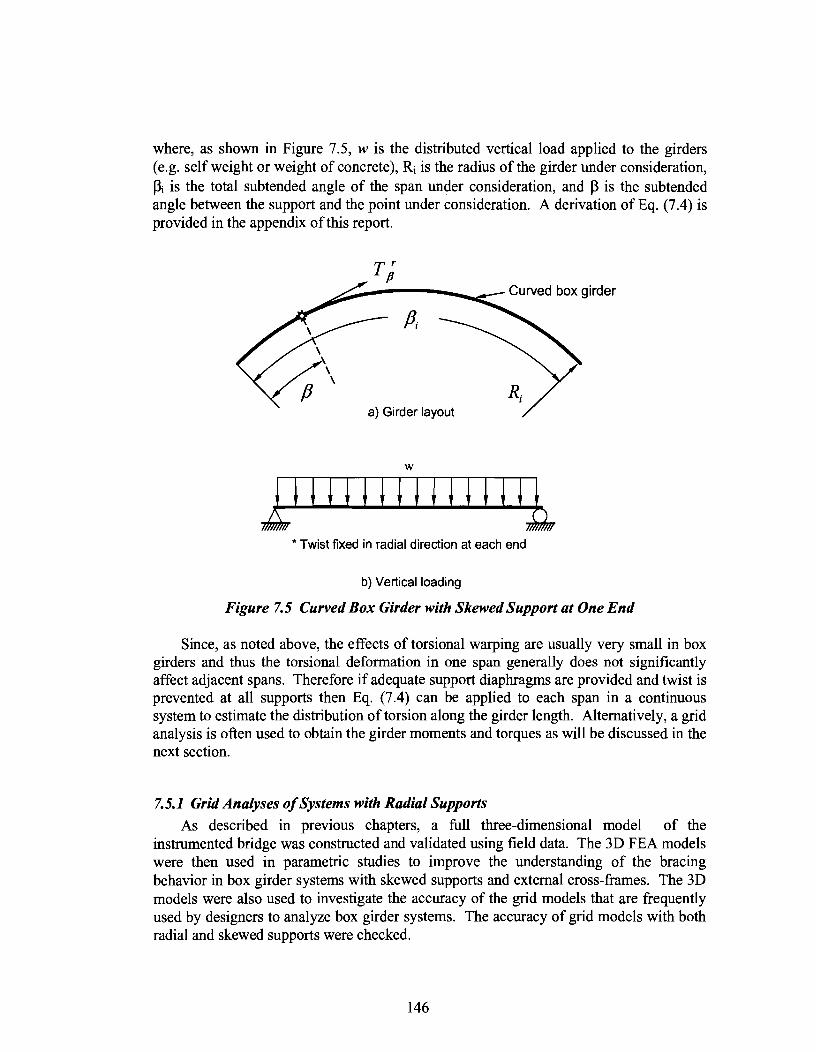
where, as shown in Figure 7.5, w is the distributed vertical load applied to the girders (e.g. self weight or weight of concrete), Ri is the radius of the girder under consideration, l3i is the total subtended angle of the span under consideration, and 13 is the subtended angle between the support and the point under consideration. A derivation of Eq. (7 .4) is provided in the appendix of this report.
Tr p
a) Girder layout
w
Curved box girder
Lilli I IIIII I I I 11 * Twist fixed in radial direction at each end
b) Vertical loading
Figure 7.5 Curved Box Girder with Skewed Support at One End
Since, as noted above, the effects of torsional warping are usually very small in box girders and thus the torsional deformation in one span generally does not significantly affect adjacent spans. Therefore if adequate support diaphragms are provided and twist is prevented at all supports then Eq. (7.4) can be applied to each span in a continuous system to estimate the distribution of torsion along the girder length. Alternatively, a grid analysis is often used to obtain the girder moments and torques as will be discussed in the next section.
7.5.1 Grid Analyses of Systems with Radial Supports
As described in previous chapters, a full three-dimensional model of the instrumented bridge was constructed and validated using field data. The 3D FEA models were then used in parametric studies to improve the understanding of the bracing behavior in box girder systems with skewed supports and external cross-frames. The 3D models were also used to investigate the accuracy of the grid models that are frequently used by designers to analyze box girder systems. The accuracy of grid models with both radial and skewed supports were checked.
146

First, companion models of specific bridge geometries with radial supports were constructed using both grid and 3D FEA models. The results obtained for the torsion and bending moments along the girder length were compared. Figure 7.6 shows a graph of the torsion along the girder length·resulting from a grid analysis of a girder with radial supports along with the torsion from a 3D FEA modeL In the 3D analysis the girders were modeled using shell elements for the cross-section and line elements for the top flange truss and internal K-frames as outlined in Chapter 3. The torsion along the girder length presented for the 3D FEA model does not come directly from the output of the software but must instead be back-calculated from the forces in the diagonals of the top lateral truss. The forces in the top truss diagonals are a function of the applied torsion as well as the bending induced forces as discussed by Helwig and Fan (2000). The effect of the bending induced forces in the top truss diagonals can be subtracted from the FEA results using the equations developed by Helwig and Fan (2000) that were presented in Chapter 2. The results presented in Figure 7.6 demonstrate that the grid analysis and the 3D FEA solution show good agreement for girders with radial supports.
1000
750
500
=-·= 250 ":" a.
0 ;g_ CD :I
-250 I! 0 ...
-500
-750
-1000
40
-+-3D FEA Span Length: 160 feet -11-Grid FEA skew angle: 0 deg ~------1Radius: 600 feet
lnt-K spacing: every panel Ext-K: None
120 1 0
length from left support (feet)
Figure 7.6 Distribution of Torque from Grid Analysis and 3D FEA Models for Girders with Radial Supports
7.5.2 Grid Analyses of Systems with a Skewed Support
One of the main objectives of this investigation was to improve the understanding systems with skewed supports. It is therefore desirable to ascertain the accuracy of grid models with skewed supports. Figure 7.7 shows a comparison between grid and 3D FEA models similar to that presented for the systems with radial supports in Figure 7 .6. Recall that the analyses done in this section are for the bridge system during construction, and the loading in the model simulates that of the wet concrete on the steel girders. The
147
difference between the plots in Figure 7.6 and Figure 7.7 is that the bridge system in Figure 7.6 had radial supports while the bridge in Figure 7.7 has a skewed support. The left support is skewed by 30 degrees relative to a radial line. The plot in Figure 7.7 shows the torque in the box girder system from a 3D FEA model with companion plots from three grid analyses. Grid analyses were conducted using torsional constants for the open, quasi-closed, and composite sections. The specific values of the torsional constants were presented in Table 7.1.
As shown in Figure 7.7 there is excellent agreement between the 3D FEA and grid analyses when the torsional constant of the quasi-closed system is used in the grid model. There is some difference nearer the support between the 3D FEA results and grid analysis for the quasi-closed section, but the difference can be attributed to the difficultly in resolving the torque for the end diagonals in the skew panel from the 3D FEA data. Therefore, if designers use the quasi-closed properties in a line element analysis of the construction stage loadings they can feel comfortable that their analysis is producing good results. However, if the proper torsional constant is not used, there will be significant errors in the torques produced from the grid analyses.
Because of the skew angle at the support, the diaphragm has a component directed along the longitudinal axis of the girders, and the strong-axis rotation of the girders causes additional forces to develop in the diaphragm. If the wrong torsional constant is used for the girder, there is a significant shift in the torsional diagram produced from the grid analyses, leading to significant errors in the torque predictions. Typically the critical stage for the bracing elements is during the casting of the concrete deck. Thus, an analysis should be performed on the girder subjected to self-weight, the weight of wet concrete, and construction live loads. In the deck casting stage the steel girders will resist the entire load, so the quasi-closed section properties should be used. And as noted and shown in Figure 7. 7, with the quasi-closed section properties the grid analysis of a girder system with a skewed end support gives very good predictions of the design torques.
148

1000
0
-'7 c. :2 -a>-1 000 :::1 2" .8
-2000
-3000
Girder I Girder E
length from skewed support (feet)
Figure 7. 7 Distribution of Torque from Grid Analysis and 3D FEA Models for Girders with One Skewed Support
7.5.3 Simplified Grid Analysis of Curved Girders with Skewed Supports
Equations were developed in this research study to modify the torque values for a curved girder from an analysis with radial supports to include the effects of a skew at an end support. The proposed equations can be used to modify the torques obtained from a grid analysis with radial supports if the designer is unable to run an analysis with a skewed support due to software limitations. The proposed equation provides the designer with a relatively simple tool to investigate the effects of support skews on the torsional response of the system. Since the expressions account for the support skew, the designer can obtain the torsion diagram for a variety of support skews based upon a single analysis on a system with radial supports.
The equation was based on a series of parametric studies in which the torques for girders with radial supports were compared to 3D FEA results for the same system with skewed supports. Table 7.2 shows the range of skew angles, radii of curvature, and span lengths that were investigated in these parametric studies.
149
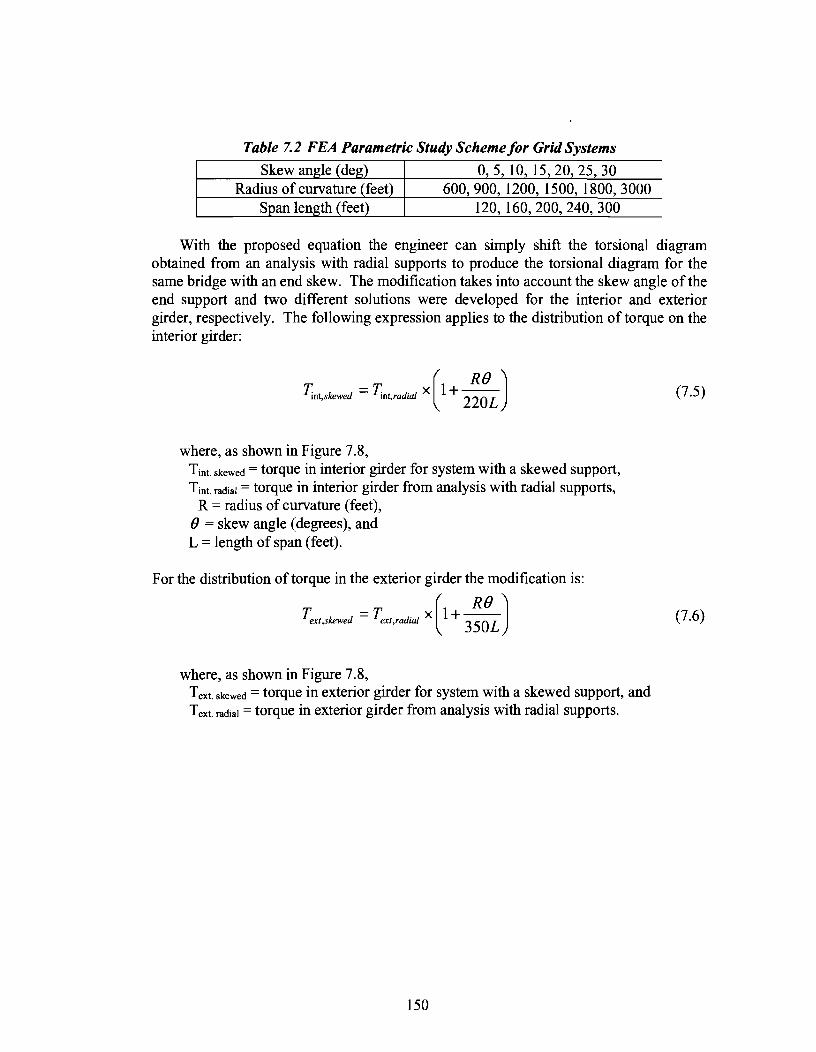
Table 7.2 FEA Parametric Study Scheme for Grid Systems
Skew angle (de g) ~5, 10, 15,20,25,30 Radius of curvature (feet) 600,900,1200,1500,1800,3000
Span length (feet) 120,160,200,240,300
With the proposed equation the engineer can simply shift the torsional diagram obtained from an analysis with radial supports to produce the torsional diagram for the same bridge with an end skew. The modification takes into account the skew angle of the end support and two different solutions were developed for the interior and exterior girder, respectively. The following expression applies to the distribution of torque on the interior girder:
T =T . X 1+--( RB) mt,skewed mt,radwl 22QL
where, as shown in Figure 7.8, Tint. skewed = torque in interior girder for system with a skewed support, Tint. radial = torque in interior girder from analysis with radial supports,
R =radius of curvature (feet), e = skew angle (degrees), and L =length of span (feet).
For the distribution of torque in the exterior girder the modification is:
T =T X 1+--( RB) ext,slrewed ext,radia/ 3SQL
where, as shown in Figure 7 .8, Text. skewed torque in exterior girder for system with a skewed support, and Text. radial =torque in exterior girder from analysis with radial supports.
150
(7.5)
(7.6)
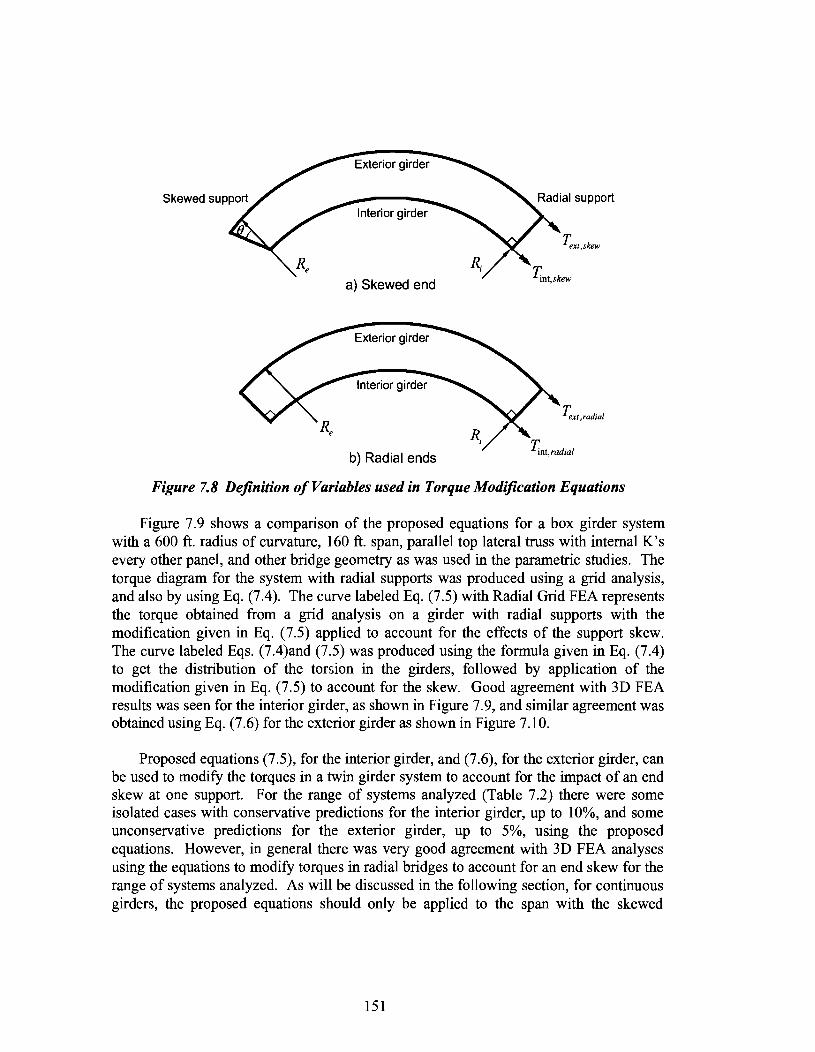
J',xt,skew
a} Skewed end
Text,radial
b) Radial ends
Figure 7.8 Definition of Variables used in Torque Modification Equations
Figure 7.9 shows a comparison of the proposed equations for a box girder system with a 600ft. radius of curvature, 160ft. span, parallel top lateral truss with internal K's every other panel, and other bridge geometry as was used in the parametric studies. The torque diagram for the system with radial supports was produced using a grid analysis, and also by using Eq. (7.4). The curve labeled Eq. (7.5) with Radial Grid FEA represents the torque obtained from a grid analysis on a girder with radial supports with the modification given in Eq. (7.5) applied to account for the effects of the support skew. The curve labeled Eqs. (7.4)and (7.5) was produced using the formula given in Eq. (7.4) to get the distribution of the torsion in the girders, followed by application of the modification given in Eq. (7.5) to account for the skew. Good agreement with 3D FEA results was seen for the interior girder, as shown in Figure 7.9, and similar agreement was obtained using Eq. (7.6) for the exterior girder as shown in Figure 7.1 0.
Proposed equations (7.5), for the interior girder, and (7.6), for the exterior girder, can be used to modify the torques in a twin girder system to account for the impact of an end skew at one support. For the range of systems analyzed (Table 7.2) there were some isolated cases with conservative predictions for the interior girder, up to 10%, and some unconservative predictions for the exterior girder, up to 5%, using the proposed equations. However, in general there was very good agreement with 3D FEA analyses using the equations to modify torques in radial bridges to account for an end skew for the range of systems analyzed. As will be discussed in the following section, for continuous girders, the proposed equations should only be applied to the span with the skewed
151

support. The skew angle has an insignificant affect on the other spans in continuous girders.
~ Q. g II)
:I
2' .8
1500
1000
500
0
-500
-1000
-1500
Girder I Span Length: 160 feet skew angle : 30 deg Radius : 600 feet
120
Eq. 7.5 and Radial Grid FEA
length from skewed support (ft)
Figure 7.9 Comparison of Proposed Equations for Interior Girder
with Full 3D FEA and Radial Grid Analysis Results
152
0

1500
1000
500
if 0 a.
;g. Q) ~
-500 1: s -1000
-1500
-2000
Radial Grid FEA
GirderE
Span Length: 160 feet skew angle : 30 deg Radius : 600 feet
Eq. 7.6 and Raidal Grid
length from skewed support (ft)
Figure 7.10 Comparison of Proposed Equations for Exterior Girder with Full 3D FEA and Radial Grid Analysis Results
7.6 Moment and Torque for Continuous Girders
Most steel box girder bridges are designed using continuous girders. Thus methods to find the moment and torque behavior in a continuous girder are also required. Since a continuous girder is an indeterminate structure, its behavior is more complicated than a simply supported single span bridge. Also, since the length and number of spans in a continuous bridge are highly variable, there is not a closed-form expression to describe the distribution of moment and torque along the girder, especially for a curved bridge with skewed supports. Current design procedures usually employ a grid analysis to obtain moment and torsion diagrams. Alternatively, if the solid diaphragms restrain twist at the supports, the MIR method or Eq. (7.4) can be used to analyze each span of a continuous bridge.
Box girder bracing, such as the top lateral truss and internal K-frames, may be designed to be the same size along the length of the bridge for convenience of fabrication. The bracing elements in all spans must have the capacity to resist critical loading during each construction stage. Therefore, in bridges using consistent bracing member sizes throughout the full length of the bridge, whether or not the support skew span is critical will depend on the geometries of the other spans.
A three-span continuous bridge with a short, skewed end span and a much longer middle span with radial supports was considered. If the designer chooses to use
153

consistent bracing member sizes throughout the length of the bridge the short end span with a skewed support may not be critical compared to the longer middle span. The span lengths of the bridge are 120, 240, and 120 ft., respectively and the girder system properties are as shown in Figure 7 .11. The radius of curvature for the bridge at the centerline of the system is 1200 feet. Plots of the moment and torque diagrams for the three-span continuous system are shown in Figure 7.12 and Figure 7.13, respectively.
90"
80"xO. 75"
125"
Solid Diaphragm
At support
lnt-K
L5x5x0.5
Top lateral trusses
L6x&x0.875
Figure 7.11 Box Girder System Properties used in Three Span Model
15000
_10000
i :52 5000 -.. i 0 E 0 E -5000
-10000
-15000
Radius: 1200 feet Length: 480 feet (120-240-120) Skew: 30 deg lnt-K: every 2 panels Ext-K: none
Figure 7.12 Bending Moment Diagrams for Three Span Box Girder System
154

800
600
400 e I c. 200 :.;: -CD
:::J 0 e-.s -200
-400
-600
Girder I
Int. bent
Radius : 1200 feet Length: 480 feet (120-240-120) Skew: 30 deg lnt-K: e\13ry 2 panels Ext-K: none
Int. bent
length (feet)
Figure 7.13 Torque Diagrams for Three Span Box Girder System
As shown in the previous section, the forces in the top lateral diagonals, which depend on the moment and torque in the girder, change with the magnitude of the support skew. Larger support skews generally lead to larger magnitudes of axial forces in the top diagonals. For single diagonal trusses, the torque causes forces of alternating sign in adjacent top lateral diagonals. There are also axial forces in the top lateral diagonals due to girder bending. The nature of the bending-induced force will have the same sense (compression or tension) as the state of stress in the top flange.
The main effect of the support skew in the continuous system is on girder torques since the changes in the diagonal forces with skew are stress jumps of tension then compression with roughly equal magnitudes as shown in Figure 7.14. Positive and negative stress jumps like that shown in the figure are due to torque. The end skew affects the torque in the end span of the continuous girder but there is negligible effect on the moment distribution.
Assuming consistent top diagonal and internal K-frame sizes were used in all spans of the skewed girder, there would be no design impact on the bracing members from the skewed support for the case shown in Figure 7.14. Although the support skew enlarges the maximum forces in the skewed end span, the resultant torque in the skewed span is still not critical for the three span unit when consistent bracing member sizes are used.
155

Radius : 1200 feet
600 Girder I Length: 480 feet (120-240-120) GirderE Skew: 30 deg
400 lnt-K: ewry 2 panels I E.' Ext-K: none a. 200 & CD :J 0 1: a
-200
-400 bent Int. bent
length (feet)
Figure 7.14 Variation in Forces in Top Diagonals with End Support Skew in Three Span Continuous System
Figure 7.14 also demonstrates the fact that with typical solid diaphragm sizes the torsional effect from a skewed end support is essentially confined to the skewed span. This fact can be seen more clearly in Figure 7.15, which shows the change in the top diagonal force for systems with various end skew angles compared to a system with radial supports. All significant changes occurred in the skewed end span. The fact that the impact of a skewed end is confined to the skewed span when typical solid diaphragms are used was also confirmed by the field and FEA results presented in Chapter 5 for the skewed bridge instrumented as part of this project.
no 50
40
E.' 30 a. &
CD 20 :J
1: 10 s 0
-10
-20
Girder I
Radius : 1200 feet Length: 480 feet (120-240-120) Skew: 30 deg lnt-K: ewry 2 panels 1
Ext-K: none ~ I ,../ : I I
: _....-"J I I I I
GirderE
::...· .,. ........... ·r·· ... ~_ ......................... ,._.._,..._ .... .. I I I I
Int. bent Int. bent Int. bent Int. bent
length (feet)
Figure 7.15 Change in Top Diagonal Forces due to Skew at End Support
156

The magnitude of the torque change in the skewed span is proportional to the skew angle, and agrees with the behavior seen in analyses of skewed single span girder systems as discussed in the previous section. In conclusion, for design purposes the effect of a skewed support in continuous systems should be confined to the skewed span. Therefore as mentioned in the last section, ifEqs. (7.5) or (7.6) are used to modify an analysis with radial supports to account for skews, the modification should only be applied in the span with the skewed support. The impact of the skew on the forces in the skewed span was discussed in Chapter 6 and will be summarized in Chapter 8.
157

!!!!!!!!!!!!!!!!!!!"#$%!&'()!*)&+',)%!'-!$-.)-.$/-'++0!1+'-2!&'()!$-!.#)!/*$($-'+3!
44!5"6!7$1*'*0!8$($.$9'.$/-!")':!

Chapter 8
Summary and Conclusions
8.1 Project Overview
With increased traffic demands in urban areas, horizontally curved bridges are frequently flyovers and direct connectors for major freeways. Steel box girder systems are attractive for these curved bridges because of the aesthetic appearance and high torsional stiffness of the completed bridge. Together the concrete deck and the box girders form a closed section, which can effectively resist the torques in the completed bridge resulting from the curved alignment. However, during construction there are also significant demands placed on the open section of the steel boxes, and different bracing systems are required for stability during transport, erection, and casting of the concrete deck. The bare steel section is susceptible to instability failures, including distortional modes and lateral-torsional buckling. Internal K-frames are spaced along the bridge length to control distortion of the girder cross-section. The torsional stiffness of the open sections during construction is improved by a top lateral truss system.
Since the top lateral bracing is not needed after the concrete deck has cured, minimizing the amount of bracing will lead to more efficient designs. In Project 0-1395 Field and Computational Studies of Steel Trapezoidal Box Girders, Helwig and Fan (2000) developed design methodologies for the internal cross frames and the top lateral truss system, however, these equations did not consider support skew or intermediate external cross-frames between the girders. Skewed supports are required on some bridges, due to roadway layout issues, and current practice in Texas includes the use of intermediate external K-frames between the girders. Prior to this study the impact of skewed supports or external cross-frames on the appropriateness of the bracing design equations developed by Helwig and Fan (2000) were unknown.
This report documents the results of TxDOT Project 0-4148 Field Monitoring of Trapezoidal Box Girders with Skewed Supports. The objective of the study was to develop design recommendations and improve the general understanding of the behavior of box girders with external cross-frames and skewed supports. The research study included instrumentation of a box girder bridge with a skewed support, fmite element modeling of the instrumented bridge, and parametric FEA studies.
The field data collected during this study has been presented in its entirety by Milligan (2002), Muzumdar (2003), and Bobba (2003). Selected field data has been presented in this report to validate the finite element model of the instrumented bridge. Parametric FEA studies examining the influence of various factors including skew angles, radii of curvature, span length, internal K-frame spacing, and number of external
159
K-frame were conducted. The results from these parametric studies have been used to improve the understanding of box girder bridge systems with a skewed support.
8.2 Recommendations for Design of Box Girder Systems
The following items detail specific recommendations for the detailing, analysis, and design of box girder bridge systems and their bracing elements. The recommendations are provided for bridges with radial supports and skewed supports. A recommended design approach is also provided for bridges utilizing intermediate external cross-frames.
8.2.1 Determination of Torques for Girder Design:
A number of approximate methods were evaluated for determining the distribution of the torque along the girder lengths including a grid analysis, the MIR method, as well as a closed-form solution (see derivation in appendix). The M/R method and the closed-form solution provide the designer with easy and flexible analyses that produce relatively accurate estimates of the torque distribution along the girder length. Grid analyses of systems with skewed supports showed good agreement with the results of the 3D FEA models so long as the correct torsional constant was used in the grid analysis. The quasiclosed torsional constant should be used in evaluations of system capacity under the critical deck casting load. Grid analyses are very sensitive to the torsional constant of the girders in models of bridges with skewed supports because of the interaction between the diaphragm and the girder in bridges with skewed supports. With an end skew, the diaphragm has a component directed along the longitudinal axis of the girders. The strong-axis rotation of the girders can result in the development of additional forces in the diaphragms, and subsequently larger torques in the girders, when the girder torsional constant is not properly modeled.
8.2.2 Equivalent Plate Method
The equivalent plate expressions provided by Kohlbrunner and Basler (1969) provide very accurate estimates of the torsional constant for the quasi-closed box girders formed by the girders and the top lateral truss system. Use of these quasi-closed box properties produced good results for construction stages in grid analyses of systems with both radial and skewed supports.
8.2.3 Elevation of Top Lateral Truss
The top lateral truss system should be positioned as close as possible to the plane of the top flanges of the girder. In some past bridge designs the top strut has been positioned more than 8 to 10 inches below the level of the top flanges of the girder to avoid interference between the struts and diagonals of the top flange truss. In most situations clearance issues were unwarranted and the large offset was not necessary. Large offsets such as these produce a poor distribution of forces in the top lateral truss system. Since the top strut of the internal K-frame is not only an important part of the Kframe system but also is a critical part of the top lateral truss system the designer should
160
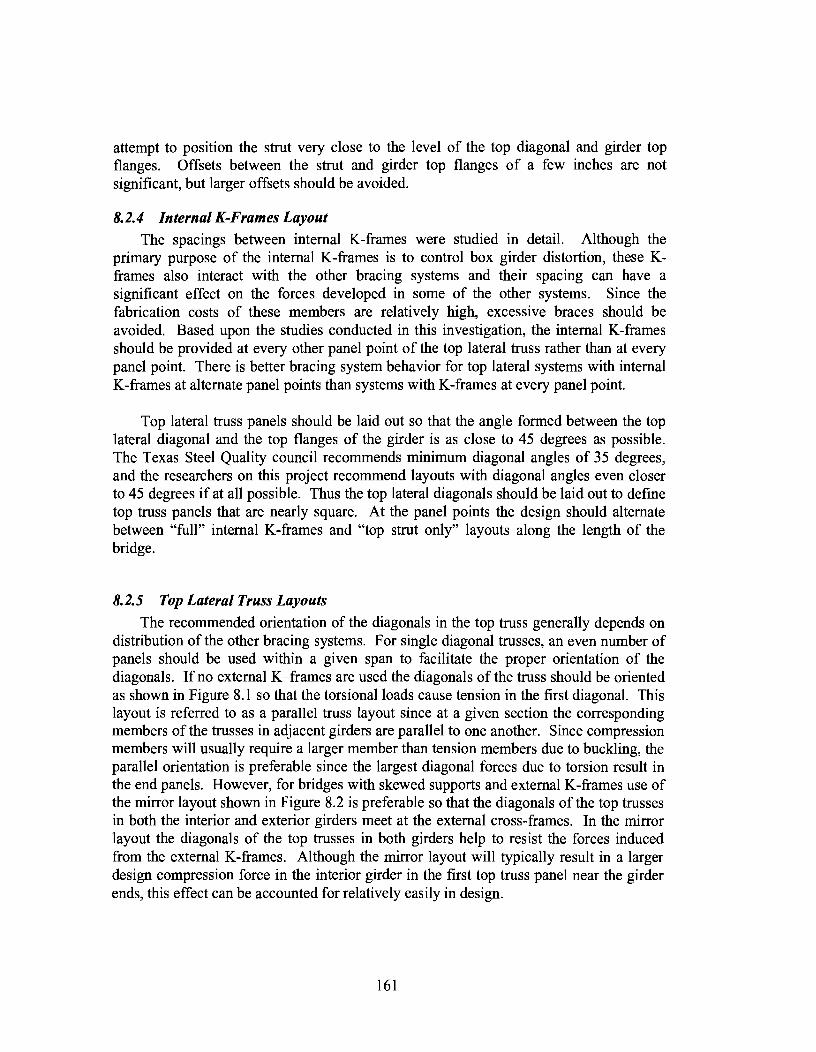
attempt to position the strut very close to the level of the top diagonal and girder top flanges. Offsets between the strut and girder top flanges of a few inches are not significant, but larger offsets should be avoided.
8.2.4 Internal K-Frames Layout The spacings between internal K-frames were studied in detail. Although the
primary purpose of the internal K-frames is to control box girder distortion, these Kframes also interact with the other bracing systems and their spacing can have a significant effect on the forces developed in some of the other systems. Since the fabrication costs of these members are relatively high, excessive braces should be avoided. Based upon the studies conducted in this investigation, the internal K-frames should be provided at every other panel point of the top lateral truss rather than at every panel point. There is better bracing system behavior for top lateral systems with internal K-frames at alternate panel points than systems with K-frames at every panel point.
Top lateral truss panels should be laid out so that the angle formed between the top lateral diagonal and the top flanges of the girder is as close to 45 degrees as possible. The Texas Steel Quality council recommends minimum diagonal angles of 35 degrees, and the researchers on this project recommend layouts with diagonal angles even closer to 45 degrees if at all possible. Thus the top lateral diagonals should be laid out to defme top truss panels that are nearly square. At the panel points the design should alternate between "full" internal K-frames and "top strut only" layouts along the length of the bridge.
8.2.5 Top Lateral Truss Layouts
The recommended orientation of the diagonals in the top truss generally depends on distribution of the other bracing systems. For single diagonal trusses, an even number of panels should be used within a given span to facilitate the proper orientation of the diagonals. If no external K-frames are used the diagonals of the truss should be oriented as shown in Figure 8.1 so that the torsional loads cause tension in the first diagonal. This layout is referred to as a parallel truss layout since at a given section the corresponding members of the trusses in adjacent girders are parallel to one another. Since compression members will usually require a larger member than tension members due to buckling, the parallel orientation is preferable since the largest diagonal forces due to torsion result in the end panels. However, for bridges with skewed supports and external K-frames use of the mirror layout shown in Figure 8.2 is preferable so that the diagonals of the top trusses in both the interior and exterior girders meet at the external cross-frames. In the mirror layout the diagonals of the top trusses in both girders help to resist the forces induced from the external K-frames. Although the mirror layout will typically result in a larger design compression force in the interior girder in the first top truss panel near the girder ends, this effect can be accounted for relatively easily in design.
161
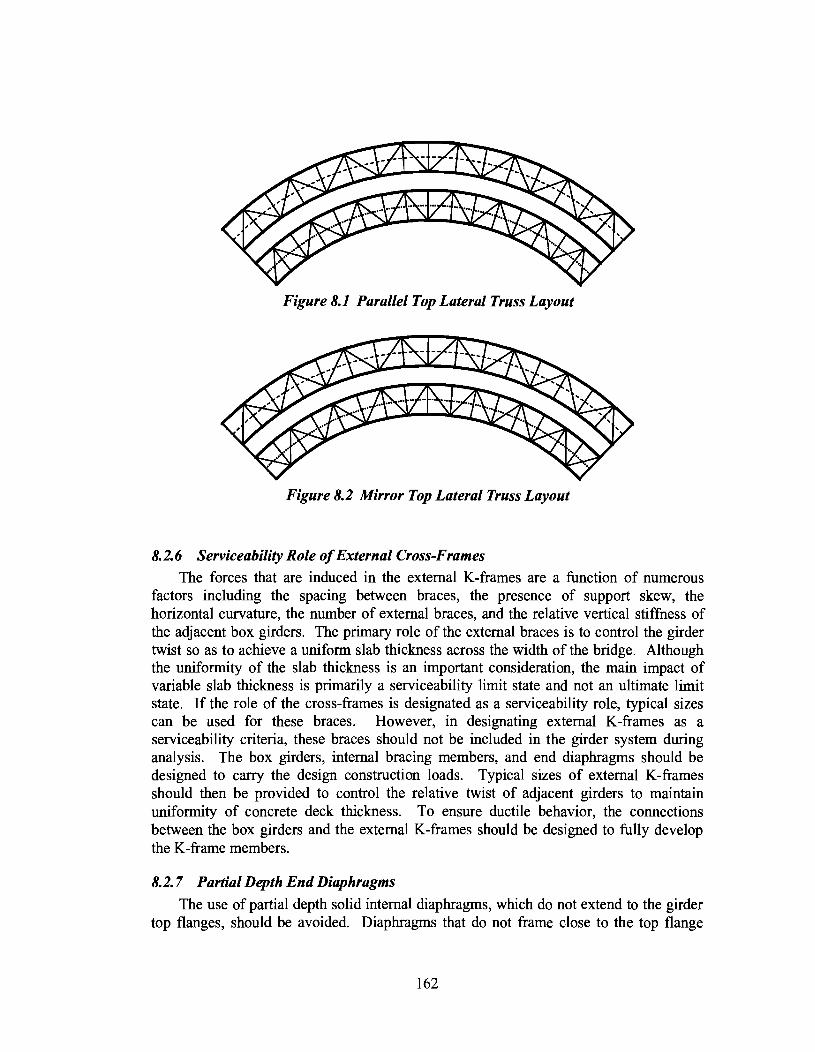
Figure 8.1 Parallel Top Lateral Truss Layout
Figure 8.2 Mirror Top Lateral Truss Layout
8.2.6 Serviceability Role of External Cross-Frames
The forces that are induced in the external K-frames are a function of numerous factors including the spacing between braces, the presence of support skew, the horizontal curvature, the number of external braces, and the relative vertical stiffness of the adjacent box girders. The primary role of the external braces is to control the girder twist so as to achieve a uniform slab thickness across the width of the bridge. Although the uniformity of the slab thickness is an important consideration, the main impact of variable slab thickness is primarily a serviceability limit state and not an ultimate limit state. If the role of the cross-frames is designated as a serviceability role, typical sizes can be used for these braces. However, in designating external K-frames as a serviceability criteria, these braces should not be included in the girder system during analysis. The box girders, internal bracing members, and end diaphragms should be designed to carry the design construction loads. Typical sizes of external K-frames should then be provided to control the relative twist of adjacent girders to maintain uniformity of concrete deck thickness. To ensure ductile behavior, the connections between the box girders and the external K-frames should be designed to fully develop the K-frame members.
8.2. 7 Partial Depth End Diaphragms
The use of partial depth solid internal diaphragms, which do not extend to the girder top flanges, should be avoided. Diaphragms that do not frame close to the top flange
162
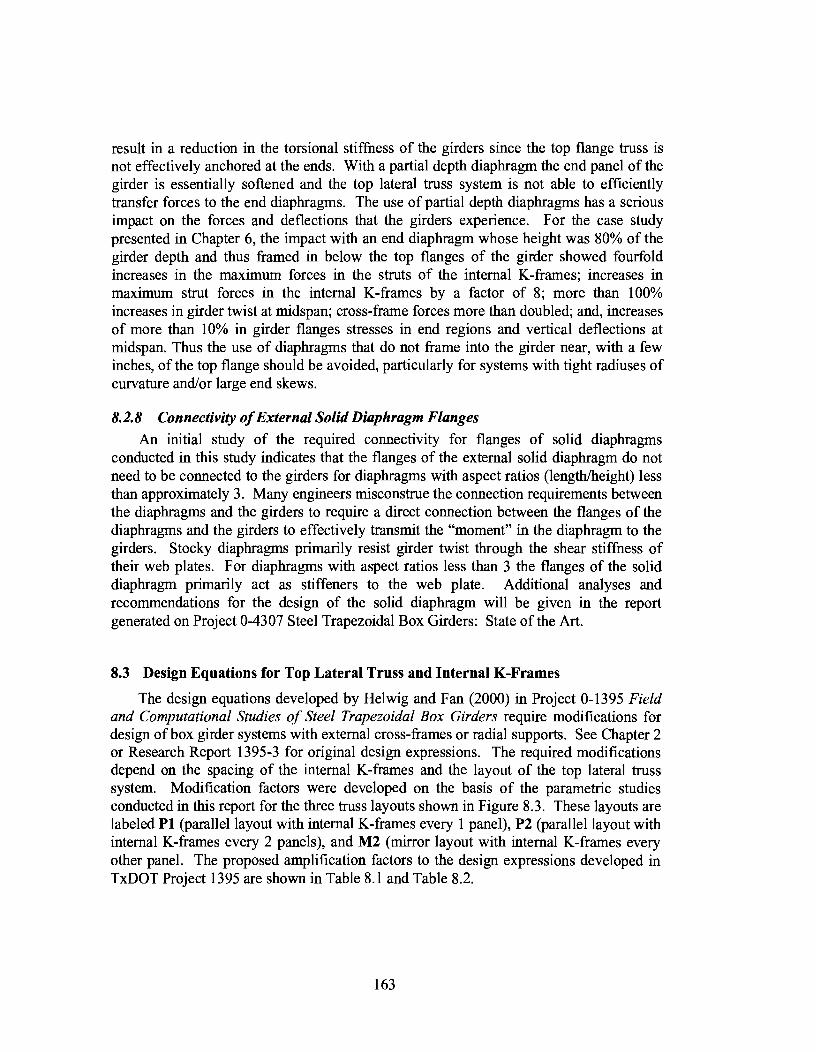
result in a reduction in the torsional stiffness of the girders since the top flange truss is not effectively anchored at the ends. With a partial depth diaphragm the end panel of the girder is essentially softened and the top lateral truss system is not able to efficiently transfer forces to the end diaphragms. The use of partial depth diaphragms has a serious impact on the forces and deflections that the girders experience. For the case study presented in Chapter 6, the impact with an end diaphragm whose height was 80% of the girder depth and thus framed in below the top flanges of the girder showed fourfold increases in the maximum forces in the struts of the internal K-frames; increases in maximum strut forces in the internal K-frames by a factor of 8; more than 100% increases in girder twist at midspan; cross-frame forces more than doubled; and, increases of more than 10% in girder flanges stresses in end regions and vertical deflections at midspan. Thus the use of diaphragms that do not frame into the girder near, with a few inches, of the top flange should be avoided, particularly for systems with tight radiuses of curvature and/or large end skews.
8.2.8 Connectivity of External Solid Diaphragm Flanges
An initial study of the required connectivity for flanges of solid diaphragms conducted in this study indicates that the flanges of the external solid diaphragm do not need to be connected to the girders for diaphragms with aspect ratios (length/height) less than approximately 3. Many engineers misconstrue the connection requirements between the diaphragms and the girders to require a direct connection between the flanges of the diaphragms and the girders to effectively transmit the "moment" in the diaphragm to the girders. Stocky diaphragms primarily resist girder twist through the shear stiffness of their web plates. For diaphragms with aspect ratios less than 3 the flanges of the solid diaphragm primarily act as stiffeners to the web plate. Additional analyses and recommendations for the design of the solid diaphragm will be given in the report generated on Project 0-4307 Steel Trapezoidal Box Girders: State of the Art.
8.3 Design Equations for Top Lateral Truss and Internal K-Frames
The design equations developed by Helwig and Fan (2000) in Project 0-1395 Field and Computational Studies of Steel Trapezoidal Box Girders require modifications for design of box girder systems with external cross-frames or radial supports. See Chapter 2 or Research Report 1395-3 for original design expressions. The required modifications depend on the spacing of the internal K-frames and the layout of the top lateral truss system. Modification factors were developed on the basis of the parametric studies conducted in this report for the three truss layouts shown in Figure 8.3. These layouts are labeled Pl (parallel layout with internal K-frames every 1 panel), P2 (parallel layout with internal K-frames every 2 panels), and M2 (mirror layout with internal K-frames every other panel. The proposed amplification factors to the design expressions developed in TxDOT Project 1395 are shown in Table 8.1 and Table 8.2.
163
Case P1
(a) Parallel
(with internal K's every panel)
Case P2
(b) Parallel
(with internal K's every other panel)
CaseM2
(c) Mirror
(with internal K's every other panel)
Figure 8.3 Top Lateral Truss Layouts
164
K =Internal K-frame

Table 8.1Amplijication Factors to 1395 Equations for Systems with Radial Supports (With or Without External Cross-Frames)
and Skewed Supports (Without External Cross-Frames)
Truss Layout Member Recommended Amplification
P2 All None
Pl andM2 Truss Diagonals None
Pl andM2 Struts 33%
Pl andM2 Int. K Diagonals 20%
Table 8.2 Amplification Factors to 1395 Equations for Systems with Skewed Supports (With External Cross-Frames ~
Truss Layout Member Recommended Amplification
Pl, P2, and M2 Truss Diagonals None
Pl and P2 Struts 100% /NEK
M2 Struts 33%
Pl, P2 and M2 Int. K Diagonals 20%
165

!!!!!!!!!!!!!!!!!!!"#$%!&'()!*)&+',)%!'-!$-.)-.$/-'++0!1+'-2!&'()!$-!.#)!/*$($-'+3!
44!5"6!7$1*'*0!8$($.$9'.$/-!")':!

Appendix A
Axial Force Derivation
A.l Introduction
The diagonals ofthe top lateral truss system were constructed out ofWT sections. A total of six strain gauges were placed on each tee as described in Chapter 2. The use of six gauges on each tee provided redundancy to the instrumentation system since only three gauges are required to define the stress plane at a particular cross section of a member. From the equations for the stress plane, the stress at the centroid of the member can be calculated. Since the bending stress at the centroid is zero, the stress at the centroid is purely axial stress. From the axial stress and cross-sectional area, the axial force in a member can be calculated. This axial force resolution approach was developed by Helwig and Fan (2000) while working on a similar research study. This method was applied by Milligan (2002) in the resolution of K-frame forces, and was used in this report for resolution of top diagonal forces.
A.2 Regression Method
According to mechanics of thin-walled structures, no warping stresses will be induced on the cross-section when the member is subjected to torsional moments. Therefore, the longitudinal stresses in the bracing members are caused only by the axial forces and bending moments (Helwig and Fan 2000). Assuming plane sections remain plane, the longitudinal stress is distributed linearly over the cross-section of the member. This plane of stress is expressed by
f = a+bx+cy. (A. 1)
In this equation,fis the longitudinal stress, a, b, and care constants, and x andy are coordinates of the member cross-section. Once the constants are solved for, the stress can be found at any point on the cross-section. To solve for constants b and c, the following two equations are used:
The values for h ~, 112, 1w, h1, 122, and /20 are found as follows:
167
(A.2a)
(A.2b)
(A.3a)

n
/22 = L(Y;- Y) 2' (A.3b)
i=l
112 = 121 n
L(X; -~)(y;-y)' (A.3c) i=l
n -lw = L(X; -~)(J; f), (A. 3d)
i=l
n
/20 = L(Y;- y)(J;- f), (A.3e) i=1
- 1 n x=-I:x1 , (A.3f)
n i=1
- 1 n
y =-LY;' (A.3g) n i=l
- 1 n
f=- I:J; · (A.3h) n i=l
Here, .fi represents the stress measured by a particular gauge and xi and Yi are its coordinates on the member cross-section. The constant a can then be found by rearranging Eq. A.l into
- - -a= f -bx-cy. (A.4)
If the origin of the coordinate system is placed at the centroid of the cross-section, then the axial force simply becomes
N=aA, (A.5)
where A is the cross-sectional area of the member and N is the axial force.
168

Appendix B
Layout of Bracing in the Parametric Analyses
169

- -.....l 0
All
sch
emes
var
ies
wit
h:
Ske
w a
ngle
: 0,
10,
20,
30
degr
ee o
n on
e en
d
Rad
ius
of c
urva
ture
: 60
0',
1200
', 18
00',
stra
igh
t
Int.
K s
paci
ng:
ever
y 1,
2, 4
, 6 p
anel
s
# o
f Ext
. K:
Non
e, 1
, 2, 3
Sec
tion
w/ d
iam
ond
Sec
tion
w/o
dia
mon
d
case
2:
Int-
K s
paci
ng:
1 pa
nel
No.
ofE
xt-K
: 1
case
4:
Int-
K s
paci
ng:
1 pa
nel
No.
ofE
xt-K
: 3
Th
e p
rism
atic
gir
der
pro
per
ty:
Sin
gle
pane
l tw
in g
irde
r br
idge
, L=
160'
,16
pane
ls
Dis
tanc
e be
twee
n ce
nter
s o
f1F
: 12
5"
Hei
ght:
90
";
1F
: 18
"X0.
75";
BF
: 8
0"X
ll/1
6"
SD:
WT
9 X
48.5
; T
op T
russ
: L
4" X
4" X
5/16
"
case
1:
Int-
K s
paci
ng:
1 pa
nel
No.
ofE
xt-K
: 0
case
3:
Int-
K s
paci
ng:
1 pa
nel
No.
ofE
xt-K
: 2
case
5:
Int-
K s
paci
ng:
2 pa
nel
No.
ofE
xt-K
: 0

case
6:
Int-
K s
paci
ng:
2 pa
nel
No.
ofE
xt-K
: 1
case
7:
Int-
K s
paci
ng:
2 pa
nel
No.
ofE
xt-K
: 2
case
8:
Int-
K s
paci
ng:
2 pa
nel
No.
ofE
xt-K
: 3
case
9:
Int-
K s
paci
ng:
4 pa
nel
No.
ofE
xt-K
: 0
case
10:
Int
-K s
paci
ng:
4 pa
nel
No.
ofE
xt-K
: 1
case
12:
Int
-K s
paci
ng:
6 pa
nel
No.
ofE
xt-K
: 0
case
13:
Int
-K s
paci
ng:
6 pa
nel
No.
ofE
xt-K
: 2

Appendix C
Supplementary Results of Parametric Analyses
C.l Layout of Top Lateral Truss
Top diagonal
(a) Parallel Layout (b) Mirror Layout
Figure C.l Layout of Top Lateral Truss
C.2 Brace Force Vs # ofExt-K: (Span Length: 160 Feet Parallel)
Radius: 600 feet
200 Skew: 0 deg lnt-K spacing: every2 panels
.....,._No Ext-K
--111- 1 Ext-K
........,_3 Ext-K 150
100
50
e o .e
-50
-100
-150
-200
Girder I Girder E
length along span (feet)
Figure C.2 Diagonal Force vs. # of Ext-K ( R=600 ft., 0 deg. Skew, lnt-K Spacing Every 2 Panels)
172
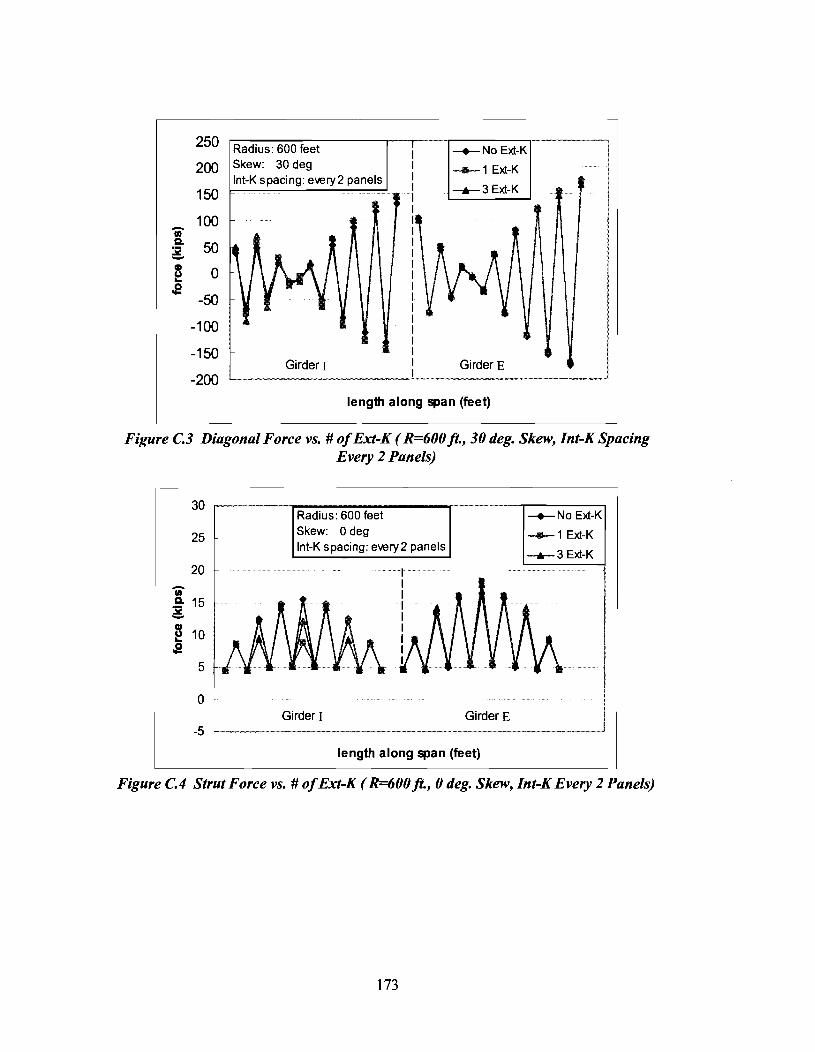
250
200
150
100
50
0
-50
-100
-150
Radius: 600 feet Skew: 30 deg lnt-K spacing: every 2 panels
Girder I
-+-No Ext-K
----1 Ext-K
--..--3 Ext-K
GirderE
length along span (feet)
Figure C.3 Diagonal Force vs. #of Ext-K ( R=600 ft., 30 deg. Skew, Int-K Spacing Every 2 Panels)
30
25
20
li .9- 15 ~ -3 10 ... .e
5
0
-5
Radius: 600 feet Skew: 0 deg lnt-K spacing: every 2 panels
Girder I GirderE
length along span (feet)
Figure C.4 Strut Force vs. # of Ext-K ( R=600 ft., 0 deg. Skew, Int-K Every 2 Panels)
173

30
25
20 -Ill :t 15 -e 10 .s
5
0
-5
Girder I
~NoExt-K
---1 Ext-K
-+-3 Ext-K
Radius: 600 feet Skew: 30 deg lnt-K spacing: every 2 panels
Girder E
length along span (feet)
Figure C.5 Diagonal Force vs. #of Ext-K ( R=600 ft., 30 deg. Skew, Int-K Spacing Every 2 Panels)
10
5
0
'ii' -5 c. ~ -10
~ .s -15
-20
-25
-30
~NoExt-K
---1 Ext-K
-+-3 Ext-K
Girder I
Radius: 600 feet Skew: Odeg lnt-K spacing: every2 panels
GirderE
length along span (feet)
Figure C.6 lnt-K Diagonal Force vs. # ofExt-K ( R=600 ft., 0 deg. Skew, Int-K Spacing Every 2 Panels)
174

10 ,-----~-+----N-o--E~---Kr--~----~R-ad~iu_s_:~60~0~re~e~t-------.-.
5
0
'i" -5 a. ;g_ -10 e .2 -15
-20
-25
__._ 1 E~-K Skew: 30 deg lnt-K spacing: every 2 panels
-.-3 E~-K
Girder I GirderE
length along span (feet)
Figure C. 7 lnt-K Diagonal Force vs. # of Ext-K ( R=600 ft., 30 deg. Skew, Int-K Spacing Every 2 Panels)
C.3 Brace Force Vs Internal K-Frame's Spacing: (Span Length: 160 Feet Parallel)
30
25
20 -fR a. ~ 15 -~ 10 .2
5
0
-5
Girder I
Radius: 600 feet Skew: 0 deg Ext-K: none Girder E
length along girder (feet)
Figure C.S Strut Force vs. Int-K Spacing ( R=600 ft., 0 deg. Skew, No Ext-K)
175

30
25
20
15
Girder I
-+-1 panel --2panelsi
Radius: 600 feet Skew: 10 deg Ext-K: none
length along
Figure C.9 Strut Force vs. Int-K Spacing ( R=600ft., 10 deg. Skew, No Ext-K)
30
25
20
Iii' 15 a. ~
~ 10 0 ....
5
0
-5 Girder I
-+-1 panel --2panel -ir-4 panels
··· Skew: 20 deg
Ext-K: none GirderE
length along girder (feet)
Figure C.JO Strut Force vs. Int-K Spacing ( R=600 ft., 20 deg. Skew, No Ext-K)
176

30
25
20 .. 15 a. ::i! -f 10 ~
5
0 Girder I
-5
--+- 1 panel • --2panels!
. .......-4panels · __._ 6 panels I
·····~· ~----y--.:....J ....
I L I I ........ I I r---
Ext-K: none
length along girder (feet)
Girder E
Figure C.ll Strut Force vs. Int-K Spacing ( R=600 ft, 30 deg. Skew, No Ext-K)
30
25
20
I 15 ::i! -e 10 ~
5
0
-5
Girder I Skew: 0 deg
Ext-K: none
length along girder (feet)
Girder E
Figure C.l2 Strut Force vs. Int-K Spacing ( R=l200 ft., 0 deg. Skew, No Ext-K)
177

30
25
20
I 15 l! ..... ~ 10 .e
5
0
-5 Girder I
---.-- 1 panel
- ............. 2 panels
Radius: 1200 feet Skew: 10 deg Ext-K: none
length along girder (feet)
GirderE
Figure C.13 Strut Force vs. lnt-K Spacing ( R=l200 ft., 10 deg. Skew, No Ext-K)
30
25
20
'ii' 15 Cl. l! ..... ~ 10 .e
5
0
-5 Girder I
---.-- 1 panel
· ............. 2 panels
-.--4 panels
Radius: 1200 feet Skew:20deg Ext-K: none
length along girder (feet)
GirderE
Figure C.14 Strut Force vs.lnt-K Spacing ( R=l200 ft., 20 deg. Skew, No Ext-K)
178

-+--1 panel
length along girder (feet)
Figure C.15 Strut Force vs. Int-K Spacing ( R=1200 ft., 30 deg. Skew, No Ext-K)
179

C.4 Brace Force vs. Skew Angle (Span Length 160 feet, Parallel Layout)
30 ~~--~~~-----,~-----,------------------~ Radius: 600 feet -+-0 lnt-K spacing: every panel -- 1 0 25 Ext-K: none
----A-20
20 Wi' a. :5i! - 15 ~ .2
10
5
Girder I
length along girder (feet)
GirderE
Figure C.16 Strut Force vs. Skew Angle ( R=600 ft., Int-K Every Panel, No Ext-K)
Radius: 600 feet lnt-K spacing: every panel Ext-K: 1
Girder I
length along girder (feet)
GirderE
Figure C.17 Strut Force vs. Skew Angle ( R=600 ft., Int-K Every Panel, 1 Ext-K)
180

'ii' a.
20
~ 15 ~ .e
10
5
0
Radius: 600 feet lnt-K spacing: every panel Ext-K: 2
Girder I
length along girder (feet)
GirderE
Figure C.l8 Strut Force vs. Skew Angle ( R=600 ft., Int-K Every Panel, 2 Ext-K)
30
25
20 'ii' a. :52 15 ..., CD e .e
10
5
0
Radius: 600 feet lnt-K spacing: every panel Ext-K: 3
Girder I
length along girder (feet)
--+-0
-IIB-10
--~r-20
GirderE
Figure C.l9 Strut Force vs. Skew Angle ( R=600 ft., Int-K Every Panel, 3 Ext-K)
181
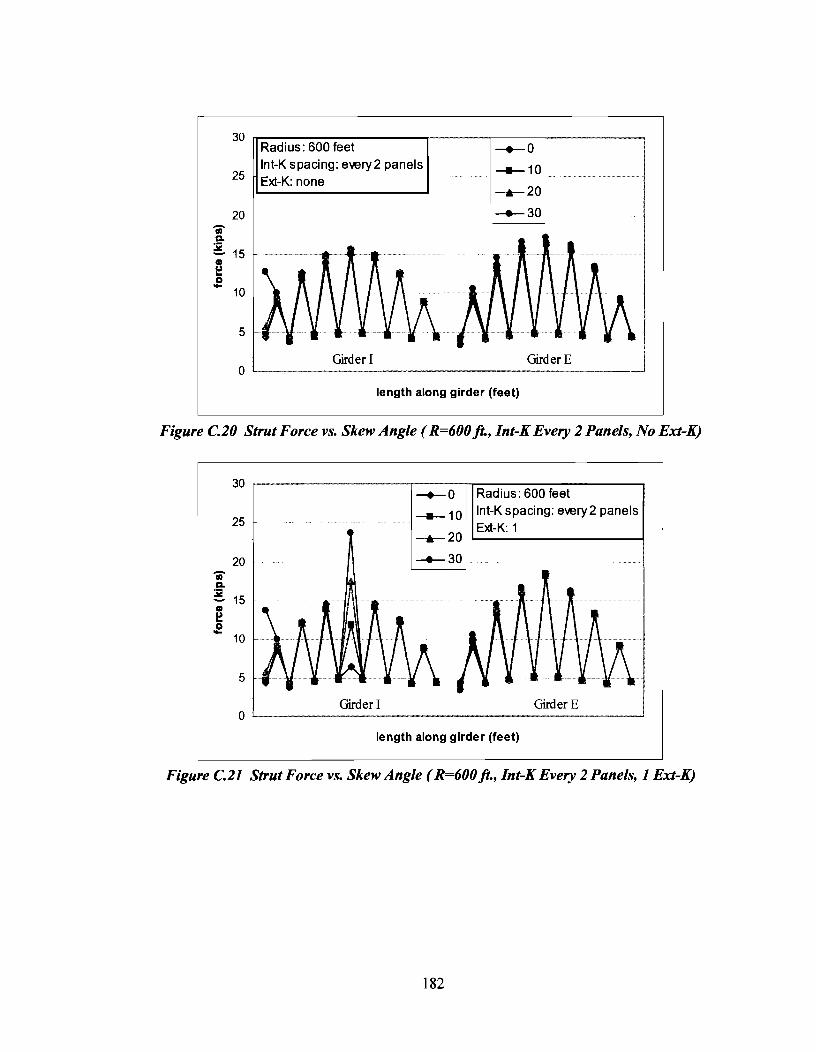
'ii' a.
30 ~----------------~------~----~--------~ Radius: 600 feet lnt-K spacing: every2 panels
25 Ext-K: none
20
~ 15
I! .e 10
5
Girder I Girder£
length along girder (feet)
Figure C.20 Strut Force vs. Skew Angle ( R=600 ft., Int-K Every 2 Panels, No Ext-K)
30 ,----------------;-----,~-;--~~---------. --.- 0 Radius: 600 feet
'ii' a.
25
20
~ 15 e .e 10
5
-11- 10 lnt-K spacing: every 2 panels Ext-K: 1
......_ 20 L--------------~
--e-30
Girder I GirderE
length along girder (feet)
Figure C.21 Strut Force vs. Skew Angle ( R=600 ft., Int-K Every 2 Panels, 1 Ext-K)
182

30 r-----~-----------~----~------------------~
'ij" a.
25
20
;g. 15
~ .e
10
5
Girder I
--+-0 Radius: 600 feet lnt~K spacing: every2 panels Ext~K: 2
GirderE
length along girder (feet)
Figure C.22 Strut Force vs. Skew Angle ( R=600 ft., Int-K Every 2 Panels, 2 Ext-K)
30 r-----------------r~o --.-- Radius: 600 feet !--10 lnt~Kspacing:every2
25
20 'ij" a. ;g. 15
~ .e 10
5
i ~ 20 , ,_E_xt_-_K_: 3----------1
I : 301
Girder I Girder E
length along girder (feet)
Figure C.23 Strut Force vs. Skew Angle ( R=600 ft, Int-K Every 2 Panels, 3Ext-K)
183

C.S Brace Force Vs # ofExt-K: (Span Length: 160 Feet Mirror)
250 Radius: 600 feet
200 Skew: 0 deg lnt-K spacing: every2 panels
150
100 'i' Q.
~ 50
e o .e -50
-100
I I I ... I I I I
• I I I I r I
-150 Girder( ··································I I
-200
-+-No Ext-K
-11- 1 Ext-K
--6-3 Ext-K
Girder£······
length along span (feet)
Figure C.24 Top Lateral Truss Force vs. #of Ext-K ( R=600 ft., 0 deg. Skew, Int-K Spacing Every 2 Panels)
250 Radius:600feet
200 Skew: 30 deg lnt-K spacing: every 2 panels
150 !-----------'
100 'i' Q.
~ 50
I I I I 1 I
0 l~t+·t··++ I I
-50
-100
-150 Girder I
-200
I t I L I I I I '
-+-No Ext-K
Girder E
length along span (feet)
Figure C.25 Top Lateral Truss Force vs. #of Ext-K ( R=600 ft., 30 deg. Skew, Int-K Spacing Every 2 Panels)
184

30 -+--No Ext-K Radius: 600 feet
25 _.__ 1 Ext-K Skew: 0 deg ___._
3 Ext-K lnt-K spacing: every2 panels
20 en -~ 15 ~ -Cl)
10 u ... .g
5
0 Girder I Girder E
-5
length along span (feet)
Figure C.26 Strut Force vs. #of Ext-K ( R=600 ft., 0 deg. Skew, Int-K Every 2 Panels)
30 -+--No Ext-K Radius: 600 feet
25 _.__ 1 Ext-K Skew: 30 deg ___._
3 Ext-K lnt-K spacing: every2 panels
20
en -~ 15 ~ -Cl)
10 u ... .e 5
0 Girder I GirderE
-5
length along span (feet)
Figure C.27 Strut Force vs. #of Ext-K ( R=600 ft., 30 deg. Skew, Int-K Spacing Every 2 Panels)
185
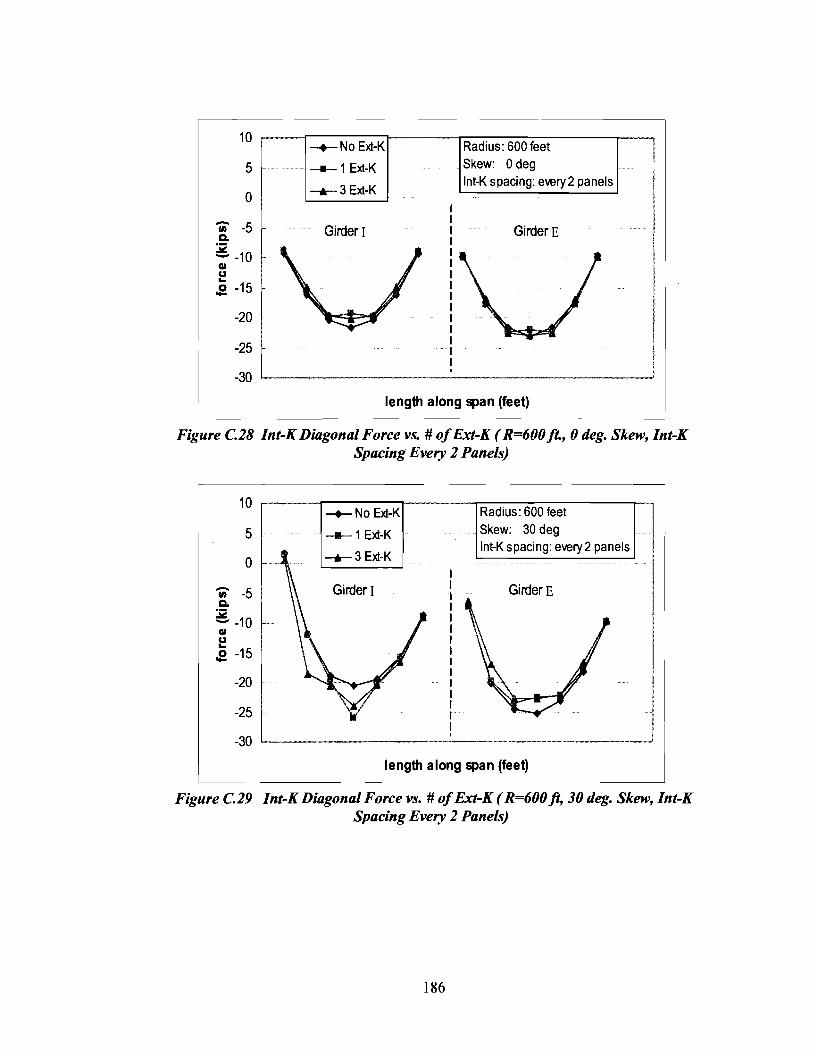
10 ~--~------,_------r-------------~~~ -+-No Ext-K Radius: 600 feet
5 -111- 1 Ext-K Skew: 0 deg
0 _..... 3 Ext-K lnt-K spacing: every 2 panels
• -5 a. Girder I
~ -10 C»
~ .2 -15
-20
-25
-30
I I I I I I I
.. J I I I I I I I I
GirderE
length along span (feet)
Figure C.28 Int-K Diagonal Force v.~. #of Ext-K ( R=600 ft., 0 deg. Skew, Int-K Spacing Every 2 Panels)
10 r-----~-+-----N-o-Ext---K~------r.R~a~d~iu-s:~6~00~m~e-t-------r~
5 Skew: 30 deg
0
• -5 a. ~ -10 C»
~ .2 -15
-20
-25
-30
lnt-K spacing: every2 panels
GirderE
length along span (feet)
Figure C.29 Int-K Diagonal Force vs. #of Ext-K ( R=600 ft, 30 deg. Skew, Int-K Spacing Every 2 Panels)
186

C.6 Brace Forces vs. # Of External K's for Short Span and Skewed Box Girders
C.6.1 Radius= 600ft., Length= 120ft., Parallel
120
80
-IR 40 CL
:;: -G)
e 0 .2
-40
-80
.... I • mNo Ext-K Radius: 600 feet
Girder I
! --m--1 Ext-K Length: 120 feet __.__ 3 Ext-K Skew: 15 deg
lnt-K spacing: e~ry 2 panels
GirderE
length along girder (feet)
Figure C.30 Top Lateral Truss Force vs. # of Ext-K ( R=600 ft, 15 deg. Skew, Jnt-K Spacing Every 2 Panels)
20 ~--~----~------~--r-----------------~~, -+- Series1 Radius: 600 feet --m- Series2 Length: 120 feet
16 -.-seriesJ! Skew: 15 deg lnt-K spacing: e~ry 2 panels
4
0
length along girder (feet) ·-----·······----- ···-----·······---- ________________ _]
Figure C.31 Strut Force vs. #of Ext-K ( R=600 ft, 15 deg. Skew, lnt-K Spacing Every 2 Panels)
187
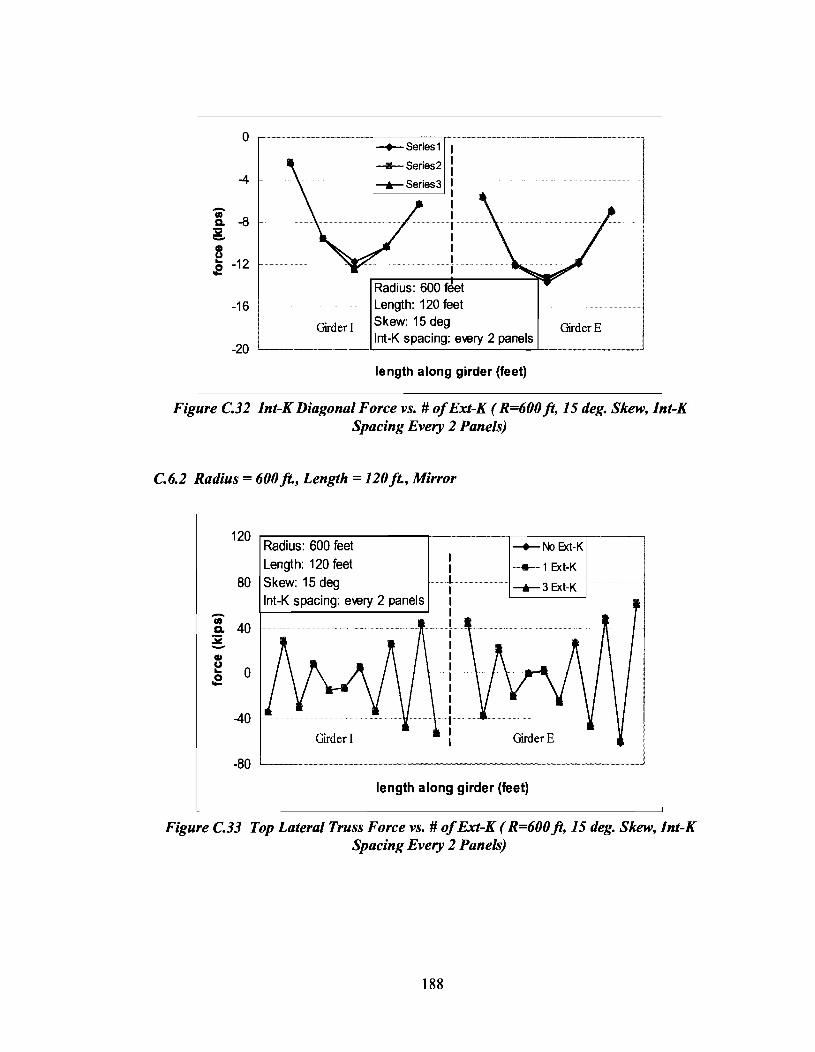
0
-4
-(I)
-8 Q.
li! -~ -12 .e
-16
-20
Girder I
-+-- Series 1
-1111- Series2
Radius: 600 reet Length: 120 feet Skew: 15 deg lnt-K spacing: ewry 2 panels
length along girder {feet)
GirderE
Figure C.32 lnt-K Diagonal Force vs. #of Ext-K ( R=600 ft, 15 deg. Skew, lnt-K Spacing Every 2 Panels)
C.6.2 Radius =600ft., Length =120ft., Mirror
-(I) a. :;: -
120 .------------..----,-------,----------, Radius: 600 feet Length: 120 feet
80 Skew: 15 deg
lnt-K spacing: ewry 2 panels
length along girder (feet)
Figure C.33 Top Lateral Truss Force vs. #of Ext-K ( R=600 ft, 15 deg. Skew, lnt-K Spacing Every 2 Panels)
188

20 ~-------~~----------~------~--------~~ Radius: 600 feet -+- 1\b Ext-K
--11-1 Ext-K
16 ---.--3 Ext-K
4
Girder I
0
Length: 120 feet Skew: 15 deg lnt-K spacing: e-very 2 panels
GirderE
length along girder (feet)
Figure C.34 Strut Force vs. # of Ext-K ( R=600 ft, 15 deg. Skew, Int-K Spacing Every 2 Panels)
0
GirderE -4
"ii' Q. -8
e .2 -12
Radius: 600 feet
-16 -:-l\b1
ExtEx-tK=K:l Length: 120 feet _ I Skew: 15 deg
I ---.--3 Ext K lnt-K spacing: e-very 2 panels -20 L.....-_____ - ____ __.J... ________ ____,~......_ ____ ____;
length along girder (feet)
Figure C.35 Int-K Diagonal Force vs. # of Ext-K ( R=600 ft, 15 deg. Skew, Int-K Spacing Every 2 Panels)
189

C.7 Brace Forces vs. # OfExt-K for Long Span and Skewed Box Girders (Radius= 1200 ft., Length = 240 ft., Parallel)
500
400
300
- 200 • a. ~ 100 CD 0 u ... .2 -100
-200
-300
-400
-+-l'«lExt-K
--1 Ext-K
-.-3Ext-K
I
Girder I
Radius: 1200 Length: 240 Skew: 30deg lnt-K spacing: every 2 panels
Girder E
length along girder (feet)
Figure C.36 Top Lateral Truss Force vs. #of Ext-K ( R=l200 ft, 30 deg. Skew, Int-K Spacing Every 2 Panels)
15
10
5 Girder I
I I I I I I I I I I
'' t I
···········I· I Girder E
0 ~---------------------------------~~-----.~~
length along girder (feet)
Figure C.37 Strut Force vs. #of Ext-K ( R=l200 ft, 30 deg. Skew, Int-K Spacing Every 2 Panels)
190

50
45
40
35 -l3o :i2 -25 CD u ... 20 .2
15
10
5
0
-+-1\b Ext-K
Girder I
Radius: 1200 feet Length: 240 feet Skew: 30deg lnt-K spacing: every 2 panels
Girder E
length along girder (feet)
Figure C.38 lnt-K Diagonal Force vs. #of Ext-K ( R=l200 ft, 30 deg. Skew, Int-K Spacing Every 2 Panels)
191

!!!!!!!!!!!!!!!!!!!"#$%!&'()!*)&+',)%!'-!$-.)-.$/-'++0!1+'-2!&'()!$-!.#)!/*$($-'+3!
44!5"6!7$1*'*0!8$($.$9'.$/-!")':!

Appendix D
Torque Derivation
D.l Geometry and loading
a) Girder layout
w
~ I I I I I I I I I I I I ~ *Twist fixed in radial direction at two ends
b) Vertical loading
Figure D.l Curved Twin Girders
As shown in Figure D.l, the curved girder has a radius of R,, length of L1 and subtended angle ~~· The box girder is simply supported for bending and fixed for torsion at the supports. It is vertically loaded with uniformly distributed load w. For any point located on the curved girder, s and ~ are the arc length and subtended angle.
D.2 MIR method
The MIR method (Tung and Fountain, 1970) is widely employed to compute the approximate torque under a uniform load. To get a good estimation with this method, several assumptions should be satisfied.
• The curved box girder has a vertically symmetric section • The girder is torsionally restrained in the radial direction • Enough internal K-frames are provided in the box girder, so the distortion of
the girder is negligible
193
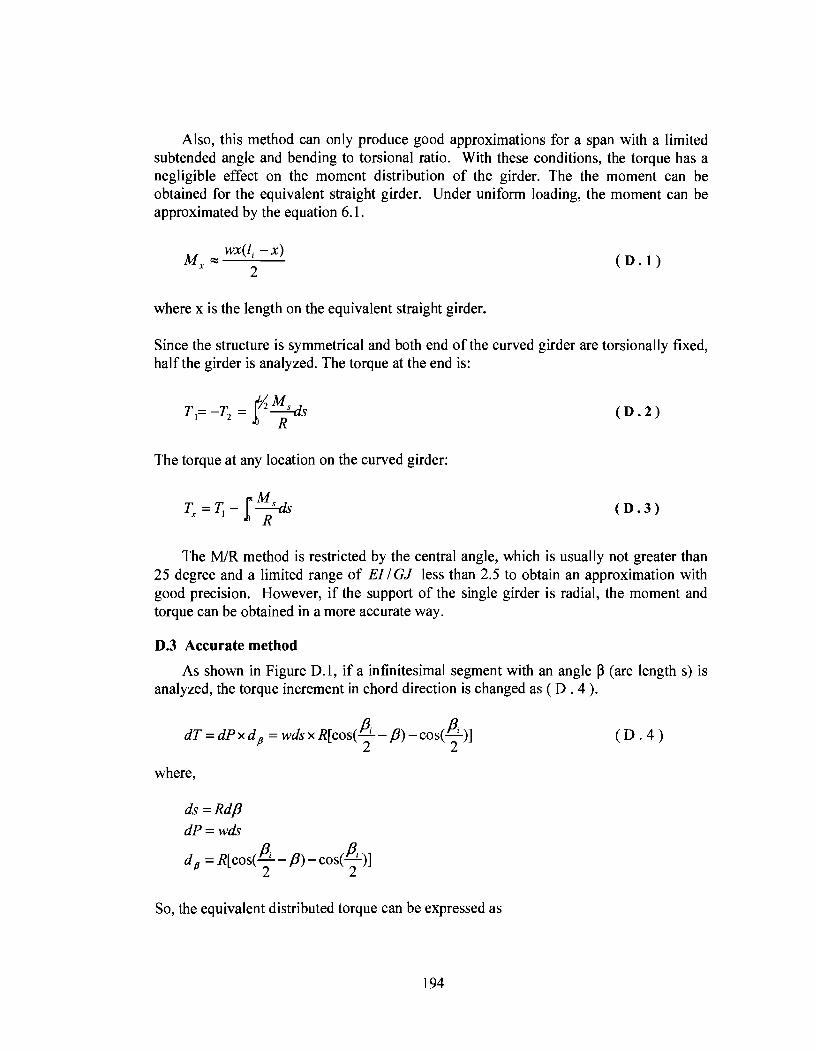
Also, this method can only produce good approximations for a span with a limited subtended angle and bending to torsional ratio. With these conditions, the torque has a negligible effect on the moment distribution of the girder. The the moment can be obtained for the equivalent straight girder. Under uniform loading, the moment can be approximated by the equation 6.1.
( D .1)
where x is the length on the equivalent straight girder.
Since the structure is symmetrical and both end of the curved girder are torsionally fixed, half the girder is analyzed. The torque at the end is:
(D. 2)
The torque at any location on the curved girder:
T =T.-r~ X 1 R (D. 3)
The MIR method is restricted by the central angle, which is usually not greater than 25 degree and a limited range of ElI GJ less than 2.5 to obtain an approximation with good precision. However, if the support of the single girder is radial, the moment and torque can be obtained in a more accurate way.
D.3 Accurate method
As shown in Figure D.1, if a infinitesimal segment with an angle~ (arc lengths) is analyzed, the torque increment in chord direction is changed as ( D . 4 ).
where,
ds=Rdp dP=wds
p p. d 11 = R[cos(-:f"- P)-cos(-:f")l
So, the equivalent distributed torque can be expressed as
194
(D. 4)

dT 2 fJ fi t(p)=-=wR [cos(-' -P)-cos(-')] dp 2 2
(D. 5)
By integrating along the box girder, the torque distribution is obtained.
T(fi) = T0 - r t(a)da (D. 6 a)
T(fi) = fo- (wR2 [cos(p1 -a) -cos(p' )]da 2 2
T(fi) = T0
- wR 2 [sin(p1 ) -sin(p' - fi)- ficos(p' )] 2 2 2
Since both supports are radial and the box girder is symmetrical, the torque at the middle span is 0.
Then,
Thus, at any position, the torque in the chord direction is shown as:
The torque in the tangential direction is expressed as:
cos(p') fi) 2 ]
cos(p1 - fi) 2
At the support, the torque reached its maximum value:
195
(D. 7)
(D. 8)
(D. 9)
(D. 10)
(D.ll)

!!!!!!!!!!!!!!!!!!!"#$%!&'()!*)&+',)%!'-!$-.)-.$/-'++0!1+'-2!&'()!$-!.#)!/*$($-'+3!
44!5"6!7$1*'*0!8$($.$9'.$/-!")':!

References
[AASHTO 2002] American Association of State Highway and Transportation Officials, Standard Specifications for Highway Bridges, Load & Resistance Factor Design, Second Ed., Washington, D. C., 2002.
[AASHTO Guide 2003] "Guide Specifications ofHorizontally Curved Highway Bridges" (2003), American ]Association of State Highway Officials, Washington, D.C.
[ANSYS 2003] "Finite Element Program Users Manual, Version 5.7", ANSYS, Inc.
[Bobba 2003] Bobba, S., "Field Measurements of Diaphragm and Cross-Frame Stresses in Steel Box Girder Bridge with Skewed Support", thesis presented to The University of Houston, (2003).
[Chen 2002] Chen, B. S. "Top-lateral bracing systems for trapezoidal steel box-girder bridges." dissertation presented to University of Texas at Austin, 2002.
[Cheplak 2001] Cheplak, B. A. "Field Measures oflntermediate External Diaphragms on a Trapezoidal Steel Box Girder Bridge," M.S. thesis presented to University of Texas at Austin, 2001.
[Fan 1999] Fan, Z. F., "Field and Computational Studies of Steel Trapezoidal Box Girder Bridges", Ph. D. Dissertation, Civil and Environmental Engineering Department, University of Houston.
[Fan and Helwig 2000] Fan, Z.F. and Helwig, T. A. "Field and Computational Studies of Steel Trapezoidal Box Girder Bridges," TxDOT Research Report 1395-3. The University of Houston, August 2000.
[Heins 1978] Heins, C.P "Box Girder Bridge Design-State of the Art." Engineering Journal, AISC, Vol. 15, No.4, Fourth Quarter, pp. 126-142.395
[Heins and Hall1981] Heins, C. P. and Hall, D. H. "Designer's Guide to Steel Box Girder Bridges," Bethlehem Steel Corporation, Booklet No. 3500, Bethlehem, Pennsylvania.
[Jaeger and Bakht 1989] Jaeger, L. G. and Bakht, B. "Bridge Analysis by Microcomputer", McGraw-Hill Book Company, New York, 1989.
[Keating and Alan 1992] Keating, P. B. and Alan, R. C., Evaluation and Repair of Fatigue Damage to Midland County Bridges (Draft), TX-92/1331-1.
197
[Kolbrunner and Basler 1969] Kolbrunner, C.F. and K. Basler "Torsion in Structures: An Engineering Approach". Springer-Verlag: Berlin, 1969. pp. 1-21,47-50.
[Memberg 2002] Memberg, M.A. "A design procedure for intermediate external diaphragms on curved steel trapezoidal box girder bridges" thesis presented to University of Texas at Austin, (2002).
[Milligan 2002] Milligan, D. "Cross Frame Bracing of Steel Trapezoidal Box Girder Bridge with Skewed Supports", thesis presented to The University of Houston, (2002).
[Muzumdar 2003] Muzumdar, P., "Field Measurements of Girder and Top Lateral Truss Stresses in Box Girder Bridge with Skewed Supports", thesis presented to The University of Houston, (2003).
[NCHRP 1998] "Improved Design Specification for Horizontally Curved Steel Girder Highway Bridges," Project 12-38. (1998)
[Shi 1997] Shi, J. H., "Brace Stiffness Requirements of Skewed Bridge Girders", M.S. Thesis presented to The University of Houston, (1997).
[Texas Steel Quality Council] "Preferred Practices for Steel Bridge Design Fabrication and Erection." November 2000.
[Tung and Fountain 1970] Tung, D. H. and Fountain, R. S., (1970), "Approximate Torsional Analysis of Curved ]Box Girders by the M/R Method," Engineering Journal, AISC, Vol. 7, No.3, pp. 65 -74.
[Wang 2002] Wang, L. "Cross-Frame and Diaphragm Behavior for Steel Bridges with Skewed Supports", Ph. D. Dissertation presented to The University of Houston, (2002).
198